Click Refresh
2/1/2012 (C) 2012 William Schmidt, Ph.D. www.tigersoft.com
1/30/2012
Question from GS (Berkeley) about what version of Windows XP works best with TigerSoft.
To our knowledge, any version of XP will work. And YES - a used XP lap top or desk top
bought off EBAY or Craig's List should work fine. They are very inexpensive.
We have bought several this way.
Our main computer's specs are:
Windows XP 5.1 Service Pack 3 (2007)
Memory 2 KB
Hewlett Packard AMD Athlorn 64 1.80 Hhz
Get one that reads and writes fast. Our Power-Ranker reads and writes a lot of
files. Fast Processing Speed will help, too, of course. A lot of memory will let you
use TigerSoft and do multi-tasking. A fast cable or wireless connection will save
you time getting data each night and looking at our nightly reports and studies.
Question from GS (Berkeley) about the Stock and Index Data TigerSoft provides....
- You mention that the Tigersoft comes with 3 months of data for 6,000 plus stocks
TigerSoft actually comes with more than 3 years of Free Downloadable Data
on about 6000 stocks, indices, ETFs, commodities... - What would it cost to get one years worth of that data? TigerSoft Data Downloads are
free for the first year with the purchase of the Full TigerSoft Programs (TigerSoft,
Peerless and Power-Ranker). After that it is only $150 a year, though this price
may have to be raised after July 2012. Most users after a year of free data/hotlines/
updates/special studies/special situations will renew all these for $595 per year. - You Mention that the Tigersoft comes with one year of data on 1500 ETF's,
commodities and currencies and stocks.
We provide Data on all major and most minor WTFs, commodities and currencies. This
is downloadable from us each night. - Do we get any choice in those?
You can download as much or as little data as you need. The Stock Data may be downloaded
alphabetically, A-Z stocks or by industry or by index (DJI-30), SP-500, NASDAQ-100)
and by technical categories (new highs, new lows, best performers, high TigerSoft Accumulation,
Low Accumulation, Maximum Professional Buying, Minimal Professional Selling, high priced
stocks, low priced stocks... - Which securities are typically represented in item 2 above?
You can suggest any additions you want, too. Some of the groups change in contents each
night. Other, like the industry and index groups do not change. - Do you provide historical data that I can back test the system with?
Stock data back to 2009 on 5000-6000 stocks, indexes, ETFs, commodities are provided to
all TigerSoftl users. We provide back-data to 1966 for graphing and testing the Peerless system
of Buy and Sell signals on the DJI.
- You mention that if I wanted an historical data DVD from I believe TeleChart?
Are there also other providers of historical data?
TC-2000 provides data that can be converted into an Ascii format. We have an ascii converter that
will take a group of up to 1000 stocks with 1 year of data into Tiger format. Any source of Ascii Stock
Data will probably work. Send us a sample and we will show you how to do it. The Tiger Converter
is pretty simple to operate. We provide detailed instructions on using it..
I would add that Data from us requires no conversion. Doing a conversion each night from TC-2000
to Ascii and then from Ascii to Tiger is tedious.
The data for Peerless includes daily advances and declines, for example. I am not aware of any
automatic download of this except us. - That I could get stock market data on thousands of stocks going back decades.
- Do you have that same data that you provide that could be sent to me and how much would it cost?
- How much does the third party (Telechart??) historical data cost and what are the
likely circumstances that I would need it?
Pricing of alternative Ascii Data sources you will have to do. Just remember, if the Data is in
Ascii format, we can probably convert it to Tiger format. If you want to do the conversion yourself,
our format is open unlike TC-2000. So it's pretty easy to write a program to put ascii data in our format.
Dial Data is about $50/month. The Data feed from them must be setup initially as a "TI Ascii 13
account". Ask us about this. This is recommended as the simplest alternative source of data
that is compatible with our TigerSoft and Peerless formats. Only they have the necessary
Peerless data ready for automatic download. We do edit their data for Peerless once a
week using Barron's. This was the original source for Peerless data.
Canadian Stock data are only partly available. If Dial Data has it, we can get it. Tell us what
you want. We will try to get it. We provide about 150 Chinese and 150 FTSE/British stocks
in separate download. These can then be ranked and flagged by the Power-Ranker. Similarly,
a popular download is the Foreign ETFs. This shows which countries' markets are strongest and
weakest, though they all tend to rise and fall with the DJI-30.
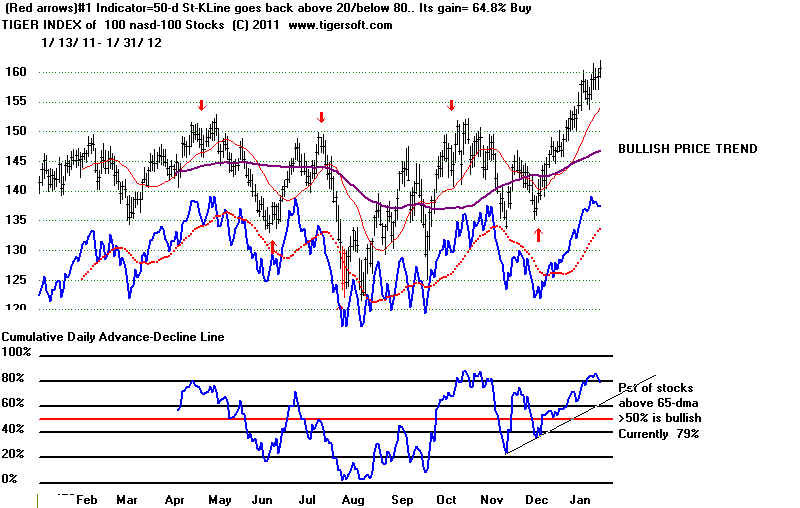
The Tiger Software lets you build Tiger indexes for any group of stocks you want, with our
separate downloads like COMPUTER STOCKS, CHINESE STOCKS, LOW_PRICED STOCKS
or any group of stocks you wish to build for your own purposes. The Tiger Index charts
show automatic Buys and Sells as well as internal strength indicators, composite A/D Line
and the percentage of stocks above or below their 65-day ma.
Below is our Tiger Index chart of the NASDAQ-100 Stocks. The buys and sells work
well on it as a group. So does watching its A/D Line trend.
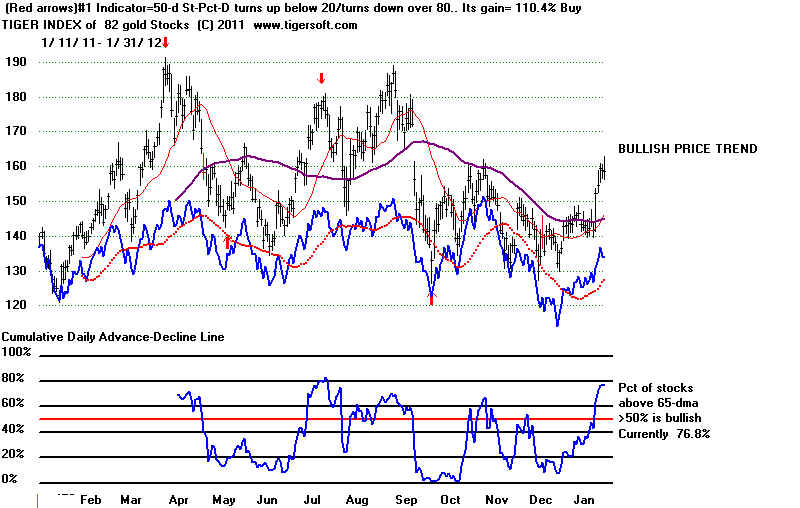
Below is our Tiger Composite Index of 82 Gold and Silver stocks.
Question from Chris (San Diego) about using Peerless Stock Market Timing to trade SPY.
See below or www.tigersoft.com/Questions_and_Answers/May-3-2010/index.html
--- Contact us. If we have time, we'll try to help you here. ---
Join our email list. Latest Q & Answers Earlier Questions and Answers
Be sure to read about our Peerless Stock Market Timing: 1916-2012
and how to legally beat insiders at their own game with TigerSoft
----------------------------------------------------------------------------------------------------------------------------

www.tigersoft.com PO Box 9491 San Diego, CA 92169 858-273-5900
william_schmidt@hotmail.com Welcome Preview Insider Trading About Us.
Personalized Service for Everyone. Testimonials Predictions Free Research BLOG
TigerSoft is easy to run... We provide An Hour's "Walk Through" to all new users of TigerSoft. ------------------------------------------------------------------------------------------------------------------------------
5/3/2010 Inquiry Question from Chris is San Diego
www.tigersoft.com/Questions_and_Answers/May-3-2010/index.html
Using TigerSoft's Peerless Buys and Sells plus our Accumulation Index and
Closing Power will help you see when the trends change. Also, here are our
two favorite stocks.
4/3/2010 Inquiry
"I’d like to find out when you give signals and what track
your track record is regarding long/short programs
with draw downs regarding S&P 500 &QQQQ."
Reply : Peerless Signals on SPY 1993-2010
" 4/7/2010 Fully Automatic Peerless Signals on SPY: 1993-2010 (Work in Progress)
"This is very important to show. Peerless gives great automatic intermediate-term
Buys and Sells on anything, by superimposing its signals from the DJI on the
charts you pick. Since the SP-500 and the DJIA are so closely related, the
Peerless Signals work very well. Go here for the report, which will be finished
in a few days, All but a few are the same as those we got real-time. The exceptions
are mostly minor, By going back to 1915, and studying past parallels we do keep learning
new things. So, the program was just changed to reflect new back-testing going
back much further than was available to us back in 1999. The signals are shown
below. The gains are shown for SPY using the next days' openings after a
reversing Peerless Buy or Sell. These closed out a Long or Short position
and then took a Short or Long position, respectively. Using the Openings
is much more realistic. We also assume a commission of .2% for each Buy
and .2% for each SELL and we start with $10,000.
As, they say, past returns are not a perfect guarantee of success in the future.
But how else is the value of a trading system to be judged at any point in time?
Our real-time experience shows that all our back-testing is immensely valuable,
far more than what we charge.
Take as an example, the second trade. On 2/3/1994 Peerless reversed to a Sell,
based in its signals on the DJIA. Here this meant closing out the long position
taken on 2/1/1993 in SPY and also taking a new short position in it at the next day's
opening. The long position that was closed out achieved a gain of 8.2%.
We see this in the table just below. In the second table, we note that the original
$10,000 grew because of this trade to $10,798. This is less than an 8.2%
increase because we allow .2% for commissions and slippage.
The rate of return is great. If we took $10,000 and it grew by 26% each year,
it would effectively double every 3 years. Peerless has done better than that.
The annualized rate of growth for the 18 years from 1993 to 2010 is more than 30%.
The formula is 10000 X (1.30 ^ 18) where the multiplier 1.30 is raised to the 18th
power.
|
PEERLESS REVERSING SIGNALS and SPY (ETF for SP-500) TRADES Use SPY's OPENING THE DAT AFTER THE PEERLESS SIGNAL 1993-2010: DJI, SPY-OPENINGS' NEXT DAY, GAINS, Maximum PAPER LOSS 77 Trades - 67 Were Profitable. Biggest Loss = 6.8%. Biggest Paper Loss = 12.6%. 8 Cases of Paper Losses over 6%. 53 of 77 Cases Had A Biggest Paper Loss was under 3% Average Annualized Return = >+30% $10,000 Grew to more than 1,477,180. Trades Dates Buy(B) DJI Close SPY at Gain Maximum
Sell(S) next day's (Loss) Paper
opening Loss
----------------------------------------------------------------------------------
1993
1 19930201 B18 3332.18 44.4 .082 .023
1994
2 19940203 S4 3967.66 48.06 .066 0
3 19940405 B19 3675.41 44.88 .063 .019
4 19940830 S2 3917.3 47.7 .043 0
5 19941007 B1 3797.43 45.66 .027 .005
6 19941017 S9 3923.93 46.91 .031 .016
7 19941125 B1 3708.27 45.45 .437 .013
1995 - no trades
1996
8 19960227 S1 5549.21 65.31 .033 0
9 19960410 B9 5485.98 63.16 .06 .003
10 19960529 S1 5673.83 66.94 .035 .018
11 19960711 B2 5520.54 64.62 .025 .031
12 19960809 S2 5681.31 66.25 (-.036 ) .036
13 19960913 B10 5838.52 68.66 .131 .001
1997
14 19970422 S9 6833.59 77.66 (-.068 ) .068
15 19970509 B4 7169.53 82.94 .141 .004
16 19970918 S12 7922.72 94.66 .023 .037
17 19971028 B1 7498.32 92.5 .045 .003
18 19971120 S17 7826.61 96.62 (-.003 ) .024
19 19971217 B13 7957.41 96.94 .164 .038
1998
20 19980421 S15 9184.94 112.87 .124 .05
21 19981001 B9 7632.53 98.87 .36 .024
1999
22 19990618 S12 10855.55 134.47 .028 .055
23 19991004 B1 10401.23 130.72 .119 .047
24 19991228 S9 11476.71 146.31 .026 .004
2000
25 20000204 B17 10963.8 142.56 .063 .069
26 20000406 S1 11114.27 151.56 .073 0
27 20000417 B2 10582.51 140.56 .072 .002
28 20000717 S12 10804.27 150.63 .04 .011
29 20001002 B2 10700.13 144.53 (-.049 ) .094
30 20001208 S12 10712.91 137.38 .158 .009
2001
31 20010323 B17 9504.78 115.7 .027 .048
32 20010410 S12 10102.74 118.78 (-.046 ) .046
33 20010418 B13 10615.83 124.25 .039 .002
34 20010517 S4 11248.58 129.09 .222 .019
35 20010919 B16 8759.13 100.4 .085 .032
36 20011010 S9 9240.86 108.95 .005 .013
37 20011101 B9 9263.9 108.44 .032 0
2002
38 20020226 S9 10115.26 111.96 .247 .047
39 20020724 B19 8191.29 84.27 .069 0
40 20020808 S12 8712.02 90.1 .017 .073
41 20020903 B17 8308.05 88.61 .048 .135
2003
42 20030106 S12 8773.57 92.9 .045 .005
43 20030122 B9 8318.73 88.75 .179 .102
44 20031015 S4 9803.05 104.68 (-.013 ) .013
45 20031103 B18 9858.46 105.99 .094 0
2004
46 20040211 S15 10737.7 115.97 .047 .002
47 20040518 B2 9968.51 110.5 .096 0
48 20041228 S8 10854.54 121.08 .044 .014
2005
49 20050421 B19 10218.6 115.74 .144 .013
2006
50 20060508 S9 11584.54 132.42 .054 .002
51 20060615 B14 11015.19 125.29 .017 .013
52 20060630 S12 11150.22 127.43 .026 .003
53 20060718 B9 10799.23 124.18 .134 0
2007
54 20070105 S9 12398.01 140.82 .021 .037
55 20070302 B17 12114.1 137.93 .118 0
56 20070717 S9 13971.55 154.23 .057 .005
57 20070829 B14 13289.29 145.45 .068 0
58 20071005 S4 14066.01 155.39 .057 .007
59 20071114 B1 13223 146.57 .033 .04
60 20071206 S12 13619.89 151.42 .143 .004
2008
61 20080307 B8 11899.69 129.84 .039 .014
62 20080324 S9 12548.64 134.86 .131 .061
63 20080915 B8 10917.51 117.2 .031 .005
64 20080922 S6 11015.69 120.85 .175 0
65 20081008 B1 9258.1 99.66 (-.065 ) .126
66 20081021 S6 9033.66 93.2 (-.006 ) 0
67 20081028 B19 9065.12 93.77 .007 0
68 20081105 S12 9139.27 94.46 .133 0
69 20081121 B16 8046.42 81.92 .037 0
2009
70 20090129 S6 8149.01 84.98 .141 .024
71 20090310 B4 6926.49 73 .093 0
72 20090327 S5 7776.18 79.8 (-.044 ) .056
73 20090403 B12 8017.59 83.34 .146 .021
74 20090609 S8 8763.06 95.48 .056 0
75 20090623 B5 8322.91 90.16 .2 .025
76 20091021 S12 9949.36 108.19 (-.019 ) .034
77 20091217 B13 10308.26 110.2 .085 .041
2010
78 20100409 open 10997.35 119.55
------------------------------------------------------------------------------------
|
| WHAT HAPPENS TO $10,000 INVESTED IN SPY AT OPENING THE DAYS AFTER A REVERSING PEERLESS BUY OR SELL Average Annualized Return = >+30% $10,000 Grew to more than 1,477,180. Trades Dates Buy(B) SPY at Gain Investment
Sell(S) next day's (Loss) $10000 (Assumed $20
opening commission per trade
and all trades entered
at next day's opening.
---------------------------------------------------------------------------------
1993
1 19930201 B18 44.4 .082 10000
1994
2 19940203 S4 48.06 .066 10798.
3 19940405 B19 44.88 .063 11488.
4 19940830 S2 47.7 .043 12187.
5 19941007 B1 45.66 .027 12686.
6 19941017 S9 46.91 .031 13002.
7 19941125 B1 45.45 .437 13379.
1995 no trades
1996
8 19960227 S1 65.31 .033 19187.
9 19960410 B9 63.16 .06 19780.
10 19960529 S1 66.94 .035 20925.
11 19960711 B2 64.62 .025 21614.
12 19960809 S2 66.25 (-.036 ) 22110.
13 19960913 B10 68.66 .131 21272.
1997
14 19970422 S9 77.66 (-.068 ) 24010.
15 19970509 B4 82.94 .141 22333.
16 19970918 S12 94.66 .023 25431.
17 19971028 B1 92.5 .045 25964.
18 19971120 S17 96.62 (-.003 ) 27078.
19 19971217 B13 96.94 .164 26942.
1998
20 19980421 S15 112.87 .124 31298.
21 19981001 B9 98.87 .36 35109.
1999
22 19990618 S12 134.47 .028 47653.
23 19991004 B1 130.72 .119 48888.
24 19991228 S9 146.31 .026 54597.
2000
25 20000204 B17 142.56 .063 55905.
26 20000406 S1 151.56 .073 59308.
27 20000417 B2 140.56 .072 63510.
28 20000717 S12 150.63 .04 67947.
29 20001002 B2 144.53 ( -.049 ) 70523.
30 20001208 S12 137.38 .158 66933.
2001
31 20010323 B17 115.7 .027 77354.
32 20010410 S12 118.78 ( -.046 ) 79283.
33 20010418 B13 124.25 .039 75485.
34 20010517 S4 129.09 .222 78272.
35 20010919 B16 100.4 .085 95457.
36 20011010 S9 108.95 .005 103364.
37 20011101 B9 108.44 .032 103673.
2002
38 20020226 S9 111.96 .247 106777.
39 20020724 B19 84.27 .069 132884.
40 20020808 S12 90.1 .017 141769.
41 20020903 B17 88.61 .048 143891.
2003
42 20030106 S12 92.9 .045 150496.
43 20030122 B9 88.75 .179 156954.
44 20031015 S4 104.68 (-.013 ) 184679.
45 20031103 B18 105.99 .094 181913.
2004
46 20040211 S15 115.97 .047 198615.
47 20040518 B2 110.5 .096 207536.
48 20041228 S8 121.08 .044 227002.
2005
49 20050421 B19 115.74 .144 236516.
2006
50 20060508 S9 132.42 .054 270034.
51 20060615 B14 125.29 .017 284046.
52 20060630 S12 127.43 .026 288297.
53 20060718 B9 124.18 .134 295201.
2007
54 20070105 S9 140.82 .021 334089.
55 20070302 B17 137.93 .118 340423.
56 20070717 S9 154.23 .057 379831.
57 20070829 B14 145.45 .068 400679.
58 20071005 S4 155.39 .057 427069.
59 20071114 B1 146.57 .033 450509.
60 20071206 S12 151.42 .143 464445.
2008
61 20080307 B8 129.84 .039 529799.
62 20080324 S9 134.86 .131 549360.
63 20080915 B8 117.2 .031 620084.
64 20080922 S6 120.85 .175 638028.
65 20081008 B1 99.66 (-.065 ) 748183.
66 20081021 S6 93.2 (-.006 ) 698152.
67 20081028 B19 93.77 .007 692575.
68 20081105 S12 94.46 .133 696028.
69 20081121 B16 81.92 .037 787023.
2009
70 20090129 S6 84.98 .141 814511.
71 20090310 B4 73 .093 927498.
72 20090327 S5 79.8 (-.044 ) 1011728.
73 20090403 B12 83.34 .146 965277.
74 20090609 S8 95.48 .056 1103995.
75 20090623 B5 90.16 .2 1163488.
76 20091021 S12 108.19 (-.019 ) 1393393.
77 20091217 B13 110.2 .085 1364184.
2010
78 20100409 open 119.55 ---- 1,477,180.
=====================================================================
|
ALL Peerless Buys and Sells on DJIA and SP-500: 1993-2010
Date Peerless DJIA SPY
B=Buy S=Sell Close Opening Next Day
----------------------------------------------------------------------------------------------------------------
19930114      B15            3267.88      not yet traded
19930201      B18            3332.18      44.81   44.4   gain 3.66/44.4
19930302      B15            3400.53      44.93   45.0
19930323      B18            3461.86      44.87   44.81
19930326      B15            3439.98      44.9    44.93
19930526      B10            3540.16      45.59   45.65
19930826      B18            3648.17      46.28   46.15
19930901      B15            3645.1       46.50   46.53
19930922      B17            3547.02      45.65   45.78
19931217      B13            3751.57      46.56   46.53

19940203      S4             3967.66      48.06   48.06 gain 3.18/48.06
19940405      B19            3675.41      44.81   44.88 gain 2.82/44.88
19940830      S2             3917.3       47.78   47.70 gain 2.04/47.70
19941007      B1             3797.43      45.45   45.66 gain 1.25/45.66
19941017      S9             3923.93      46.95   46.91 gain 1.42/45.66
19941018      S9             3917.54      46.84   46.67
19941019      S9             3936.04      47.06   47.06
19941122      S10            3677.99      45.00   45.03
19941125      B1             3708.27      45.47   45.45 gain 9.86/45.66
19941201      B6             3700.87      45.14   45.05
19941208      B6             3685.73      44.87   44.88

19950303      B18            3989.61      48.78   48.45
19950403      B15            4168.41      50.23   50.25
19950525      B18            4412.23      53.17   52.97
19950801      B18            4700.37      56.06   56.39
19950914      B10            4801.8       58.77   58.41
19950922      B15            4764.15      58.31   58.38
19951130      B4             5074.49      60.91   60.98
19951218      B13            5075.21      60.63   60.66
19960207 B15 5492.12 65.14 65.05 19960208 B4 5539.45 65.84 65.81 19960215 B18 5551.37 65.20 65.08 19960227 S1 5549.21 64.80 65.31 gain 2.15/65.31 19960410 B9 5485.98 63.00 63.16 gain 3.09/63.16 19960411 B2 5487.07 62.92 63.36 19960507 B9 5420.95 63.98 63.67 19960508 B2 5474.06 64.78 64.56 19960529 S1 5673.83 67.03 66.94 19960711 B2 5520.54 64.52 64.62 19960716 B2 5358.76 62.81 63.75 19960717 B17 5376.88 63.56 63.75 19960717 B2 5376.88 63.56 63.75 19960724 B2 5354.69 62.81 63.44 19960809 S2 5681.31 66.22 66.25 loss 2.61/66.25 19960812 S2 5704.98 66.70 66.58 19960913 B10 5838.52 68.56 68.66 gain 9.00/68.66 19961009 B18 5930.62 69.59 69.59 19961120 B4 6430.02 74.79 74.59 19961212 B17 6303.71 73.12 73.06 19961217 B13 6308.71 73.12 73.37 19970122 B4 6850.03 78.84 19970221 B15 6931.62 80.37 19970307 B18 7000.89 80.84 19970401 B17 6611.05 75.85 19970422 S9 6833.59 77.73 77.66 loss /77.73 19970423 S9 6812.72 77.81 19970424 S9 6792.25 77.42 19970428 S9 6783.02 77.28 19970509 B4 7169.53 82.62 82.94 gain /82.62 19970617 B4 7760.78 89.62 19970801 B18 8194.04 94.93 19970911 B9 7660.98 91.18 19970918 S12 7922.72 95.22 94.66 19970929 S12 7991.43 95.37 19971007 S12 8178.31 98.18 19971028 B1 7498.32 92.21 92.50 19971028 B17 7498.32 92.21 19971028 B19 7498.32 92.21 19971120 S17 7826.61 96.09 96.62 19971217 B13 7957.41 96.81 96.94 19971219 B9 7756.29 94.78 19971224 B9 7660.13 93.40 19980210 B4 8295.61 102.25 19980317 B18 8749.99 108.56 19980326 B15 8846.89 110.89 19980327 B15 8796.08 109.62 19980421 S15 9184.94 112.78 112.87 19980707 S12 9085.04 115.78 19980708 S9 9174.97 116.62 19980804 S10 8487.31 107.00 19980923 S9 8154.41 107.00 19980925 S9 8028.76 104.25 19980928 S9 8108.83 105.18 19980929 S9 8080.51 104.93 19981001 B9 7632.53 98.81 98.87 19981210 B6 8841.57 116.89 116.44 19981211 B6 8821.76 117.12 116.16 19981214 B6 8695.6 113.75 114.69 19981214 B17 8695.6 113.75 114.69 19981215 B6 8823.3 116.68 117.12 19981216 B6 8790.6 116.53 117.22 19981217 B13 8875.82 118.39 118.31 19990524 B9 10654.67 131.12 19990527 B17 10466.92 128.56 19990618 S12 10855.55 134.31 134.47 19990817 S12 11117.07 134.62 19990823 S2 11299.76 136.46 19991004 B1 10401.23 130.75 130.72 19991018 B17 10116.28 125.78 19991228 S9 11476.71 146.18 146.31 20000107 S15 11522.56 145.75 20000111 S4 11511.08 144.50 20000204 B17 10963.8 142.59 142.56 20000406 S1 11114.27 150.48 151.56 20000417 B2 10582.51 140.75 140.56 20000424 B2 10906.1 142.25 20000503 B2 10480.13 140.75 20000510 B2 10367.78 138.12 20000522 B2 10542.55 140.06 20000622 B2 10376.12 145.62 20000630 B2 10447.89 145.28 20000717 S12 10804.27 151.00 150.63 20000719 S12 10696.08 148.56 20001002 B2 10700.13 143.84 144.53 20001010 B2 10524.4 137.68 20001017 B2 10089.71 134.75 20001113 B9 10517.25 135.56 20001208 S12 10712.91 133.96 137.38 20001228 S8 10868.76 133.71 20010323 B17 9504.78 114.48 115.70 20010410 S12 10102.74 116.65 118.78 20010411 S9 10013.46 116.73 20010412 S9 10126.94 118.85 20010416 S9 10158.56 117.60 20010418 B13 10615.83 124.00 124.25 20010517 S4 11248.58 129.15 129.09 20010706 S10 10252.68 120.71 20010919 B16 8759.13 101.95 100.40 20011010 S9 9240.86 108.32 108.95 20011010 S12 9240.86 108.32 20011011 S9 9410.45 110.00 20011101 B9 9263.9 108.51 108.44 20011217 B13 9891.96 114.30 20011228 B18 10136.99 116.00 20020226 S9 10115.26 111.22 111.96 20020227 S9 10127.58 111.65 20020514 S12 10298.14 110.22 20020517 S9 10353.08 110.90 20020724 B19 8191.29 84.72 84.27 20020808 S12 8712.02 90.85 90.10 20020903 B17 8308.05 88.28 88.61 20020903 B9 8308.05 88.28 20020912 B9 8379.41 89.45 20020918 B9 8172.45 86.95 20021010 B19 7533.95 80.63 20021113 B9 8398.49 89.05 20021209 B9 8473.41 89.50 20021213 B6 8433.71 89.34 20021216 B9 8627.4 91.65 20021217 B13 8535.39 90.85 20021218 B6 8447.35 90.80 20021218 B9 8447.35 90.80 20021219 B6 8364.8 89.16 20021219 B9 8364.8 89.16 20021224 B6 8448.11 89.35 20021231 B6 8341.63 88.23 20030106 S12 8773.57 92.96 92.90 20030122 B9 8318.73 88.17 88.75 20030129 B9 8110.71 86.48 20030310 B8 7568.18 81.32 20030311 B17 7524.06 80.52 20030514 B18 8647.82 94.51 20030604 B10 9038.98 99.16 20031015 S4 9803.05 104.99 104.68 20031103 B18 9858.46 105.99 105.99 20031217 B13 10145.26 108.50 20040102 B18 10409.85 111.23 20040211 S15 10737.70 116.07 115.97 20040220 S9 10619.03 114.88 20040405 S12 10558.37 115.27 20040518 B2 9968.51 109.65 110.50 20040719 B2 10094.06 110.24 20040806 B2 9815.33 106.85 20041014 B9 9894.45 110.64 20041021 B9 9865.76 111.24 20041022 B2 9757.81 109.99 20041116 B18 10487.65 117.88 20041217 B13 10649.92 119.44 20041228 S8 10854.54 121.18 121.08 20050124 S10 10368.61 116.55 20050304 S15 10940.85 122.73 20050421 B19 10218.6 116.01 115.74 20050801 B18 10623.15 123.65 20051014 B1 10287.34 118.67 20051121 B10 10820.28 125.76 20060111 B18 11043.44 129.31 20060119 B14 10880.71 128.31 20060307 B15 10980.69 127.97 20060315 B18 11209.77 130.76 20060508 S9 11584.54 132.36 132.42 20060613 S10 10706.22 122.55 20060615 B14 11015.19 126.12 125.29 20060630 S12 11150.22 127.23 127.43 20060718 B9 10799.23 123.97 124.18 20060818 B10 11381.47 130.69 20060926 B18 11669.39 133.58 20061122 B18 12326.95 140.92 20061218 B13 12441.27 141.95 20070105 S9 12398.01 140.54 140.82 20070302 B17 12114.1 138.67 137.93 20070306 B19 12207.59 139.70 20070420 B10 12961.98 148.62 20070518 B18 13556.53 152.62 20070717 S9 13971.55 154.75 154.23 20070718 S9 13918.22 154.47 20070719 S9 14000.41 155.07 20070723 S9 13943.42 153.97 20070829 B14 13289.29 146.54 145.45 20070918 B14 13739.39 152.46 20071005 S4 14066.01 155.85 155.39 20071114 B1 13223 147.67 146.57 20071206 S12 13619.89 150.94 151.42 20071207 S9 13625.58 150.91 20080307 B8 11899.69 129.71 129.84 20080311 B19 12156.81 132.60 20080318 B14 12392.66 129.63 20080324 S9 12548.64 134.72 134.86 20080325 S9 12532.6 134.85 20080402 S9 12608.92 136.70 20080403 S4 12626.03 137.04 20080404 S9 12609.42 136.89 20080501 S15 13040 141.12 20080723 S9 11632.38 128.17 20080730 S9 11583.69 128.53 20080811 S2 11782.35 130.71 20080915 B8 10917.51 120.09 117.20 20080918 B19 11019.69 120.07 20080922 S6 11015.69 121.31 120.85 20081007 S10 9447.11 100.03 20081008 B1 9258.10 97.51 99.66 20081021 S6 9033.66 95.86 93.20 20081028 B19 9065.12 93.76 93.77 20081105 S12 9139.27 96.19 94.46 20081114 S6 8497.31 86.62 20081120 S5 7552.29 75.45 20081120 S10 7552.29 75.45 20081121 B16 8046.42 79.52 81.92 20081202 B19 8419.09 85.27 20081212 B9 8629.68 88.99 20081217 B13 8824.34 90.99 20081222 B9 8519.69 87.06 20081223 B9 8419.49 86.16 20081229 B9 8483.93 86.91 20090121 B19 8228.10 84.05 20090126 B17 8116.03 83.68 20090129 S6 8149.01 84.55 84.98 20090217 S5 7552.6 79.22 20090302 S10 6763.29 70.60 20090310 B4 6926.49 72.17 73.00 20090327 S5 7776.18 81.61 79.80 20090403 B12 8017.59 84.26 83.34 20090504 B14 8426.74 90.88 20090528 B18 8403.08 90.92 20090609 S8 8763.06 94.65 95.48 20090623 B5 8322.91 89.35 90.16 20090715 B14 8616.21 93.26 20090716 B12 8711.82 93.11 20090803 B10 8286.56 100.44 20090901 B15 9310.6 100.20 20090914 B18 9626.80 105.28 20091002 B9 9487.67 102.49 20091005 B9 9599.75 104.02 20091021 S12 9949.36 108.24 108.19 20091113 S12 10270.47 109.62 20091217 B13 10308.26 110.18 110.20 20100122 B17 10172.98 109.21 20100209 B17 10058.64 107.22 20100409 open 10997.35 119.55
====================================================================
3/27/2010 Inquiry
"We have visited your website http://www.tigersoft.com ,
Your stock trading
technique
is interesting. Can we use this technique for Indian stocks..
Awaiting for your reply. Thank you and Best Regards, A.A.
Reply :
"Yes, indeed. The gains are consistently
very big with Indian ETFs, especially
since 2005.
Here is the article I just wrote about this. I am so
glad to have done
this research. It
should help many readers to inspect Tiger and Peerless
more closely. See
how easy it has been to profit from our software with the
closed end Indian
funds, IIF and IFN.
HUGE PROFITS in INDIAN STOCK MARKET
MADE BY
TIGERSOFT'S
PEERLESS STOCK
MARKET TIMING
for Period -
1998-2010
YEARLY PEERLESS SIGNALS' TRADING GAINS
WITH ETFS INVESTING EXCLUSIVELY IN INDIAN STOCKS.
2005-2006
+66%
+109%
2006
+120%
+170%
2006-2007
+34%
+38%
2007
+67%
+59%
2007-2008|
+146%
+98%
2008
+224%
+124%
2008-2009
+397%
+334%
2009
+113%
+150%
2009-2010
+63%
+89%
See http://www.tigersoftware.com/TigerBlogs/March-27-2010/index.html
And, if you have any ascii data for
Indian stocks that I might use, I will be glad to
use it for
further examples. Our software has unique ways of spotting insider
buying and
selling. Send me what particular stocks you are interested in.
I will be
pleased to help you. After all, this is TIGER Software, and India is
the home of
the beautiful Bengal tiger. My best to you. William
====================================================================
3/25/2010 Mr. S. P. (505-)
>>> Inquiry
Interest1: Trading stocks, options->invest for
income
Interest2:
bbk,ble,cde,dsu,ead,lunmf, nhms,wtny - See
comments below.
NHMS? symbol
Interest3:
tigersoft featured stocks - look at
HPQ, BLM and VOLC
Interests4:
two years to ten years - look at Tiger Tahiti system.
Tiger Predictions for more than a year ahead about a particular stock
are
governed by the consistency of longer term positive (blue)
Accumulation.
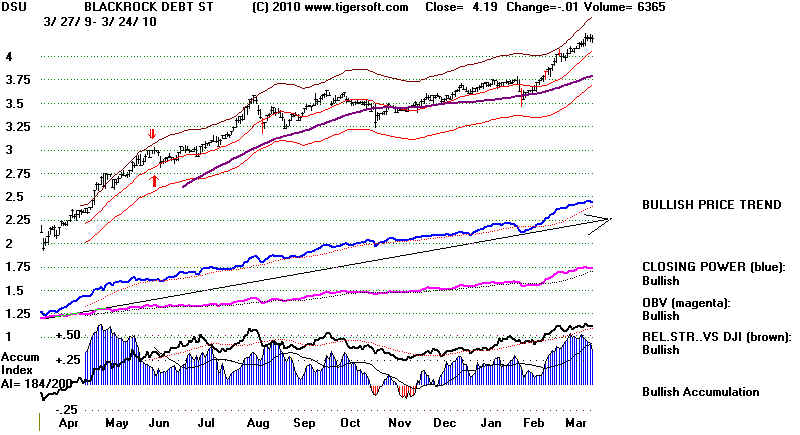
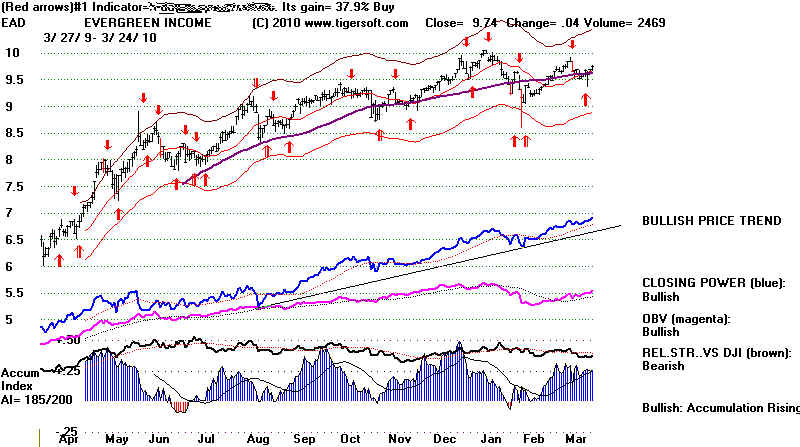
1) DSU - very good choice EAD - excellent. BLE - not so good.
2) BBK - dubious
3) CDE - other gold and silver stocks show more accumulation.
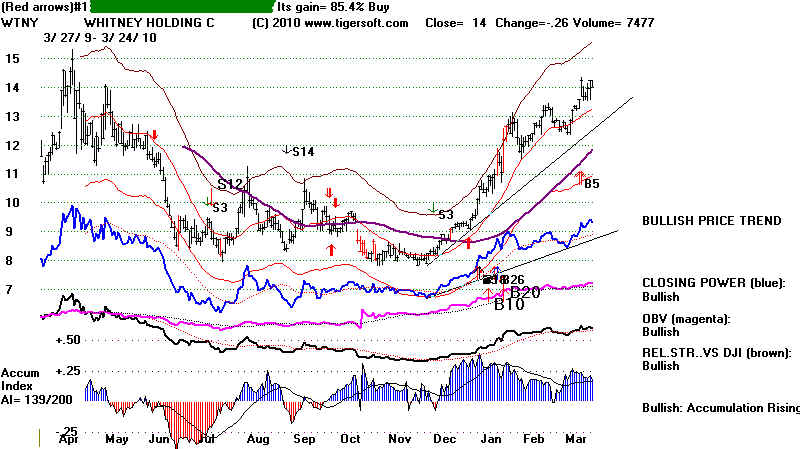
4) WTNY - looks very good. Needs to get past 15, but
that should occur if rally continues, as I think is most
likely. LUNMF - looks fine.
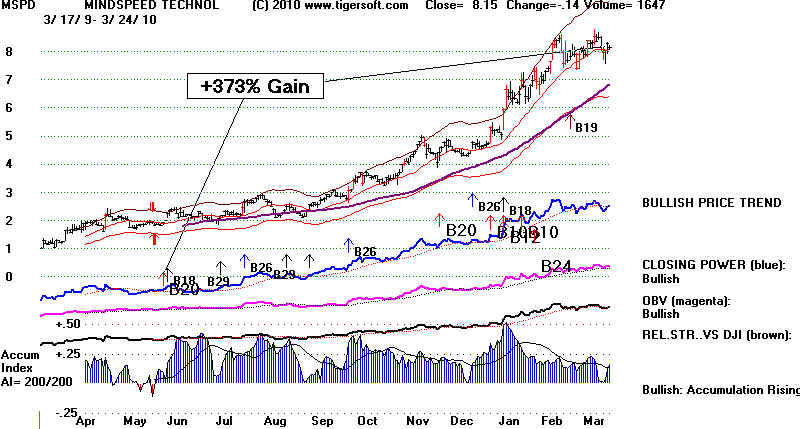
1) You asked about DSU. DSU looks very good from
the
vantage point of steadily positive Blue Accumulation. Presently,
Tiger
Power Ranker shows 101 stocks with even higher levels of
Blue
longer term Accumulation. MSPD, shown next, is such an
example. The trick is to find these stocks early-on. Look elsewhere
on
our web for the methodology we employ and lots of examples....
If
all your stocks showed the same level of Accumulation as DSU and
EAD,
I'd say you were a Tiger user already.
But
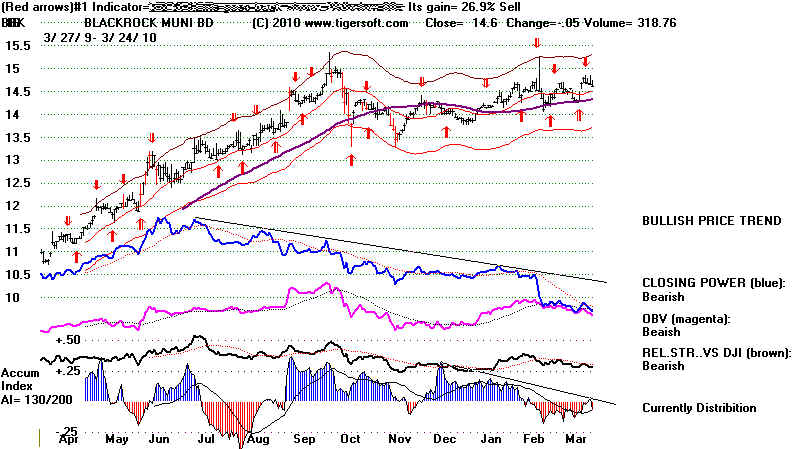
BLE shows no real Accumulation. Cities and states are going
broke. BLE seems risky, by comparison. Check how it covers itself
in
case a state like California drops further in credit ratings.
Interests5: Show us how to make 25% a month
automatically -
Sorry, This rate of return over a sustained period of time -
done
automatically, too - is beyond our reach.
BLE - no real accumulation.
2) BBK looks weak. It has been under-performing and shows
weak
internals. Of course, it could suddenly change its "stripes",
but I
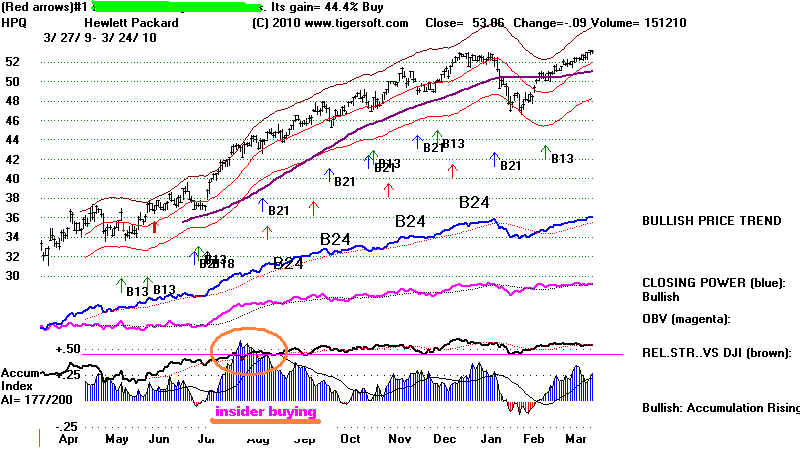
think that would be wishful thinking. Why not buy a stock
that
shows rising Accumulation and is going in the right direction.
Compare it with HPQ?
BBK
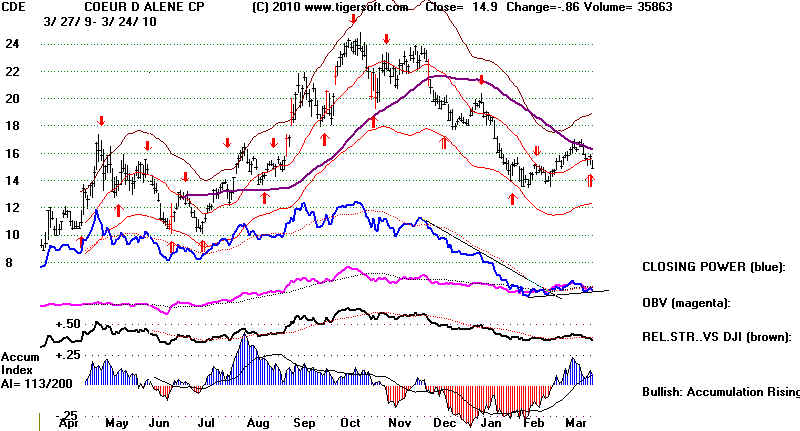
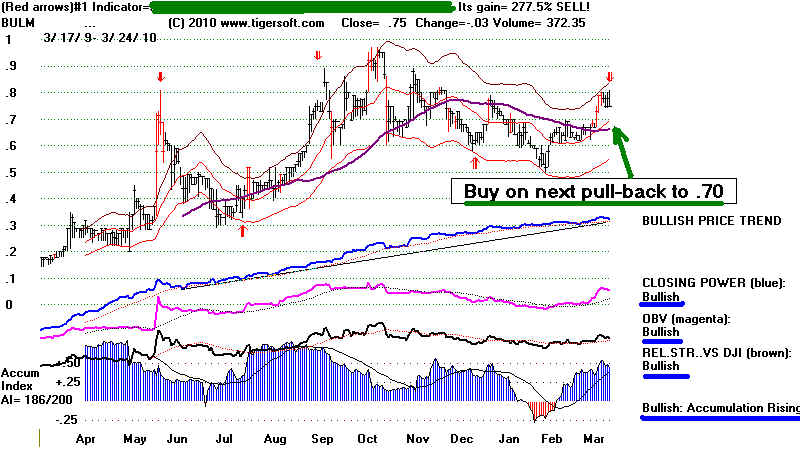
3)
CDE should soon start to do better, once it surpasses
its
declining 65-day ma. It shows a red Buy. There is
some
accumulation on this decline. Instead of CDE,
as a
speculation on gold and silver going up, here is
a
penny stock to put a little money in while you're waiting
for
CDE to get back on an upwards track. I would buy
BULM
at .70.
4)
Other Stocks:
WTNY - looks very good. Needs to get past 15, but
that should occur if rally continues, as I think is most
likely. LUNMF - looks fine.
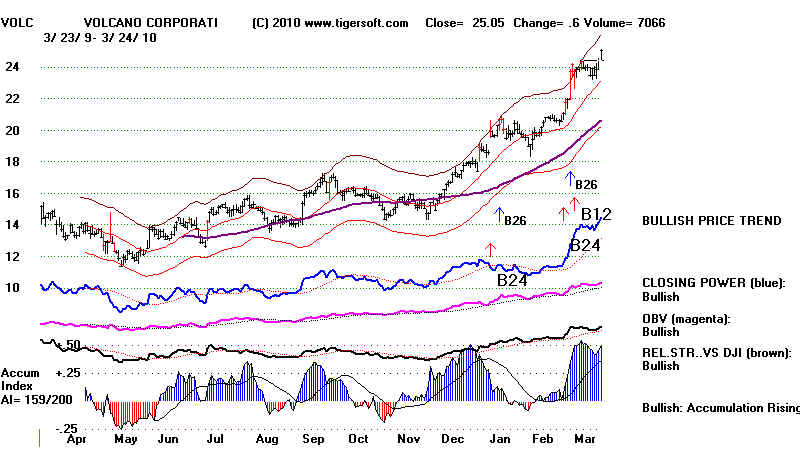
Here's a speculative trade - long, because market is advancing so
robustly. This is a San Diego medical supply company that
the
bank Wells Fargo just bought a lot of shares in with money
it
borrowed from the Fed at 3/4%, instead of making loans to
small
businesses and for new home owners. (Makes you love
the
Fed, doesn't it? Should banks be allowed to speculate
like
this? That's what produced 1929!) VOLV Corporate insiders
are
selling to professionals, in return for sponsorship. That's my
take
on this. It just made an all-time high. That should force shorts
to
cover and produce a move past 30, fairly soon... Due some
due
diligence and see if you agree.
====================================================================
3/18/2010
>>> Inquiry from Mr. S. (California) about Trading SP-500, Hog Futures
and
Citi-Group using Peerless and TigerSoft
What you need from us?
To produce the charts like the ones on
this site, you will need both
Peerless and TigerSoft. An order for both comes with data for 7 months
and our nightly on-Line Hotline for 3 months, so that you earn while
you learn. $495
You could just get TigerSoft for $295 and get data for 3 months.
Data on 6000 stocks nightly thereafter is $150/year.
If you would like to get Buy and Sells on the general market
and stocks we recommend, the Hotline's yearly charge is $298.
 Be
A Tiger. Order Here:
Be
A Tiger. Order Here:
![]()
![]()
TigerSoft
$295 Automatic Signals, Charting of Everything, 3 Mo. data, All TigerSoft Indicators.
TigerSoft and
Peerless Stock Market Timing with 7 mo. Data and 3 mo Hotline $495
Nightly Peerless/TigerSoft
Hotline $298
Nightly Data on 6000 Stocks,
ETFs, commodities and currencies. Includes 140 London Stock Exchange.
Tiger Power Stock Ranker $395
Call us.
Full Package Order $995
Tiger Power-Ranker, All Software. All Books, Software
Updates, Nightly Data, Nightly Hotline,
Stocks; Hotline, Bullish/Bearish Special Situations and Weekend Elite Report
------------------------------ HOW TIGERSOFT WILL HELP YOU: ----------------------------
 First,
gauge the General Market's Safety and Potential.
First,
gauge the General Market's Safety and Potential.
Peerless
Stock Market Timing: 1915-2010 for ETFs and Mutual Funds
1. For
SP-500 - what does Peerless say about
the market?
What is last signal? A Buy or a SELL?
2. Look at how well the Peerless signals have done with
what you are charting.
Superimpose the Peerless signals and use the function that calculates
the gains for the period shown on the chart.
3. Check the ETF for what you are trading:
Check its automatic Buys and Sells AND the trend of the TIger Closing Power/
If you are a short-term trader, trade the trend of the Tiger Professional Buying Power.
4. For the SP-500 or NASDAQ or an industry, use Tiger's
index-creation for
that group
of stocks and watch for trend-breaks of the A/D Line for that group.
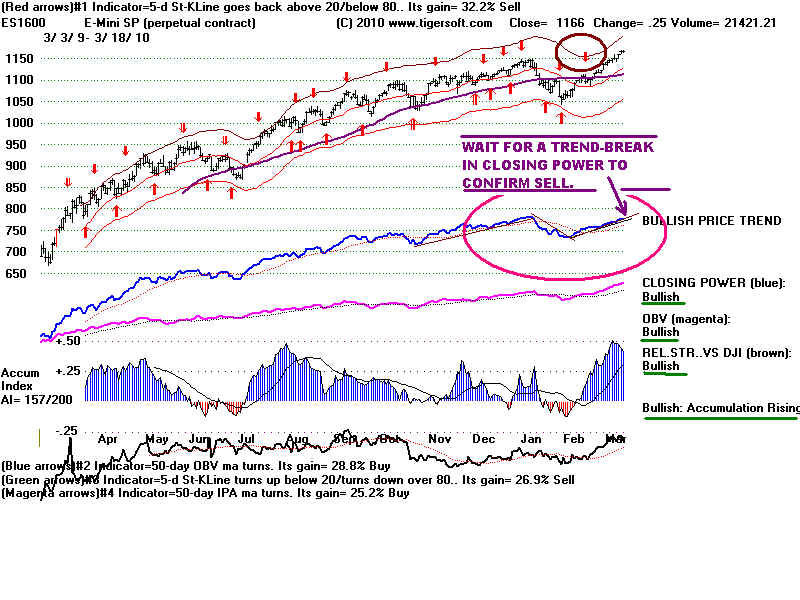
5.
Look at the Perpetual Contract of the
E-Mini-SP-500.
Check its automatic Buys and Sells
AND the trend of the TIger Professional
Buying Power.
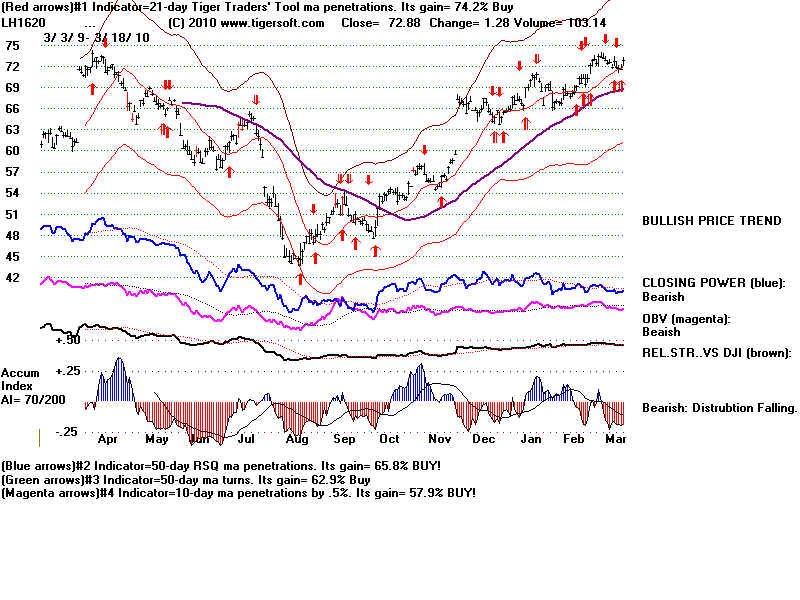
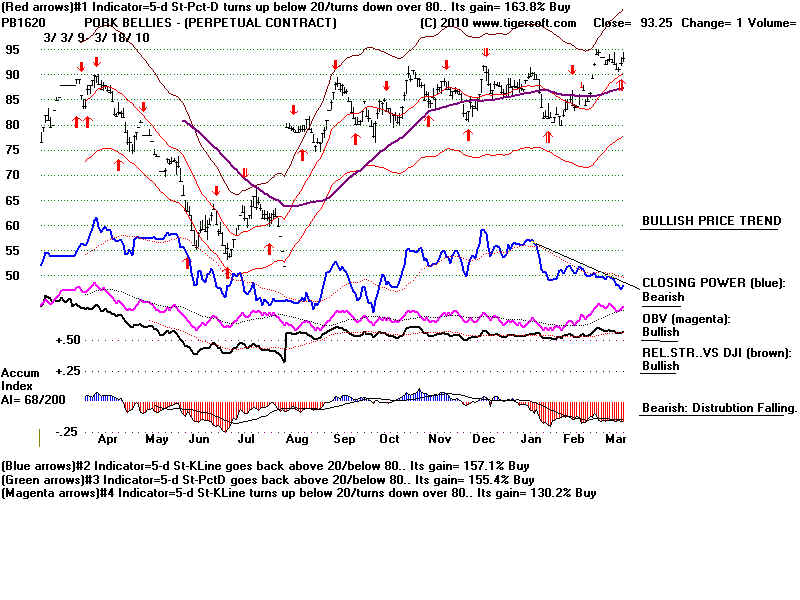
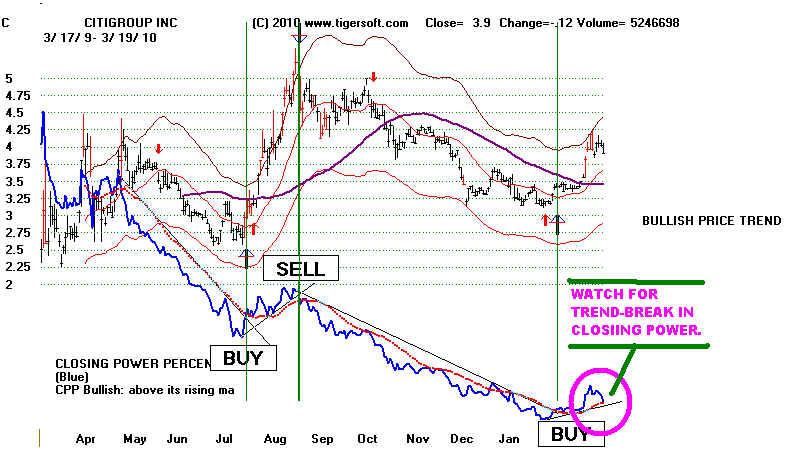
Also shown are charts of Pork Bellies, Citi-Group and two Explosive Super Stocks
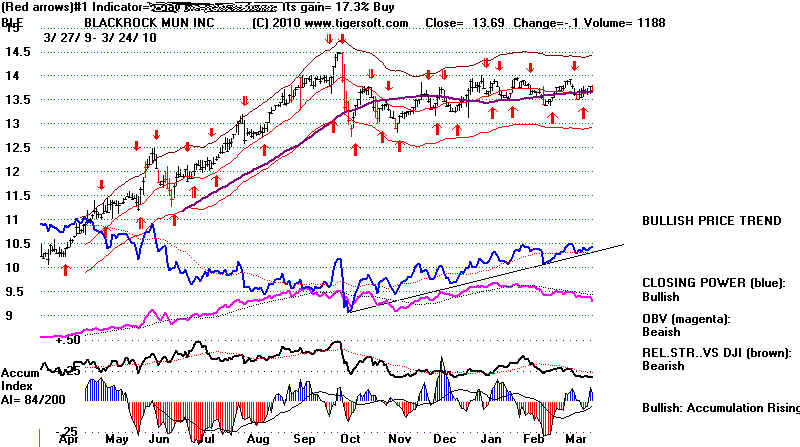
We want to buy stocks showing high Accumulation
and a strong CLosing Power
when red Buys appear. Why buy a stock
that looks much weaker?
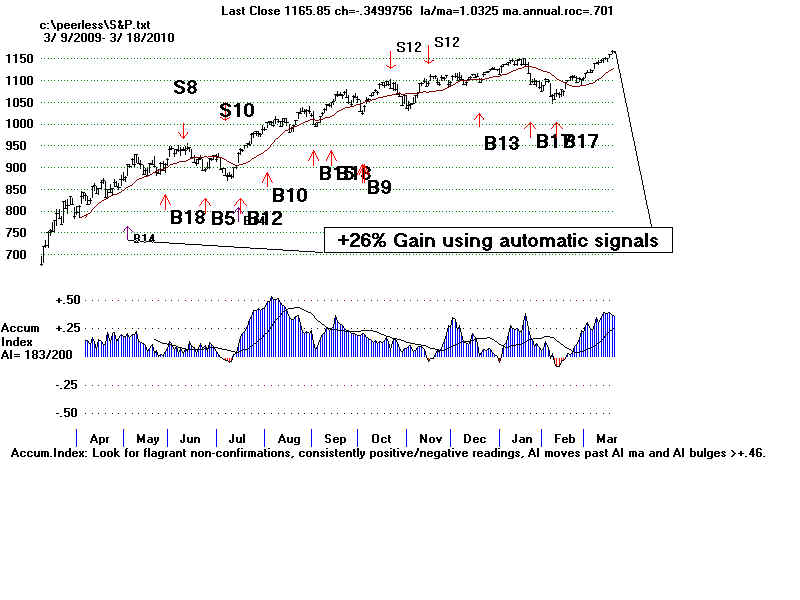
The current Peerless chart shows the DJIA is still on an intermediate-term Buy.
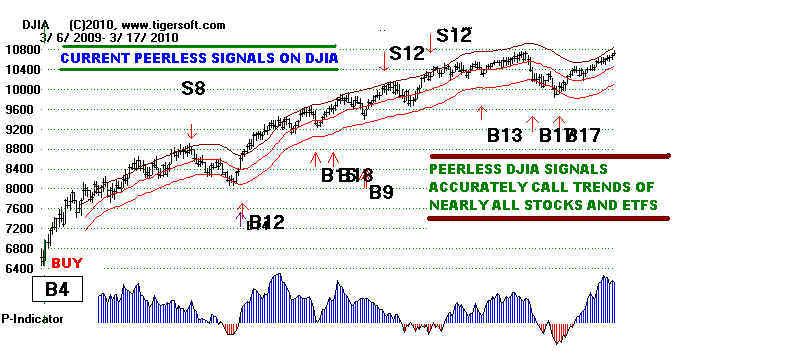
you are charting. Here the gain is +26% Buying and Selling on the reversing
signals, Buy to Sell. The March - April gain is not shown here. Peerless gave
a near perfect Buy signal at the bottom in March.
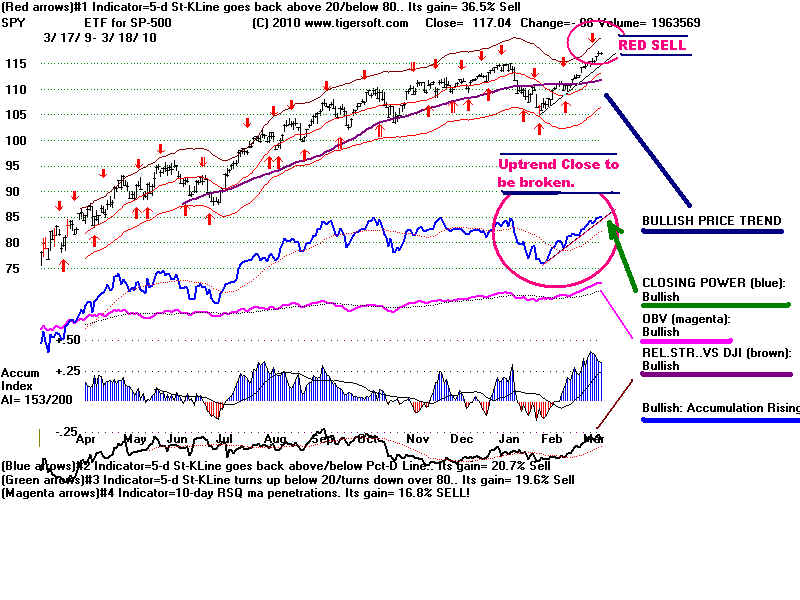
ETF on your screen. It will show you three important things:
1) Red automatic Buys and Sells. ---- The chart now shows a Red Sell.
These signals have gained +36.5% for the past year. They are short-term.
2) Watch very closely the trend of the trend of the BLUE CLOSING POWER.
It is now uptrending. When its trend breaks, it will clinch the red Sell Signal.
SPY should then be sold.
3) The technical conclusions on the right side of the chart show the computer
program's assessment of the intermediate-term trend.
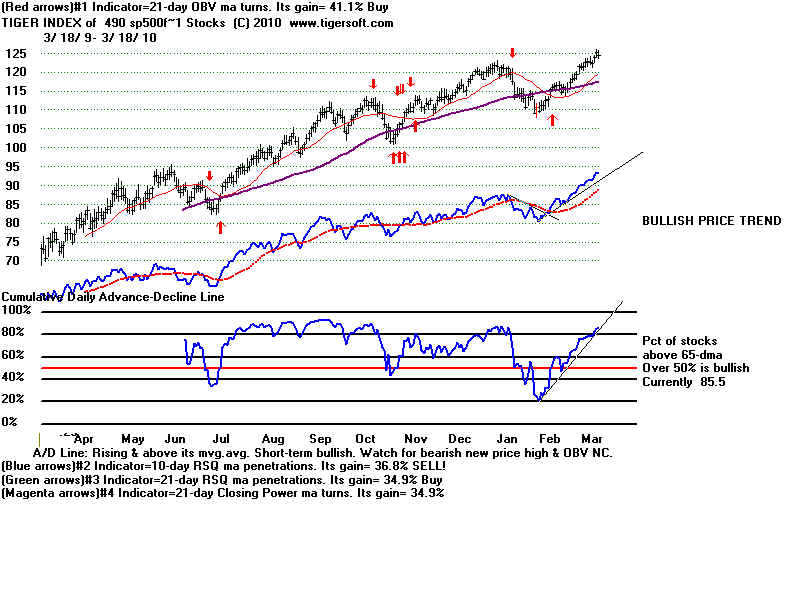
This produces two important trend-clues related to the "breadth" of the
market:
1) the A/D Line of these stocks: Now uptrending
2) the percentage of stocks above their 65-day ma: Now 85.5%
Perpetual contracts aggregate all the futures' volume and
Note it is now on a red Sell but that signal has not been clinched by a break in
the rising CLosing Power Trend. That would be a SELL.
The Red Buys and Sells have gained 32.2% on the Emini-SP-500 this past year.
 BUT WHY
NOT BUY AN EXPLOSIVE
BUT WHY
NOT BUY AN EXPLOSIVE 
)