
Home
Page: www.tigersoft.com (C) 2013 www.tigersoft.com
858-273-5900. william_schmidt@hotmail.com
PEERLESS STOCK MARKET TIMING: 1915-2013
Peerless
- "Market history repeats and repeats. Insiders know these lessons.
Do
you? Peerless studies these patterns that repeat and repeat. It has turned
this
history into an intermediate term trading system of automatic Buys and Sells.
Learn
its rules and make much more money trading..
30% Annualized Rate
of Return since 1993 Trading SPY
Each of the Peerless Buy and Sell rules have worked for over 70 years!
On-Line
Book Order Here: $95
One Year of Peerless/Tiger
HOTLINE $298
Peerless Stock
Market Timing: 1929-2010 $395.
TigerSoft &
Peerless Stock Market Timing: 1929-2010 $495.
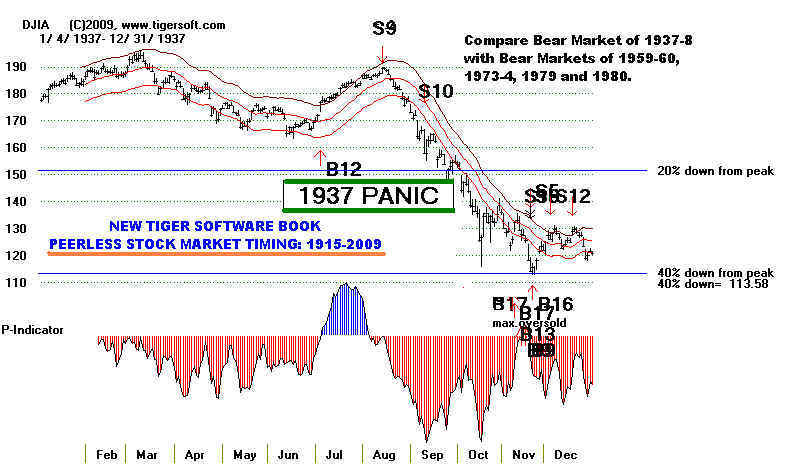
1937 Top and 47% Crash in
7 Months
Peerless Sell S9s and Sell S12s Call
Nearly All Market Tops!

Links to Peerless Studies at tis
site:
Peerless has called every significant top
and bottom since 1981
Peerless Software
Peerless
and Successful Retirement Peerless and Mutual Funds
Peerless and
ETFs DIA, QQQQ, SPY
Peerless
and Foreign ETFs UK Australia India
China France
2006 - Real-Time Peerless Signals
2007 - Real-Time Peerless Signals
2008 - Real-Time Peerless Signals
New Peerless Stock Market Timing: 1915-2009
On-Line Book
Order Here: $95
The Peerless Buys and Sells are automatic.
In our book, they are explained and their track record
is presented in depth. We see how reliable and
strong each is. We see what conditions weaken and
strnegthen them, especially seasonality.
The astute trader
will want more. Accordingly, he/she will also see how Peerless uses the A/D Line and New
Highs and Lows. It is vital to learn
the strengths and also the weaknesses breadth indicators show historically.
Price patterns are also important. But
sometimes they are a trap. Peerless shows when that it most likely
and how to detect their falseness as they are being
made. Read Peerless and learn how to use chart patterns
like Inverted
Head and Shoulders and Wedge
Patterns, by seeing them repeat and repeat over a period of
85 years. See how profitable it is to use Divergence Analysis.
This is where we looking to see if the DJI-30's
new highs and lows are confirmed by an assortment of
key indicators we have created for this purpose
- P-Indicator.
V-Indicator, Accumulation, Closing Power, Synchrocity, IPA and OBVPct. Compare
our
tools wuth those in the public domain: Volume, OBV, Stochastics, Commodity Channel
Index.
We think you will like
our tools even more. Dr. Schmist pioneered Price Bands, Seasonality and Regression
Channels back in the early 1980s.
See how important they are over and over as we spot each year's market tops
and bottoms. We also offer what we
think are the best ways to use Key
Moving Averages to watch the market's
own Momentum.
Uptrends are self-perpetuating past a certain point. So are declines. Get our
book and see
how we identify
the high inflection points.
We think you will be
fascinated by the interplay of sych factors as:
Government Leaks to Wall Street,
Insider Buying, Insider Selling,
Seasonality, the Presidential 4 Year Cycle,
Fed Monetary policies and Fed Chairmen's words,
Unemployment and CPI Data,
Gold and Oil Prices,
Wall Steet Program Computerized Trading,
Sinister Wall Street Bear Raids and Bucket Shops, which are still allowed by the SEC,
Predictible Cycles of Mass Hysteria, Fear and Greed,
Public versus Professional Buying and Selling
War, War, Invasions
Assassinations and Heart Attacks....
These forces are constantly interacting.
Amazingly, throughout the years, the Peerless Buys and Sells seem
almost always to know what's most important, where
stock prices are headed. Thus, you will discover
just what Technical
DATA is most essential. It's so easy to get overwhelmed. Let us show
you what
data you absolutely must have to do a good job of
market timing. .
.
There's a lot to keep in mind. So, we show you
how to employ these factors systematically. And,
most importantly, we show you how to simplify
everything by using the Peerless
Automatic Buy and
Sell Signals. Each major Buy
and Sell signal is discussed in detail. Each signal's Track Record back
to 1928 is given. You will see what
key Technical Variables
produced the signal and which ones to look
at most closely to judge its likely success and
power.
The book will be uniquely helpful. It will show
all the DJIA charts since 1915, the full year and
the two-half year charts. You will learn how to
spot important tops and bottoms using our P-Indicator,
the NYSE A/ D Line, the TigerSoft Accumulation Index,
OBV-PCT and Daily Volume.
It will be an inavaluable reference book. The track
record of each Peerless signal will be given
along with an emphasis on the importance of the
4-year Presidential cycle, the role of politics and
the FED. This will give many more details about
the exact basis of each signal. You will also get
all the unmarked charts since 1915 with the key
indicators. This you will want to print out and
mark up and write your own notes on. Elsewhere,
I have placed key notations on each chart.
Buying and Blindly Holding Is Dangerous.
So is, trusting Wall Street, CEOs of Fed Chairman's To
Warn You in Time or even Tell You The Truth.
Peerless Stock Market Timing:
1915-2009
The First Task for A
Successful Trader:
Determine How Safe The Market Is.
Our Peerless Stock Market
Timing: 1915-2009 Will Tell You When The Market Is Safe
and When It Is Dangerous. Look at Its real-time
track record. As the world markets
become more and more integrated, the Peerless
automatic Buys and Sells have proven
themselves universally. Peerless averages 3
reversals per year. The average gain on
the DJI from Buy to Sell produces an average gain of
17%/year. 91% of Peerless signals
have been profitable. We provide all the data
needed. And if you prefer to simply get the
Buys and Sells with explanations and historical
justification, subscribe to our popular
on-Line Nightly Hotline.
Buys and Sells You Can Count On and Understand.
- Our Famous Warning of June 24, 2007 -
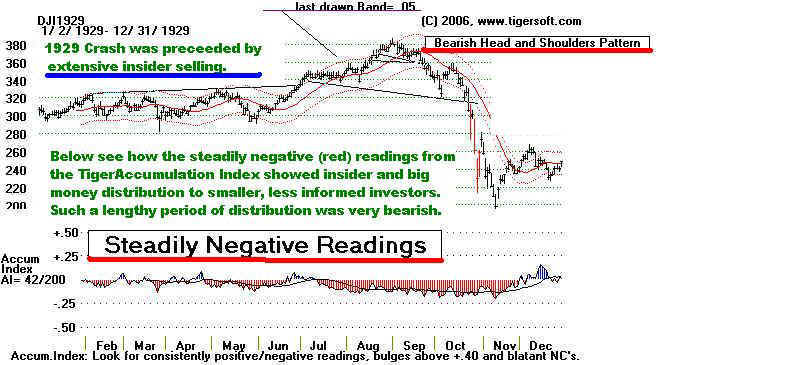
The 1929 Crash: Could It Happen Again? Yes - Absolutely.
The 1937 47% Crash:
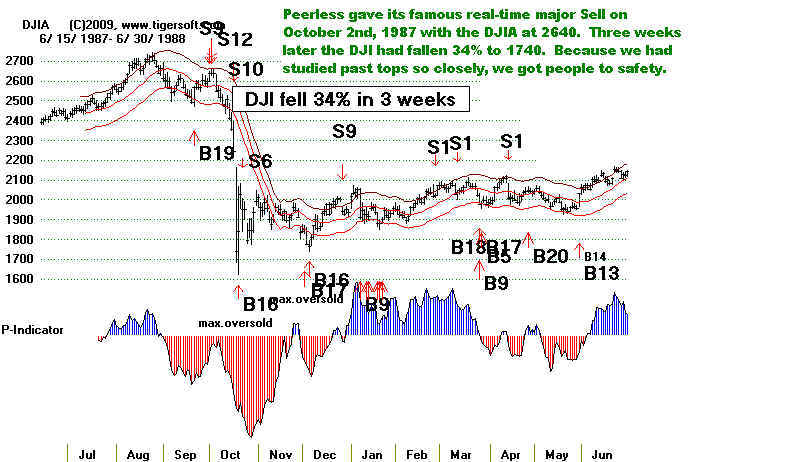
The 1987 Crash:
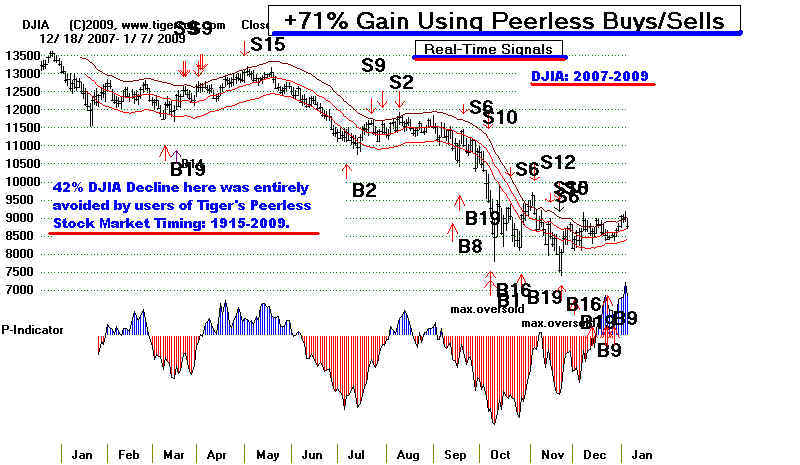
The 2007-2009 Crash:
6/18/2009
Bigger Profits and More Safety
Peerless Gain = +96% April
2008-March 2009
Calling All Tops: 1929, 1937, 1957 1959, 1962, 1966,
1973, 1978, 1979, 1980, 1987, 1990, 1998, 2000 and 2007
Calling All Bottoms: 1933, 1938, 1942, 1949, 1953, 1958, 1961, 1962, 1967, 1970, 1975,
1978,
1980, 1982, 1984, 1988, 1991, 1995, 1998, 2003... (See these in Peerless book....)
LOOK AT THE SUPERB PEERLESS TRADING GAINS from 7/30/2008 to 6/25/2009:
SPY
+132% QQQQ +129% IWM +230.8%
EWU (UK) +158% EWW (Mexico) +288% FXI (China) +221%
EWZ (Brazil) +452% EWO (Emerging Markets) +277%
IBM +114% AAPL +206% NEM +296%
SSRI +5005%!!! (Longs and Shorts)
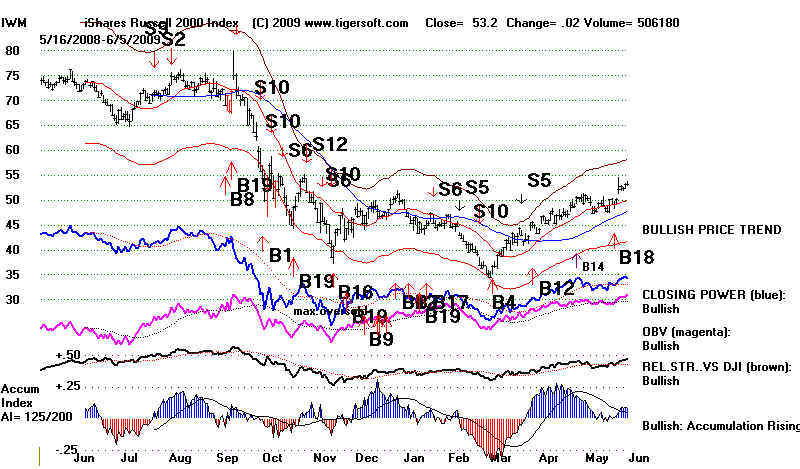
Example: IWM
(Russell-2000) Buying and Selling Gain is shown first, +61.3%
Buying, Selling and Selling Short Gain
is shown second, +198.8%
Buying and Holding Loss from 7/30/2008 to 6/5/2009 = -24.9%