THE BRITISH STOCK MARKET


(C) 2009 www.tigersoft.com
More Materials Will Soon Be Added.
8/19/2009
Our Tiger Software programs have a lot to offer investors who trade British stocks and indices.
We provide the data each night for the FTSE stocks. The same principles used for trading
US stocks work well for trading UK stocks.
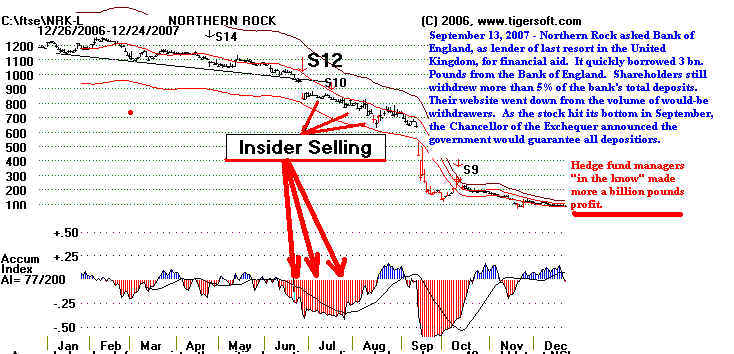
The first thing to realize is that insiders rule the markets in the UK, just as in the US. The
disastrous decline and bankruptcy of Northern Rock shows a price chart that is very
similar to the US banks that went bankrupt. Insider selling is shown in our charts when the
Accumulation Index drops below -.25 and shows significant price weakness relative to
the general market. NRK showed that in spades. And the insiders did know, reports from
the UK show, that the bank might fail.
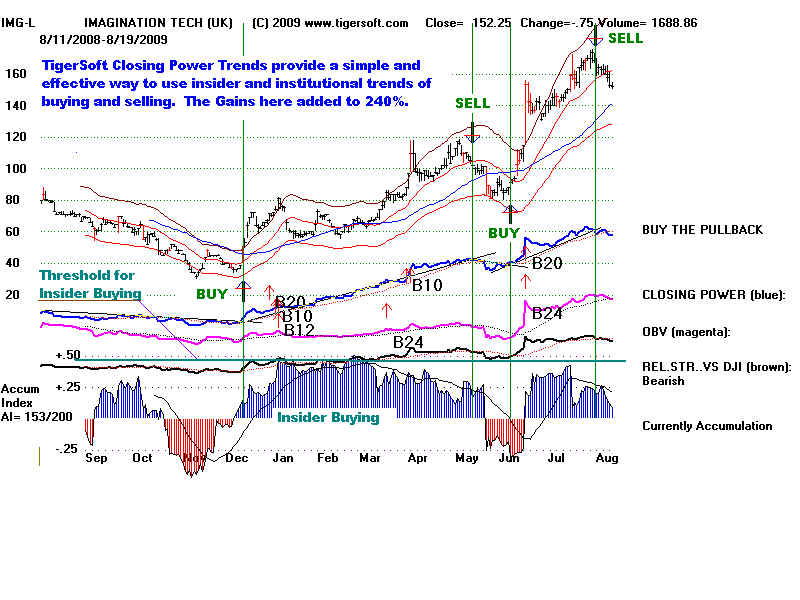
The stock below is a classic bullish chart using TigerSoft. A gain of 240% followed
simply using the trend-changes of the TigerSoft Closing Power. The major Buys
showed this was a potential "explosive super stock". TigerSoft provides the data
for the FTSE stocks each night.
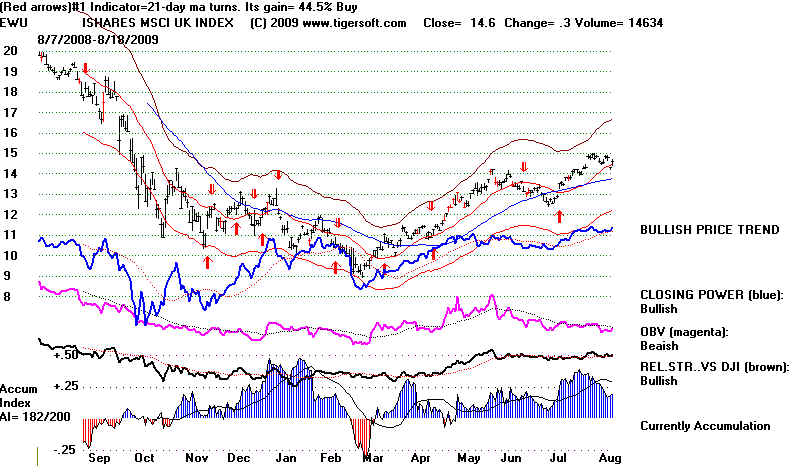
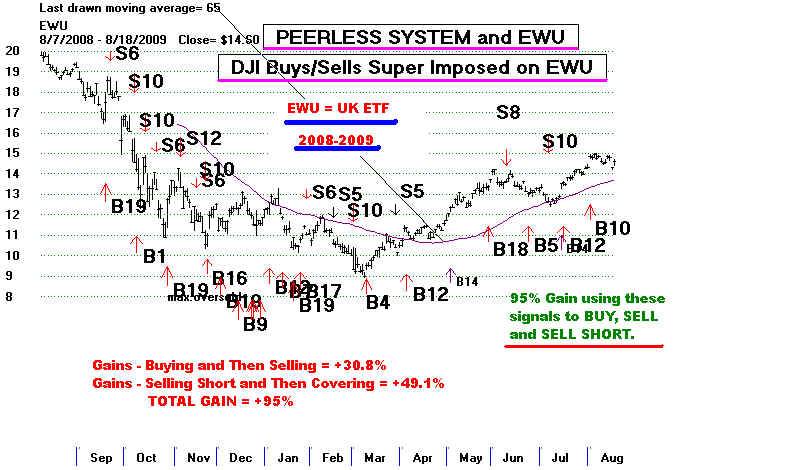
1) The Peerless system of Buys and Sells on the DJI superimpsed on the ETF (EWU) representing
the British stock market gained 95% for the last 10 months, buying, selling and selling short. Here is
the chart of the EWU with the Peerless signals super-imposed.
to EWU profitably.
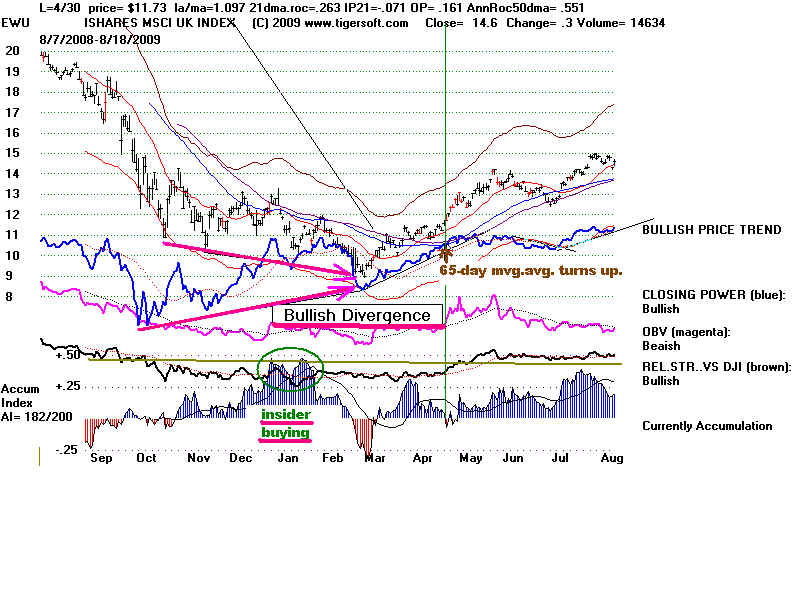
The bottom should have been spotted by:
1) the bulging level of the Accumulation Index early in 2009;
2) then the final low in March, which was widely unconfirmed by the Blue Closing Power.low,
3) The EWU's surpassing to the upside the blue 50-day mvg.avg.
4) The turning up of the 65-day mvg.avg.