Tiger  Software
                                      Since 1981, we have been helping Professionals and the Public
                                around the World to Maximize Stock Profits and Avoid Devastating Declines.
        Tiger Software Charts Make Analysis of Stocks Simple, Easy and Profitable!
                                                                                   6/25/2009  

                                                           Learn How You Can Beat The Pros.                        

                                     (1) Peerless Stock Market Timing
and (2) TIGERSOFT

                        Two Premier and Independent Trading Systems. 

                                                
wpe2B.jpg (1449 bytes)

                           --- LEARN FROM HISTORY  &  INSIDER TRADING! ---

                                        "Those who don't know history  
                                          are destined to repeat it."
  Edmund Burke

                    (1) PEERLESS STOCK MARKET TIMING's
                       SIMPLE & AUTOMATIC BUYS & SELLS

          
       Superbly profitable STOCK TRADING GAINs since September 2008
                           of over 200% were quite common in more speculative stocks.  50% Gains
                           in "safer: blue chip stocks were the norm.   46% of the stocks
                            randomly sampled gained more than 100% in the last 9 months.

                            The way to get gains like this is to use our Peerless Stock Market Timing.
                           Appreciate that using Peerless to Buy and Sell beat Buying and Holding in all
                            the 50 cases we randomly sampled for this page.
Gains of more than
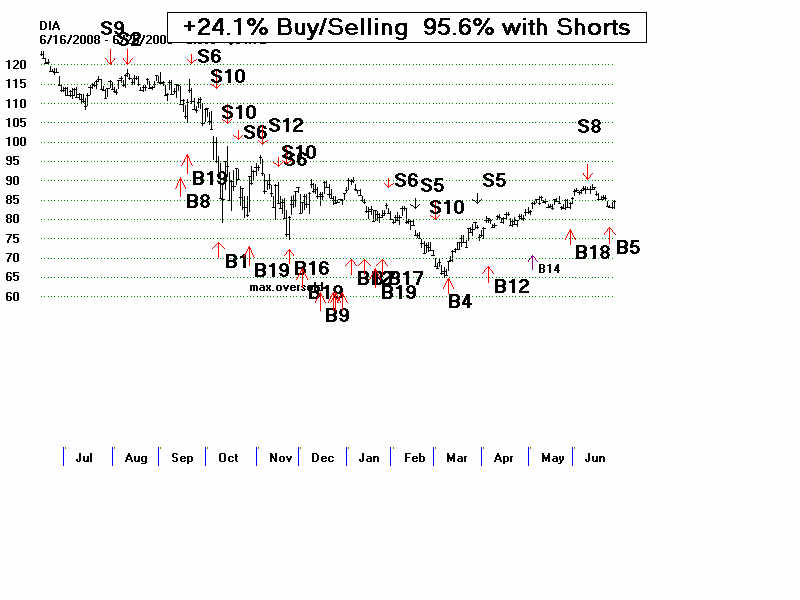
                           24% were obtained lin the last 12 months with the major market ETFs like
                           DIA, SPY and QQQQ to hedge a portfolio.  Click on their charts with the Peerless
                           Buys and Sells superimposed on their TigerSoft charts. These results
                           assume purchases and sales are made at the opening on the day after the
                           Peerless Buy or Sell.  $10,000 is started with.  All proceeds are kept fully invested.
                           Each trade is assumed to cost $40 in commissions.

                                         PEERLESS TRADING RESULTS: 9/15/2008 to 6/25/2009

                                                                          Buying/Selling                   Buying/Selling/Selling Short
                  DJIA ETF                       DIA                 + 24.1%                                               +95.6%
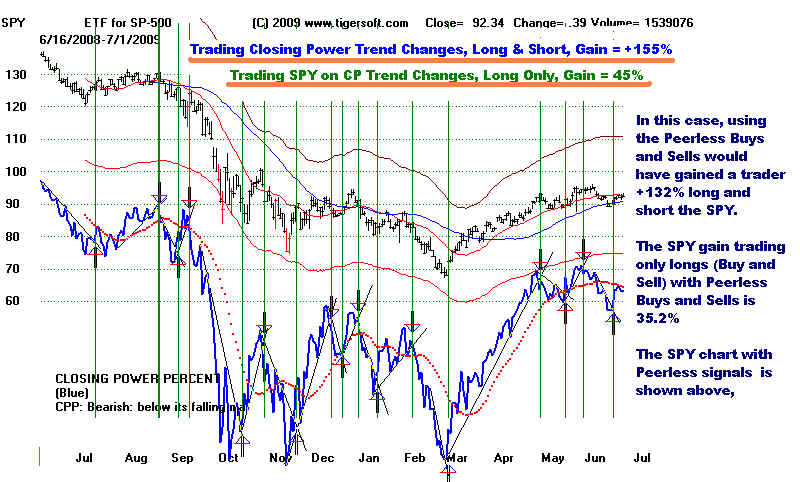
                  SP-500 ETF                  SPY                + 34.8%                                             +131.5%
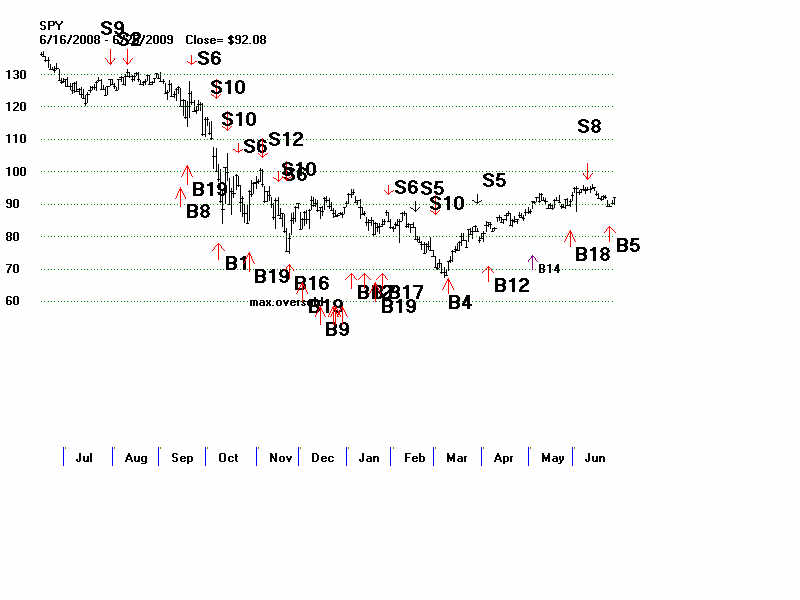
                  NASDAQ-100 ETF     QQQQ             +41.1%                                              +129.1%  
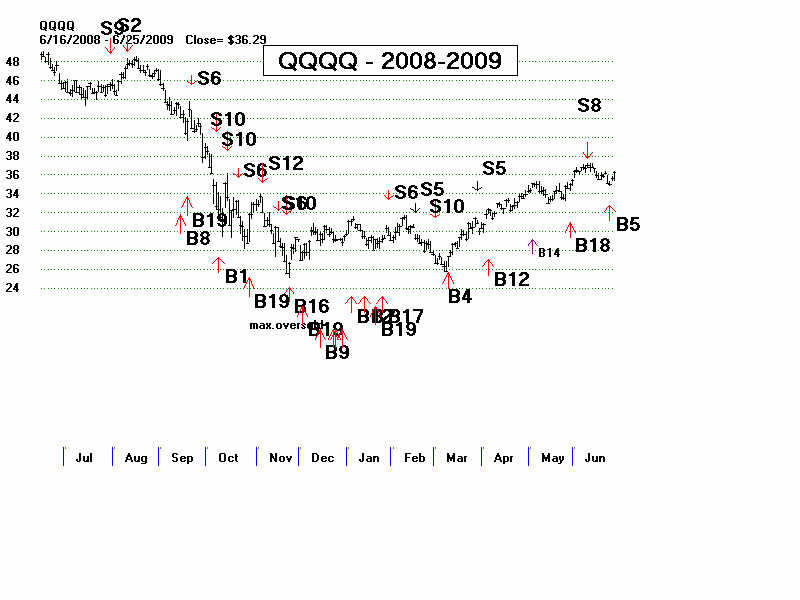
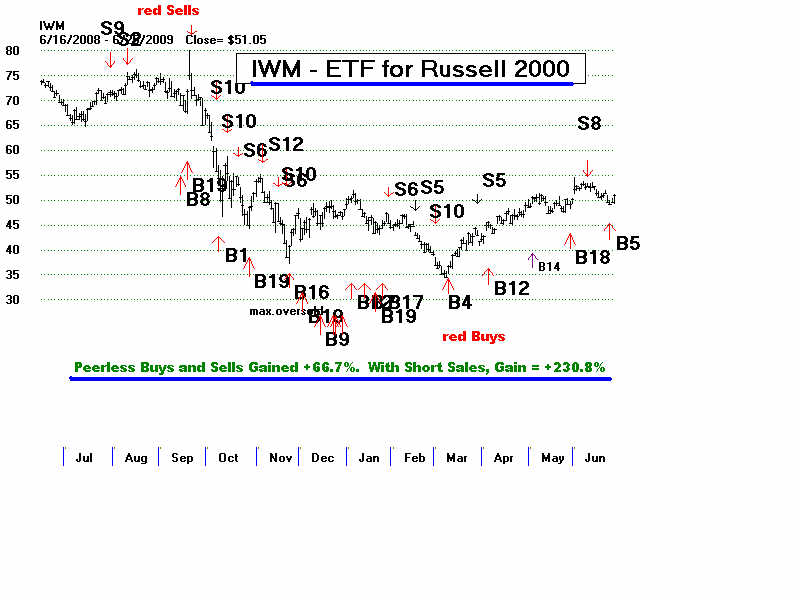
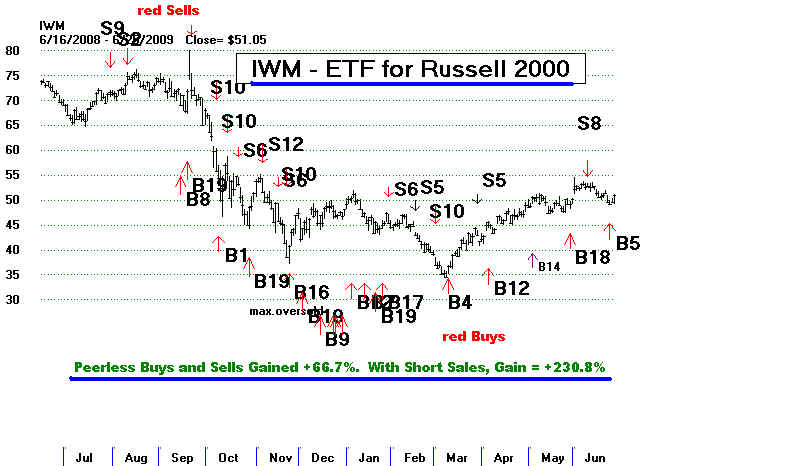
                  RUSSELL 2000 ETF  IWM                +66.7%                                              +230.8%
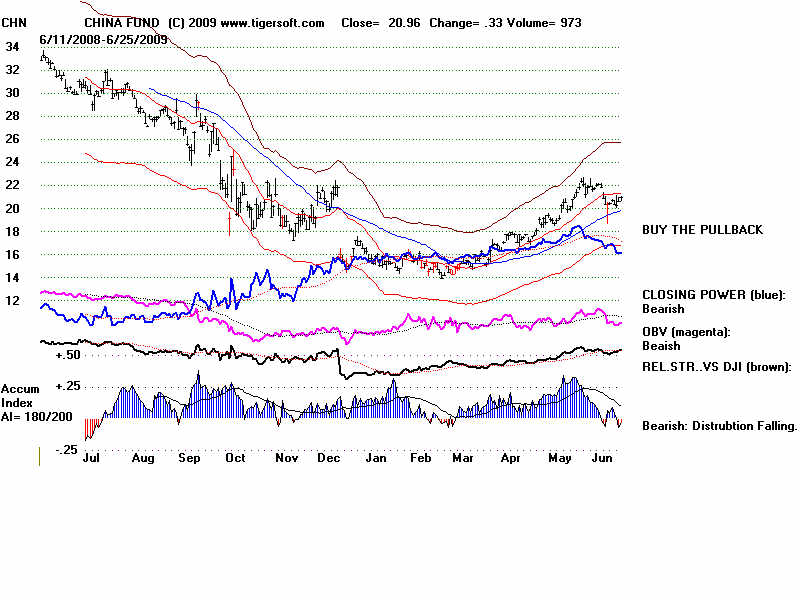
                  Chinese ETF                CHN                +32.6%                                             +122,3%
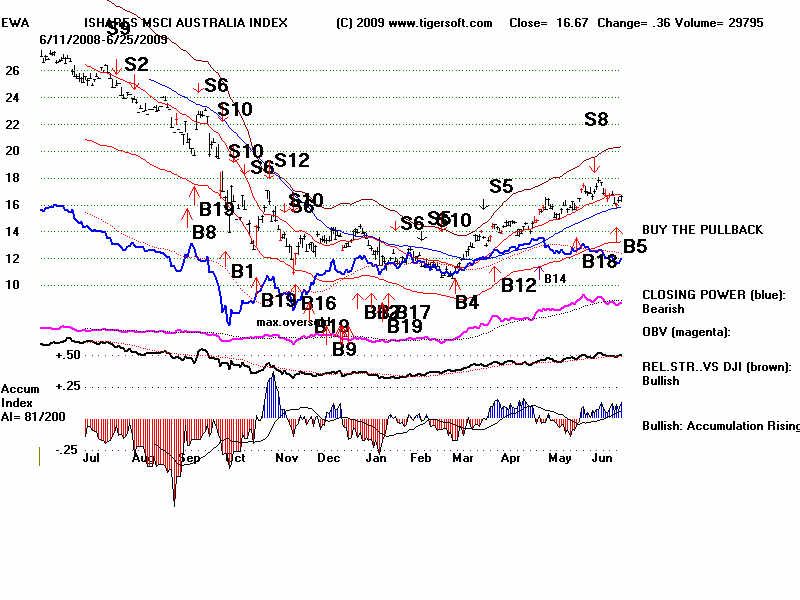
                  Australia ETF              EWA                +40.8%                                              +155.4%
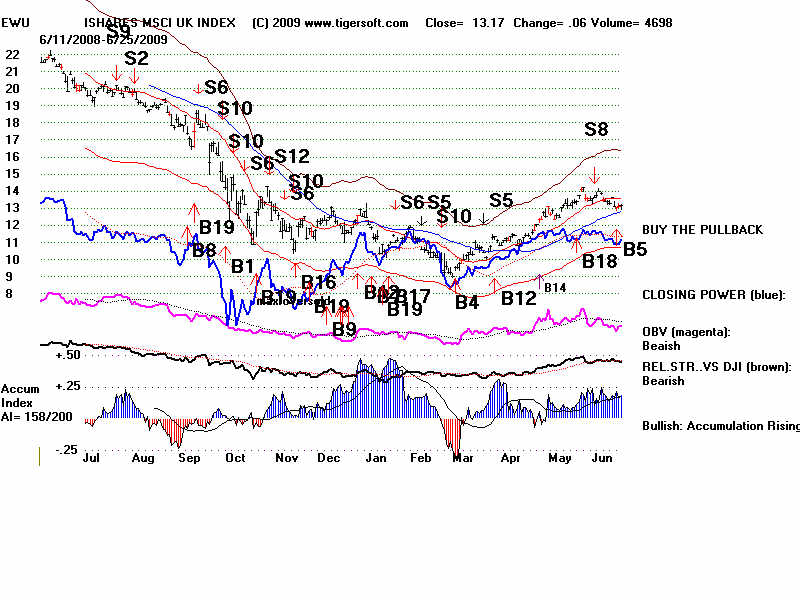
                  UK ETF                          EWU                +38.6%                                             +157.6%
                  Brazil ETF                     EWZ                +125.0%                                            +451.5%
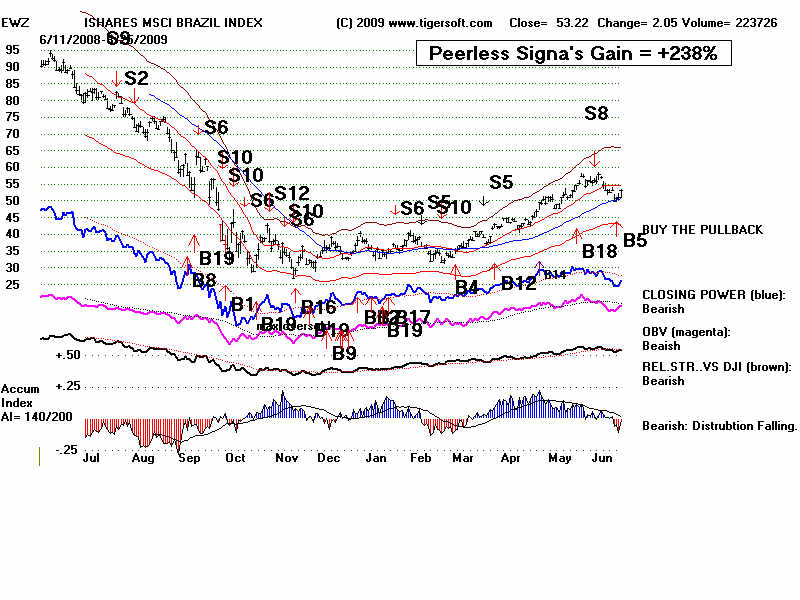
                  India Fund                     IFN                +100.9%                                              +323.6%
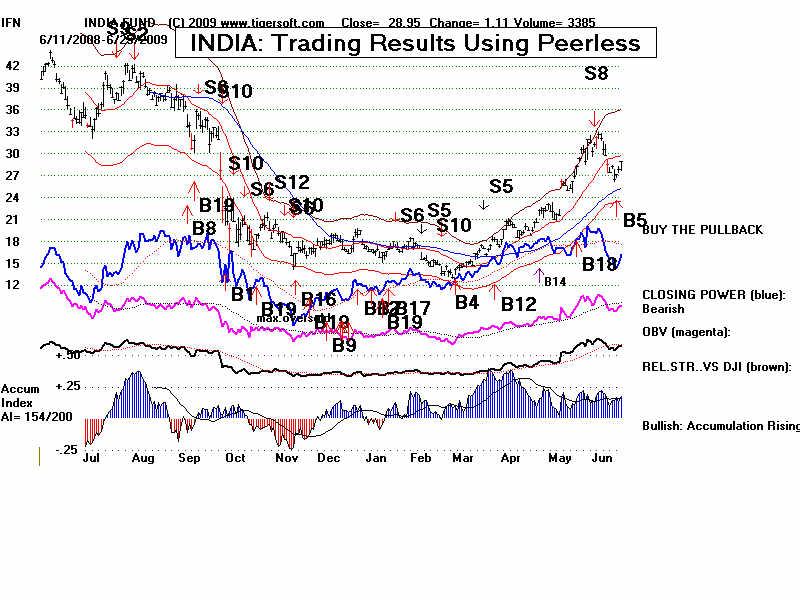
                  Indonesia Fund             IF                  +254.7%                                             +958.5%
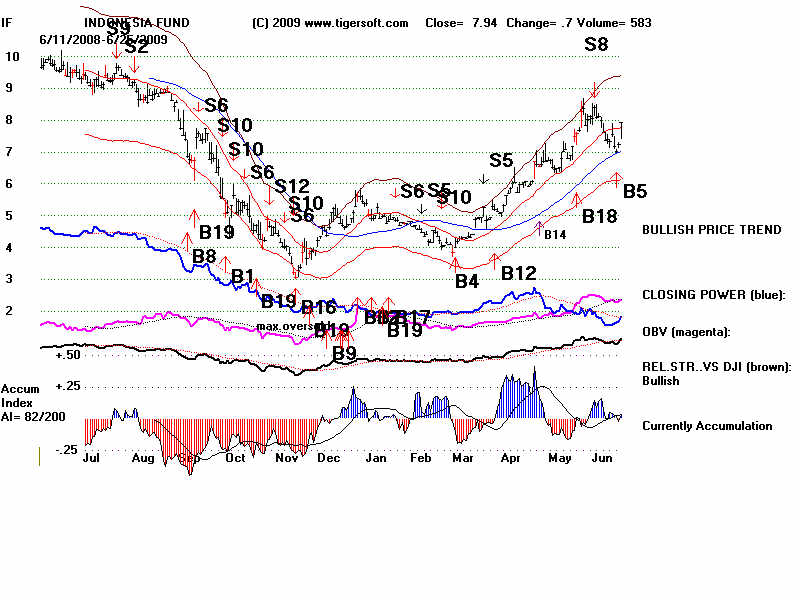
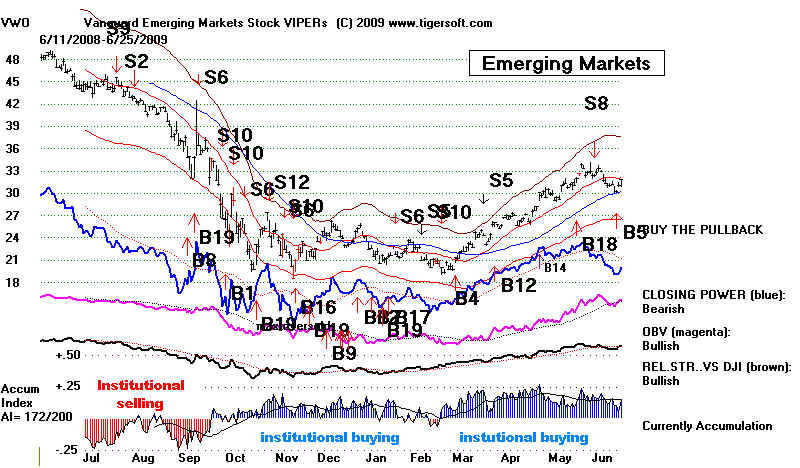
                  Emerging Mkts           VWO                +81.4%                                              +277.0%


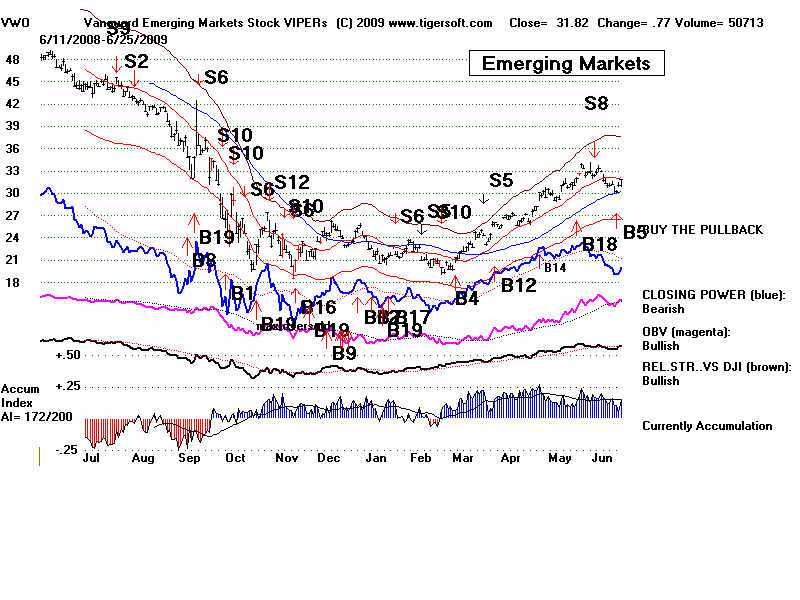
               Peerless Buys and Sells Super-Imposed on TigerSoft CHart of IWM
wpe163.jpg (50289 bytes)
           

                      Peerless Buys and Sells Super-Imposed on TigerSoft Chart of VWO
wpe15F.jpg (79382 bytes)

            (2) TIGERSOFT CLOSING POWER TREND-BREAKS
              
  The returns do vary, of course, from stock to stock.  Fortunately,
                             TIGERSOFT shows you how to pick stocks that than insiders are
                             buying and tend to tend to rise more than most when there is a new
                             reversing Peerless Buy signal.  And using TigerSoft's tools, you can
                             confirm the automatic Peerless Buys and Sells with a completely
                             different trading system based on our TigerSoft Closing Power. 


wpe128.jpg (10883 bytes)
                                                           Call or write us today.
    (C)  2009  www.tigersoft.com    858-273-5900    william,_schmidt@hotmail.com     PO Box 9491, San Diego, CA 92169

                                                                  Welcome to www.tigersoft.com 

                            
This site is for people with an open mind about the stock market.
                 If you are bound to simply "BUY and HOLD", we can help, but that is not
                 what we focus on here.  Trading, not "buying and holding",  with Peerless
                 and TigerSoft is much safer and more profitable, as you will see.

                             If you wish to discover what stock market professionals DO NOT want
                you to know about how they rig the stock market's up and downs, please continue. 
                Specifically, to see how Goldman Sachs has rigged the booms and busts in stocks and
                commodities since the 1920s, see the current issue of Rolling Stone.  We will
                produce a summary in a few days.
         
                              We have been professionally studying rigged markets and insider buying
                and selling for more than 28 years.  We can help you a lot.  Please read a little
                of what we have to say about INSIDER TRADING and then give us a call.


In a trading great system, people want simplicity,   unambiguous and non-emotional
                Buys and Sells, reasonably open and rational rules, lengthy back-testeding and
                easy replication of results.  Our Peerless Stock Market Timing satisfied all these
                needs.

                              Peerless automatic Buys and Sells are straightforward and simple to apply. 
                Buy the next day after a reversing Peerless up arrow Buy and Sell when there is
                a reversing down arrow Sell.  The signals you get have been back-tested to 1915. 
                The documentation explains each signal.  And the signals are consistently profitable,
                especially for the last year, as the market has become wilder and wilder.        


         Superb Gains Using
           
               Peerless Stock Market Timing's Buys and Sells
                                       Super-Imposed on 50 Randomly Chosen Stocks:
                                           9/15/2008- 6/25/2009

                            
Our Peerless Stock Market Timing: 1915-2009 produces Buys and Sells
               on the general market that can be profitably applied to nearly every investment
               vehicle.  This is because of how intetegrated all financial markets now are
               everywhere,  Simply superimpose the Peerless Signals on your stock, if you
               have 
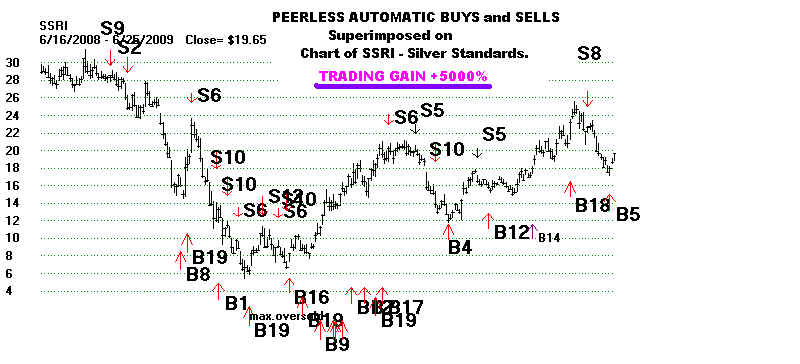
Peerless and TigerSoft.    As an extreme example, we first  show SSRI,
               a volatile silver mining stock. The gains here were phenomenal. 

                                                            Hard to Believe, But True.

                            Buying, Selling
and Selling short SSRI on the reversing Buys and Sells
               would have gained a trader more than
5004% profits in the last year.  Only Buying
               and Selling SSRI on the opening the day after the Peerless Buy and Sell, respectively,
               would have gained a trader 795% since September 15th.  
The gains here are
               exceptional.   They are presented to show the possibilities of really good market timing.
               The future for this stock, or any individual stock, is necessarily uncertain.
               But buying a few different stocks with each Buy should work very well.

                      Volatile SSRI's (Silver Standards) Stock and Peerless Buys and Sells
wpe15F.jpg (45306 bytes)
wpe161.jpg (4024 bytes)


      What happens to $10,000 using Peerless and re-investing profits?

                        Trades                     Price      Investment's Value    Gain
                       
                        (1) Buy 9/15/2008     15.25          $10000
                             Sell 9/22/2008     23              $15082                   + 50.8%
               
                        (2) Buy 10/8/2008   13.39 
                             Sell 10/14/2008 11.38            $12818                     -15%

                        (3) Buy 10/28/2008  7.07
                             Sell 11/5/2008  10.64            $19289                     +50.5%

                        (4)   Buy  11/21/2008  9.11
                              Sell   1/29/2009   20.78        $44002                     +128.1$
                       
                        (5) Buy 3/10/2009  12.13
                             Sell 3/27/2009  16.04            $58185                      +32.2%

                        (6) Buy 4/3/2009    15.39
                             Sell 6/9/2009    23.01             $85389                       +49.5%

                        (7) Buy 6/23/2009 18.74              $89535          19.65 on 6/25/2009


                            Amazing Peerless trading gains are not unusual for volatile stocks.    

                           Returns using Peerless on other key stocks for the last 9 months
               were very good.  Note we count only the Buys and Sells.  No short sales were made. 
               The software Lets you readily compare gains here with what would have happened
               simply buying and holding.  Below is a large random sample of stocks beginning
               the letter "A". 
There were losses.  These had to be taken quickly and considered
               a necessary expense.  If taking a small loss is impossible psychologically, even
               after studying the overall returns, TigerSoft and Peerless are not for you.

,
                        
Stock          Peerless Gain         Buy & Hold Gain         Winning Trades           Losing Trades
                                      (9/15-2008-6/16/2009)    (9/15-2008-6/16/2009)
                         --------      -------------------------------     -------------------------------   -------------------------    -----------------------
                          AA                      +42.6%                -58.6%                                4                                   2
                          AAI                     +261.2%             +88.0%                               5                                   1
                          AAPL                  +72.0%              +1.9%                                5                                   1
                          AAN                     +24.5%              +7.0%                               4                                   2
                          ABIO                     +8.2%              -55.1%                               3                                   3
                       
                          ABT                      +8.0%              -22.2%                               4                                   2
                          ACAD                   +366.1%          -14.1%                              5                                   0
                          ACCL                    +74.1%            +17.9%                             5                                  1
                          ACTG                   +327.8%           +75.7%                             5                                  1
                          ACTU                   +159.0%           +37.3%                             5                                  1
                       
                          ADAT                    +215.1%           +110.0%                         3                                  3
                          ADP                     -4.5%               -17.4%                               3                                  3
                          ADY                     +593,4%           +461.3%                          5                                  1
                          AET                     +83.3%             -44.4%                              4                                  2
                          AEZS                   +245.7%            +197.5%                         4                                  2
                        
                          ALC                     +66.3%             -33.4%                             5                                   1
                          ADBE                   +31.0%             =26.9%                           3                                   3
                          ADM                     +28.6%             +21.0%                            5                                  1
                          ADSK                   +61.1%             -36.6%                            4                                  2
                          AEM                    +220.1%            +7.2%                              5                                  1
                        
                          AGEN                   +678.0%            +22.0%                         4                                   2
                          AHS                       -3.7%              -63.3%                             3                                   3
                          AIZ                       +23.9%             -55.9%                              3                                   3
                          AKAM                  +88.7%              +28.2%                          6                                   0
                          ALKS                   +119.4%            -22.8%                            3                                  3
                         
                          ALTR                    +16.5%             -18.4%                             4                                 2
                          AMAT                   +20.6%             -32.9%                             2                                4
                          AMD                    +178,7%            -16.7%                             6                                0
                          AMG                    +248.7%            -29.8%                             5                                1
                          AMGN                   +4.0%              -17.1%                             2                                4
                         
                          AMLN                  +156.4%            -44.6%                            4                                2
                          AMR                      +75.2%            -62.1%                             3                                3
                          AMTD                    +80.8%             -6.2%                              6                                0
                          AMZN                     +38.3%            +7.0%                             3                                3
                          ANDS                     +10.7%            -14.9%                            5                               1
                         
                          ANSW                   +147.8%           -52.9%                            6                               0
                          ANW                     +166.3%           -34.5%                             5                               1
                          APA                      +100.4%           -20.0%                             5                               1
                          APOG                    +194.0%          -26.7%                             5                              1
                          APOL                    +17.2%              -4.4%                              4                              2


APD                        +62.7%          -23.0%                               5                             1
                          ARNA                      +64.8%          -3.6%                                4                            2
                          ASCA                      +275.9%         +11.7%                            4                             2
                          ASI                          +148.6%         -4.1%                                4                             2
                          ATCO                      +412.6%        +172.9%                           3                             3
                         
                          ATVI                        +9.9%           -23.1%                                4                            2
                          AUY                        +259.1%          16.9%                               5                          1
                          AVNR                     +688.7%          +88.3%                             5                          1
                          AVP                       +44.0%           -38.9%                                3                          3
                          AXP                      +118.2%          -27.8%                                4                          2


   =========================================================================================


TIgerSoft's Trading System Is Different Than Peerless

                       Closing Power Trend-Breaks Offer
               A Powerful but Independent Trading System


                    Below is the chart of SPY - an Exchange Traded Fund representing the SP-500.
SPYcp.bmp (1156854 bytes)

                    
  We offer Peerless Stock Market Timing and TigerSoft
             for $495.  You can get Peerless by itself and you could
              also separately get the Tiger/Peerless Daily Hotline
              which shows the signals and discusses them for $298
              for a year.


  TigerSoft's Closing Power Trend-Trend Breaks
                                            Also Give Great Buys and Sells.

                          
                                 We use TigerSoft's Closing Power Trends to confirm and mentally reinforce the
                         signals from Peerless.   These signals are completely independent of Peerless.   So,
                         they act as a great confirming system.   You may purchase only TigerSoft and produce
                         the buys and sells on the stocks you're interested in just as shown below, using TigerSoft's
                         Closing Power.  To do this you will need TigerSoft and Data.  The software is $295 plus tax. 
                         After 3 months,  you will need to get nightly stock data.  Our charge for data is $150/year,
                         the lowest price anywhere.  You may also purchase Peerless and TigerSoft for $495 and
                         get the data for 7 months, plus our nightly Hotline which discusses the general market,
                         key stocks and shows and explains each of the new Peerless Buys and Sells.

wpe160.jpg (74040 bytes)

                                     Are We Near A Top?  Peerless Stock Market Timing: 1915-2009
 
                                   
Visitors here, go to this link after viewing what we show below.
                                                        Insider Trading: The Mother's Milk of Wall Street.
                                      Now TigerSoft Let You Legally Trade As Though You Were An Insider.

                                   Insider
Selling in 1929 versus Bunker Hunt's Buying Silver in 1979.
                               Watch The Insiders and The Rest Is Easy.     TigerSoft's Explosive Super Stocks                                

                               TigerSoft Special includes   Data for 3 months.       Order here $298.
                                 
wpe15E.jpg (2634 bytes)     Next San Diego TigerSoft User Group Meeting 
                               wpe140.jpg (1918 bytes)     Learn How You Can Beat The Pros.    wpe2B.jpg (1449 bytes)

                                   
                     What Could Be Simpler than TIGERSOFT?


                           AN EXAMPLE OF TIGERSOFT's  BUYS & SELLS.

                   HOW TIGERSOFT CAN SAVE YOU
                             OR MAKE YOU 
            HUNDREDS OF THOUSAND DOLLARS.


                    Here's an example of how TigerSoft's 28 years of  back-testing of original indicators
    can help you in the stock market .  Let's say, someone gave you a tip to buy SSRI, a silver stock,
    because you tell them you're afraid that US budget deficits will inevitably cause inflation.   You
   look ahead and you see inflation because Trillions of Dollars will have to printed since foreigners
    will at some point stop buying Treasury instruments, as the Dollar starts to decline very seriously
    again. 

                     You could have bought it last year at 30.  You would now have a 20% loss.  Worse,
   you would have seen this stock drop to a low of 6.  Much better would have been to use TigerSoft
   and the trend-changes of one of our best indicators.  Trend-changes can be spotted with a ruler.
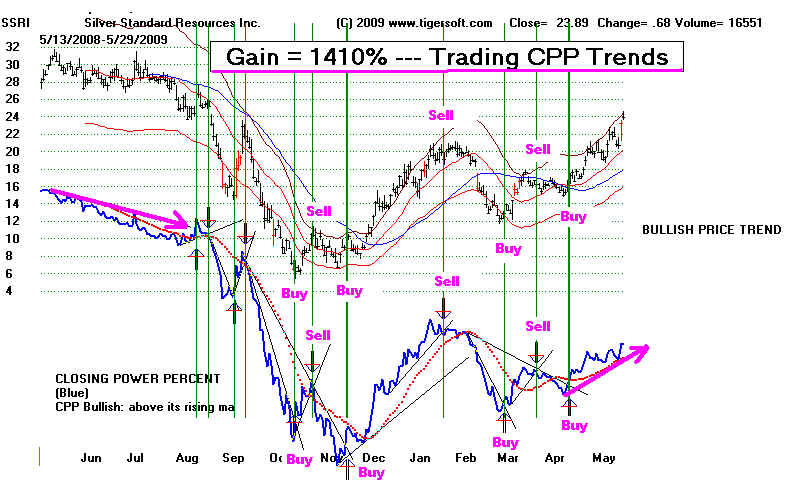
   This is not rocket science.  The best indicator for this purpose is our CPP - Closing Power Percent.
   CPP measures institutional and insider buying and selling trends.  Its trend is your firiend. The last
   Buy on the stock SSRI has brought a 33% gain, as the stock has risen from 18 to 24 in about
   five weeks.  Think what you could do with our solftware over a much longer time period.   This
   type of trading gain is not unusual with TigerSoft.

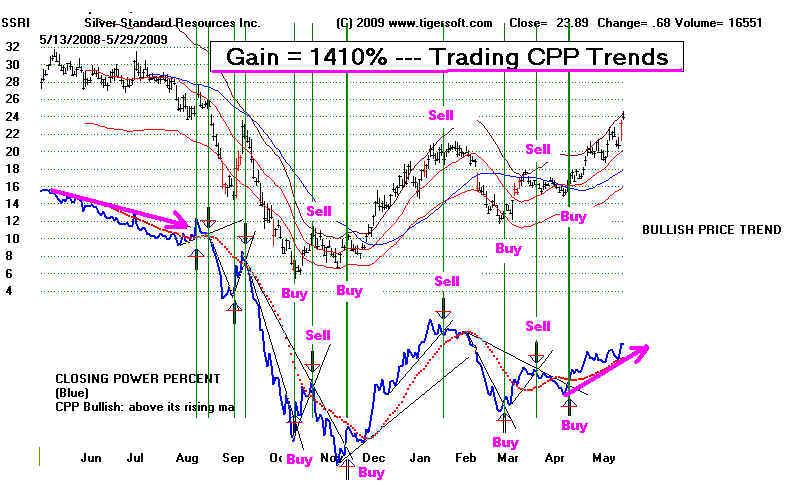
                   The rules are simple for trading with TigerSoft's Closing Power Percent Indicator.. 
  
                             Buy at the next days opening.when the Closing Power's downtrend line is
                            exceeded. . 
 
                            Sell at the next days opening when the Closing Power's uptrend line is
                           exceeded.   .

                      Using these rules would have gained a trader 1410% after commissions, buying and
   also selling short.  Please click on the links above to see how you can take advantage of TigerSoft's
   techniques for spotting and utilizing insider buying and selling in the stock market.  What we
   show below applies to all stocks, commodities, currencies, metals and not just in the US, but
   anywhere in the world.  Always trade with the TigerSoft's Advantage to watch insider buying
   and selling.


                                 1410% GAIN USING TIGERSOFT WITH
               A SILVER STOCK - SSRI - Silver Standards

                                                               (C) 2009 www.tigersoft.com

                    Our software lets you see how effective various trading strategies are.  Here we assume
  $10,000 is started with.  The commissions and slippage for each trade are assumed to be $40.
  All proceeds are re-invested.  One can specify Buys only.  And here the trades are taken
  at the next day's opening.


wpe15E.jpg (75378 bytes)


  www.tigersoft.com


Hit Counter