 |
Tiger Software 's Peerless Stock Market Timing: 1915-2009 Visa/MC $395 Includes software. Data and Hotline for 3 months.
(C) 2009 |
Special $395
Peerless Stock Market Timing
ORDER PEERLESS
STOCK MARKET TIMING HERE.
April 2008 - March 2009 Trading Gain on DIA
+96%
Using
Peerless'es Buys and Sells on the would have gained a trader 113% on the DIA in the
DIA from
April 2008 to March 2009. Here are the trades. Our software shows what would
have
happened starting with $10,000 and taking each trade. Here we assume that each trade
has a
slippage (commissions and differences between bid and ask) of $40 with each trade)
and that
the trades are taken at the close the day of the signal. Had the trades been taken
at the next
day's opening, the gains would have been +96%. It should be noted that our Hotline
actually
improved on some of these trades, such as covering the short sale on DIA on 3/9/2009
at 6547.06,
well below the next day's Buy signal at 6926.49.
5/1/2008 Sell Short DIA @ 129.96 using
$10,000
9/15/2008 Cover Short DIA and buy DIA @109.8 using
account's new value of $11,551.25
9/22/2008 Sell DIA and Sell Short DIA @ 110.5 using
account's new value of $11624.89
10/8/2008 Cover Short DIA and buy DIA @91.4 using account's
new value of $13634.26
10/14/2008 Sell DIA and Sell Short DIA @ 93.67 using account's new
value of $13972.89
10/28/2008 Cover Short DIA and buy DIA @91.14 using account's new value
of $14350.28
11/5/2008 Sell DIA and Sell Short DIA @ 91.85 using
account's new value of $14462.07
11/21/2008 Cover Short DIA and buy DIA @80.54 using account's new value
of $16242.87
1/29/2009 Sell DIA and Sell Short DIA @ 81.53 using
account's new value of $16442.52
3/10/2009 Cover Short DIA and buy DIA @69.14 using
account's new value of $18941.27
3/27/2009 Sell DIA and Sell Short DIA @ 77.81 using
account's new value of $21316.46
open.....
Had these signals been used to trade the SPY for this period at the openings the next day,
the gain would
have been 118.52%. For the QQQQ, the gain would have been 110.45%.
The software
allows one to superimpose the Peerless signals on any other chart. When you
do this, you will
quickly see the enormous value of Peerless.
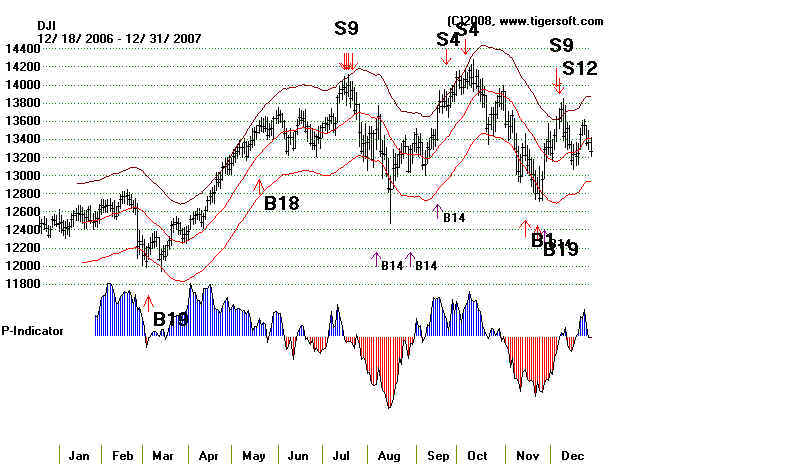
Below is the DJI chart on which the signals were based.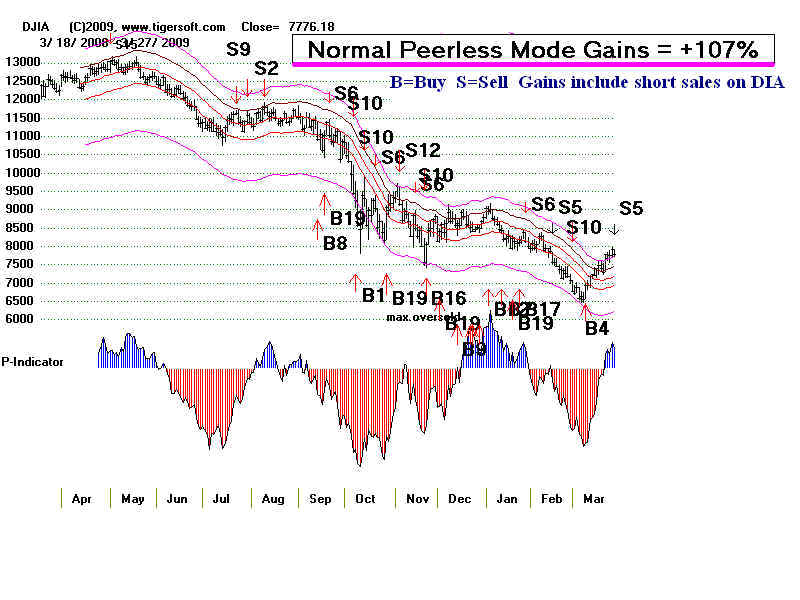
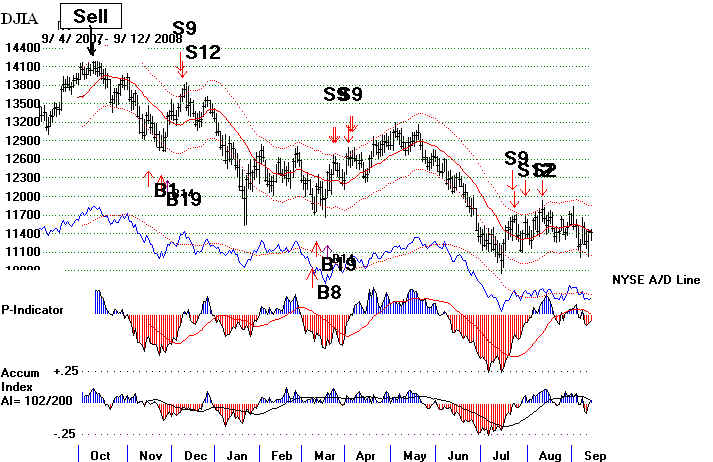
Peerless 2007 DJI Chart
Buys and Sells Gain =
37.9%
You do not have to suffer through declines in the stock market. And you do not
need to wonder if it's safe buy. Peerless can show you exactly when to get
out of the market.
It has done that, REAL-TIME, in early 1981, January
1984, October 1987,
July 1990 and at the tops in 1997, 1998, 2000, 2001, 2007, 2008 and 2009.
Peerless can show you
when it's safe to buy, just as it did real-time August 1982,
July 1984, December 1987, October 1990, January 1995, October 1997, October 1998
and March 2003 when major Buys occur.
Peerless can be
used by traders of general market ETFs, S&P Futures and most stocks, too.
Here are the reversing Buys and Sells since 2005. Investors will need to undertand
how we
use the past track record of each signal and particular signals in combination to get a
sense
of when the moves will be very big. See more below.
Recent Buys and Sells of Peerless
Signal Date
DJI
Gain
------ ----- ---
----
BUY 4/21/2005 10219
13.2%
SELL 5/5/2006 11578
4.9%
BUY 6/15/2006 11015
1.2%
SELL 6/30/2006 11150
3.1%
BUY 7/18/2006 10799
14.8%
SELL 1/5/2007 12398
2.3%
BUY 3/2/2007
12007 14.4%
SELL 7/17/2007 13971
3.3%
BUY 8/7/2007
13504 1.9%
SELL 9/24/2007 13759
3.9%
BUY 11/14/2007 13223
3.0%
SELL 12/6/2007 13619
12.6%
(Note: this was third set of major sells in 6 months.
Very bearish. See below.)
BUY
3/7/2008 11900
5.5%
SELL 3/24/2007 12549
13.0%
BUY 9/15/2008 10918
0.9%
SELL 9/22/2008 11016
16.0%
BUY
10/8/2008 9258
0.1%
SELL
10/14/2008 9311
2.6%
BUY 10/28/2008
9065
0.8%
SELL 11/5/2008 9139
12.0%
BUY 11/21/2008 8046
1.3%
SELL 1/29/2009 8149
Cover 3/9/2009
6547 19.7%
BUY 3/10/2009 6926
12.3%
SELL 3/27/2009
7776
-3.1%
BUY 4/3/2009
8018
9.3%
SELL
6/9/2009 8763
as of 6/15/2009
When Do Biggest Moves
Occur?
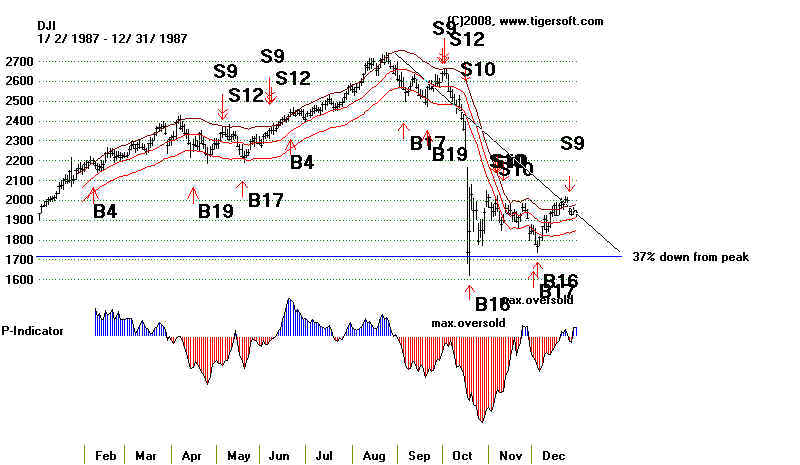
Here's The Key Pattern We Look for
The biggest sell-offs and bear markets come after there has been three or
more series of
major Sell signals over eight, or so months. You can see by October 1987, there had
been
three separate Sell S9 and S12 sets. Look at the chart below. Then
compare it with the
recent 2007-2008 case.
=========== 1987 Crash Was Preceded by Three Sets of Sell S9
and Sell S12s ================
The breakdown below 2500 (important support from previous lows) in October meant that
a severe decline
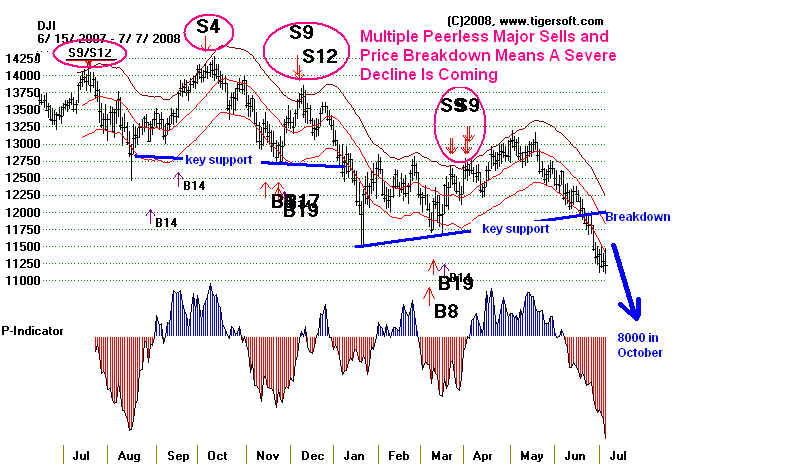
was coming soon. From July 2007 to March 2008, there had been
four sets of
major sells. All the worst declines in the stock market since 1942, which is far
back
as we can get
some of the key data to produce Buys and Sells, showed this pattern: 1959-1960,
1960, 1969-1970, 1973-1974,
1981-1982, 1987, 1990-1991, 2000-2003. There's
more we can
say. But that
should be enough to get some of you to start using Peerless.
=========== 2008 Crash Was Preceded by Four Sets of Major
Peerless Sells ================
Peerless Major Buys and Sells Will Help You Trade Nearly Everything.
Nearly all markets move up and down with the major Peerless
signals. You certainly can
this principle was true this year, 2008. Nothing has escaped the bear.
Our research in this
area is substantial. See the work we did on this regarding how well Peerless Buys and Sells traded the
Fidelity Sector funds, back in 2004. No matter what you trade,
Peerless will help you time
the many intermeditate-term moves. The only occasional exceptions are
oil and gas, gold
and Japan.
Peerless Is Simple and Automatic
Peerless is simple and automatic. No interpretation is required of its
signals. Buy on a red Up-Arrow
"B" Signal, like a "B9". Later sell on a red Down-Arrow
"S" Signal, like an "S9". The signals would
normally be taken on the next day, at the opening. We have done many studies showing
the value of
using these signals over time. The signals beat buy and hold handily. Always,
one would have used
them to get before a bear market would have dropped your holdings dramatically.
Always, we were
able to take advantages of bull markets. See the difference, the older Peerless
would have meant to
a typcial retirement account. The newer (just released) Peerless is more effective
and back-tested
25 additional years. The older rules were validated and some new Buys and Sells have
been added
that take into account seasonality.
 .. Plan for your Returement
Important
Retirement Planning
Originally written in 1981,
there were then 10 Buy signals and 10 Sell signals. Some of these
had to be interreted. That is not true now. Since 1981, we have also added a
few new signals.
But all the basic rules have worked superbly at the criticial tops and bottoms.
The October 1987 top was called perfectly with the original
system. So would
this year's top. In the 1990s, we came to appreciate the importance of Tiger's
Accumulation Index for calling major tops. Its negative and positive divergences
have
produced excellent signals.
In 2005, preparatory to a new book on Peerless, I started
to back test the programs further
back than 1966. Using NYSE Advance amd Decline data back to 1942, I refined
Peerless even
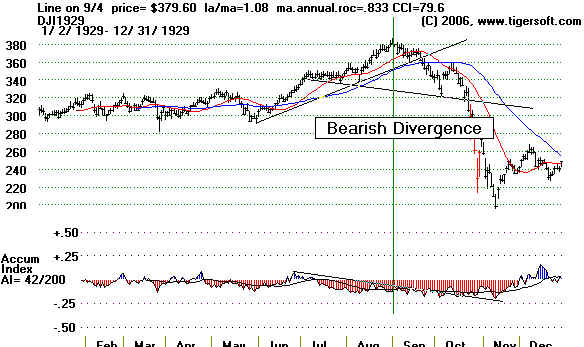
more by introducing market seasonality. It should be noted that the
Accumulation Index has
been tested back to 1928, the earlier point for which we can get data. Its bearish
divergences
would easily have let someone back then see that 1929 was a major top with severely
bearish
divergences.
------------------------- Heavy Red Distribution
before 1929 Crash -------------------------
More links on
Peerless:
Peerless Real-Time Signals: 1981-2008
Stock Market
Bear Markets and Their Bottoms' Charts: 1915-2008
Buying and Selling, the DJI-30 or an equivalent investment:
Using Peerless would have turned $100 in 1965 into $89,600 in 2007.
This is the equivalent of +17.5 %/year. Making this much a year
does wonderful things to a retirement account!
By comparison, buying and holding the DJI-30 from 1965 to 2007
would have only increased the value of the original $100 investment to
only $1437 in 2007.
Using Peerless and only buying and then selling (no short sales)
1965-2007
61 of the 67 trades (91.0%) would have been profitable.
On average 1.6 trades per year. Avg. Trade's Gain = +11.2%
Peerless Averaged +17.5%/year compared with Buy and Hold of 7%.
The Peerless gains of simply buying and selling on the reversing major Peerless signals
are understated, in that no consideration is given the interest received while in cash.
This would probably have increased the average annual return by more than 2.5%,
making the average annual return 20%.
See
also:
http://www.tigersoft.com/--1--/index.html
http://www.tigersoft.com/majorpeerless.htm
http://www.tigersoft.com/products/peerless.htm
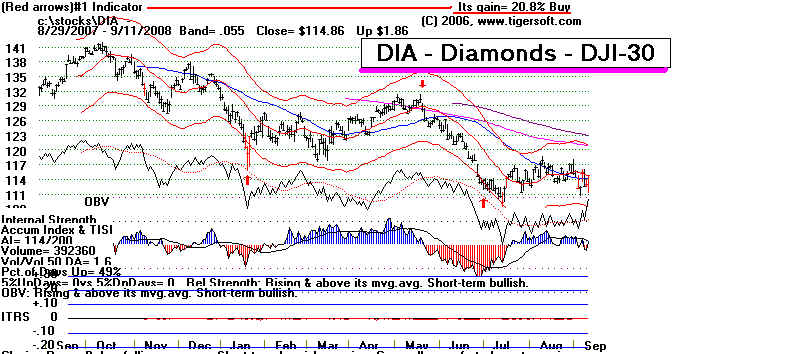
Many internal strength indicators are included to help you fine-tune the intermediate-term
Peerless signals and give you a way also to trade tactically the market's shorter-term moves.
Lines may be drawn. Percentage retracements or moves up from a low are shown. Automatic trendlines
and regression channels are included. Likely percentage retracements are helpful, too.
Buy The Original
We brought price bands to charting software before anyone else. True! Back in 1981.
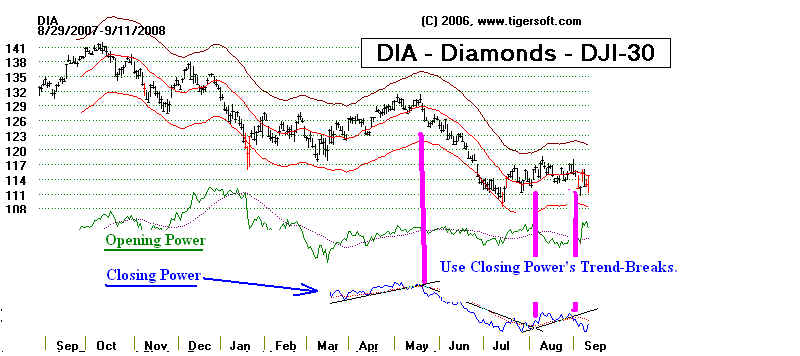
We also invented the Tiger's Accumulation Index, Opening and Closing Power, among
other superb market timing and stock trading tools. You will need TigerSoft,
as well as Peerless, to take advantage of these powerful discoveries.