Success on Wall Street Is Within Your Reach


Success Depends on Your Watching What Insiders
and Professionals Are Doing.
Here's how we use our Tiger Accumulation Index
and also our Blue Tiger Closing Power To Do That.
July 5, 2012 (C) 2012 tigersoft.com www.tigersoft.com 858-273-5900 William Schmidt, Ph.D.
=====================================================================================
Thanks for visiting. This information we consider essential to success in the stock market.
It may take a little while to get a working knowledge of it. We can help speed that process up.
Call us. We will be glad to help.
Buy Sell Buy approaching.
A technical oscillator, I created back in 1981, the
Tiger Accumulation Index
is the first indicator of a stock's internal strength that I would always
look at. It can be red (negative) or blue (positive). We always use
in conjunction with price patterns, price trends and key moving
averages and Tiger's Blue CLosing Power which shows us Net
Professional Buying and Selling.
I have used our Accumulation Index in a number of different ways.
We touch on some of the major uses here, but do not want to give
away too much to our competitors.

1. AI/200 Score - How many days of last 200 has a stock's Tiger
Accumulation Index been positive. When the bottom of our TigerSoft
chart show mostly positive readings from the indicator, we can safely
assume that insiders and big Insitutions are buying the stock on
intra-day weakness. When it is mostly red, big institutions are heavy
sellers on all rallies and a decline of at least 12 months is typical.
We have extensively back-tested how best to use AI/200 scores.
With high capitalization stocks, AI/200 scores above 194 typically
bring very big gains. See our Tiger Tahiti approach to long term investing.
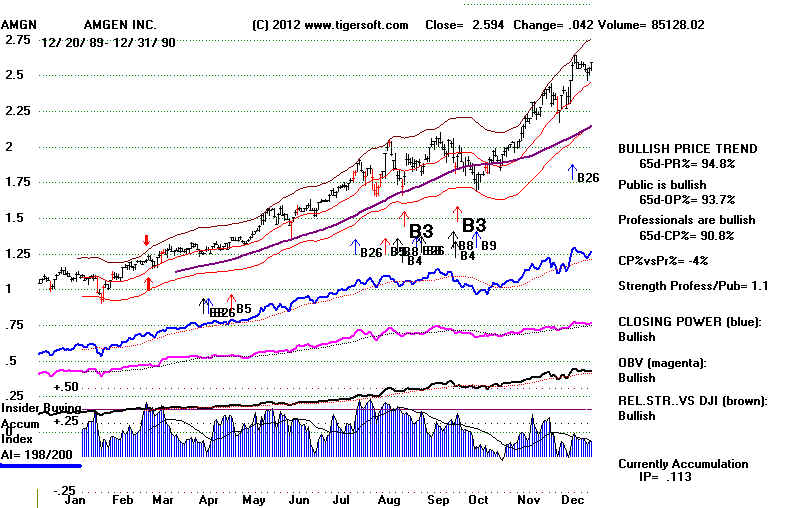
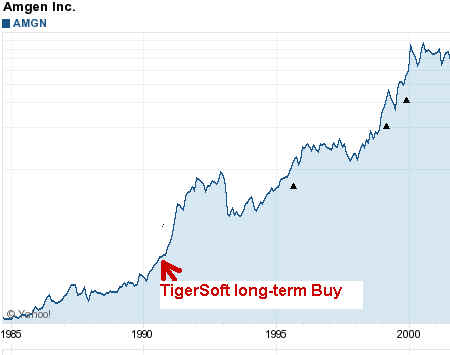
Examples - Amgen in 1990 - Stock rose many hundreds of percent
higher in the next few years, as its new drugs, Epogen and Neupogen
won FDA approval and becamse widely used. Its AI/200 score was 198
before it won FDA approval.


2. Accumulation Index Bulges above +.375 show Insider Buying.
After these, all price dips to support with our Blue Tiger Closing Power turning up
are good places to buy. See many more examples here: 1990-2012 .
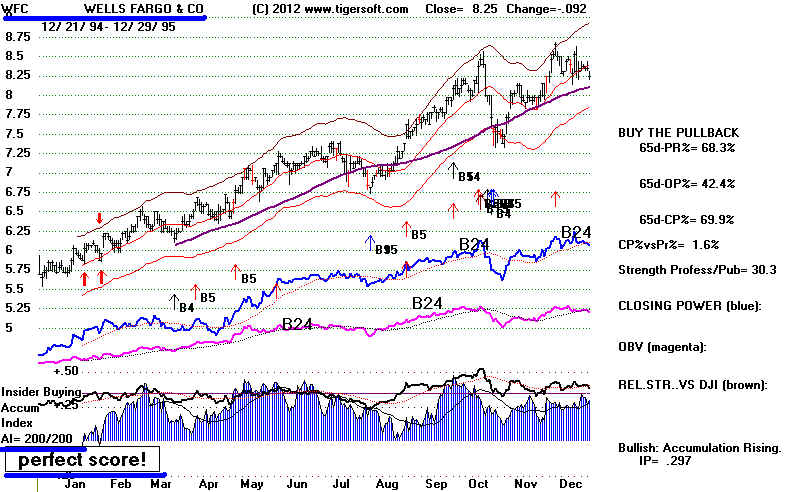
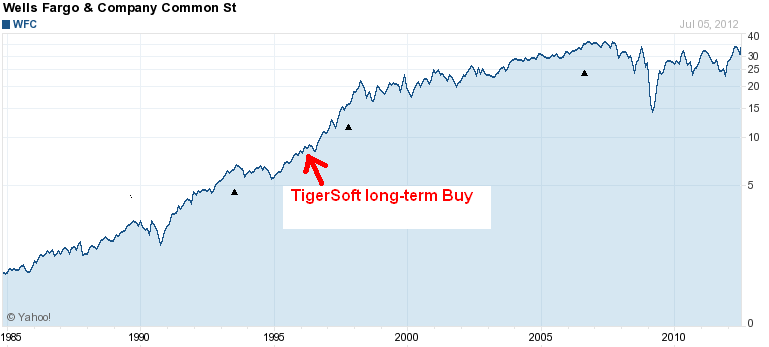
Example - Wells Fargo in 1995 - A perfect AI/200=200!
Bank deregulation was about to become the dominant political
philosophy in Washington among most Democrats and Republicans.
Banks were soon going to be able to be as large as they wanted,
use much more leverage, buy and sell derivatives, trade stocks
with customers bank deposits, buy brokerages, depend upon the
FED for more emoney if they invested unwisely, pay their executives
tens of millions a year and then finance loads of low-grade mortgages
and bundle them as grade A to investors in far-away places.
With this future, and one of their own, Robert Rubin, as Clinton's Treasury
Secretary, insiders and savvy Wall Street professionals knew
Wells Fargo would be very profitable and its stock would shoot up
dramatically. And they were right.
Below see that there were numerous points where the Tiger
Accumulation Index rose above +.375, showing what we take to
be very bullish insider buying. Accumulation Index Index bulges
showing Insider Buying are much more common than AI/200 scores
above 194. Whenever you find a stock that rises more than 200%
in a year, the odds are very good that insiders expected this and
were heavy buyers at the start of the advance. Trading long a
stock with a recent Accumulation Index bulge while its Blue
Closing Power is rising is very profitable. You are trading with
both the Insiders and the Professionals.
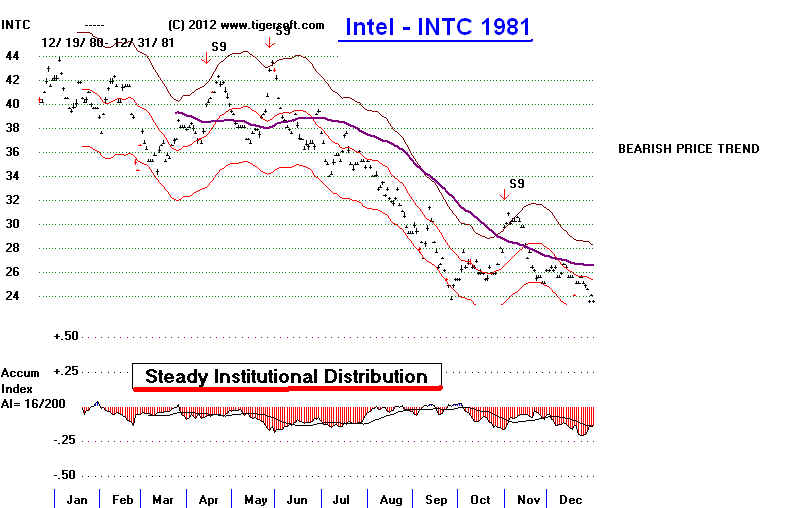
3. STEADY RED DISTRIBUTION can cause an AI/200 score to drop below 60.
These are pur favorite stocks to consider for shorting. INTC's AI/200
reached 16 in the 1981-1982 bear market.
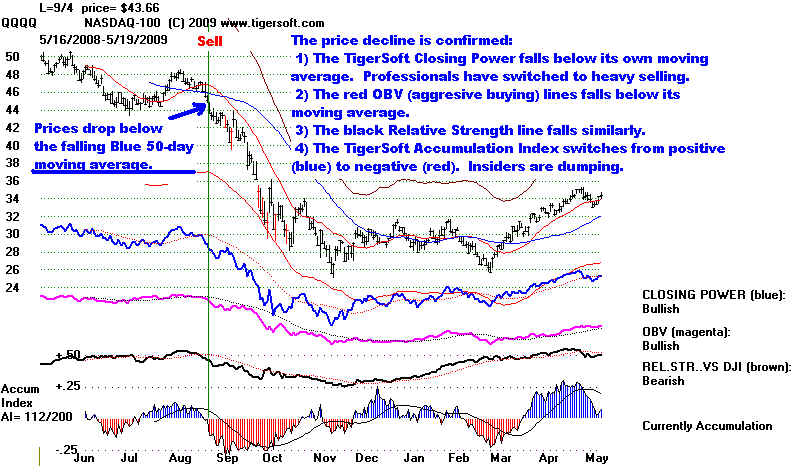
4. Most Bearish are stocks showing HEAVY RED DISTRIBUTION and
ACCUMULATION INDEX DIPS Below OUR INSIDER SELLING THRESHOLD.
After we find stocks like this, we Sell Short:
1) on Price Breakdowns below well-tested support.
2) when Prices fail at the falling MA we use.
3) when Tiger's Blue Closing Power breaks its own well-tested
support-line.
4) The Tiger Accumulation Index drops back below its own moving
average and starts another wave down.
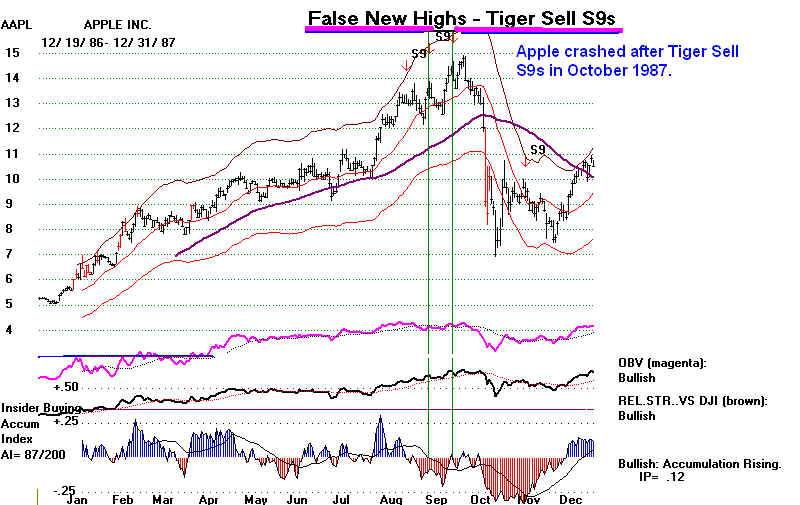
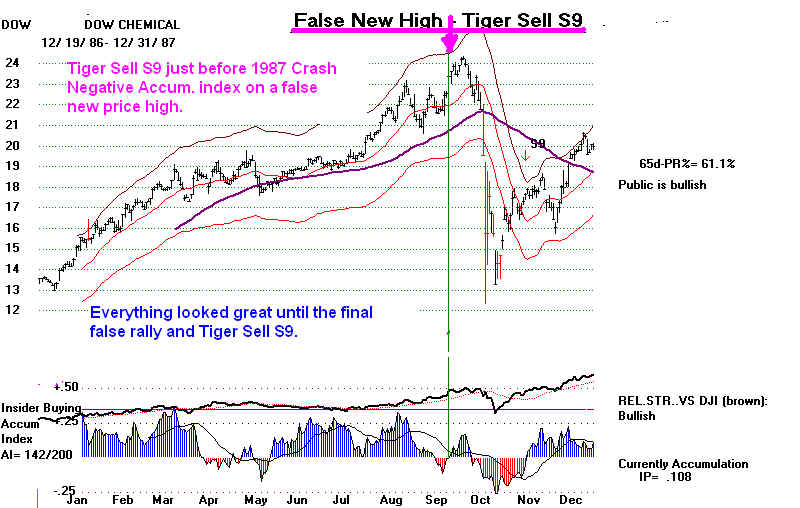
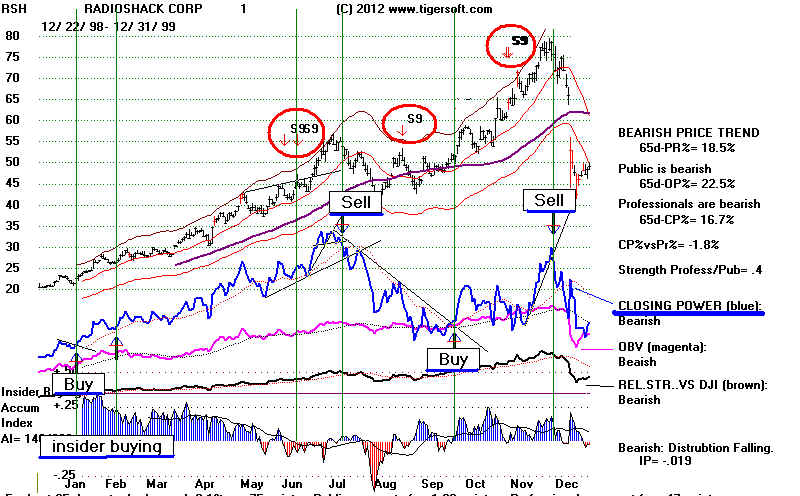
5. Also Bearish are stocks showing RED DISTRIBUTION
ON FALSE NEW HIGHS. These bring Tiger Sell S9 to Tiger charts.
When this happens, we sell short when the blue Tiger Closing Power
breaks its uptrend showing that Professionals are selling along with Insiders.
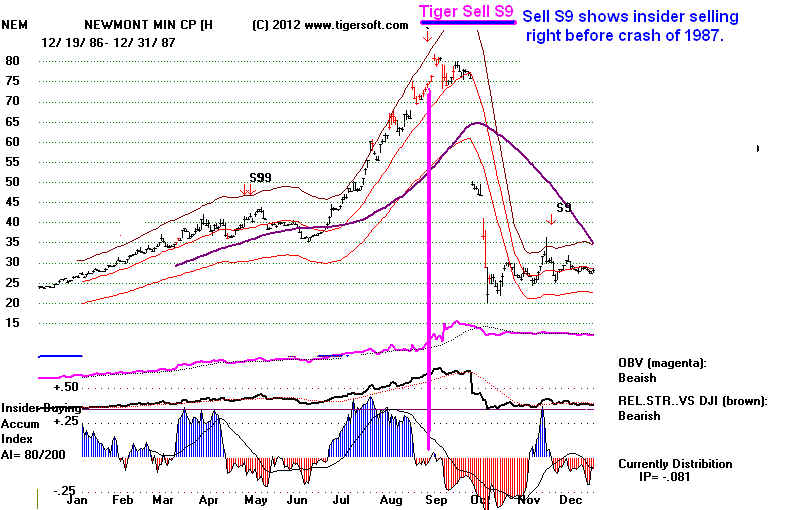
TigerSoft S9s appeared on many leading stocks right at the top in October 1987,
right before the DJI plunged 34% in 3 weeks.
Examples - Apple, Newmont Mining, Dow Chemica - 1987
Here are some more examples to study.
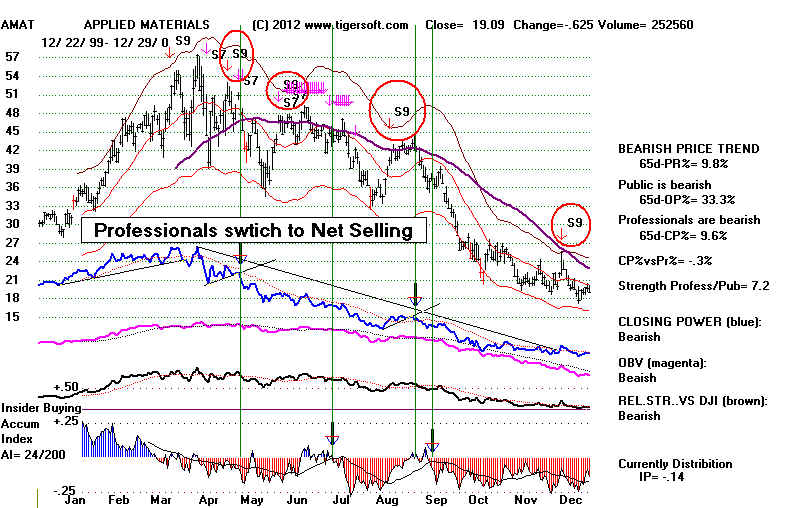
Example - Applied Materials(AMAT) - 2000
Don't hold onto a stock that shows so much Red Insider Selling
from the Tiger Accumulation Index while the Tiger Blue CLosing Power
is falling. Professionals are bearish, too. Use the Tiger Sell S9s to
short more the brief rallies that are common in a bear market..
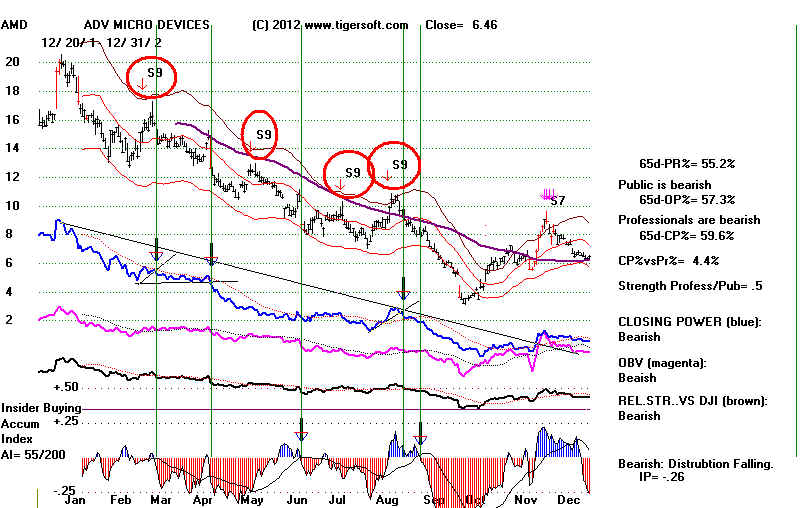
Example - Advanced Micro Devices (AMD) - 2001
Don't hold onto a stock that shows this much Red Insider Selling
from the Tiger Accumulation Index while the Tiger Blue CLosing Power
is falling. Professionals are bearish, too. Use the Tiger Sell S9s to
short more the brief rallies that are common in a bear market. See
what fine points to sell short are the turns down by the Accumulation
Index below its own moving average.
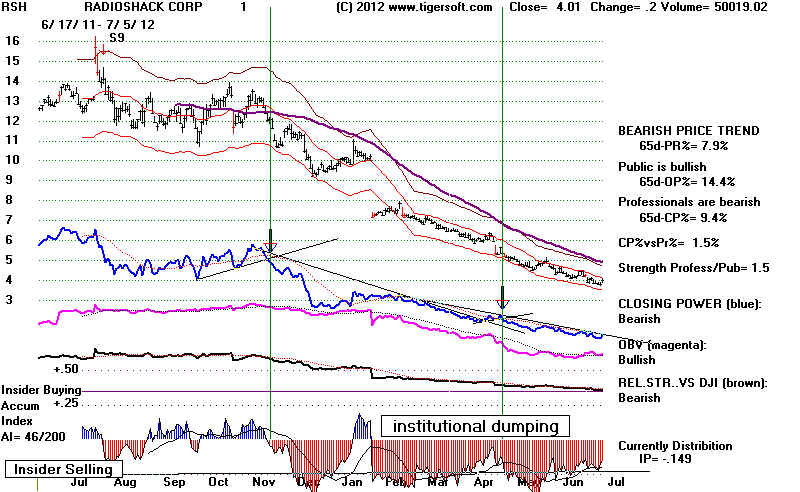
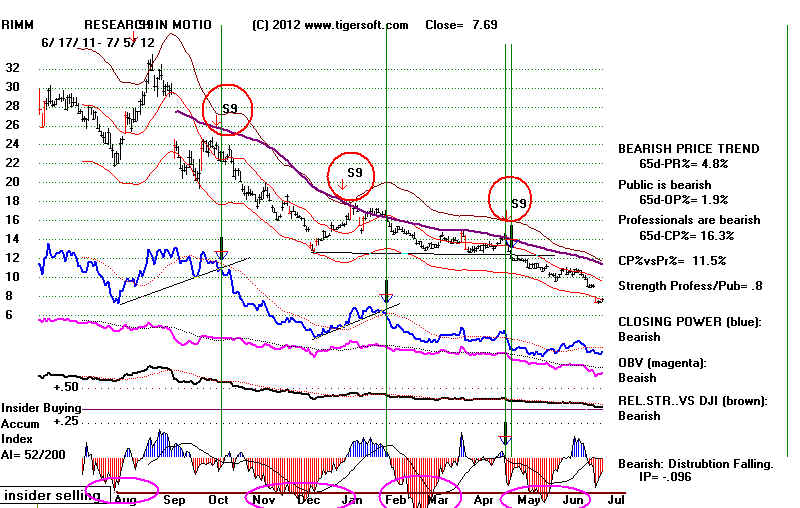
Example - Research in Motion (RIMM) - 2011-2012
Don't hold onto a stock that shows this much Red Insider Selling
from the Tiger Accumulation Index while the Tiger Blue CLosing Power
is falling. Professionals are bearish, too. Use the Tiger Sell S9s to
short more the brief rallies that are common in a bear market. See
what fine points to sell short are the turns down by the Accumulation
Index below its own moving average.
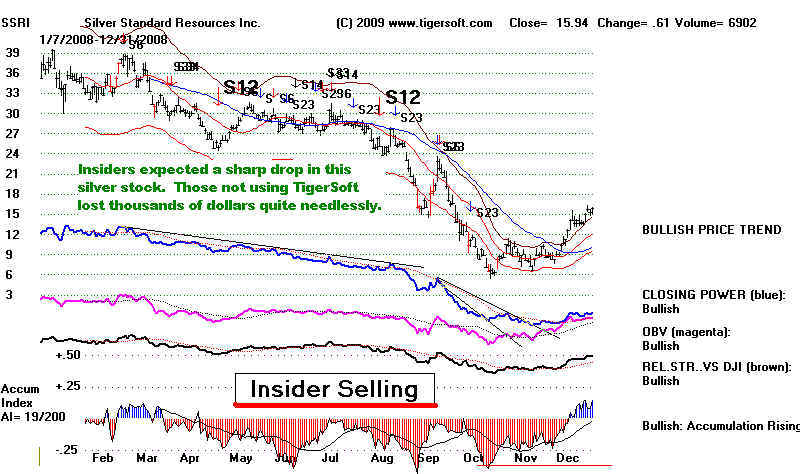
Example - Silver Standards (SSRI) - Don't hold onto a stock showing
this much Red Insider Selling from the Tiger Accumulation Index
while the Tiger Blue CLosing Power is falling. This means that
both Insiders and Professionals are bearish the stock.
Watch The Insiders Using Tiger's Accumulation Index To See
a stock's potential, but Trade The Closing Power Trends.
Respect Them. Don't Fight Them.
Radio Shack's Sad
Decline.
A Microcosm for What's Happening To America:
Ignorant,
Cynical, Over-Paid CEOs and Under-Paid Workers.
RSH 1999
RSH 2011-2012