Preface: April 27, 2010
by William Schmidt, Ph.D. (C) 2010 www.tigersoft.com
At its simplest, the Tahiti system buys at the end of every quarter the most
highly accumulated ("AI/200") stock in DJI-30. We use the rankings
produced by TIGER's Power-Stock-Ranker Software. We want usually
to avoid stocks whose AI/200 is less than 130, unless there has just been
an "extreme bear market". We also do not want to buy a stocks whose OBV
is lagging heavily. The "PricePct minus OBVPct" must not be below -30.
Most important, we need to use our Peerless system to avoid being caught in severe
bear markets. In addition, with TigerSoft we have the Tiger Closing Power.
If the Closing Power is in a downtrend, I would suggest waiting for the Closing
Power to break its downtrend. Doing that will give you more confidence.
You may even want to use margin in such cases, so good are the odds for a rally.
We want here to expand on our rules for our Tahiti system.
As suggested in the original 1994 Tiger "Tahiti System" book,
sheer prudence dictates we must taken into account when the general market
looks particularly dangerous using Peerless. Here we must consider the active
major BUY or SELL signals given by our Peerless general market timing system.
Four unreversed major Sell signals, especially SELL S9 and SELL S12 signals
in the space of 8 months establishes that the general market has become very bearish.
This is what occurred just before the start of the bear markets of 1969-1970, 1973-1974,
1981-1982, 1987, 1999-2001 and 2007-2009. In fact, the only bear market
without such signs of a market top occurred in 1977-1978 and that was a year
when many oil stocks did very well and, appropriately enough, oil stocks were
the Tahiti picks.
Our book shows the trades that might have been made if one were
NOT to have considered Peerless. In the tables below, we emphasize
investing only when Peerless shows that it is safe. Let me emphasize
that we strongly advise selling out all "Tahiti"-based purchases on the
fourth Peerless major Sell and waiting for the next major Buy to start Buying.
The bear markets of 2000-2003 and 2007-2009 showed the importance of this.
Much more money was made by simply selling out and waiting for the market
to be safe again. Using the first major Buy after a sell-off worked well enough
until the 2008-2009 period. This is our normal recommendation. After all,
you are deploying only 1/7 of your investment money in the first
purchase. So, buying a little early is not a problem.
Extreme Bear Markets
But the severity of the 2008-2009 decline warranted a different approach.
When the DJI is down more than 40% from its high of last 10 months
assume the stock market is in an "extreme bearish mode". This concept
is an important of Peerless. Separate Buy and Sell signals apply then.
This extreme bearish mode occurred only in 1930, 1931, 1932, 1933, 1937,
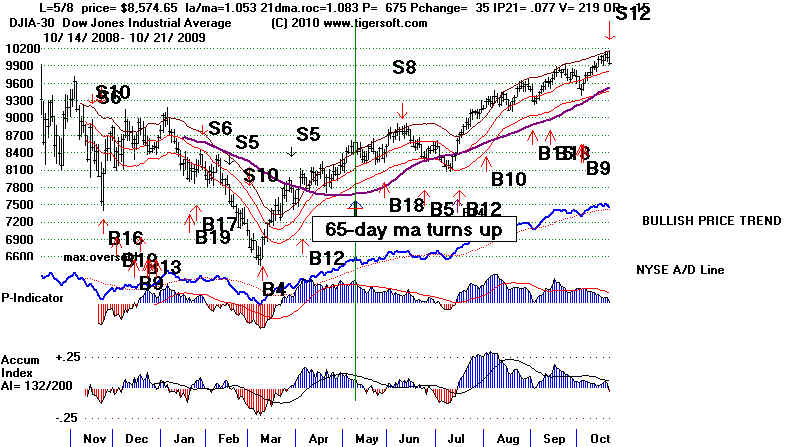
1938, 1987, 2008 and 2009. In these cases, wait for the DJIA's 65-day ma
to turn up, unless there is strong evidence that the decline has non-economic
causes, as in 1987 when unregulated, out-of-control computerized trading of
index options brought on a completely artificial decline.
Qualifying Stocks
In all cases, we want to screen the top AI/200 stocks. We use the
Tiger Power Ranker to do this in two ways. The first variable we
employ is "AI/200". This shows the amount of steady accumulation
for nearly a year in a stock. The highest AI/200 stock in the DJI-30
is the Tahiti choice at the end of each quarter. There are two exceptions.
If another Tiger variable, "OBV%-PR%" is less than -30 we would
not buy the stock. This shows too much aggressive selling. When the
most highly ranked Accumulation stock in the DJI-30 has an
OBV%-PR% less than -30, the next highest ranked (AI/200) stock in
the DJI-30 is used for purchase unless the next highest AI/200 stock
has an AI/200 score less than 130. In that case, no stock is bought for that
quarter.
Note this. After an extreme bear market, with the 65-day ma again
rising, we would be willing to buy the top AI/200 stock, even though its
AI/200 might be as low as 125. The reason for this is simply that
such very severe declines cause the levels of Accumulation to drop
dramatically.
Applying The Tahiti System To Other Groups of Stocks
The Tahiti system using the DJI works with only 30 blue chip stocks.
Thirty (n=30) is often considered by statisticians to be a minimum for a
acceptable sample. One would think that taking the highest AI/200 stock
from a larger universe, like the NASDAQ-100 or SP-500 stock should
work even better. Our testing, though limited shows this is true, but with
a caveat. See Seven Paths To 25/Year. The exception is that if a
smaller stock rises too much too quickly, say 200% or more, why
mechanically wait for 21 months to sell. Use the 65-day ma. Penetrations
of it with a negative Accumulation Index reading and weak Closing Power
usually are sufficient reasons to take profits. Similarly, if the 65-dma
turns down, selling is usually prudent even when the Accumulation Index
is positive. In these cases, we usually watch the Closing Power. When
its downtrend ends, there is usually another tradeable rally. A long-term
investor should just sell and find another stock at the end of the next quarter.
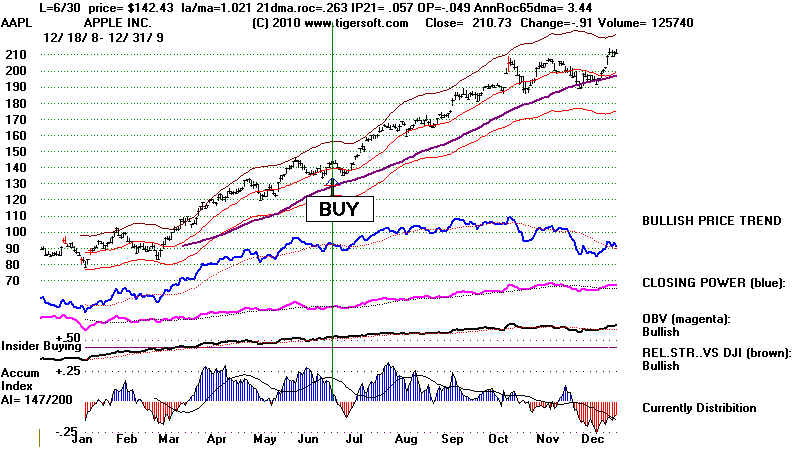
The 2009-2010 experience in taking the highest AI/200 stocks in other
groups confirms this. AAPL was the stock to buy in the NASDAQ-100
in mid 2009. When its Closing Power downtrend ended in early 2009,
it was a good trading Buy again.
Tahiti Approach Shows Best Industry To Invest in.
Beyond this, we suggest another valuable approach. Use the Tahiti system
to identify the best group of stocks to buy into. Thus, in the period 1976-1980,
oil stocks should have been bought, especially the highest Power-Ranked.
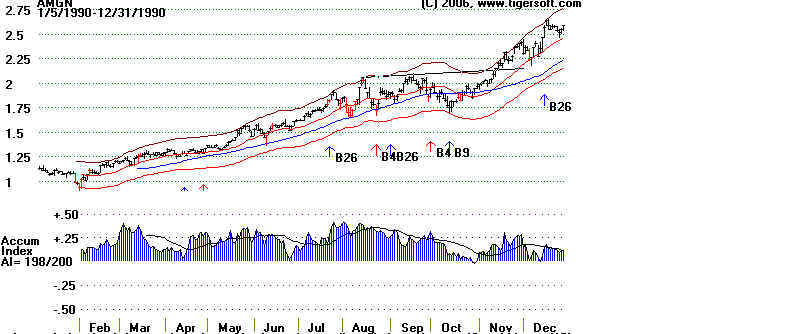
In 1990 and 1991, Merck was the highest ranked AI/200 DJIA stock. It did
well but much more money would have been made in buying Amgen, the highest
AI/200 stock among the larger biotechs. The best performing stock of 1991
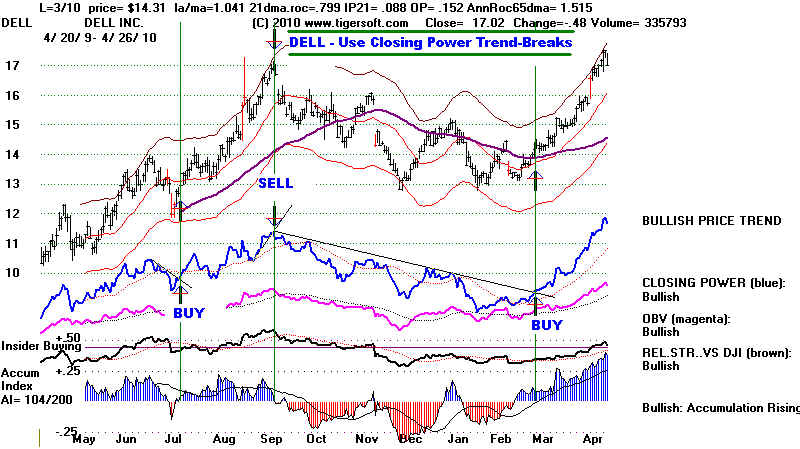
was a biotech. In 2009, HPQ and IBM, two computer stocks, vied for honors
as the highest AI/200 stock. Instead of buying them. even better gains would
have been made buying the highest AI/200 computer stocks in the NASDAQ-100
and SP-500. These included Apple Computer, AAPL and DELL If you want to
trade, pick these high Accumulation stocks and play the Closing Power trends
on the long side.
TAHITI SELECTIONS SINCE 1970
USING PEERLESS TO REDUCE RISK
Below all the "Tahiti" picks, including the stocks that
met these conditions most recently. Below that, we want to mention some
other factors that should be used to make these selections as safe and profitable
as possible.
Stock Purchase Purchase Price 7 Percent
Date Price Quarters Gain if sold
Gain on 4th major Sell. including "S9"
-------------------------------------------------------------------------------------------------------------------------
1 Chevron 12/31/70 13.625 17.281 26.8%
2 Chevron 3/31/71 14.125 19.906 40.9%
3 PhlipMor 6/30/71 1.969 4.164 111.5% 95.6%
4 Merck 9/30/71 3.11 4.983 60.2% 63.9%
5 Merck 12/31/71 3.444 4.546 32.0% 48.0%
6 CocCola 3/30/72 5.101 5.124 0.5% 18.7%
7 PhlipMor 6/30/72 3.25 3.086 -5.1% 18.5%
8 PhlipMor 9/29/72 3.227 3.406 5.6% 19.4%
9 PhlipMor 12/29/72 3.695 2.25 -39.1% 4.3%
Note 4th S9 signal given in early January 1973.
In addition.  When NYSE breadth is this bad (A/D Line in steep
downtrend, expect at best, trading range rallies.  This is
also a common pattern for the Presidential Election year.
A false rally into January that lets the partisans of the
winning party celebrate by buying stock at a high also
is a common pattern. (See early 1969, early 1973 (below),
end of 1976 false rally, early 1981, 2000 trading range and
false peak early in 2001.
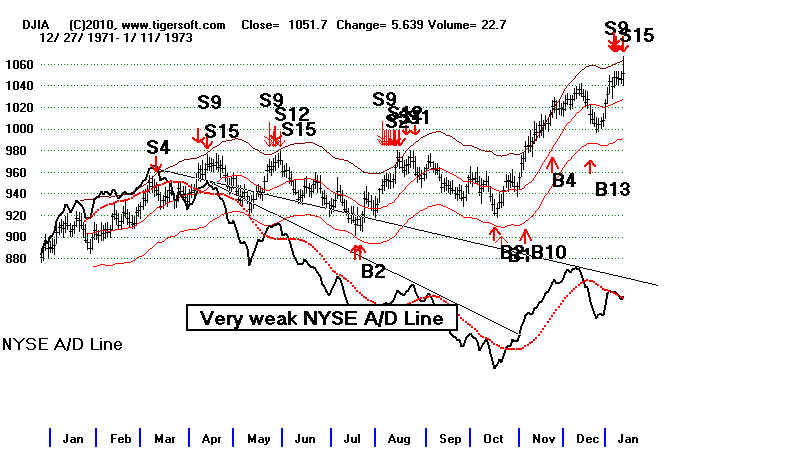
None of DJI stocks met minimum conditions
for purchase on 3/30/73.
10  Boeing   6/29/73   1.123    1.358   20.9%

11  Woolwor  9/28/93   6.125    4.094  -33.2%
12  Boeing   12/31/73   .819    1.749  113.6%
13  Boeing   3/29/74    .93     1.596   71.6%
14  Boeing   6/28/74   1.152    1.749   51.8%
15  Boeing   9/30/74   1.07     2.695  151.9%

16  Boeing   12/31/74  1.041    3.028  190.9%
17  Un.Tech  3/31/75   10.25   19.438   89.6%
18  Chevron  3/31/75   12.125  20.5     69.1%
(two stocks tied for first.)
19  Un.Tech. 6/30/75   14.5    17.375   19.8%
20  Texaco   9/30/75   23.5    29.125   23.9%

21  Texaco   12/31/75  23.375  28.125   20.3%
22  Texaco   6/30/76   28.125  26.0     -7.6%
23  Boeing   9/30/76   3.028    6.961  129.9%
24  Boeing   12/31/76  2.946    8.418  185.7%
25  Boeing   3/31/77   2.888    9.393  225.2%

26  Texaco   6/30/77   29.125  25.625  -12.0%
27  Texaco   9/30/77   28.125  27.625   -1.8%
28  PhlipMo  12/30/77  3.867    4.406   13.9%
29  UnionCa  3/31/78   2.614    2.807    7.4%
30  Un.Tech  6/30/78   21.188  20.625   -2.7%

31  Texaco   9/29/78   24.75   36.75    48.5%
No stocks met minimum qualifications on 12/31/78.
32  Merck    3/30/79   3.662    4.707   28.5%
33  Allied   9/28/79   12.84   16.324   27.1%   +23.6%
No stocks met minimum requirements on 12/31/79
No stocks met minimum requirements on 3/31/80.
34 Disney 6/30/80 3.0 3.313 10.4% +27.0%
35 Goodyr 9/30/80 7.938 12.25 54.3% +25.2%
12/30/80 = no stocks qualify.
On 1/7/81, Peerless gave a fourth major Sell. Selling the positions then,
on 1/7/81 would have produced better results in two of three cases.
UnTech 3/31/81 28.125 28.313 0.7%
4/1/81, Peerless gave a fifth major Sell
The UTX trade, if made, should have been closed out.
CocaCo 6/31/81 2.896 4.458 53.9%
7/6/81 Peerless gave a breakdown - Sell S10 following
six major Sells. The KO trade would not have been made
if Peerless was used, too. A new Buy signal on 9/28/91
after a sell-off, then opened the way to buying again.
38 AmerEx 9/30/81 10.311 23.831 131.1%
39 Sears 12/31/81 12.094 27.375 126.4%
40 Sears 3/3/82 14.25 27.844 95.4%
41 Sears 6/30/82 14.531 25.406 74.8%
42 McDonld 9/30/82 8.0 10.172 27.2%
43 Boeing 12/31/82 10.034 15.958 59.0%
44 PhilMo 3/31/83 7.85 10.078 28.4%
45 WestHo 6/30/83 12.469 15.0 20.3%
46 WestHo 9/30/83 11.594 17.188 48.3%
47 WestHo 12/30/83 13.688 18.813 37.4%
48 Sears 3/30/84 25.406 29.25 15.1%
49 Sears 6/29/84 23.625 37.125 57.1%
50 Disney 9/29/84 3.68 13.688 272.0%
51 Disney 12/31/84 3.742 9.875 163.9%
52 Boeing 3/29/85 18.513 22.718 22.7%
53 Disney 6/28/85 5.867 15.594 165.8%
54 Disney 9/30/85 5.242 18.063 244.6%
55 Woolwort 12/31/85 15.00 24,625 64.2%
56 Woolwort 3/31/86 19. 17.25 -9.2% 29.0%
57 JPMorgan 6/30/86 43.938 33.25 -24.3% 11.0%
58 JPMorgan 9/30/86 40.563 38.875 -4.2% 20.2%
59 Exxon 12/30/86 35.063 44.755 27.6% 41.9%
60 Exxon 3/31/87 42.875 44. 2.6% 16.0%
61 Disney 6/30/87 18.063 19.625 8.7% 8.2%
62 Caterplr 9/30/87 73.5 58. -21.1% 0.5%
On 10/1/1987, Peerless have a fourth major sell. See below.
The new buys after a steep decline, cause us to resume buying
at the end of each quarter.
63 Caterplr 12/30/87 62. 61. -1.6%
64 UnTech 3/31/88 39.0 54.25 39.1%
65 UnTech 6/30/88 38.5 57.25 48.7%
66 CocaCo 9/30/88 10.938 22.188 102.9%
67 CocaCo 12/30/88 11.156 19.75 77.0%
68 CocaCo 3/31/89 12.813 23.25 81.5%
69 Merck 6/30/89 22.289 35.163 57.8%
70 McDonald 9/29/89 29.75 32.875 10.5%
71 Boeing 12/29/89 39.579 50.75 28.2%
72 Alcoa 3/30/90 64.75 64.375 -0.6%
73 Alcoa 6/29/90 63.75 70.5 10.6%
74 Alcoa 9/28/90 62.625 75.875 21.2%
75 Merck 12/31/90 29.955 44.5 48.6%
Consider buying the top AI/200 stock in the industry
represented by the top Tahiti stock.AMGEN more than tripled
by the ned of 1991.
9.25 12/31/1991
AMGN
 76 Merck 3/28/91 35.163 43.375 23.4%
77 Merck 6/28/91 38.704 35.375 -8.6%
78 Goodyr 9/30/91 21.938 42.5 93.7%
79 Merck 12/31/91 55.494 30.75 -44.6%
80 MMM 6/30/92 48.5 49.5 2.1%
81 UnionCa 9/30/92 13.125 26.5 101.9%
82 UnionCa 12/31/92 16.625 34.0 104.5%
83 UnionCa 3/31/93 18. 29.375 63.2%
84 UnionCa 6/30/93 19.25 30.625 59.1%
85 UnionCa 9/30/93 19.375 33.5 72.9%
86 UnionCa 12/31/93 22.375 39.75 77.7%
87 UnionCa 3/31/94 22.5 37.5 66.7%
88 Texaco 6/30/94 60.375 85.75 42.0%
89 ProctG 9/30/94 29.813 45.313 52.0%
90 ProctG 12/30/94 31. 48.75 57.3%
91 MMM 3/31/95 58.125 83.0 42.8%
92 MMM 6/30/95 57.375 84.625 47.5%
93 UnTech 9/30/95 88.375 166. 87.8%
94 Exxon 12/30/95 40.25 64.063 59.2%
95 Sears 3/30/96 48.75 45.25 -7.2%
96 MMM 6/28/96 69.0 91.0 31.9% (tied)
JPMorgan 6/28/96 84.625 134.313 58.7% (tied)
97 IP 9/30/96 42.5 43.0 1.2%
98 MMM 12/31/96 83.0 73.688 -11.2%
99 IP 3/31/97 39.0 46.625 15.1%
100 IP 6/30/97 48.563 44.813 -7.7%
101 T 9/30/97 30,72 58.00 88.8%
102 JPMorgan 12/31/97 112.875 114.25 1.2%
103 T 3/11/98 43.833 48.93 +11.6%
104 EK 6/30/98 73.063 64.56 -11.6%
105 WMT 9/30/98 27.313 69.31 +153.8%
106 WMT 12/31/98 40.719 69.31 +70.2%
107 WMT 3/31/99 46.094 69.31 +50.4%
108 WMT 6/30/99 48.25 69.31 +43.6%
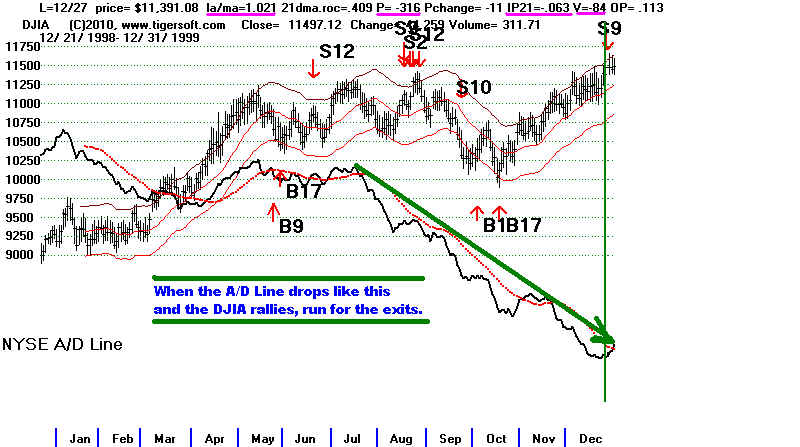
On 12/27/1999 a fourth major Sell signal appeared.
The NYSE downtrendline showed how bearish the market
was then. Most stocks were already in an unannounced
bear market. Time to sell all Tahiti stocks and
go to sidelines, except for trading.
76 Merck 3/28/91 35.163 43.375 23.4%
77 Merck 6/28/91 38.704 35.375 -8.6%
78 Goodyr 9/30/91 21.938 42.5 93.7%
79 Merck 12/31/91 55.494 30.75 -44.6%
80 MMM 6/30/92 48.5 49.5 2.1%
81 UnionCa 9/30/92 13.125 26.5 101.9%
82 UnionCa 12/31/92 16.625 34.0 104.5%
83 UnionCa 3/31/93 18. 29.375 63.2%
84 UnionCa 6/30/93 19.25 30.625 59.1%
85 UnionCa 9/30/93 19.375 33.5 72.9%
86 UnionCa 12/31/93 22.375 39.75 77.7%
87 UnionCa 3/31/94 22.5 37.5 66.7%
88 Texaco 6/30/94 60.375 85.75 42.0%
89 ProctG 9/30/94 29.813 45.313 52.0%
90 ProctG 12/30/94 31. 48.75 57.3%
91 MMM 3/31/95 58.125 83.0 42.8%
92 MMM 6/30/95 57.375 84.625 47.5%
93 UnTech 9/30/95 88.375 166. 87.8%
94 Exxon 12/30/95 40.25 64.063 59.2%
95 Sears 3/30/96 48.75 45.25 -7.2%
96 MMM 6/28/96 69.0 91.0 31.9% (tied)
JPMorgan 6/28/96 84.625 134.313 58.7% (tied)
97 IP 9/30/96 42.5 43.0 1.2%
98 MMM 12/31/96 83.0 73.688 -11.2%
99 IP 3/31/97 39.0 46.625 15.1%
100 IP 6/30/97 48.563 44.813 -7.7%
101 T 9/30/97 30,72 58.00 88.8%
102 JPMorgan 12/31/97 112.875 114.25 1.2%
103 T 3/11/98 43.833 48.93 +11.6%
104 EK 6/30/98 73.063 64.56 -11.6%
105 WMT 9/30/98 27.313 69.31 +153.8%
106 WMT 12/31/98 40.719 69.31 +70.2%
107 WMT 3/31/99 46.094 69.31 +50.4%
108 WMT 6/30/99 48.25 69.31 +43.6%
On 12/27/1999 a fourth major Sell signal appeared.
The NYSE downtrendline showed how bearish the market
was then. Most stocks were already in an unannounced
bear market. Time to sell all Tahiti stocks and
go to sidelines, except for trading.
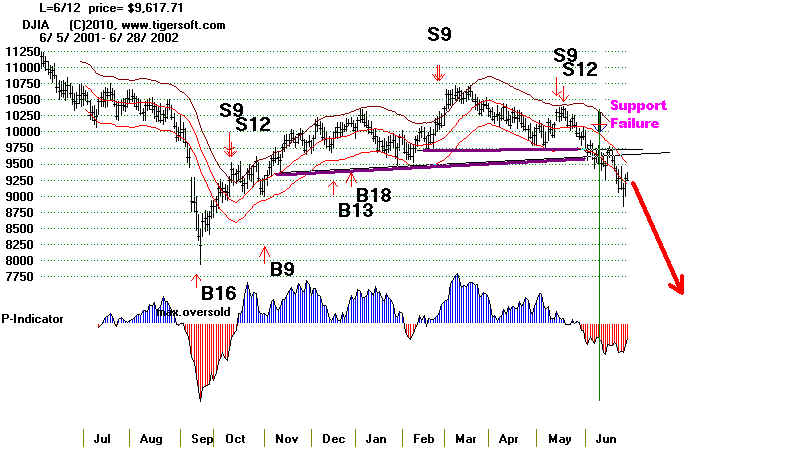
 Peerless Major Buy Signal in September 2001 after extreme
sell-off starts Tahiti's Buying again. But on 6/21/2002,
the DJI broke ket support folwing several separate major
Sells.This was the point to sell out Tahiti posiitons.
The chart is shown further below.
108 AA 9/30/01 31.01 39.68
109 JNJ 12/31/01 59.1 55.71 -5.9%
3/28/02 ...No stocks qualify
110 KO 6/28/02 56.0 53.01 -5.3%
After next leg down, New Peerless major Buy B9 on
7/24/2003 should get Tiger users to start buying again.
111 9/31/02 ...No stocks qualify
112 12/31/02 ...No stocks qualify
113 PG 3/31/03 44.53 55.08 +23.7%
114 PG 6/30/03 44.59 53.0 +18.9%
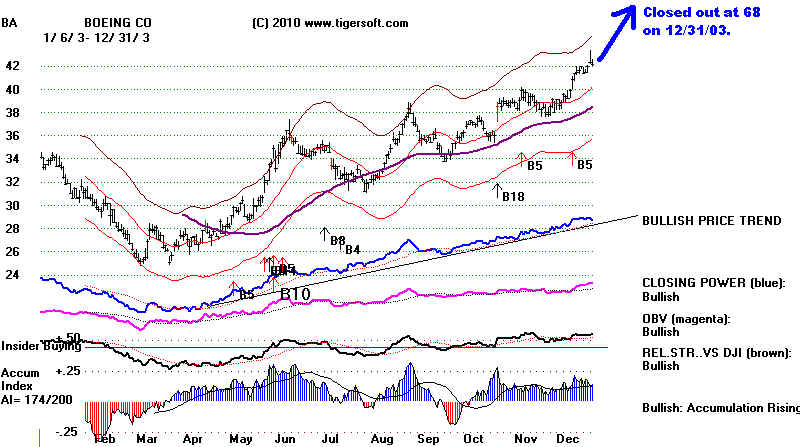
115 CAT 9/30/03 34.42 47.66 +38.5%
116 BA 12/31/03 42.14 67.95 +61.2%
Peerless Major Buy Signal in September 2001 after extreme
sell-off starts Tahiti's Buying again. But on 6/21/2002,
the DJI broke ket support folwing several separate major
Sells.This was the point to sell out Tahiti posiitons.
The chart is shown further below.
108 AA 9/30/01 31.01 39.68
109 JNJ 12/31/01 59.1 55.71 -5.9%
3/28/02 ...No stocks qualify
110 KO 6/28/02 56.0 53.01 -5.3%
After next leg down, New Peerless major Buy B9 on
7/24/2003 should get Tiger users to start buying again.
111 9/31/02 ...No stocks qualify
112 12/31/02 ...No stocks qualify
113 PG 3/31/03 44.53 55.08 +23.7%
114 PG 6/30/03 44.59 53.0 +18.9%
115 CAT 9/30/03 34.42 47.66 +38.5%
116 BA 12/31/03 42.14 67.95 +61.2%
 117 KO 3/31/04 50.30 40.31 -19.9%
118 KO 6/30/04 50.48 41.87 -17.1%
119 GE 9/30/04 33.50 32.96 -1.6%
120 GE 12/31/04 36.50 35.30 -3.3%
121 XOM 3/31/05 59.60 76.63 +28.6%
122 HPQ 6/30/05 23.31 40.00 +71.6%
123 HPQ 9/30/05 29.20 44.62 +52.8% (pre-split)
124 HPQ 12/30/05 28.63 49.79 +73.9%
125 HPQ 3/31/06 32.90 50.48 +53.4%
51.84 (4th major Sell - 12/7/2007)
126 HPQ 6/30/06 31.68 45.66 +44.1%
51.84 (4th major Sell - 12/7/2007)
127 PG 9/30/06 61.93
74.12 (4th major Sell - 12/7/2007)
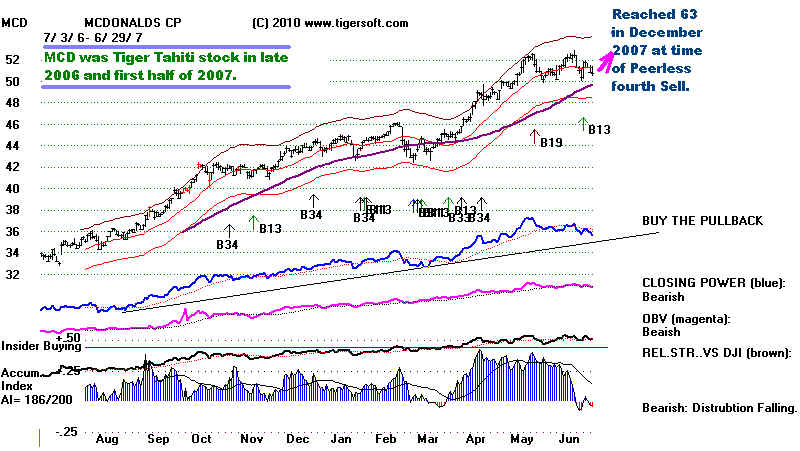
128 MCD 12/31/06 44.33
60.16 (4th major Sell - 12/7/2007)
129 MCD 3/31/07 45.05
60.16 (4th major Sell - 12/7/2007)
130 MCD 6/30/07 50.76
60.16 (4th major Sell - 12/7/2007)
131 XOM 9/28/07 92.56 at July peak.
91.50 (4th major Sell - 12/7/2007)
(XOM 12/31/07 93.69
Multiple Peerless Sells and support failure. Wait a quarter.)
132 XOM 3/31/08 84.58
(CVX 6/30/08 99.13
Multiple Peerless Sells and support failure. Wait a quarter.)
(XOM 9/30/08 84.58
Multiple Peerless Sells, support failure DJI down a quarter.
Wait until 65-dma turns up.)
(XOM 12/31/08 79.83
Multiple Peerless Sells, support failure DJI down a quarter.
Wait until 65-dma turns up.)
(IBM 3/31/09 96.89
AI/200 was only 110. This is too low to qualify.)
On 5/9/09 the 65-day ma turned up. Our TigerSoft
Hotline became quite bullish. Resume buying the
highest AI/200 stock in the DJI or, better yet,
since HPQ was a technology stock, buy the highest
AI/200 stock in the NASDAQ-100 or SP-500 which was
also a technology stock. After a severe sell-off,
with the 65-day ma rising again, we can relax
our AI/200 rules requiring at least an AI/200
score of 130..
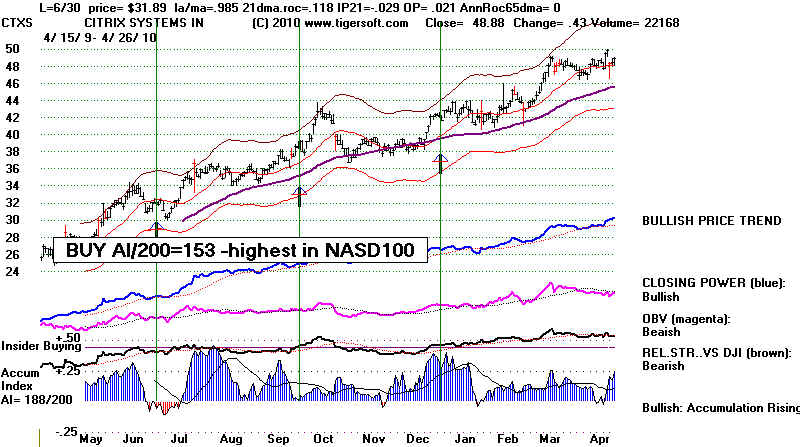
133 HPQ 6/30/09 36.68 AI/200=128
also high AI/200 in technology were:
CTXS 32.26 - AI/200=153
AAPL 12.83 - AI/200=179 (computers, like HPQ)
134 HPQ 9/30/08 47.21 AI/200=167
also high AI/200 in technology were:
CTXS AI/200=175 39.23
DELL AI/200=166 15.26
AAPL AI/200=150 185.35
117 KO 3/31/04 50.30 40.31 -19.9%
118 KO 6/30/04 50.48 41.87 -17.1%
119 GE 9/30/04 33.50 32.96 -1.6%
120 GE 12/31/04 36.50 35.30 -3.3%
121 XOM 3/31/05 59.60 76.63 +28.6%
122 HPQ 6/30/05 23.31 40.00 +71.6%
123 HPQ 9/30/05 29.20 44.62 +52.8% (pre-split)
124 HPQ 12/30/05 28.63 49.79 +73.9%
125 HPQ 3/31/06 32.90 50.48 +53.4%
51.84 (4th major Sell - 12/7/2007)
126 HPQ 6/30/06 31.68 45.66 +44.1%
51.84 (4th major Sell - 12/7/2007)
127 PG 9/30/06 61.93
74.12 (4th major Sell - 12/7/2007)
128 MCD 12/31/06 44.33
60.16 (4th major Sell - 12/7/2007)
129 MCD 3/31/07 45.05
60.16 (4th major Sell - 12/7/2007)
130 MCD 6/30/07 50.76
60.16 (4th major Sell - 12/7/2007)
131 XOM 9/28/07 92.56 at July peak.
91.50 (4th major Sell - 12/7/2007)
(XOM 12/31/07 93.69
Multiple Peerless Sells and support failure. Wait a quarter.)
132 XOM 3/31/08 84.58
(CVX 6/30/08 99.13
Multiple Peerless Sells and support failure. Wait a quarter.)
(XOM 9/30/08 84.58
Multiple Peerless Sells, support failure DJI down a quarter.
Wait until 65-dma turns up.)
(XOM 12/31/08 79.83
Multiple Peerless Sells, support failure DJI down a quarter.
Wait until 65-dma turns up.)
(IBM 3/31/09 96.89
AI/200 was only 110. This is too low to qualify.)
On 5/9/09 the 65-day ma turned up. Our TigerSoft
Hotline became quite bullish. Resume buying the
highest AI/200 stock in the DJI or, better yet,
since HPQ was a technology stock, buy the highest
AI/200 stock in the NASDAQ-100 or SP-500 which was
also a technology stock. After a severe sell-off,
with the 65-day ma rising again, we can relax
our AI/200 rules requiring at least an AI/200
score of 130..
133 HPQ 6/30/09 36.68 AI/200=128
also high AI/200 in technology were:
CTXS 32.26 - AI/200=153
AAPL 12.83 - AI/200=179 (computers, like HPQ)
134 HPQ 9/30/08 47.21 AI/200=167
also high AI/200 in technology were:
CTXS AI/200=175 39.23
DELL AI/200=166 15.26
AAPL AI/200=150 185.35
 134 HPQ AI/200=184 12/31/09 51.51
CTXS AI/200=182 41.61
AAPL AI/200=147 210.73
135 HPQ AI/200=177 3/31/10 53.15
CTXS AI/200=179 47.47
AAPL AI/200=129 235.00
134 HPQ AI/200=184 12/31/09 51.51
CTXS AI/200=182 41.61
AAPL AI/200=147 210.73
135 HPQ AI/200=177 3/31/10 53.15
CTXS AI/200=179 47.47
AAPL AI/200=129 235.00
TAHITI with Peerless Rules:
1) SELL Tiger's Tahiti System's Stocks after Four Peerless Major Sells.
2) A Breaking of Key Support Shows A Bear Market Has Started.
3) Do Not Use Tiger's Tahiti System after a 40% DJIA Decline in 10 Months
Back-testing shows that four major Sell in 8 months should be treated as an automatic Sell.
Three major Peerless Sell signals and a support failure are also an automatic Sell.
The pattern of multiple Peerless Sell signals and a support failure is deadly for the stock
market. There are few exceptions to this rule since 1928. 1977 is the single big exception.
After the support failure, wait for a Peerless major Buy and then Buy at the end of the next
quarter. If the DJI is down more than 40% from it's high, become even more cautious.
Wait for the 65-day ma to turn up and then buy again at the end of the quarter..
Below are all the cases since 1966 of multiple Peerless Sells and A Support Failure.:
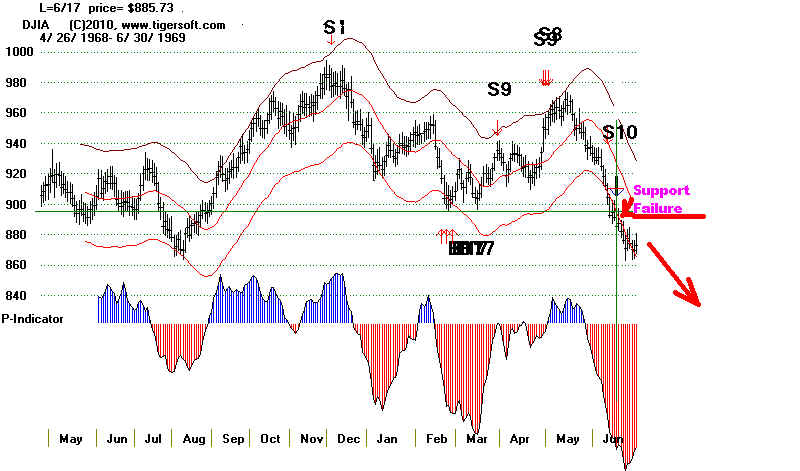
Three Major Sells and Support Failure in June 1969
Earlier Major Sells in Previous 6 months Major Support Failure Subsequent Decline Reached
-------------------------------------------- ----------------------- ------------------------------
S1 (12/1/68), S9 (3/28/68), S9 (4/30/69) 6/17/69 - 886 5/26/70 - 631
S8 (5/2/69), S19 (6/11/69)
-----------------------------------------------------------------------------------------------------------
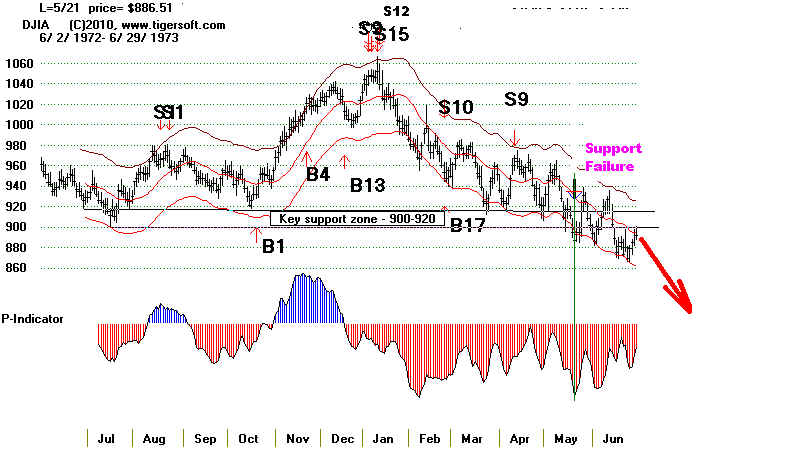
Fourth Major Sell in January
1973
Key Support Failure in May 1973
Subsequent Low - 12/6/75 - 577.60
S9 (4/12/72), S12 (5/22/72), S9 (5/24/72)
S9 (5/30/72), S12
(8/3/72), S9 (8/4/72)
S9 (8/10/72). S1
(8/24/72), S15 (1/5/73)
S9 (1/8/73), S12
(1/12/73). S9(4/11/73)
----------------------------------------------------------------------------------------------------------
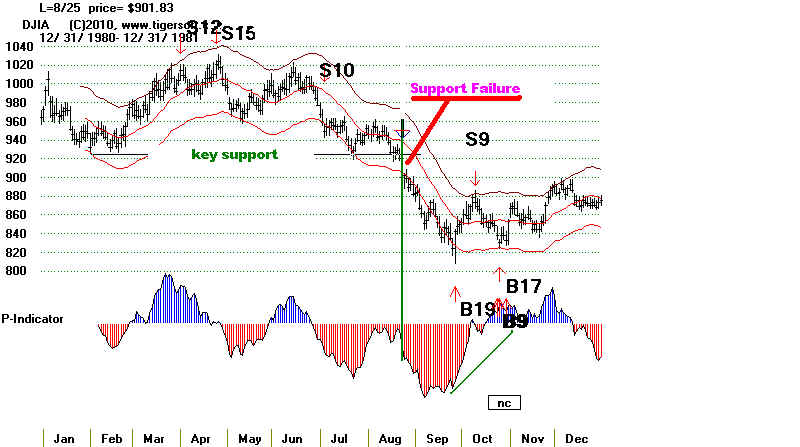
Fourth Major Sell in January 1981
Key Support Failure in August 1981 at
900
DJI subsequently fell to776.90 on 8/12/82
S2
(8/7/80), S1 (8/14/80), S9 (11/14/80)
S9 (11/19/80),
S12 (1/2/81), S9 (1/7/81)
S12 (4/1/81), S15
(4/24/81), S10 (7/6/81)
----------------------------------------------------------------------------------------------------------
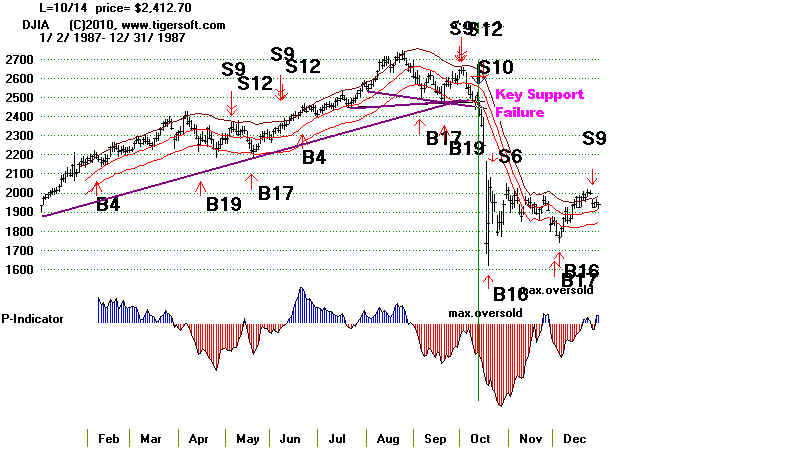
Fourth Major Sell in October 1987
Not shown below: 4/6/87 - la/ma=1.039 (high) P= -2
IP21=.187 - Dimminished
Sell S9
S12 (5/6/87), S12 (6/8/87), S9 (6/9/87), 10/14/87 - 2413
12/4/87 - 1766.74
S9 (10/1/87), S12 (10/2/87).
S10(10/16/87)
-----------------------------------------------------------------------------------------------------------
Fourth Major Sell in May 2002
Key Support Failure in June
2002 - 6/12/02 - 9618
Subsequent DJI Bottom -10/9/02 - 7728.27
S9 (12/28/99), S15(1/7/00), S4 (1/11/00),
S1 (4/6/00), S12 (7/17/00),
S12 (12/8/00),
S8 (12/28/00), S12 (4/10/01),
S9 (4/11/01)
S9 (4/16/01), S4 (5/17/01),
S12 (10/10/01)
S12 (10/11/01), 2/26/02 (S9),
S12 (5/14/02),
S9 (5/17/02)
--------------------------------------------------------------------------------------------------------
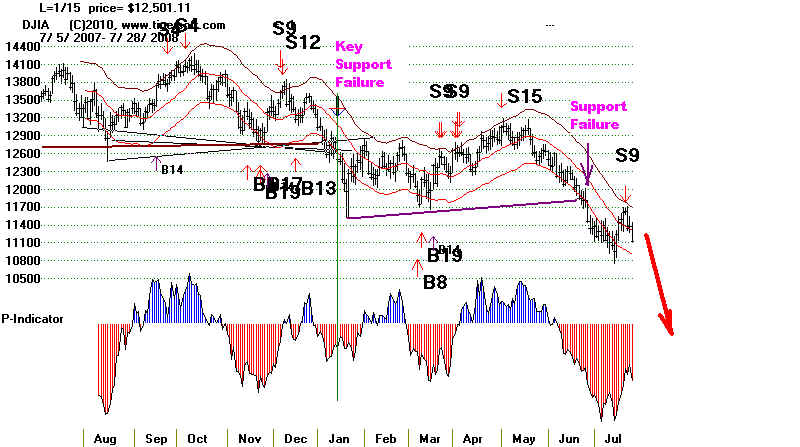
Fourth Major Sell in December
2007
Key Support Failure in January
2008 - 1/5/08 - 12501
Subsequent DJI Bottom -3/9/09 - 6547.05
In October 2009, the DJI fell more than 40% from
its high.
In these curcumstances, it is best to wait for the 65-day ma to turn up
and then buy at the end of the next quarter or when the 65-day ma
turns up.
S9 (7/17/07), S9 (7/23/07),
S4(10/5/07),
S12 ( 12/6/07), S9 (12/7/07)
DJI and Peerless Signals: 2007-2008
DJI and Peerless Signals:
2008-2009