How To Find Each Bull Market's
Explosive Super Stocks
Using TIGERSOFT
1990-2010


Stocks Usually Rise 100% To 2500% in Less Than A Year
after Showing:
1) Intense Insider Buying from Tiger's own Accum.Index,
2) Multiple TigerSoft Major Buys and
3) new highs by Tiger's Professional Closing Power.
"Tiger's Power Pattern"
Use TigerSoft and
Memorize These Stocks' Power Pattern if
You Want Make A Lot of Money
in The Stock Market
That 2009 showed 31 cases
was strong evidence that 2010 would be
a very good year.
Tiger's Explosive Super Stocks
(C) 2009, 2010 William Schmidt, Ph.D.
www.tigersoft.com

858-273-5900 william_schmidt@hotmail.com www.tigersoft.com
Original and unique software and its documentation are offered here by its author.
TigerSoft has been serving investing professionals and members of the public since 1981.
(C) 2009 William Schmidt, Ph.D, (Columbia University) - All Rights Reserved.
TigerSoft Charts - Simple, Easy and Very Profitable!
Contact us. We will answer these vital questions:
HOW TO KNOW WHEN A BEAR MARKET IS ABOUT TO BEGIN?
HOW TO FIND EXPLOSIVE SUPER STOCKS EARLY ON?
ARE INSIDERS BUYING OR SELLING MY STOCK?
ARE INSTITUTIONS AGGRESSIVELY BUYING OR SELLING MY STOCK?
WHAT IS THE BEST WAY TECHNICALLY TO TRADE MY STOCK?

TIGERSOFT STUDY OF AUGMENTED B24s: 1990-2006
In 2007, we used the TC-2000 data base and studied the track record of augmented Buy B24s
since 1990. Many of the stocks we saw flagged as buys at the time were no longer traded,
as many were bought out. That was part of the reason they were rising. So, the study considerably
under-estimates the value of TigerSoft's Power-Ranker. In addition, the gains vary a lot from
year to year. The Buys after there has been a big sell-off are both more numerous and
also more profitable.
-------------- EXPLOSIVE SUPER STOCKS --------------
TIGER SOFT's INSIDER WATCH SYSTEM
Track Record: 1990-2006:
36.2%/year: 1990-2007
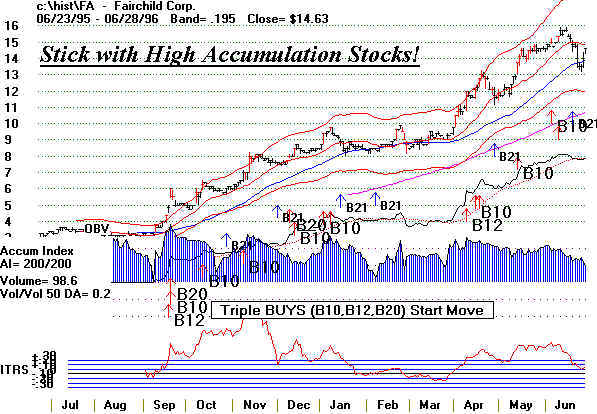
Buying Intensely Accumulated Stocks.
Buying only the most intensely accumulated stocks
as flagged by Tiger-Power-Ranker and holding simply one year:
2006 +27.7%
2005 +23.9%
2004 +40.9%
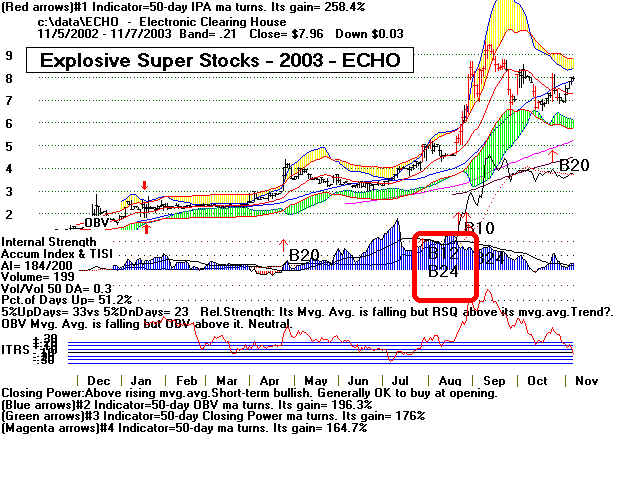
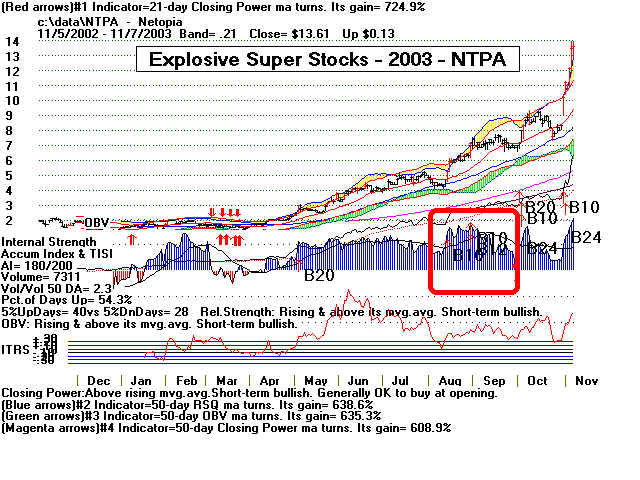
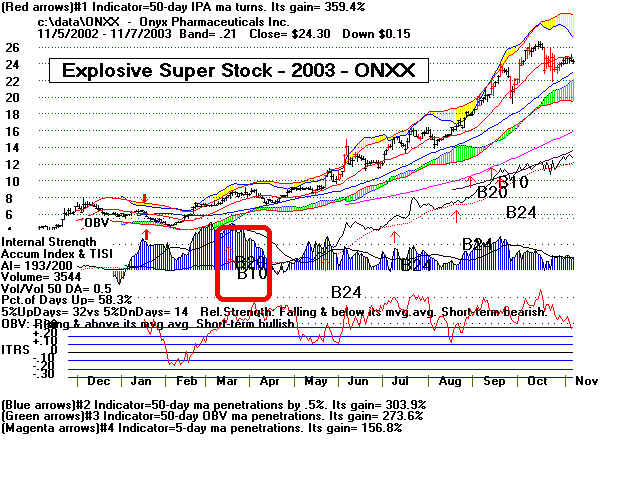
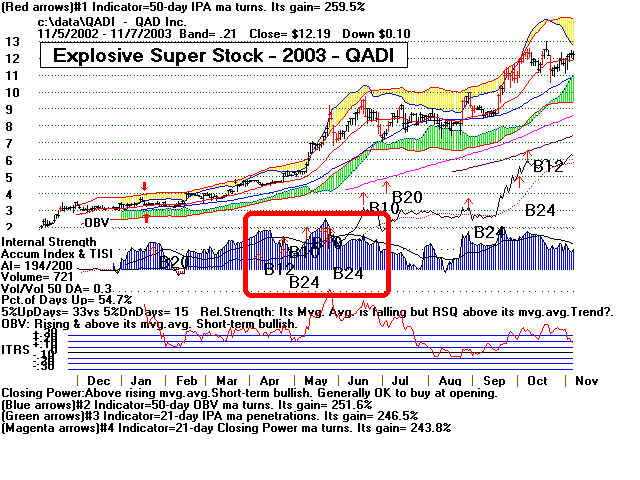
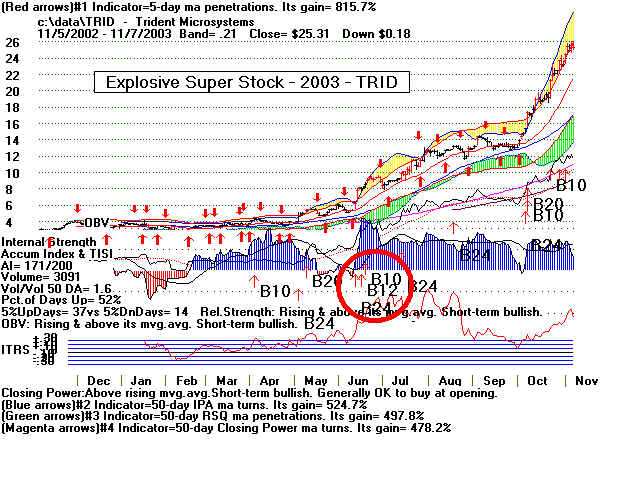
2003 +58.4%
2002 +19.0%
2001 + 1.0%
2000 +40.4%
1999 +175.6%
1998 -13.6%
1997 +7.3%
1996 +34.2%
1995 +37.5%
1994 +10.0%
1993 +14.0%
1992 +56.6%
1991 +29.6%
1990 +44.7%
--------------------------
Yearly Gain = +36.2% per stock
Note: the testing we did was to see what would be the result if we simply held these
augmented Buy B24s for a year. This would not normally be done We can do better
using the technicques we have learned from this study.
Avg.Gain Winning Trades Losing Trades Gains>100% Losses<-30%
1990 + 44.7% 3 1 1 1
1991 + 29.6% 10 4 2 1
1992 +56.6% 9 4 2 0 also a +91.8% gain
1993 +14.0% 11 9 3 1
1994 +10.0% 5 4 1 1
1995 +37.5% 12 4 2 2
1996 +34.2% 13 7 2 0 also a +93.8% gain
1997 + 7.3% 11 8 0 3 also a 91.9% and 87.3% gains
1998 -13.6% 1 6 0 1
1999 +175.6% 1 1 1 0
2000 +40.4% 4 2 1 1
2001 + 1.0% 10 10 0 2
2002 +19.0% 10 6 2 3
2003 +58.4% 38 6 9 2 also 3 gains over +80%
2004 +40.9% 18 7 3 2
2005 +23.9% 26 7 2 1
2006 incomplete
2007 incomplete
------------------------------------------------------------------------------------------------------
TOTALS 182 gainers 94 losses 31 big losses 21 big gainers
162 of the 276 trades would have been closed out profitably.
Only 31 of the 276 were up more than 100% after a year. Studying those
cases shows that the amount of Blue Accumulation is important, as well as
how much the stock has moved up from an oversold base.
The glorious gains in 2009 arise from the extreme oversold condition of
the market. Stock that break out of the gate first usually are the best performers.
The best such stocks are not easy to buy "cheaply.", If they do fall back, it
may be a trap.
IMPORTANT - Working with a simple 10% Stop Loss on these Explosive Super Stocks
raised the yearly average gain per stock to more than 55%. Using such a stop loss would
have eliminated very few of the explosive stocks below.
Important TigerSoft References
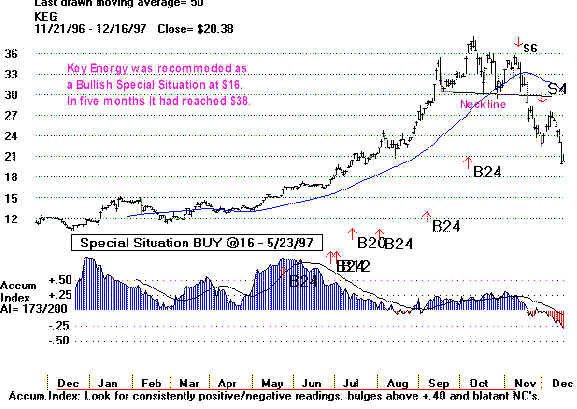
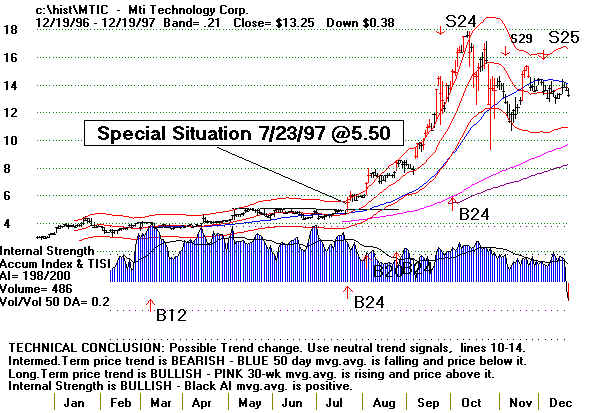
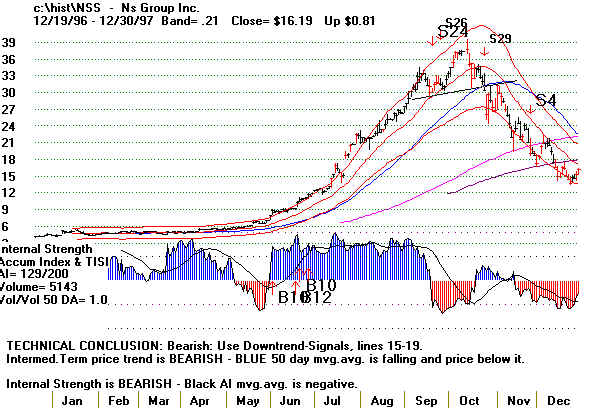
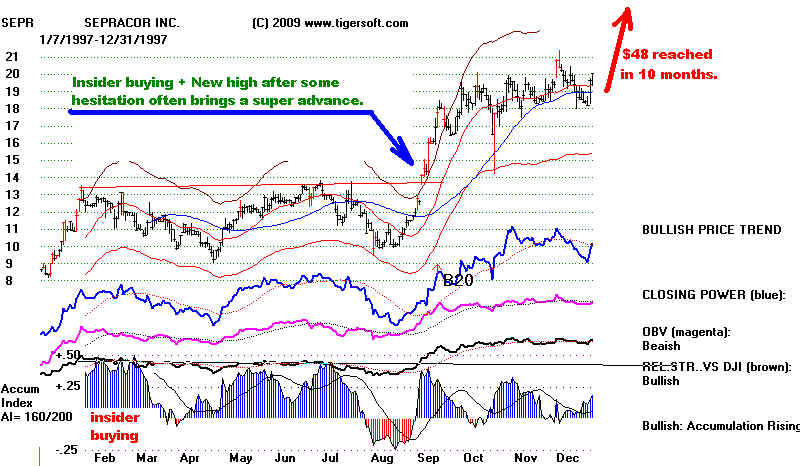
TigerSoft's
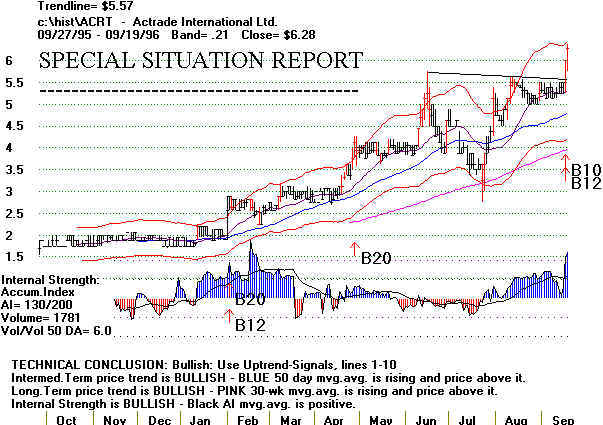
1997 Study of Bullish Special Situations
http://www.tigersoft.com/special/index.htm
Peerless Stock
Market Timing: 1915-2009
TigerSoft's POWER STOCK RANKER
($395 additional
When
Should One Sell An Explosive Super Stock?
WARNING: Many of these big gainers are boosted by stock
manipulators and have little merit
as long-term investments. We strongly suggest you use TigerSoft and Peerless Stock
Market
timing to recognize when to sell. Our books - Explosive Super Stocks and Killer
Short Sales
offer you our analysis and methods about how to pick the best stocks and know when to
sell.
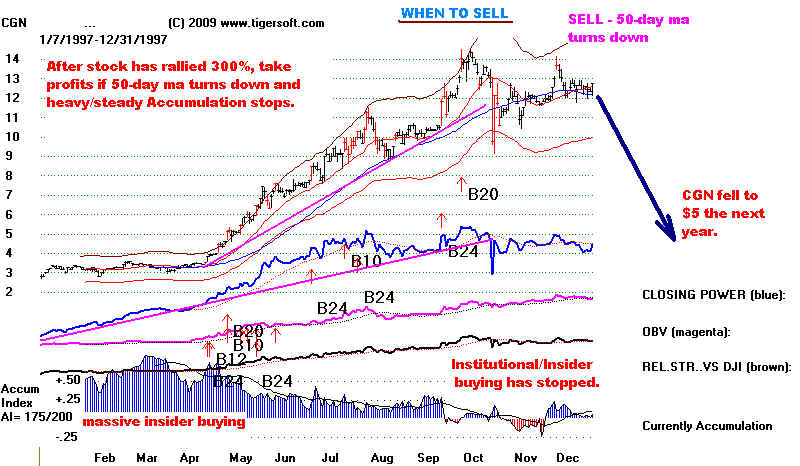
When Should One Sell An Explosive Super Stock?
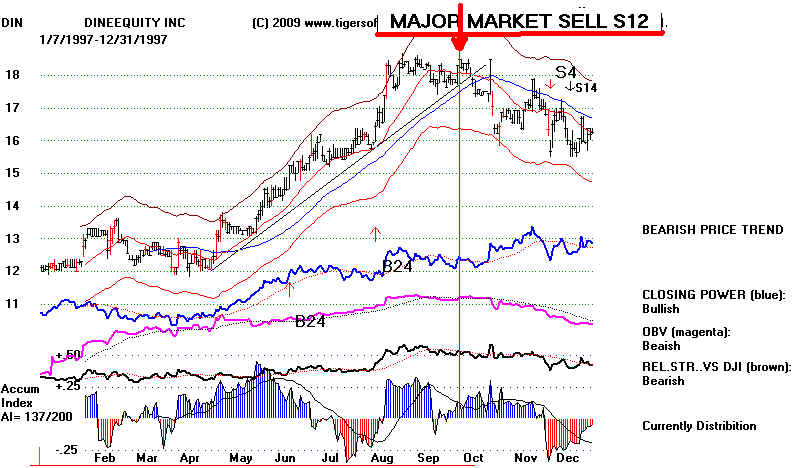
1) Watch for Peerless Major Sells on the overll market.
2) Watch for false rallies to new highs with the Tiger Accumulation Index negative.
3) Watch for turns down by the 50-day or 65-day ma with the Accumulation Index
no longer bullishly high and consistently positve.
4)
Watch for a falling Tiger Closing Power.
See our Blog
Bulls Should Be Able
To Spot The Red Warning Flags in Over-Priced Stocks.
=====================================================================================
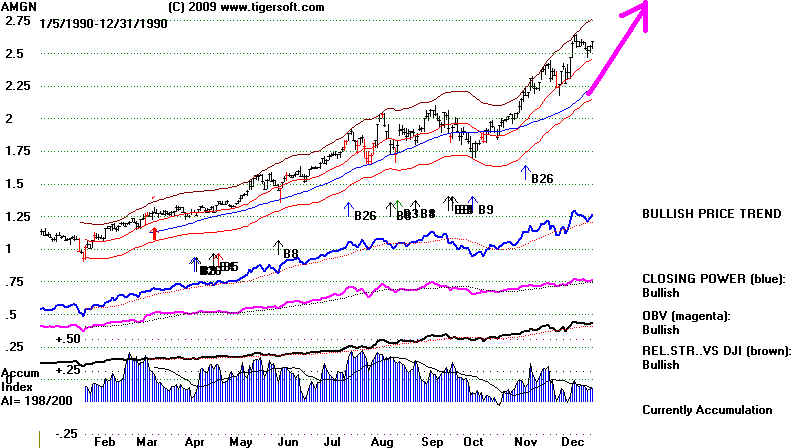
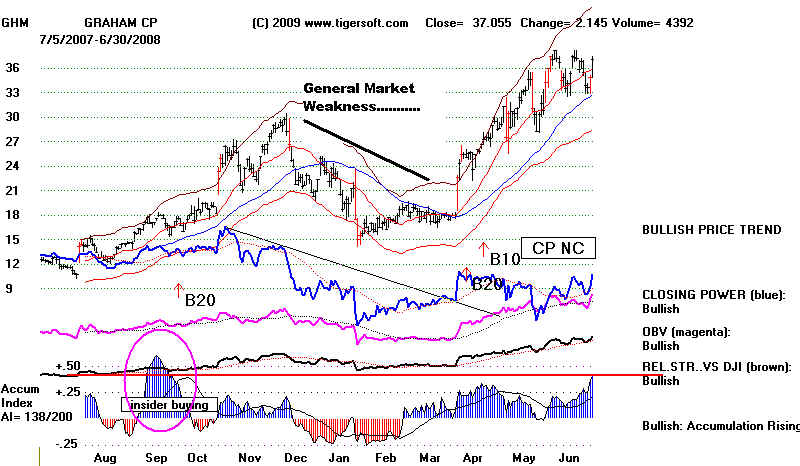
We think you will find our key TigerSoft
Accumulation Index and Tiger Closing
Power
Percent to be the best indicators you have ever worked with. Over and over
the year's best performing stocks show the same characteristics. Insiders always
know first. Bulges from TigerSoft's Accumulation Index and Closing Power Percent
spot light their buying.
When our Peerless gives a major Buy
after a long decline, use TigerSoft's
Power Ranker to find the new year's Explosive Super Stocks
Insider Trading is Rampant.
TIgerSoft Turns Insider Buying and Selling to Your Big Advantage.
Washington Won't Protect You. But TigerSoft Will.
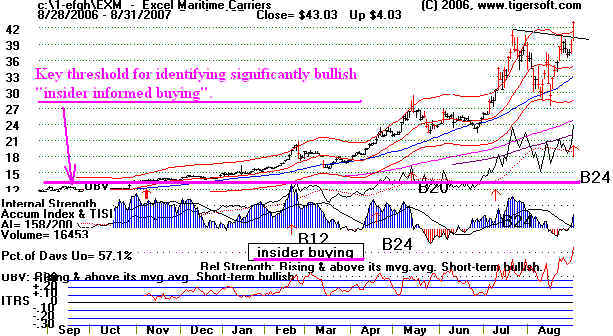
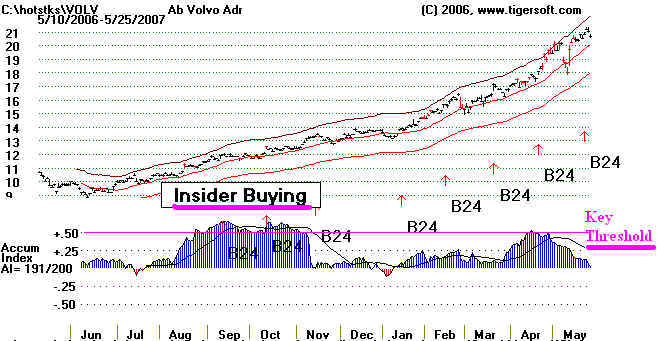
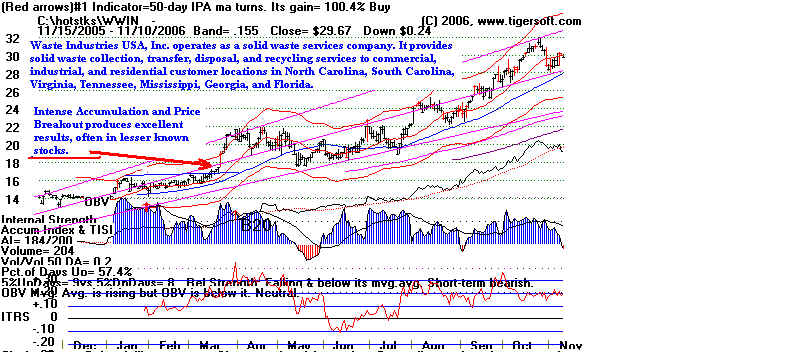
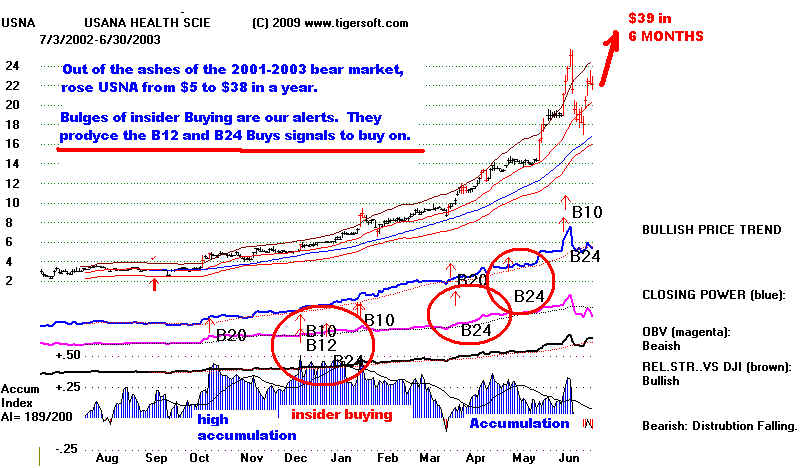
Intense insider Buying, as measured by
TigerSoft, regularly predicts the
biggest gainers in the stock market, just as insider selling invariably predicts
the worst individual stock declines. Look at the graphs we have provided here.
The TigerSoft chart's fixed-rule Buy B12s and B24s are the signals we urge
traders to act on. Insiders always know!
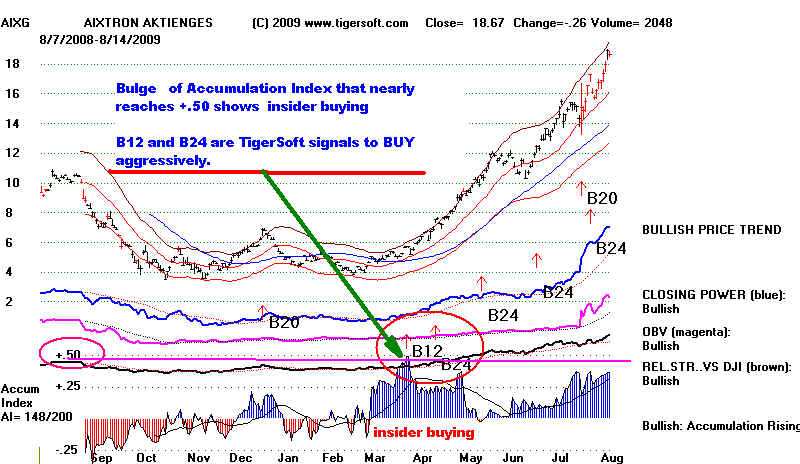
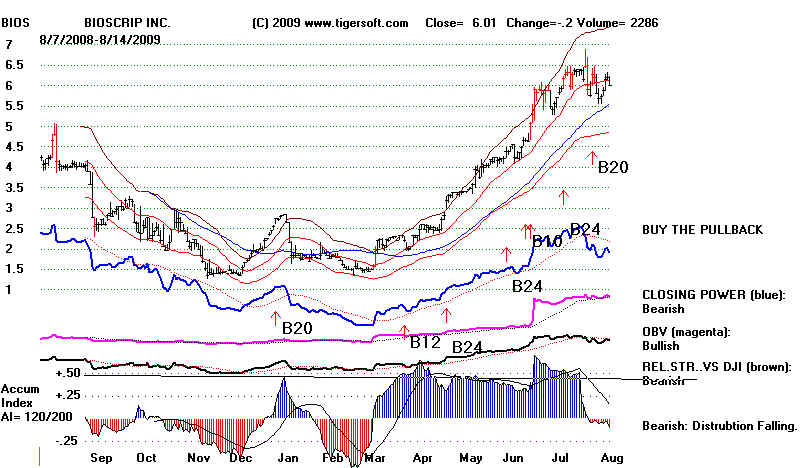
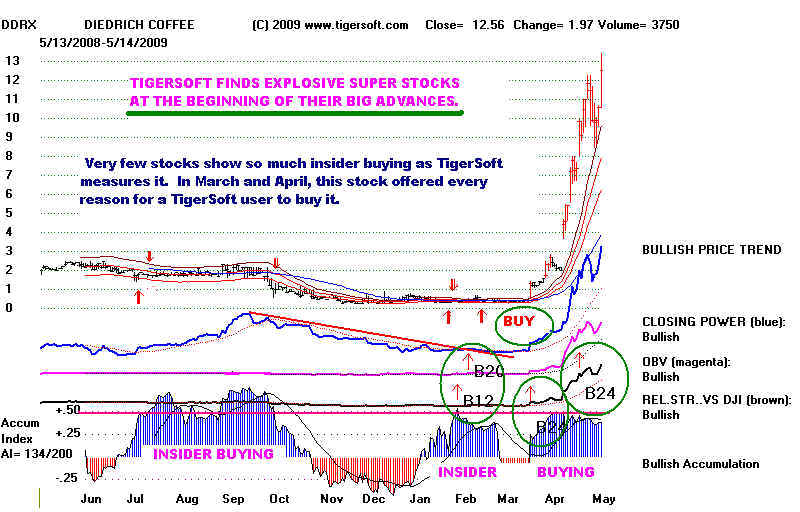
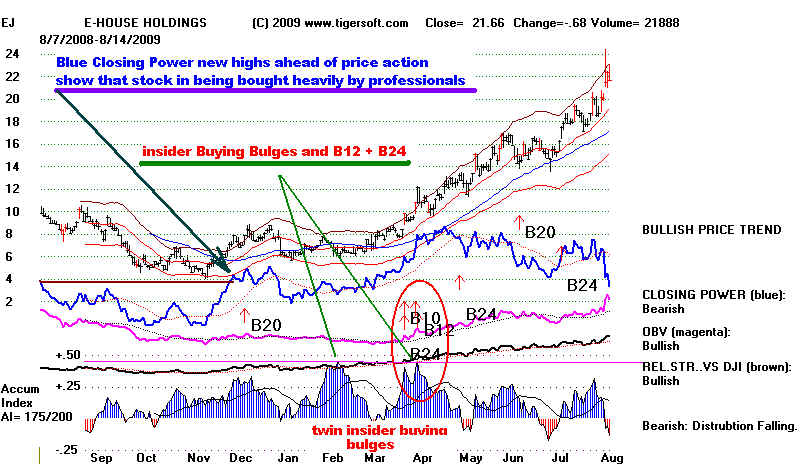
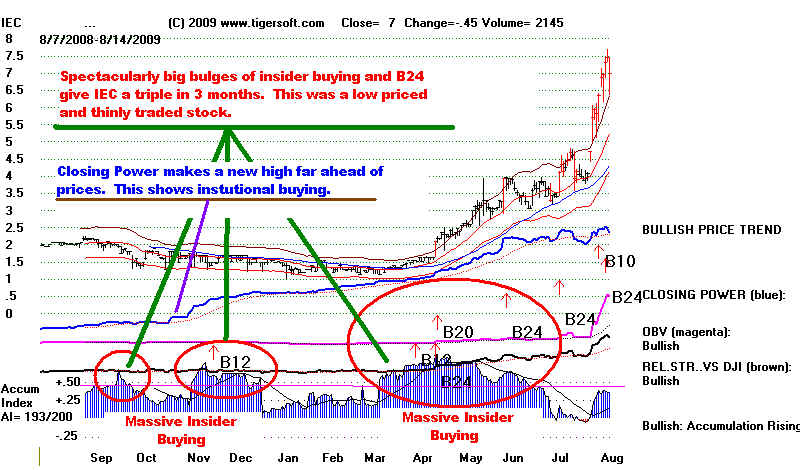
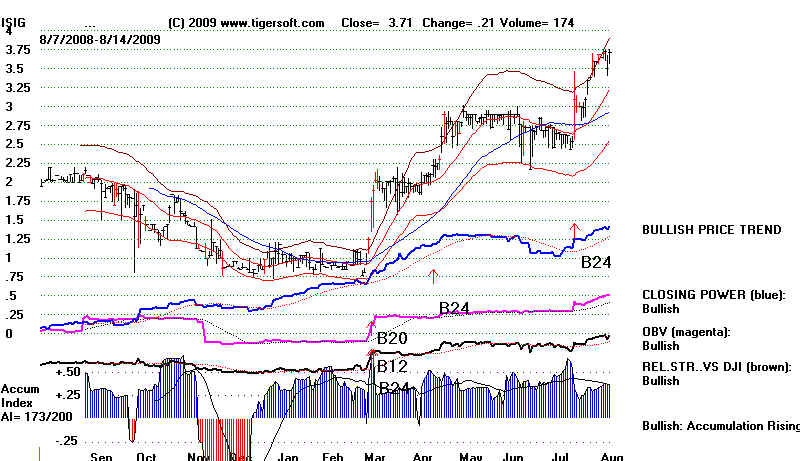
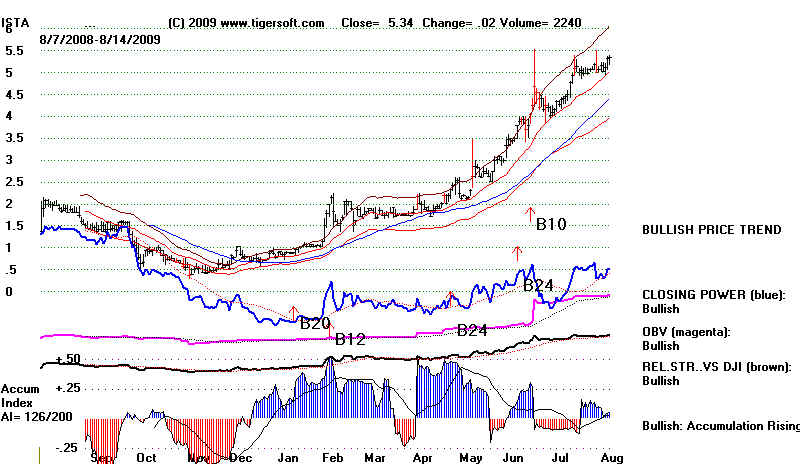
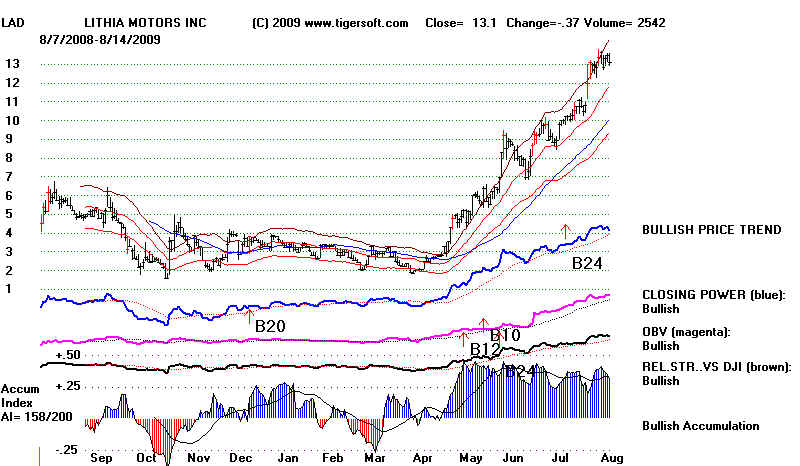
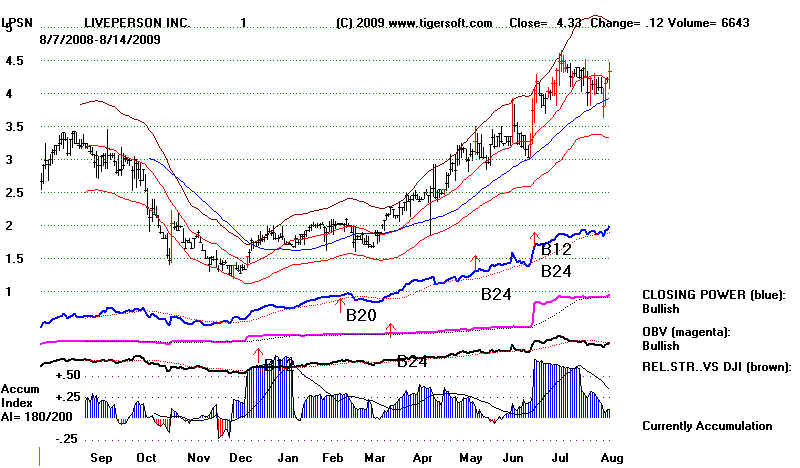
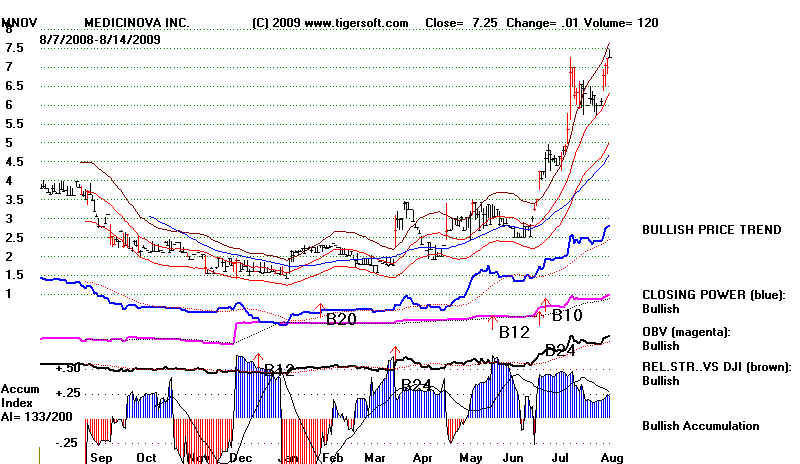
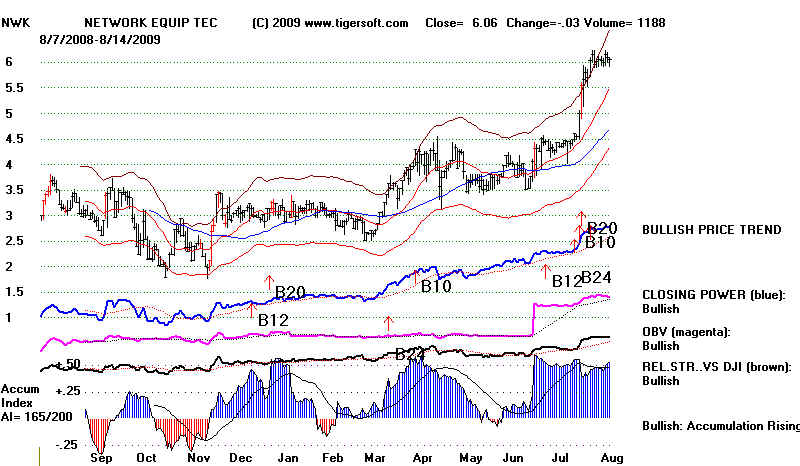
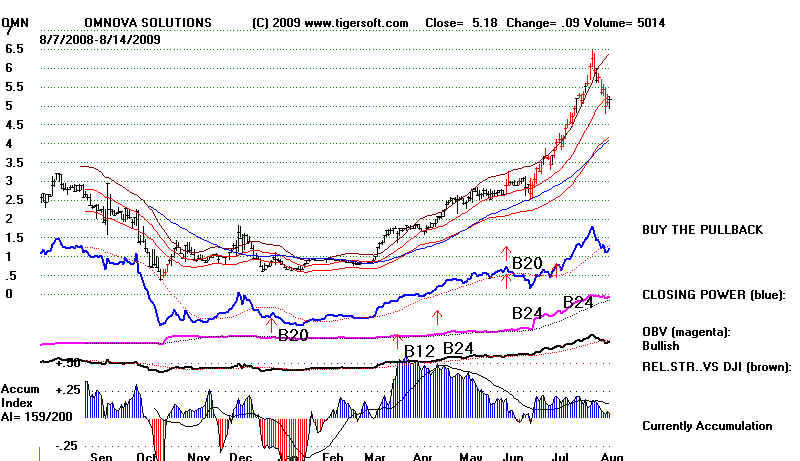
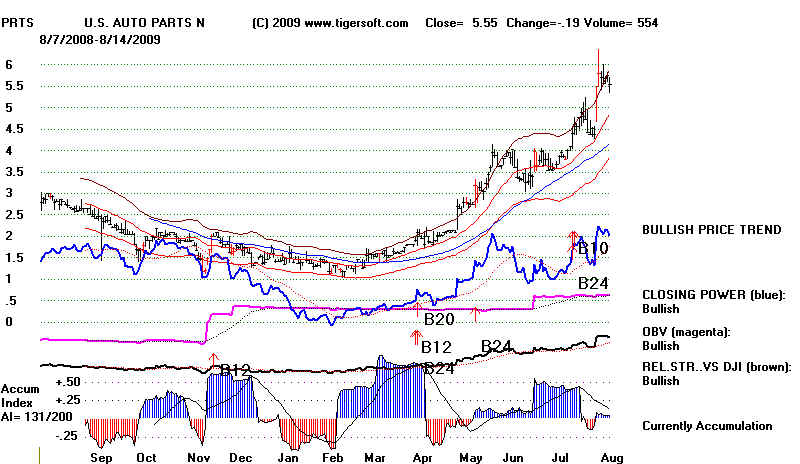
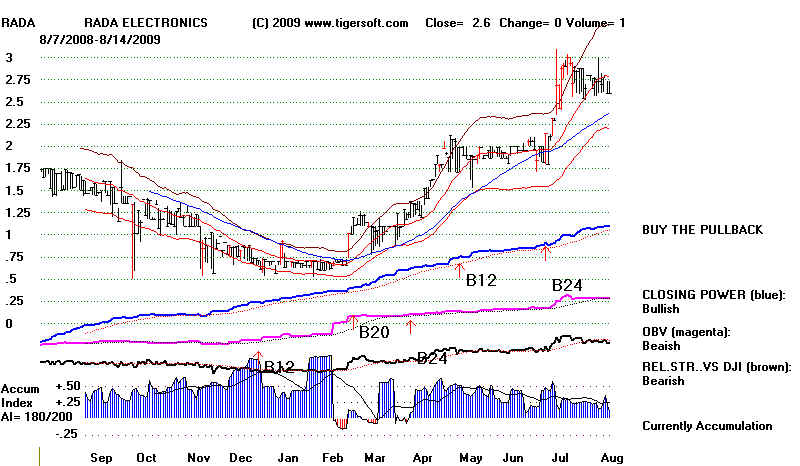
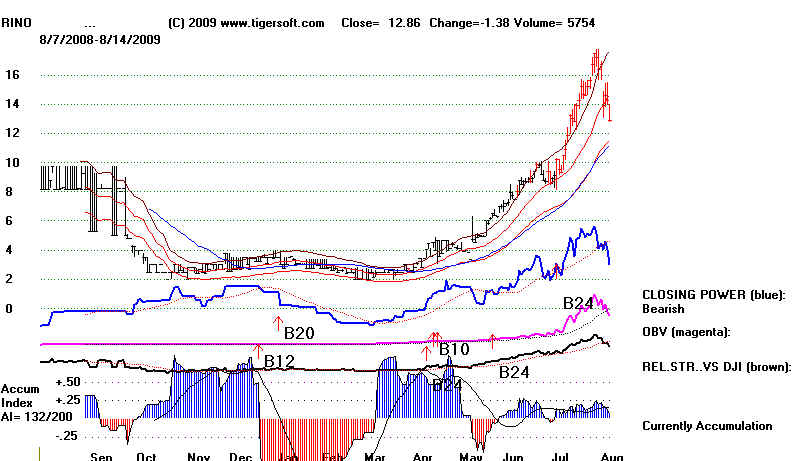
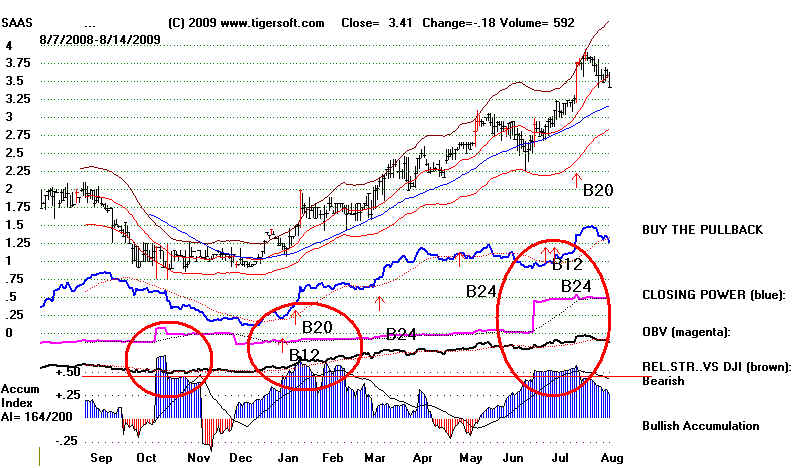
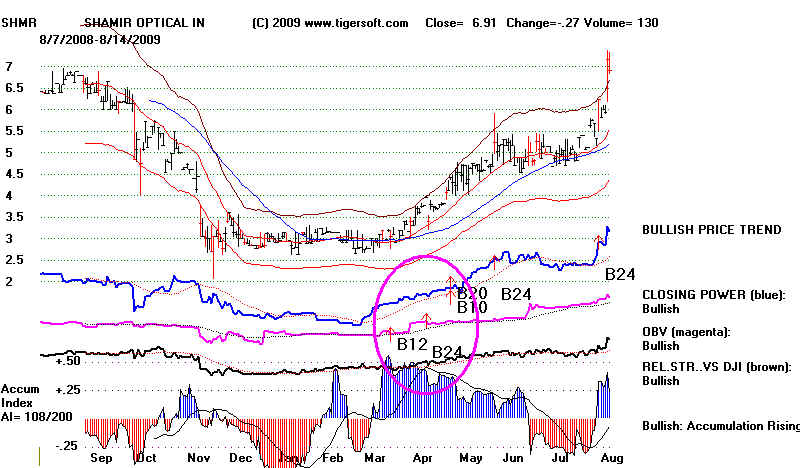
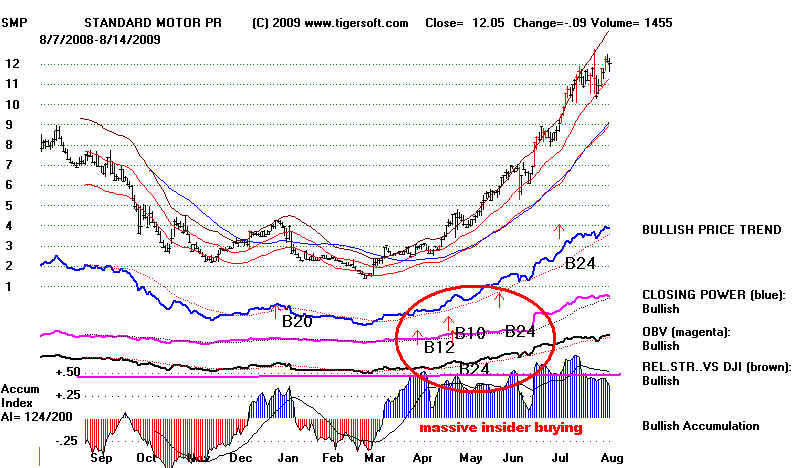
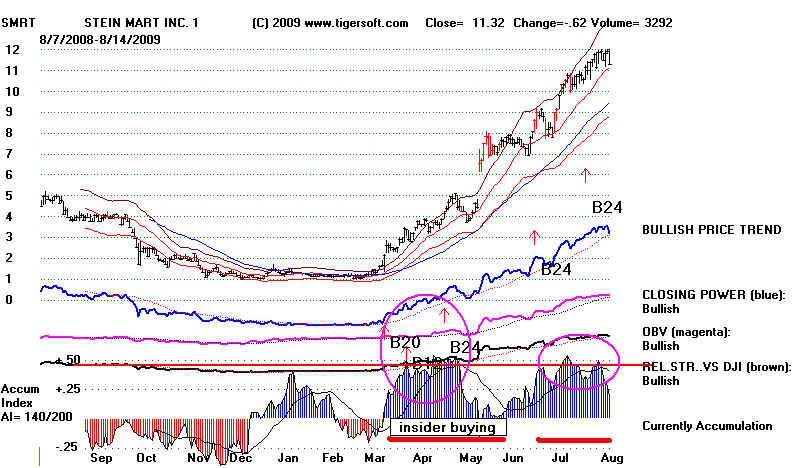
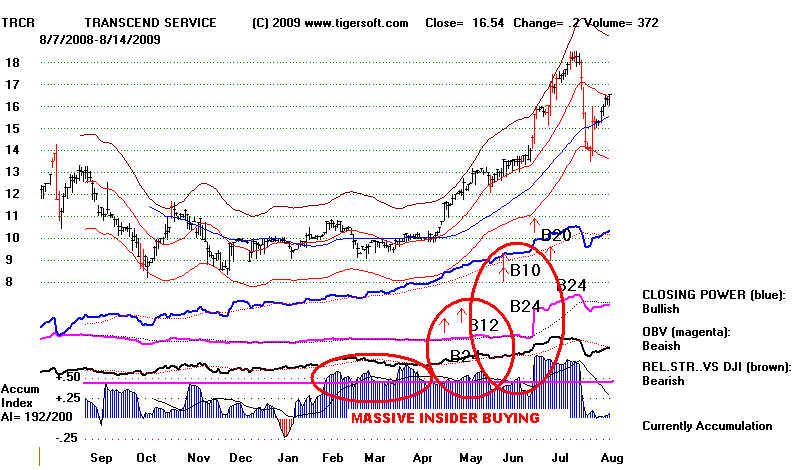
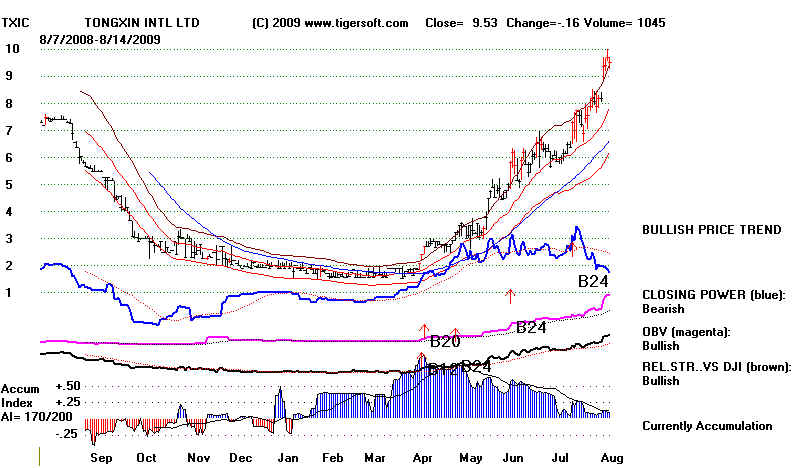
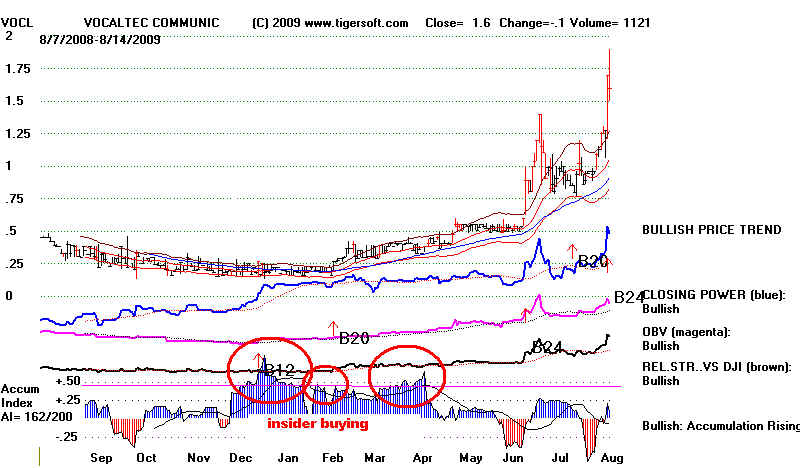
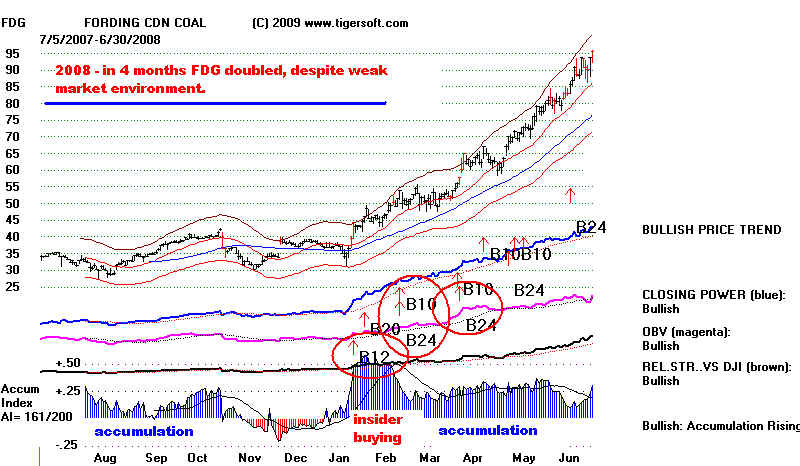
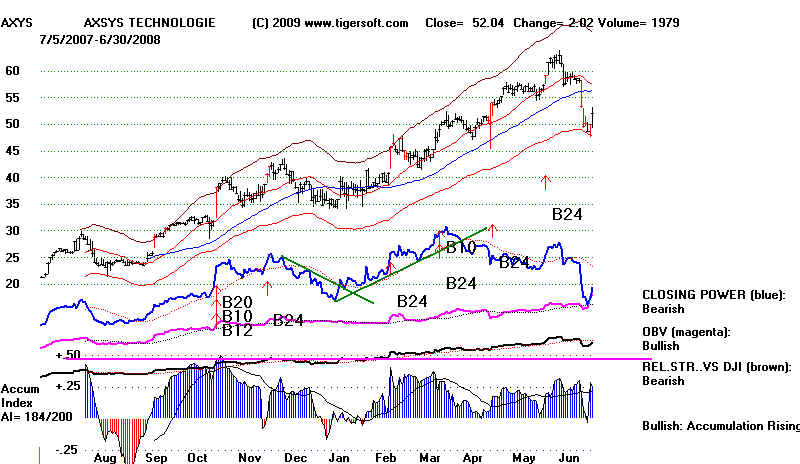
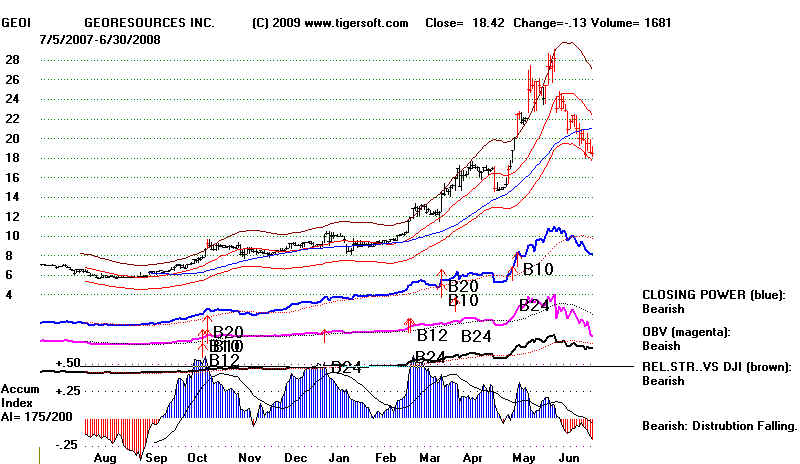
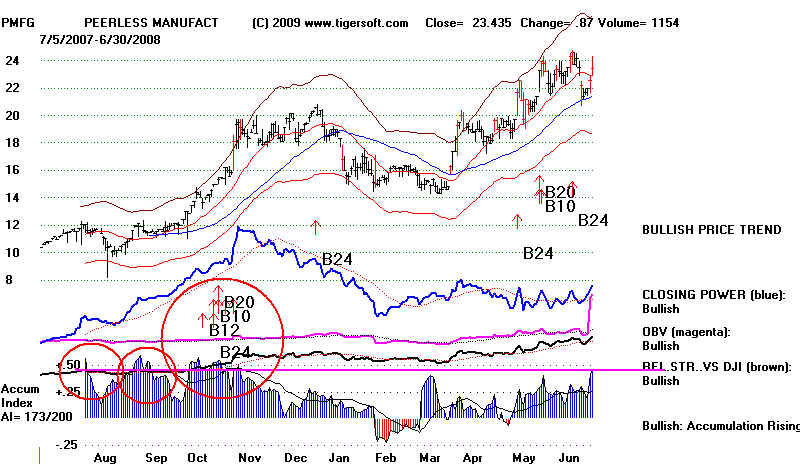
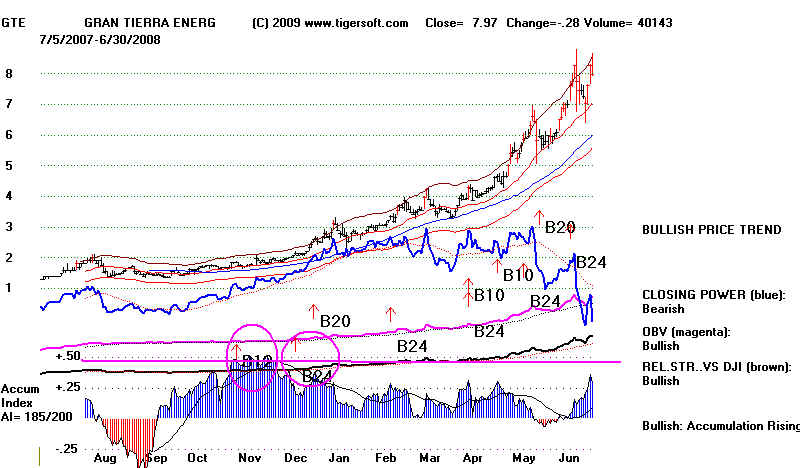
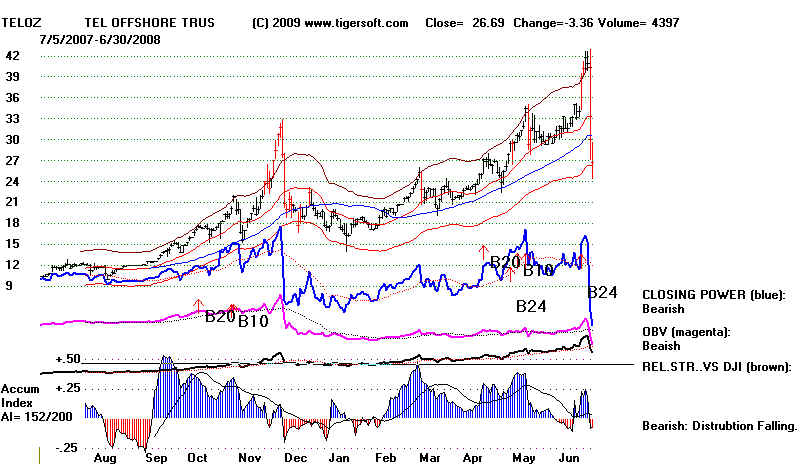
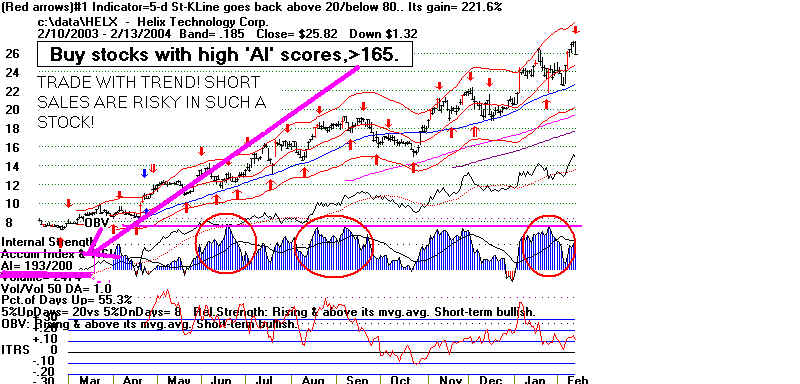
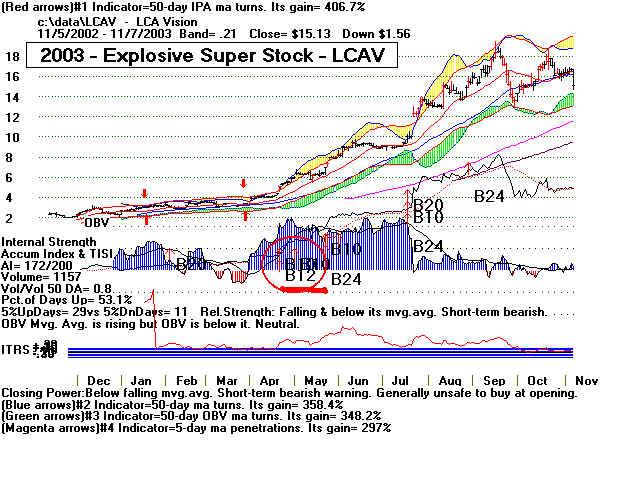
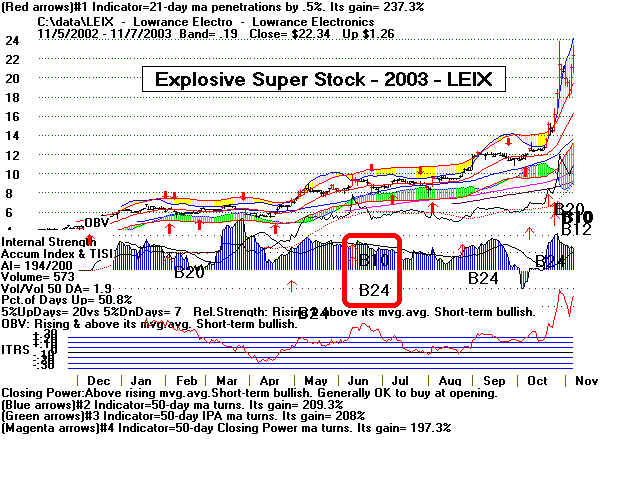
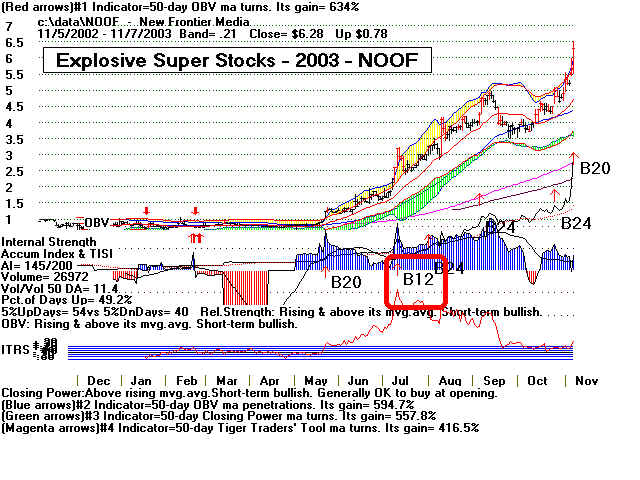
EXPLOSIVE SUPER STOCKS: Eaxh of these
was detected by intense
insider buying as measured by TigerSoft's Accumulation Index and subsequent
automatic TigerSoft Buy B12 or B24.
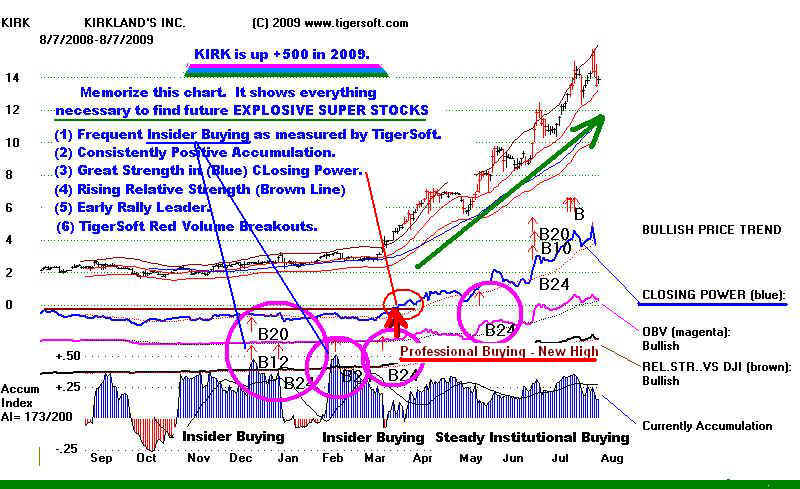
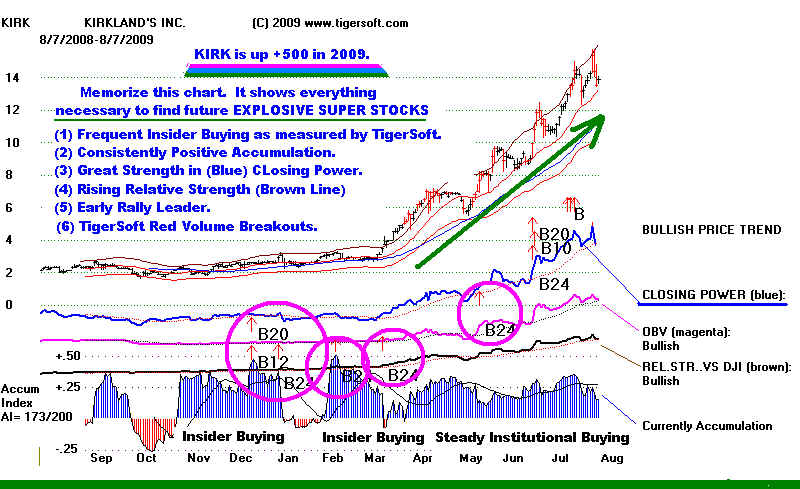
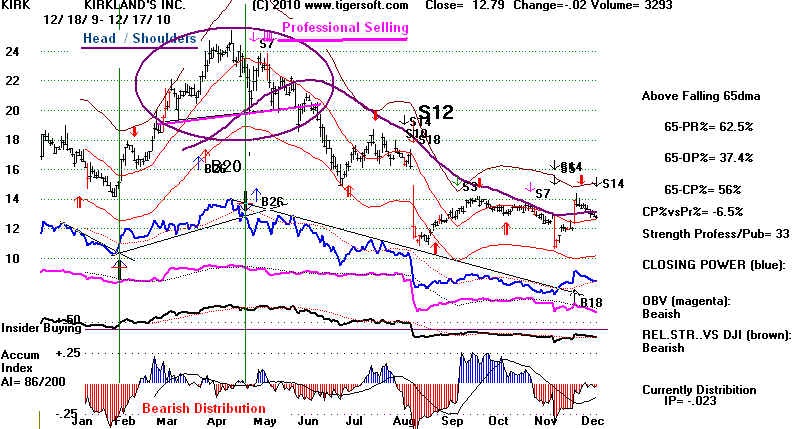
KIRK - Is An "Ideal
Type" - A Perfect Example Showing
What We Search for with TigerSoft

Not show here, AIXG hit 37 in November 2009.
BIOS hit 9 in December 2009. In 2010, Professionals and Insiders both
took profits and the stock fell back to 4.
There is even more insider buying with DDRX (below) and the outcome is spectacular
when the general market turns up after March 10th, 2009.
DDRX was bought out at $35. This was biggest gainer between 2009
and early 2010.
DTG $2.00 to $51.00 in 14 Months!
This was an ideal take-off.
DTG was waiting for the general market to stop falling in March 2009,
to begin its own advance. The Peerless Buy signal on March 10th was a
green light for this classic explosive super stock. By April 2010, ir had soared
to 51.
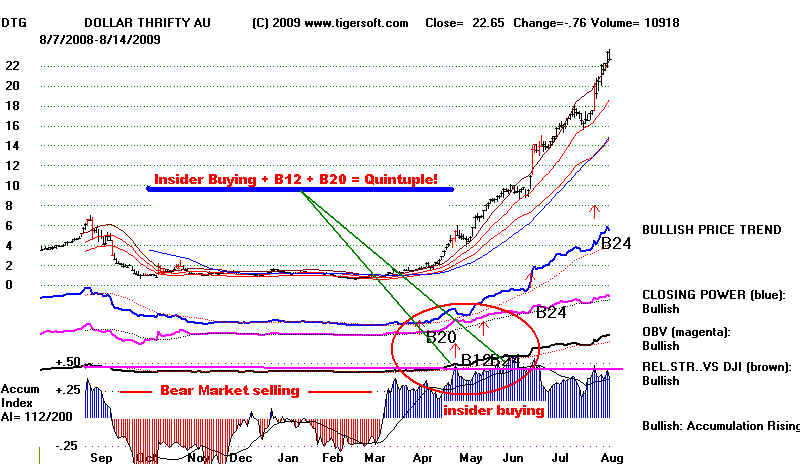
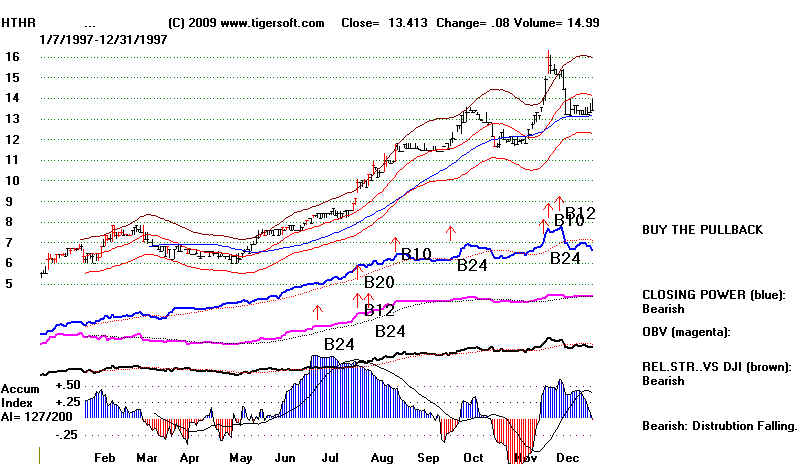
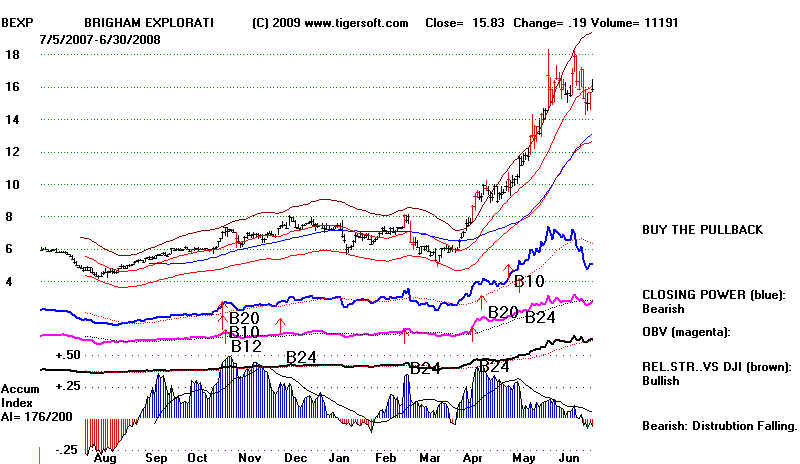
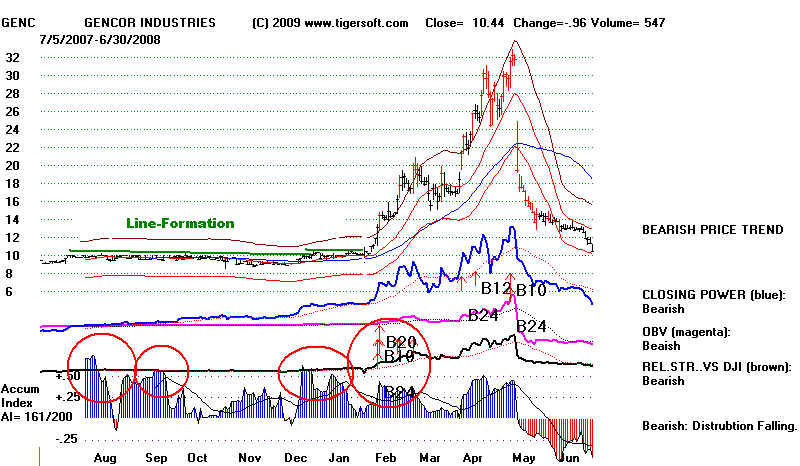
HOW TO WATCH FOR A TOP.
The last few days of the chart shown below show a new high that it negatively unconfirmed by
the TigerSoft Accumulation Index and a declining Closing Power. This is bearish enough to
justify profits be taken, especially with the often bearish month of September nearing.
A year later the stock had fallen to 13.
The Top.
----------------------------------------------------------------------------------------------------------------------------
ANOTHER PERFECT TAKE-OFF.
FIRE peaked at 32 in October 2010

====================================================================================
GMTN - Ordinarily, we let a stock run without trying to sell it very quickly when the
stock shows a confirmed Buy B12/B24. But if there has been a Closing Power
non-confirmation of a price run to new highs and then a Closing Power uptrend-break,
we would not be averse to taking profits. The stock is now falling back from the
resistance of its falling 50-day ma.. (GMTN's high was not exceeded in 2009.)
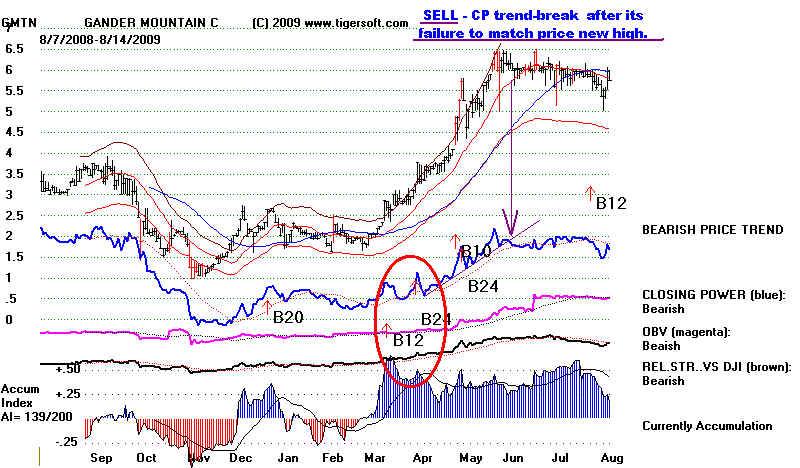
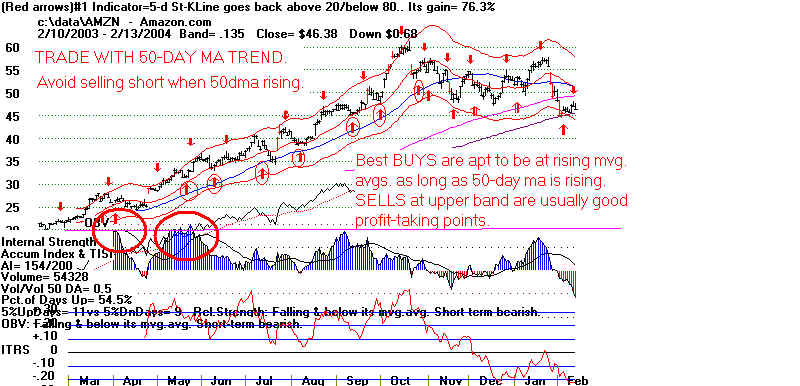
Intra-day breaks of the rising 50-day ma are not to be used as selling points. Watch
for reversals upwards from the rising 50-day ma as confirmations that the uptrend continues.
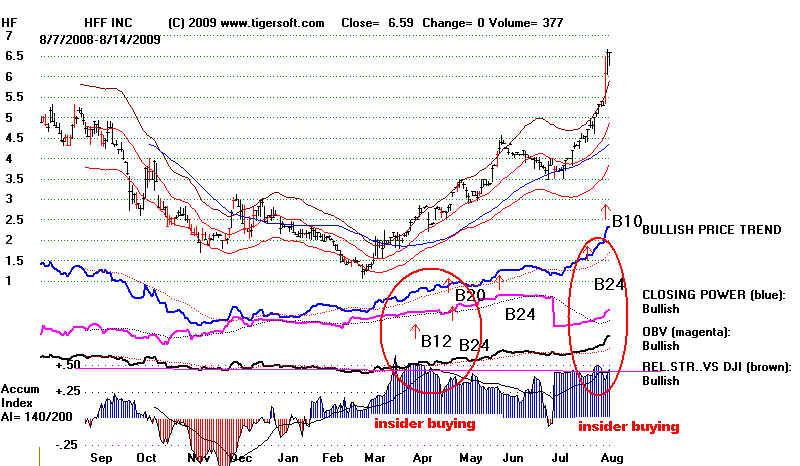
We love to buy on successful tests of the 65-dma. Breaks in the Closing Power downtrends is
a favorite trading technique. http://tigersoft.com/TigerSoft-Simple-Very-Profitable/index.html
HF reached 10 in October 2010.
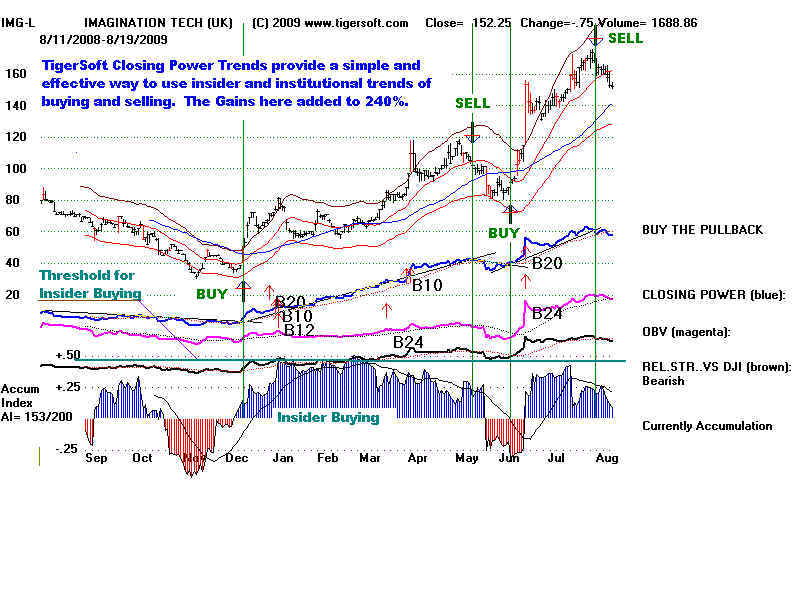
The stock below (IMG-L) is a classic bullish chart using TigerSoft. A gain of 240%
followed
simply using the trend-changes of the Closing
Power. The major Buys showed this was a
potential "explosive super stock".
TigerSoft provides the data for the FTSE
stocks each night. Our Tiger
Software programs have a lot to offer investors
who trade British stocks and indices. We
provide the data each night for the
FTSE stocks. The same principles used for
trading US stocks work well for
trading UK stocks.
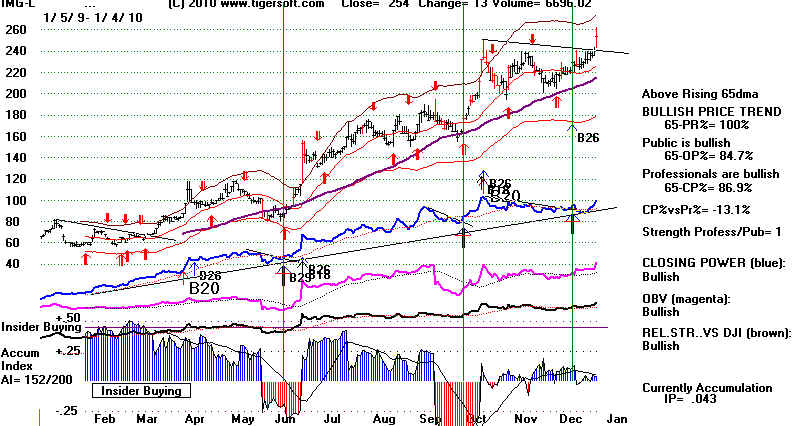
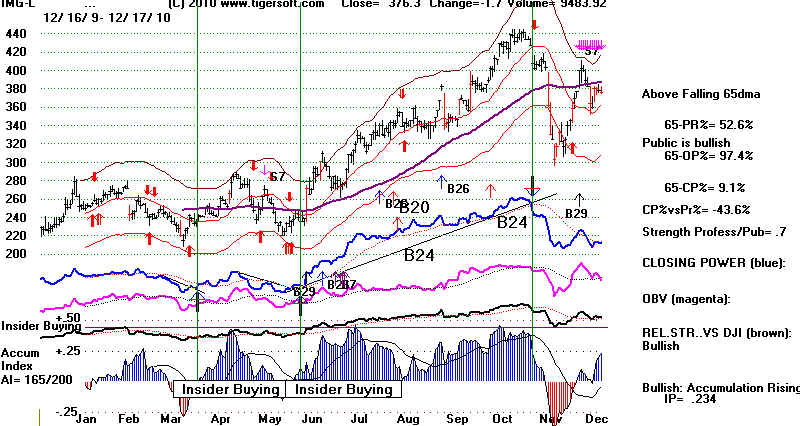
In October 2010, IMG-L (London SE) reached 440 in 2010. See the charts below.
IMGL-L 2008-2009
IMGL-L 2009
IMGL-L 2009-2010
------------------------------------------------------------------------------------------------------------------------------
KIRK reached 18+ by the end of 2009. There was no sign of intertnal weakness at any point
in 2009. But at 24, the positive (blue) readings from Tiger's Accumulation Index had turned
negative. Professionals switched to selling. A head and shoulders pattern developed.
By the end of 2010, KIRK had fallen back to 11.
KIRK 2009 - Bottom and Take Off/.
KIRK 2010 - Top and Decline.
====================================================================================
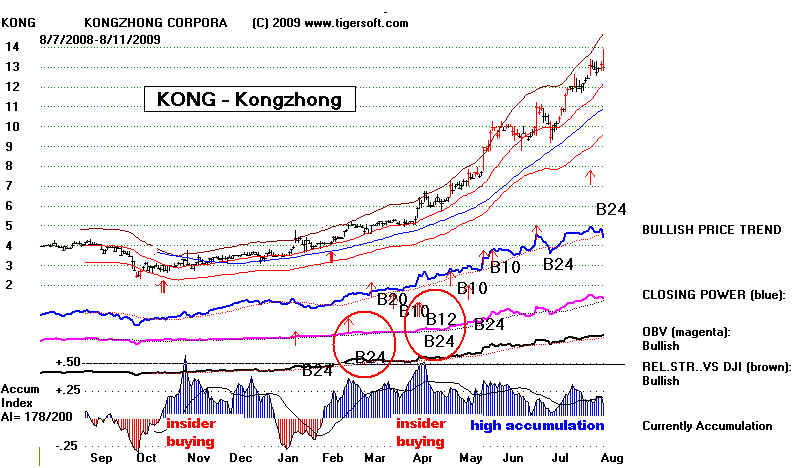
KONG - Vigilance needed.
16 in October was the peak. The Blue CP uptrend was then violated. A head and shoulders
pattern unfolded and the Accumulation Index bearishly turned red. KONG lost its professional
supporters. It fell to 5.5 in September 2010. These charts can be duplicated with data from
the Tiger data page.
======================================================================================
Peak for 15 months
IFON illiustrates how quickly an explosive stock starts rising after the Buy B24 if there
has been a bulge of insider Buying. Red price bars show unusual volume for that day.
The problem with low priced stocks is that often their advances fizzle out quickly.
The second IFON chart below shows how the top was made here in the months
following the period shown by the first chart.
1) Typical red distribution, 2) A falling Professional-Closing Power. 3) A head and shoulders
pattern.
IFON's Big Jump.
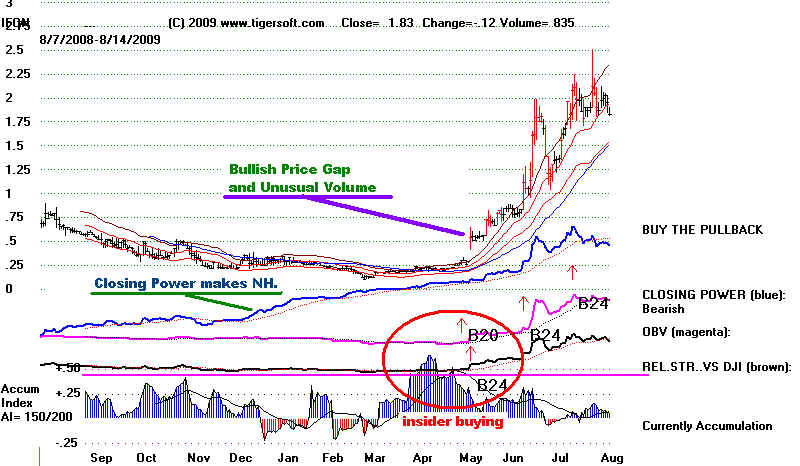
Given how very positive the Accumulation Index was in this chart, the brief violations
of the 50-day moving average should not have been used as reasons to Sell. Instead,
they proved to be traps for unwary bulls.
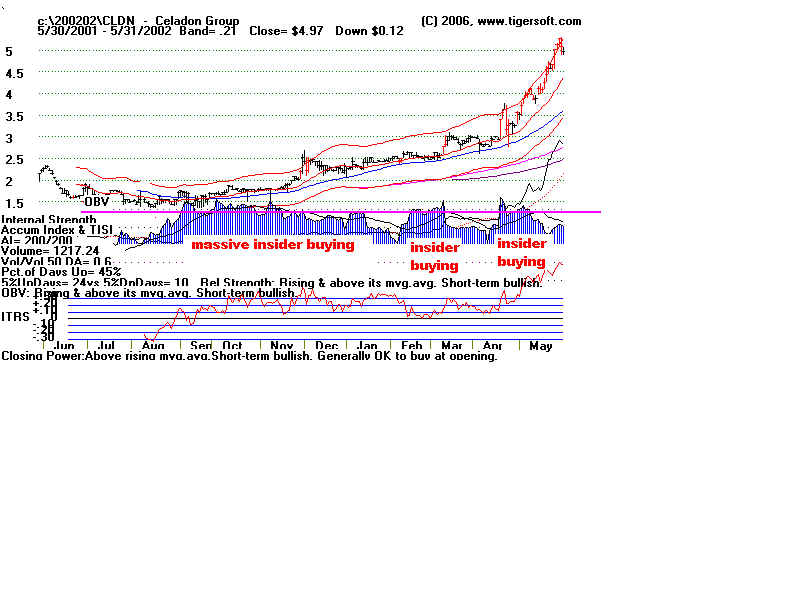
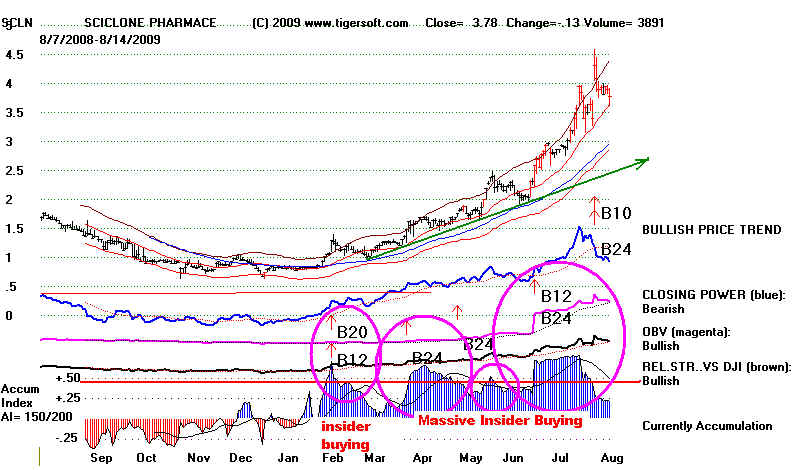
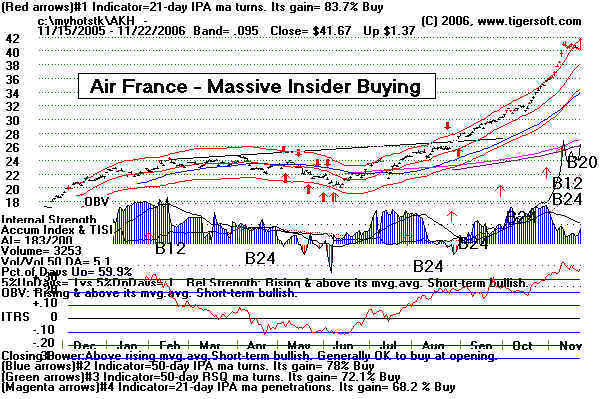
Massive insider buying in SCLN for
much of 2009. from February to July.
2008
2007
2006

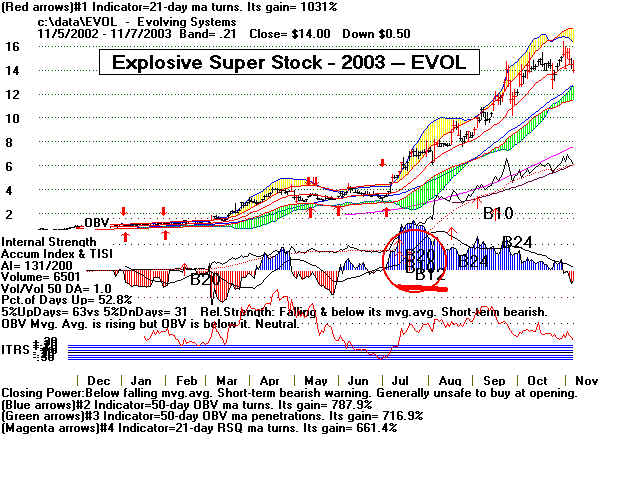
EVOL up 2158%
LCAV +2138% Rally
TRID up 785%
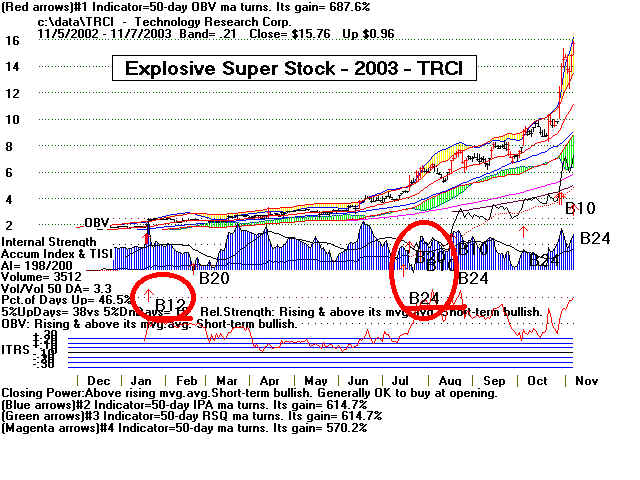
TRCI up +980%
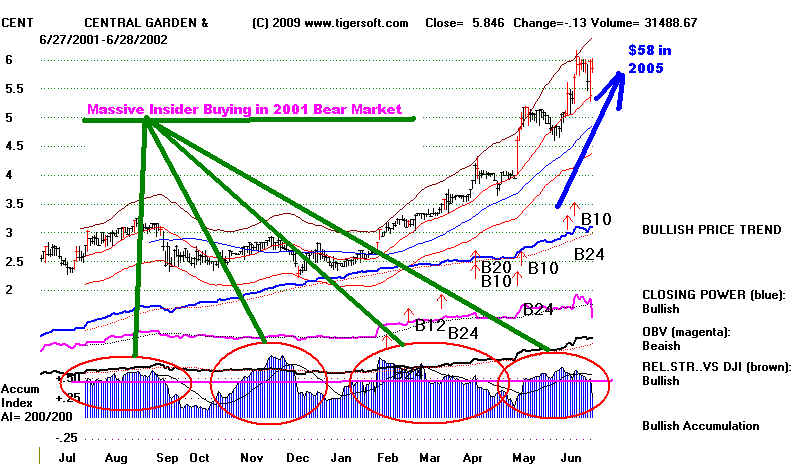
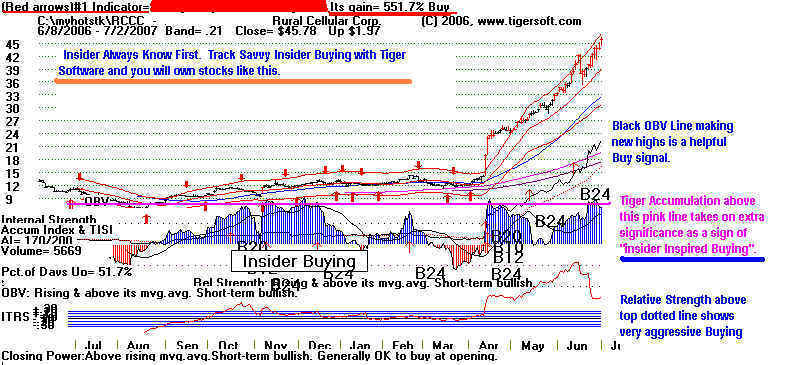
MASSIVE INSIDE BUYING SET THE STAGE FOR A MOVE TO $55 in 2005.