 |
QUESTIONS and ANSWERS Questions posed by visitors to the site and Answers made by TigerSoft Tiger Software Stock Market Charts and Analysis Highly Profitable, Time-Tested Automatic Buy and Sell Signals www.tigersoft.com Last Updated 8/20/2009 |
More Recent http://tigersoft.com/Questions_and_Answers/2010index.htm 8/20/2009 from RG I'm considering buying the Peerless software.
Could you please send me a screen shot on the program showing
all the buy and sell signals For this year?
Here is the current Peerless chart. The biggest loss was the July 2009 Sell S10.
At the time, the Hotline warned that the S10's decline was not confirmed by
A/D Line as it was always in the past in all earlier cases, except for one case.
The program should probably be adjusted for this. But I like showing these
signals, as they were all done real-time.
The gains reflect the trades as if they were closed out on 8/19/2009 and
include the bad July S10. Even with this loss, the gains are substantial and
could easily have been made trading any of the major market ETFs.
You already have TigerSoft. So this will entend you data subscription by
3 months and also get you our nightly Hotline.
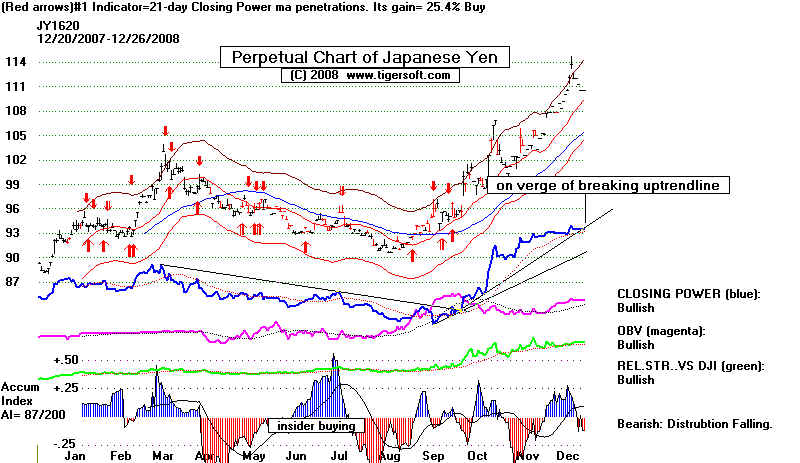
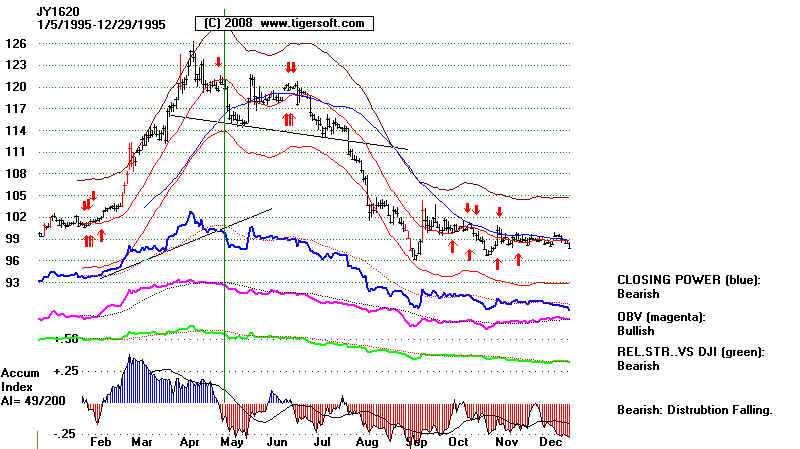
I have noticed that the Japanese yen is reaching its all time high close to 124/125 ======================================================================================== |
7/23/2007
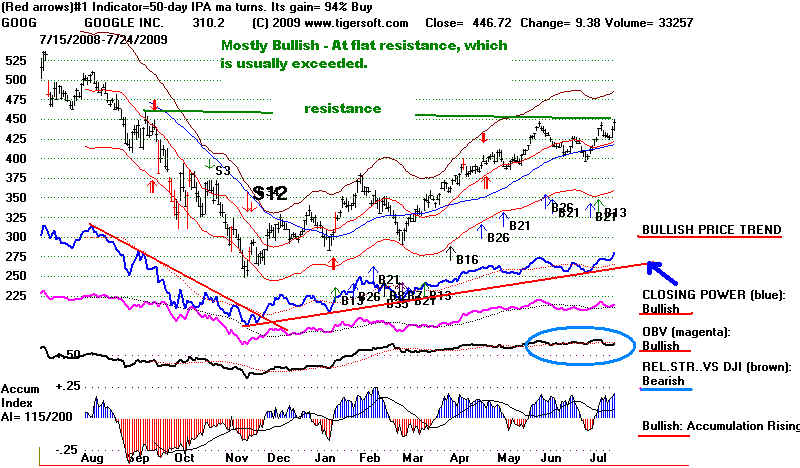
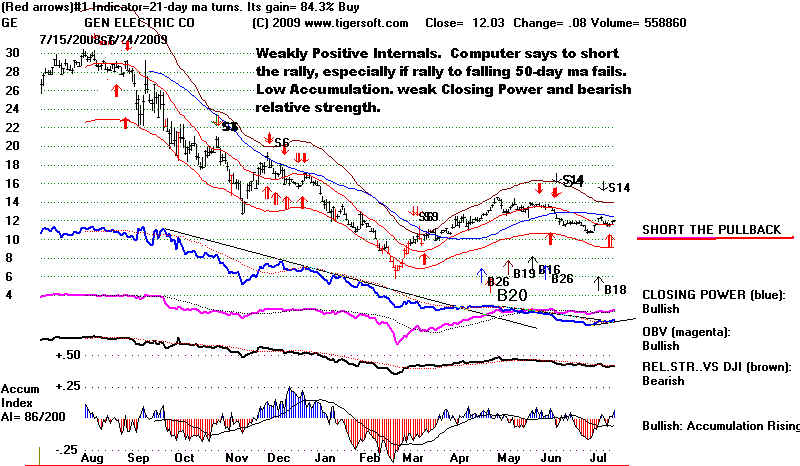
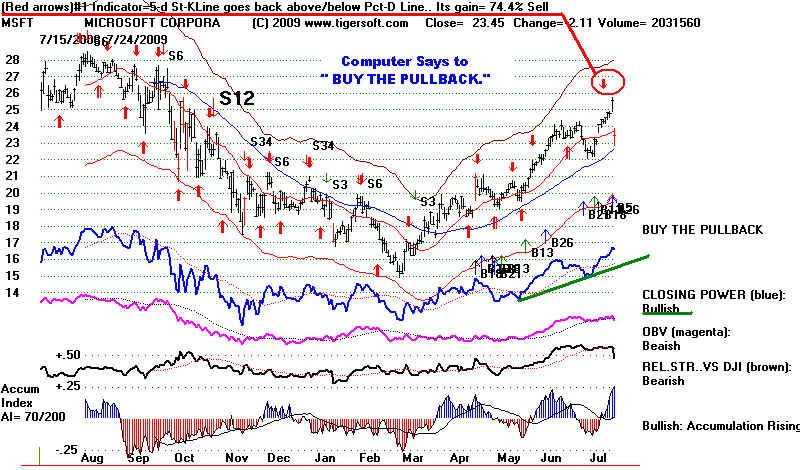
... Perhaps youcould give me your thoughts
on a couple of stocks, according to your
software.I currently am a big believer in oil, so I hold HAL, OMNI
and ALY. Thoughts?
How about ZOLT and IRF? Thanks so
much! P.W. - Dallas, TX
Tiger - I hope
this helps. This is all time permits in the way of an answer now. Note
that these
charts show automatic signals based on the optimal trading system for the stock and
several internal
strength indices: OBV (aggressive buying), Tiger Accumulation Index (Institutional
Buying/Selling) and
Relative Strength. .
| HAL - Rises and falls with Crude Oil futures. The 12-month high
today is not confirmed by OBV (aggressive buying) but the Accumulation Index is positive. It has out performed DJI since March. The red arrows are based on the top trading system for the stock for the last year. That system has gained 57.4% for the last year, buying, selling and selling short. 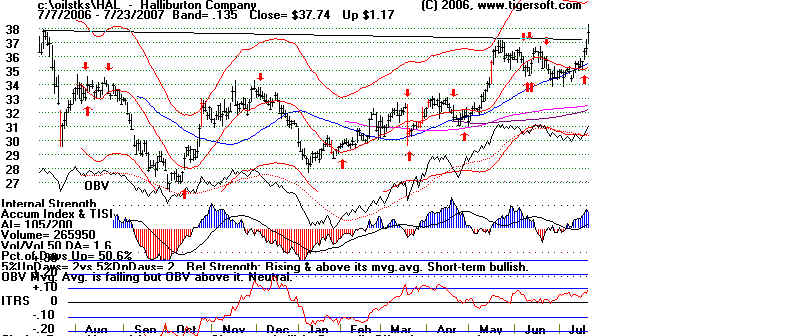 
|
| OMNI - This appears to have formed a minor
head and shoulders top within in broad trading range. Note that a simple 14-day Stochastic would have generated profits of +120% for the last year. Note how the June peak and the November peak were not confirmed by the OBV Lines making corresponding new highs. 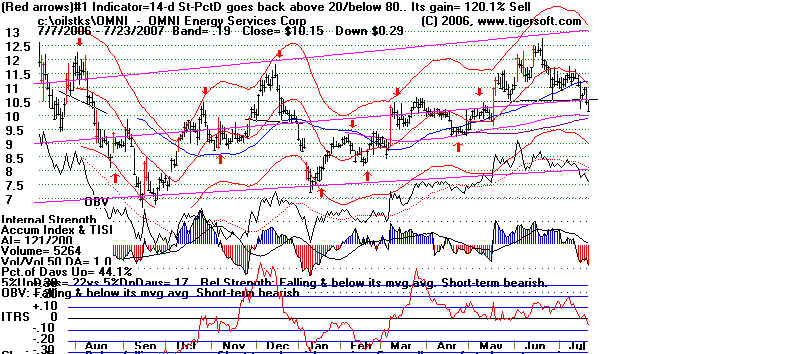 |
| ALY - Short-term traders would have made
+121.5% using a 4-day Stochastic with this stock. The history here shows that it trends well. Hold it until it breaks the uptrendline shown above. It has a rounding bottom and is on a run. The Accumulation Index readings are favorable now. 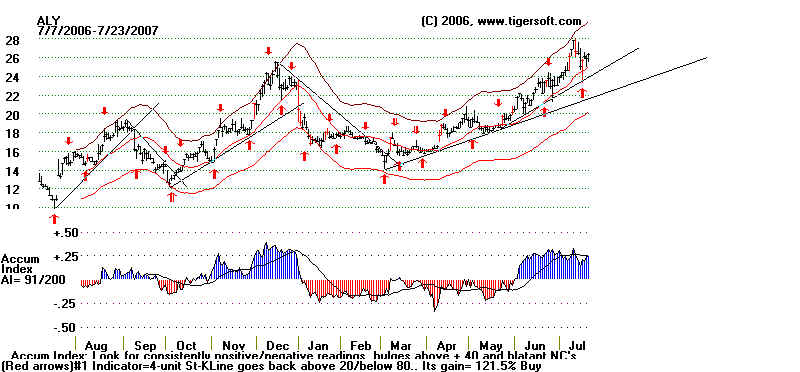 |
=================================================================================
Questions from Singapore and Answers by Tiger Software
12/27/2006
>1.	I trade options, and it appears your system is ideal for Index
>options. I'm unclear whether Tiger or Peerless is more appropriate for
>this purpose. I also note that you have recently started a Tigersoft
>Index options package.
     Yes - for index options you want to get the Peerless programs
  that place Peerless back-tested automatic Buys and Sells on all
  charts.  You will also get the 1-year optimized buys and sells
  and all the key internal strength indicators we use.
>2.	Stocks/Currencies/Commodities - that seems to be fairly
>straighforward - Tiger software is the most suitable for this. Am I
>correct?
    Yes - as you can see from our website, our software works well
with currencies, metals and even foods.
>3.	Books and reading - I note that your index options book is not
>available on your Ebay listing. Can this be included in a package for me?
    The Peerless Index Options' book is $38.  It is available as an
on-Line book.
>4.	The software package includes downloadable data for 3 months and
>thereafter a subsription service to you. Is that correct? Any specific
>recommendations or issues on the data service for Singapore?
    Actually, with this package you will get free data from us for 7 months.
Thereafter, we charge $150/year.  We provide a lot of data.  More than 1200
stocks, indices, currencies, metals, food commodities.
    We include an ascii data converter.  You will be able to take many
other data vendors' data and convert them to Tiger format.  When you
find another vendor, get them to send me an example of their data so
that I can tell you if we can convert it.
>5.	Whilst I do have a basket of stocks I track, I also note you have a
>stock ranking system that picks the best stocks or options to trade. Is
>that part of the overall Tigersoft software or is that a separate
>package?
     The Tiger-Power-Ranker is $295 additonal to the above mentioned Peerless/
Tiger programs.  It screens and ranks up to 1000 stocks per directory and
up to 10 different directories with one command.  In this way, you can quickly
find the stocks that are the highest Power-Ranked, most accumulated, breaking out,
pulling back to key moving averages, giving Stochastic Buy signals and much,
much more.

     Very important: Buy getting all our software, we provide you
at no cost our nightly hotline and weekly screening of all stocks.
In this way, you can see how we are using the same software and
make money at the same time.
>6.  >Choosing a basket of best stocks to trade is the most difficult part of
>getting started in my opinion, so that would be an important part of of
>my purchase package.
     Presently we offer data for the following groups of stocks that are
updated each night and the Tiger-Power-Ranker program can then screen
and rank:
             Multi-purpose group - 450 leading stocks,indices, currencies
      metals and commodities.
             PEERLESS INDICES: DJIA, SP-500, NASDAQ, NYSE, OEX, VALUE LINE
             Oil/Gas Stocks - 300+
             Biotechs and Biomedical - 300+
             Housing - 35 stocks
             Gold/Silver - 35 stocks

             Non-US ETFS - 40 country funds
             NASDAQ-100 - 100 stocks
             DJIA-30  - 30 stocks
             FTSE - 80 stocks

             HOT-STOCKS - 450+ those making new highs recently
             LOWPRICE - 400+ stocks under $4/share
             OPTIONABLE STOCKS - 300 stocks
             FIDELITY SECTOR FUNDS - 44
             STOCKS HELD BY THESE FIDELITY FUNDS - 250+
>6.	Shipping to Singapore - that's not listed in the Ebay site. Hope you
>can provide information on this.
             The Software can be shipped for $10 by International
Priority Mail.  Books cost about $25/apiece.
             I would suggest getting my books Explosive Super Stocks
and Using Tiger's Accumulation Index to Sell Short Stocks Showing Insider Selling.
($55 apiece plus $25 shipping apiece.)
>7.	Overall payment - I would be happy to wire funds to your account if
>purchasing via Ebay is not suitable for my location, but I hope you
>will be able to keep the special prices you post on Ebay for me.
            It's easiest to pay by Visa or MC.  Just email me in several
parts your email VISA/MC number and expiration date.  The software
is sent on a CD with instructions, but it can be downloaded from our site
to save time.
>
>   JB - Singapore
............................................................................................................................................
About Peerless, I have a few questions about your software and auction.
First, your auction says both 3 or 6 months of free data, and I wanted to confirm
which one it is.
>>>>Purchase of either Peerless Stock Market
Timing or TigerSoft
gives you 3 months of data free from us. Both gets you 7 months.
.................
Also, have you started taking paypal? Your auction says you
don't, but I noticed
some of your feedback mention paypal. Sending money orders can be such a pain.
>>>> Call us at 858-273-5900 and give us a VisA
OR MC.
Regarding your software, I would like to know how much of it
you explain.
Meaning, do you describe how you create your indicators, or is it black box?
>>>> You will need to buy the Short Selling book
to learn the key formulae.
But the Help routines give to a very good idea of what each signal is based on.
You will also find this information in our Nightly Hotline, as the signals
occur,
I have been trading for over five years now, and I love the
markets, and I
really enjoy learning new things. But I am not interested in just a signal
generator. Any specific information you could give me regarding disclosure
of your system would be greatly appreciated. I don't mind paying for information,
but I want to make sure it is the type of information that will help me learn
more about the markets. Thank you for your time.
>>>Ours is not a black box system if you get the
Short Selling book and Peerless.
The exact parameters are not available, however. The general conditions are clear
and time-tested, real-time since 1981. For example, a B2 takes place in a
Presidential Election year as the DJI tags the lower band. (The lower band
parameters are readily determined.)
...............................................................
From Shawn on 12/24/2006
Does Tiger Software work for the NYSE stocks like
VLO, COP OR CVX--Oil stocks??
Thats what I trade on a daily basis... thanks
Reply - Sure does. But sometimes keeping it simple works best.
Here are the charts you mentioned. See how successfully simple
approaches work, likes trading range support and resistance levels, trendlines,
regression channels. even before using Tiger's Optimized Buys and
Sells. Keep It Simple, if it works!
.............................................................................................................................................
From Mark in UK on 5/15/2006
Hello, Can you tell me the cost for shippimg to the UK?
If you have the time I would like to know what your software
did for the following stocks SIRI PKTR SBUX ..Thank you Mark
Reply: We send
them international priority mail
for $9.00 This offer includes data on 80 of the
100 FTSE stks, 40 country ETFS, currencies,
commodities and about 1200 other stocks.
Below are the charts you asked for. Note the Automatic
Buys and Sells. But also, see if you can understand
the importance of watching the Tiger Accumulation
Index, especially when new highs are made or
attempted. If the Accumulation Indes is Red
(negative), there is the strong likelihood that
Big Money has been tipped of by Insiders to Sell.
If this sounds too harsh, read what our site says
about such Insider Selling when it
comes to finding
good short sales. See how useful it is to watch for
this in the current market environment with our
most important, and original, indicator.
SBUX
SIRI
PKTR
.....................................................................................
From England on 1/22/2006.
Can you give users a way to use the Yahoo free data
on individual stocks. And can I see the chart of Barclay's.
Reply: Give me a
few days... But know
that our programs are really set up to monitor
a universe of stocks. It will be easier for you to use
a data source, like ours, which lets you download
many, many stocks' data at once. Meanwhile,
here is chart of Barclay's. I will add its symbol
to the list of stocks we provide on our site
as part of getting the TigerSoft package.
.........................................................................................
From England 1/15/2006
Please show me signals on HPQ, CSCO and GM.
I trade these.
Reply - That's easy. See below.
 |
 |
 |
From Nataniel 11/18/2005
Dear William,
I am interested in buying your software. A few questions, if you please:
1. I am trading with Trade Station. Do I receive the formulas so I will be able to program
the models for
Trade Station?
ANSWER: I can give you the formulae for the major indicators
if you sign a non-disclosure statement.
2. What is the max drowdown for DJIA, S&P500 and NASDAQ signals?
ANSWER: This is, of course, very important. The time
it would take to compute these
for the longer term studies makes this difficult, but I have done this for the QQQQ going
back to 1999. Please go to this
link. It will show you the paper losses trading the
QQQQ using the Peerless NASDAQ Timing Software that comes with the
TigerSoft program.
The charts for the DJI and SP-500 show the signals back to 1965 and 1970, respectively.
That should give you an idea what the biggest paper losses were. The Peerless DJI
system, by itself, without reckoning the NASDAQ major B8 in October 1999, had its
biggest loss early in 2000, when the DJI rose nearly 20% against a major Sell S9.
The biggest losses on the Buy side are very small. I believe there are none more
than 10%.
3. Are your models signal at the end of the trading day or in the middle of the session?
ANSWER: We
base all our respults on end-of-day data. You can put in dummy numbers
to see the effects of a new day's trading would hypotheticaly affect the results. In
addition,
we have plenty of tools for day traders who want to get projected highs and lows.
Best regards and keep your great work,
NATANIEL - QQQQTRADER
,,,,,,,,,,,,,,,,,,,,,,,,,,,,,,,,,,,,,,,,,,,,,,,,,,,,,,,,,,,,,,,,,,,,,,,,,,,,,,,,,,,,,,,,,,
From Stephen in Perth, Australia on 10/30/2005
I am in Australia does Tigersoft only work on the Nasdaq or can I use it on the ASX
by importing metastock format data? How many years data is provided int the package for
Nasdaq?
Stephen,
Your Metastock formatted data can be converted to an Ascii format using
Metastock and then to TigerSoft format using our software. Once set up
with the parameters, the conversion is very quick each night. Lots of users
do this each night.
Below is a current chart of IAF - the AberdeEn Australia Equity Fund.
This is one of the best ways to chart the Australian Stock Market in the US.
It is already among the data that we offer each night. As you can see, TigerSoft
works really well with the IAF. The gain for the past 12 months using the best
system for the last year with it is more than 48% and that includes a commission and
slippage of $40 per trade on $10000 initially invested.
A year of data for 900+ stocks is included. There is
also data for a year on 450 stocks
for the year 2000 so that you can see the topping out process and a year of data for
2002 so that you can see the bear market and bottoming process. The NASDAQ
has data going back to 1986.
.......................................
From Aaron on 10/5/2005
How long do you think it should take to reach here in Canada? and do you have any
information
about I can gather Canadian stock data? mostly just stocks on the TSX. Sorry about asking
about more
charts but you could you give me the 1 yr chart of the Nasdaq Composite and the stock FWLT
(Foster Wheel Ltd.).
Also is there way to get data for some Nasdaq or AMEX stocks that you do not provide?
Thanks very much.
Aaron,
We send out the software by international priority mail. It takes 3-4 days usually.
I am sending with your order the name & phone number of a broker-customer in
Vancouver. He said he would be glad to give you some guidance on getting data
on Canadian stocks for TigerSoft. As you can see from the write-up on our
site and elsewhere we do provide data for free for 3 months off thje internet.
You may also purchase it afterwards for $150 for a year. Our conversion
programs will help you if you use another data vendor.
Here are the charts you asked for.
.................................................................
10/5/2005
Hi, so I can trade Canadian stocks with the software? Such as IMO (Imperial Oil)? It would
be amazing
if you could show me a chart of the buy and sell signals for this stock in the last
year.... Thanks very much.
Saygapro
That's easy to do. I just downloaded the stock from
Dial Data and here is the
result. I added the major Buys and Sells from the Peerless DJI program.
The four best systems for
trading the stock are shown by TigerSoft with
different arrows. The Red arrows show the reversing signals for the best
system.
The top line shows that its gains were 108% over the last year. This is
excellent for a stock that is generally not very volatile. Read the chart closely for
some other messages about internal strength.
TigerSoft will take you to new heights with added safety. Its signals and internal
strength
indicators are to be trusted. We provide data on nearly 900 stocks for free for 3
months.
After that you can data from us for $150 a year or $20/month. You can also convert
data
gotten from other sources to our format. IMO is one of the stocks.
8/1/2005
Which software will show me charts of individual stocks
like
Clorox...Does this program require any other software like trade
station or esignal.
Thank you Steven
Steven,
The Tootsie Roll TR chart is
shown below. The four best systems for trading the
stock are shown by TigerSoft with different arrows. The Red arrows show the
reversing signals for the best system. The top line shows that its gains were 30%
over the last year. This is excellent for a stock that is generally not very
volatile.
Read the chart closely for some other messages about internal strength.
TigerSoft is the program you want. Its signals and internal strength indicators are great,
as you can see. We provide data on 460 stocks for free for 3 months. After that you
can
data from us for $150 a year or $20/month. You can also convert data gotten from
other sources to our format. TR is one of the stocks.
CLX is not volatile enough to be traded fruitfully by our software. Our best system
has only gained 14% on it for the last year. It is on a Sell. The best system is
based
on the turns of its 50-day mvg,avg. I hope this helps. TigerSoft is very
powerful
and very easy to use and interpret. What could be easier than looking at the Buy
and Sell arrows on the stocks you are interested in.
Bill - TigerSoft
7/30/2005
What is difference between Peerless and Tiger?
Samtel111
Dear Samtel111,
Thanks for the query. Peerless signals are based on the DJI. It is back-tested
to 1965. Its
intermediate-term and long-term signals work best with the SP-500, fidelity funds and most
stocks.
TigerSoft produces 1 year optimized Buys and Sells on everything (indices, stocks
(domestic and foreign),
currencies and commodities. TigerSoft also shows automatic BUYS and SELLS on the
NASDAQ,
based on back-testing to 1986. It excels at showing traders how to trade volatile
technology stocks.
And it includes many powerful internal strength indicators.
Below are three typcial charts. The first is from Peerless. The second and
third come from
TigerSoft.
Here is a recent chart of the DJI using Peerless:
Here is a recent chart of NASDAQ
Here is a chart of EBAY.
William
................................................................
4/26/2005 from Irwan
Hi,
I saw your website and have the following questions about your products:
1. Do you give STOP values in your buy and sell signals
(e.g. in "Peerless DJIA/Nasdaq Buy and Sell signals") ?
Results can be improved and trading can be made safer
using stops. We recommend their use if the stock has well-tested
support just below a point where the stock has been bought or a
well-tested resistance level just above the point where the
stock has been sold short, especially if these levels are flat
and the stock is over-extended.
2. What is the average holding period ?
The Peerless NASDAQ system started in 1986. There have been
77 positions taken, 76 trades completed. So there are about
3.8 trades a year, once every 3 months approximately. The
Peerless DJI system has been backtested to 1965. It averages
one trade every 4 months.
3. What is the average gain/loss in percentage ?
The Peerless NASDAQ system has averaged 9.85% per
completed trade. It has been short since 1/3/05 from 2152.15.
The Peerless DJI system has averaged a gain of 7.4%.
Individual stocks and indices vary widely using the
optimized Buys and Sells. With them, one cane take
whatever trading approach one wants and trade the
vehicles that currently suit that desired holding period.
4. Is there an explanation what the signals mean e.g. B9, B12, S10?
The Software's HELP section gives you definitions and
suggestions
for each signal. The numbering system is simply a convenience.
The numbers order does not connote strength or frequency.
5. Is your software (the one you sell for $295) suitable for indexes only
or also for stocks ? Does this software also give signals for "explosive super
stocks"? Does your software have the scan facility to search for example for
"Super stocks" ? We have
three software packages.
First, the Peerless DJI system covers only
the DJI and is backtested to 1965. It sells for $295 now.
It gives these signals automatically. And many, many
investors have come to trust it.
Second, we offer the Peerless NASDAQ System
with automatic signals for stocks and indices.
It is now offered at $195 (though that price is only offered
thru the end of April. It is normally $295 also. It comes
with a 2 week trial period.) This is the package I call
"TigerSoft". It includes the NASDAQ timing system,
all the Buy and Sell signals for individual stocks as well
as the optimized signals. It does show the signals that typically
occur with an explosive super stock, like B12, B20, B24.
It does not rank and flag these conditions from a 1000
or more stocks. That is done by our Power-Ranker
Software which is included in the full $695 package.
The full package also includes our ESP services for free for 6 months.
6. Is your software able to read Metastock files ? If not is there a
utility to convert Metastock files ?
The latest version of Metastock files cannot be read. We
can convert ascii data to Tiger usage. Perhaps, Metastock
offers a converter of it data to ascii format. We do. In
any case, all the data on 460 stocks and indices can be
gotten from our site for 3 months for free. After that it is
$20 a month.
7. Is there a possibility for trial of the software ? We
sometimes do offer a
2 week trial for the Peerless NASDAQ and TigerSoft Automatic
signaling programs for stocks, which also gives optimized signals
on whatever is graphed, stocks, indices, commodities, currencies. These
optimizations have enormous value and they are fully automatic.
Instructions are provided for their best use. The price this way is usually
$295.
8. Is there a possibility of a trial for the ESP service?
The ESP services, thrice weekly Hotline Bullish &
Bearish
special situations and weekly reveiw of all stocks come only
with the full package (which is $695).
Thanks for the inquiry. "Try it...You'll like it"!
William Schmidt
..............................................................
3/20/2005
I am interested in purchasing your product can you provide me an analysis
of JNPR, QQQQ and SMH or an overview from your system and I will
purchase the product. Appreciate your desire to help retail investors like me.
Good luck with your product Thanks VJ
VJ,
First, get a sense of the market as a whole. Our NASDAQ
Peerless has
been on a Sell for some time now. Then look at the QQQQ.
Its chart
shows it is on the verge of breaking below its nested mvg.avgs. That would
be bearish. The automatic Buy gives us hope for a reversal upwards here.
But it would likely be a short-term rally, judging from the indicator giving the
Buy.
(This is not shown in the chart here to protect our hard work.) Then look at
the stocks you mentioned. I would trade them in the direction of the NASDAQ
Peerless system or if the QQQQ can quickly get back above its key support.
We provide a lot of documentation on our internal strength indicators. These
do not look really good for SMH or JNPR at this juncture. Hope this helps.
The software should pay for itself quickly.
Bill
.............................................................................................................................
2/26/2005 - from Dwariko in Australia
Hello there. I am living in Australia, would your programs
work for the ASX. Can I configure the software to take
the data from an australian data vendor. Thanks Dwariko
...............................................................
Dwariko,
Great question. The TigerSoft program works really well
with the ASX. The gain for the past 12 months using the best
system is more than 60% and that includes a commission and
slippage of $40 per trade on $10000 initially invested.
I have posted the ASX chart here.
That data for ASX is offered regularly on our own data site.
But after three months you can convert your own data,
if it is in ascii format, to TIGER. I can also do a custom
conversion for you for a small fee if you like. This
software will work well with most Australian stocks
provided there is reliable data for the daily volume, opening,
high, low and close.
Bill
...............................................................
2/25/2005 - from Pauline in UK
Hi, I would be grateful if you could give me some advise.
I am in the UK and currently spread trade the FTSE and DJIA short
to medium term(up to 3-4months). I have never used a charting
package as I have just used the free online charts at Bigcharts.
I'm not sure if your 2 offerings are for the same software,
or if they are different, which would be most suitable for me.
Also are they fairly easy to set up and run?
Many thanks Pauline frrom UK
...............................................................
Pauline,
Thanks for your good questions. The two packages are different.
PEERLESS is a market timing
program that gives Buy and Sell
signals on the Dow Jones Industrial Average. It has been
back-tested
to 1965 and over and over again has proven itself real-time,
for those trading instruments such as index futures, index funds,
index options, but also most stocks and mutual funds. The Dow Jones
average's highs and lows correspond closely to most stocks
fluctuations. Whether you trade volatile stocks or safer blue chips,
the PEERLESS major BUYs and SELLs can add a great deal
to your winning totals.
The TIGERSOFT program gives Buy
and Sell signals on individual
stocks, currencies, mutual funds as well as indices. It does
so by optimizing a year's worth of data through the prism of
more than 50 different trading systems. An additional 50 systems
can be optimized with a second command. I have set up a current
chart of the BP, showing the "perpetual futures" for the BP in
US dollars. (Perpetual contracts lump in all futures' volume
but use the prices of the next contract to expire 20 days out.)
The British Pound chart shown via this link displays the Buy
and Sell
arrows for a 100 different systems automatically reduced to just three.
The program also shows you the basis of the signals.
In your case, you really would be helped most by having both programs,
since you want to know what to expect of the DJIA as well as the
British Pound. Each separate purchase gets 3 months of data for free.
So if you got both programs, you would get a half a year of data on
both items you mention and a lot more.
The software is easy to use. It is intuitive. We get few calls
asking how to use it. There is ample HELP in the software and
on-line. We provide the data. It will open your eyes up to
what indicators work best.
Please let me know if I may be of further help.
Bill
............................................................................................................................
2/24/2005 - from Joe
Hi,
I have a question about your software...Is the data that needs to be entered readily
available? I know I can get Open-High-Low-Close and Volume fairly easily but your ad says
there are 10 figures needed and I don't konw what they could be or if I could find them. I
just want to know if it can be updated manually without having to subscribe to a data
service. I currently download stock data in excel.
Thanks, Joe
........................................................................................................
Joe,
Yes - the daily trading data for Peerless is readily available:
DJI high and low (theoretical, not actual - from WSJ or Inv.Busin.Daily)
Close
NYSE advancing stocks
NYSE declining stocks
NYSE adv.stks' volume in millions
NYSE decl.stks volume in millions.
I would recommend also puting in any indices you may be
using, too: like NASDAQ or SP-500.Here we just need high, low, close and volume of NYSE or
NASDAQ. You can superimpose the Peerless-DJI signals on these indices.
Bill
............................................................................................................................
2/19/2005 - from Mike in Phoenix
Questions.........................................................................................
Hi Bill, I would love to see you
replace the VLE slot on the short term Tiger Indexes with RUT. I am not
sure how much relatence in today's market VLE has but RUT has and continues to gain a
large institutional and individual investor audience. Your Thoughts? Thanks.
........................................................................................................
Reply...........................................................................................
Mike, The RUT (See Russell 2000 chart here) is great for trading and
for sensing the market's direction. I can't easily replace the Value Line in our
Peerless Index data. However, it is included among the 450-470 stocks, currencies,
commodities and indices I provide nightly for $20 a month. If you are interested in
this service, please let me know.
You are right, that the RUT seems to trade more profitably and easier right now than the Value Line. I will continue to compare them to see if that
pattern continues.
Bill
======================================================
2/18/2005 - from Steven in Orlando
Questions.........................................................................................
1) Will this program generate signal us/gbp on us/eur and us/chf
2) Why 450+ stocks? Which ones does it analyze?
3) Will it analyze the entire market or just the one I select?
4) Can you email me the charts for 1999 and 2000
for the nasdaq for the year? Thank you Steven
.............................................................................................................
Answers...........................................................................................
1.) Yes - TigerSoft will graph
charts of the British Pound, EuroDollar
and
Swiss Franc. The charts are based on "perpetual
contract" data that
we get from Dial Data in Brooklyn. Perpetual contracts take the trading volume for
all months' contracts for the currency, but uses the high, low and close for
the monthly contract about to expire. If you need a function written to
remake the data into the reciprocal (instead of Britsh Pound/Dollar, Dollar/BP), we can
add that quickly to the stock split routine at no no charge. These are included in
the daily data we offer from this site. Additional
examples.
2) We offer 450-470 stocks, commodities, currencies and indices
because
it is a manageable number that can readily be managed by us and users.
A few more can be added by your request. If many more are desired, the TigerSoft
Stock Program which includes the NASDAQ-PEERLESS does include a conversion program that
lets you convert your own ascii data to our format. If you would like to use Dial
Data yourself, we provide the necessary software for $100 extra. You will need to
subscribe to Dial Data and get an "ASCI 13" account specifically earmarked for
Tiger Investment Software. They charge about $60 all markets and indices.
3) The TigerSmart Software gives signals on whatever you choose to
graph,
provided you have the daily data: volume, opening, high, low, close for whatever you want
tograph. Because market timing is important, we also provide the NASDAQ-Peerless
Signalling Program, which averages almost 30% a year, just buying and selling, and no
short selling.
You should know that our Full TigerSoft package includes a Ranking and Flagging Program,
which analyzes, optimizes and flags all the stocks you may wish to follow. One
command does it all. You will have to place your stock data in folders that contain
no more than 1000 apiece. Using Dial Data is an easy way to do this. TC-2000
may also be used. Their watrch-lists and conversions are commonly used by Tiger
users.
4. The charts for the NASDAQ Peerless are shown here. Note that it take about 100
days to have enough data to produce the automatic Peerless Buy and Sell signals on the
NASDAQ. That is the reason I have had to provide four charts to cover the period
1999-2000 you requested.
Year
Gain made by Peerless NASDAQ Signals Shown
..............................
...................................................................................
NASDAQ-1998 ...
+82.4%
NASDAQ-1998-9...
+74%
NASDAQ-1999 ...
+56.3%
NASDAQ-1999-2000... +149%
NASDAQ-2000...
+60.7%
Thanks for opportunity to provide you more information about TigerSoft.
.........Bill