|
OIL's ROLLER-COASTER RIDE:
2006-2008
All you needed to know
to master the ride were:
Price Patterns and TIgerSoft's measures of Insider Buying and Selling.
Watch the trends of TIger's Closing PowerTrend and
TigerSoft's Accumulation.
Only TigerSoft offers these tools.
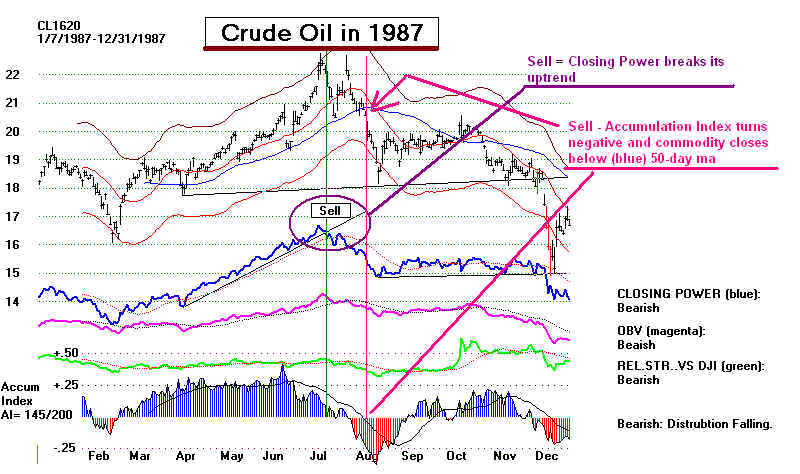
First, look back at 1987. The
same rules applied then.
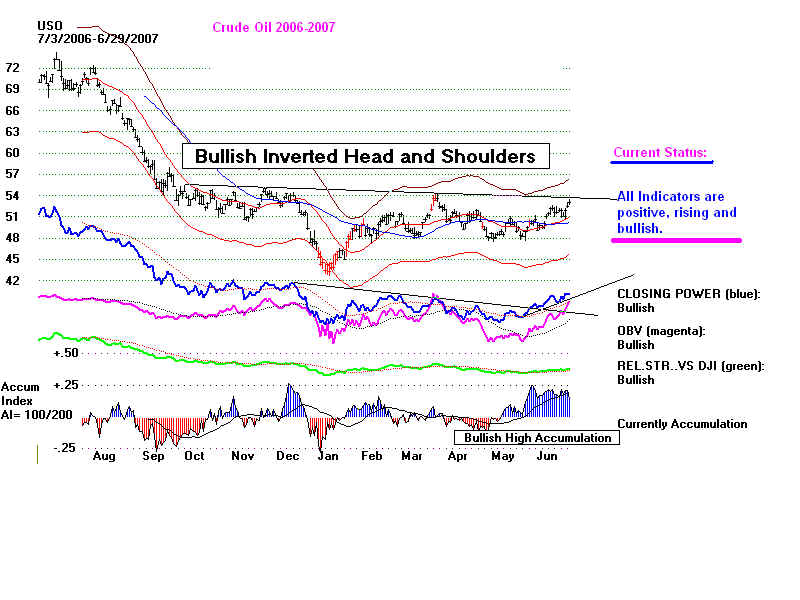
=============================== 2006-2007
==================================
Note bottom formation - and positive and
rising internal strength indicators
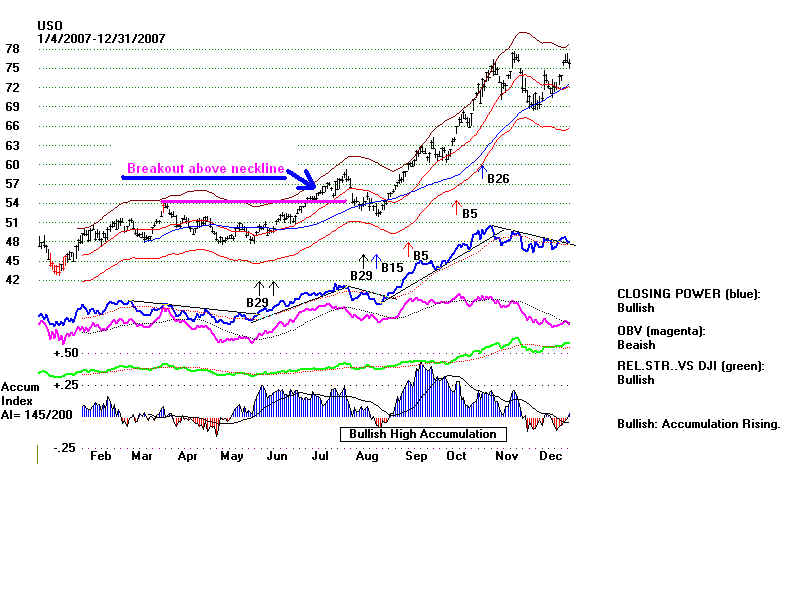
=============================== 2007
==================================
Breakout is richly confirmed by positive
internals and rising prices.
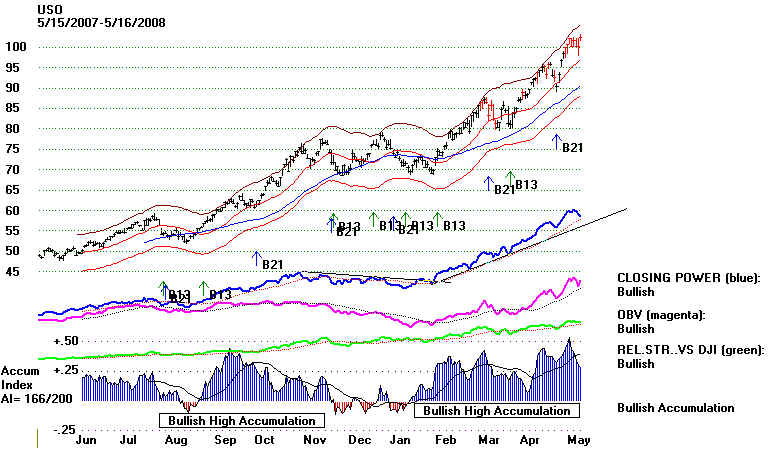
=============================== 2007
-2008 ==================================
Rising prices are richly confirmed by positive internals
and rising prices.
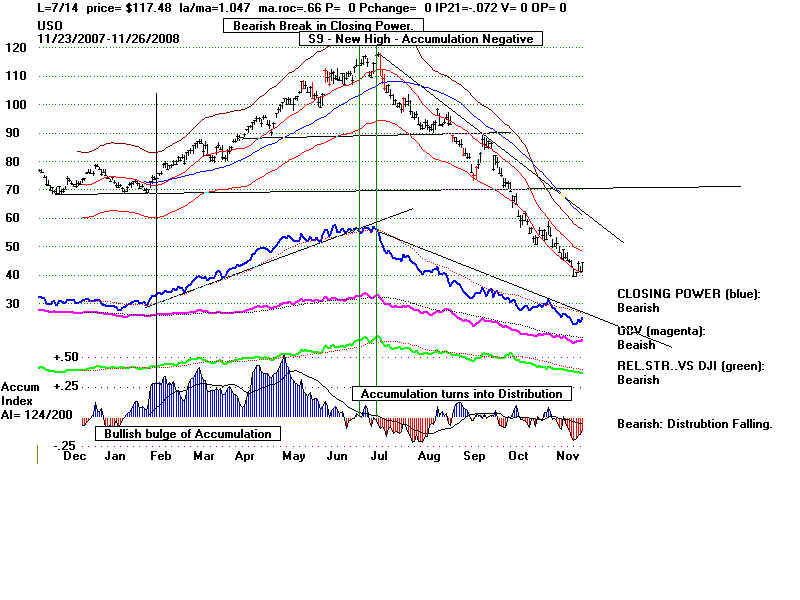
======================== 2008 ==============================
The Top was marked by a trend-change,
from rising to falling
and from positive to negative. But before that, notice how Accumulation
turned to Distribution. The last high showed negative readings. This
neabs that Insiders had switched from Buy to Selling. After this big an
advance, selling was advised. The downward pressures of Hedge fund
selling was very clear as the decline unfolded. Breaking below support
levels should have invited you to sell short. When you have tools as
good as ours, you can become very aggressive.
=======================================================
|