ORDER FORM $125 per Stock.
---- Current
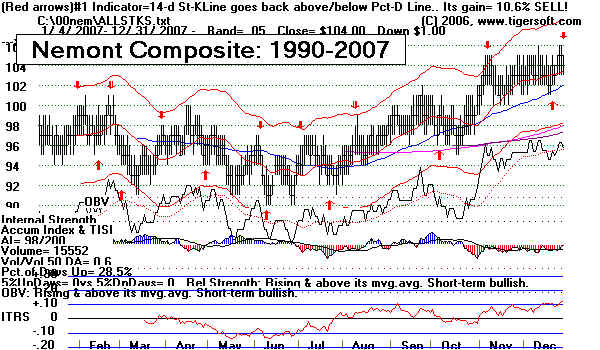
Weekly Chart Current Year's Chart Composite for Seasonality. Yearly Charts: 1990-2017 (Or for a
lesser period if no Observations.
To complete your
order, please enter the information below. You will
First Name:
Last Name:
Phone:
Email:
(Example: johnsmith@aol.com )
Re-enter Email:
Billing Address
Please enter address exactly
as it appears on your credit card statement. If not ordering by credit card, enter your
mailing address.
Stock To Be Researched:
Name/Address:
City:
State/Province:
Click to Select (if applicable)
Alabama
Alaska
American Samoa
Arizona
Arkansas
Armed Forces - Europe
Armed Forces - Pacific
Armed Forces - USA/Canada
California
Colorado
Connecticut
Delaware
District of Columbia
Federated States of Micronesia
Florida
Georgia
Guam
Hawaii
Idaho
Illinois
Indiana
Iowa
Kansas
Kentucky
Louisiana
Maine
Marshall Islands
Maryland
Massachusetts
Michigan
Minnesota
Mississippi
Missouri
Montana
Nebraska
Nevada
New Hampshire
New Jersey
New Mexico
New York
North Carolina
North Dakota
Ohio
Oklahoma
Oregon
Pennsylvania
Puerto Rico
Rhode Island
South Carolina
South Dakota
Tennessee
Texas
Utah
Vermont
Virgin Islands
Virginia
Washington
West Virginia
Wisconsin
Wyoming
Alberta
British Columbia
Manitoba
New Brunswick
Newfoundland
Northern Mariana Island
Northwest Territories
Nova Scotia
Ontario
Palau Island
Prince Edward Island
Quebec
Saskatchewan
Yukon Territory
Australian Capital Territory
New South Wales
Northern Territory
Queensland
South Australia
Tasmania
Victoria
Western Australia
Zip/Postal Code:
Country:
Click to Select
United States
Afghanistan
Albania
Algeria
American Samoa
Andorra
Angola
Anguilla
Antarctica
Antigua And Barbuda
Argentina
Armenia
Aruba
Australia
Austria
Azerbaijan
Bahamas
Bahrain
Bangladesh
Barbados
Belarus
Belgium
Belize
Benin
Bermuda
Bhutan
Bolivia
Bosnia And Herzegowina
Botswana
Bouvet Island
Brazil
British Indian Ocean Territory
Brunei Darussalam
Bulgaria
Burkina Faso
Burundi
Cambodia
Cameroon
Canada
Cape Verde
Cayman Islands
Central African Republic
Chad
Chile
China
Christmas Island
Cocos (Keeling) Islands
Colombia
Comoros
Congo
Congo, The Democratic Republic Of The
Cook Islands
Costa Rica
Cote D'Ivoire
Croatia (Local Name: Hrvatska)
Cuba
Cyprus
Czech Republic
Denmark
Djibouti
Dominica
Dominican Republic
East Timor
Ecuador
Egypt
El Salvador
Equatorial Guinea
Eritrea
Estonia
Ethiopia
Falkland Islands (Malvinas)
Faroe Islands
Fiji
Finland
France
France, Metropolitan
French Guiana
French Polynesia
French Southern Territories
Gabon
Gambia
Georgia
Germany
Ghana
Gibraltar
Greece
Greenland
Grenada
Guadeloupe
Guam
Guatemala
Guinea
Guinea-Bissau
Guyana
Haiti
Heard And Mc Donald Islands
Holy See (Vatican City State)
Honduras
Hong Kong
Hungary
Iceland
India
Indonesia
Iran (Islamic Republic Of)
Iraq
Ireland
Israel
Italy
Jamaica
Japan
Jordan
Kazakhstan
Kenya
Kiribati
Korea, Democratic People'S Republic Of
Korea, Republic Of
Kuwait
Kyrgyzstan
Lao People'S Democratic Republic
Latvia
Lebanon
Lesotho
Liberia
Libyan Arab Jamahiriya
Liechtenstein
Lithuania
Luxembourg
Macau
Macedonia, Former Yugoslav Republic Of
Madagascar
Malawi
Malaysia
Maldives
Mali
Malta
Marshall Islands
Martinique
Mauritania
Mauritius
Mayotte
Mexico
Micronesia, Federated States Of
Moldova, Republic Of
Monaco
Mongolia
Montserrat
Morocco
Mozambique
Myanmar
Namibia
Nauru
Nepal
Netherlands
Netherlands Antilles
New Caledonia
New Zealand
Nicaragua
Niger
Nigeria
Niue
Norfolk Island
Northern Mariana Islands
Norway
Oman
Pakistan
Palau
Panama
Papua New Guinea
Paraguay
Peru
Philippines
Pitcairn
Poland
Portugal
Puerto Rico
Qatar
Reunion
Romania
Russian Federation
Rwanda
Saint Kitts And Nevis
Saint Lucia
Saint Vincent And The Grenadines
Samoa
San Marino
Sao Tome And Principe
Saudi Arabia
Senegal
Seychelles
Sierra Leone
Singapore
Slovakia (Slovak Republic)
Slovenia
Solomon Islands
Somalia
South Africa
South Georgia, South Sandwich Islands
Spain
Sri Lanka
St. Helena
St. Pierre And Miquelon
Sudan
Suriname
Svalbard And Jan Mayen Islands
Swaziland
Sweden
Switzerland
Syrian Arab Republic
Taiwan
Tajikistan
Tanzania, United Republic Of
Thailand
Togo
Tokelau
Tonga
Trinidad And Tobago
Tunisia
Turkey
Turkmenistan
Turks And Caicos Islands
Tuvalu
Uganda
Ukraine
United Arab Emirates
United Kingdom
United States Minor Outlying Islands
Uruguay
Uzbekistan
Vanuatu
Venezuela
Viet Nam
Virgin Islands (British)
Virgin Islands (U.S.)
Wallis And Futuna Islands
Western Sahara
Yemen
Yugoslavia
Zambia
Zimbabwe
Select a Payment
Method :Only Visa and Mascter Card can be accepted now.