 |
Options' Trading with TigerSoft Here we assume: You are an Index Options Trader. You are looking for an options' play where the underlying index or stock falls or rises sufficiently in a short period of time for the option to double in price. This means it must move significantly in the direction we expect and do so in less than 3 months, preferably much less. It is best if you buy Puts when the stock or index appear strong, so that there is minimum premium, and you buy Calls when the stock or index is down, so that the premium is reduced. http://www.tigersoft.com/ Last updated 11/12/2007 |
Introduction.
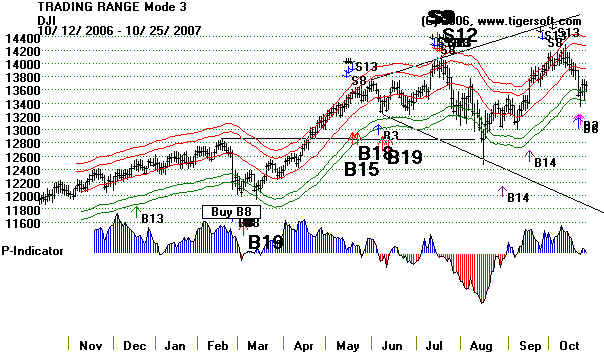
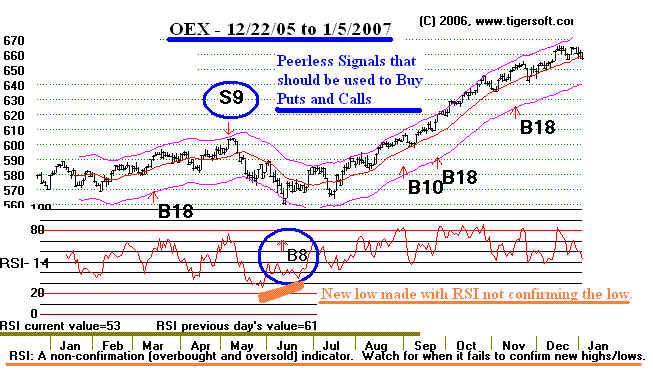
Here we show how profitable put and call buying would have been using Peerless to
to trade options on the SP-500, OEX or QQQQ. The simple Peerless based systems are
explained below and their results are shown. In the chart below, you will appreciate that
the May 2006 Sell (S9) was a reversing Sell after which Puts should have been bought.
The reversing Buy B8 should have been used to buy Calls. The lower band is the normal
objective for puts bought after the Sell S9. Th upper band was the objective for calls bought
after the Buy B8.
 |
Index Options Trading with Tiger Soft
Other Links of Value:
Peerless Track 42 year track record based on with DJI-30 and NASDAQ major Buys/Sells.
http://www.tigersoft.com/--1--/index.html
Peerless Signals on the QQQQ - http://www.tigersoft.com/Peerless-Signals/nnSignalsonQQQ.htm
Peerless Signals on the SP-500 -
-
http://www.tigersoft.com/Peerless-Signals/SignalsonSP500.htm
On-Line Options' Trading Using Peerless and TigerSoft:
SP-500 and OEX: 1980-2006 $38.50.
http://www.tigersoft.com/TigerIndex20Options20Trading.htm
Options Trading Using TigerSoft with NASDAQ-100 and volatile
high techs
http://tigersoft.com/HELP-TIGER/stock-options/index.html
Introduction: Things you should know.
1. Certain of our
Peerless Buy and Sell signals test very well for trading index options. Among those
are the Peerless Sell
S9 snf major Buy B8. You will want to study quickly the market typically moves
downward after our
Peerless Sell S9 or Sell S12... Our website lets you see year after year
of the Dow Jones Inustrial
Average with the automatic Peerless Buy and Sell signals...
Peerless Major Signals on DJI-30: 1965-2007
1965 1966 1967 1968 1969 1969-1970 1970 1971 1972 1973 1974 1975 1976 1977 1978 1979
1980 1981 Written
in 1981, Peerless called the October 1987 Top and Crash perfectly.
Recently Peerless called the May-June
2006 decline and the July DJI-30 peak at 14,000 perfectly.
1982 1983 1984 1985 1986 1987 1988 1989 1990 1991 1992 1993 1994 1994-5 1995 1996 1997
1998 1999 2000 2001 2002 2002-3 2003 2004 2005 2006 2007
Here we show the trading results using
two simple and automatic systems based Peerless
We theorize that the rate of decay of premium in a 3 month put option bought with a strike
price
near the current price is an annualized
20% per year. Thus, any shown trade
below with an
an Annualized Rate of Return greater than
20% would have been closed out profitably. In fact,
premiums vary widely, as do the rates of
premium decay. Nevertheess, this simple approach
lets you see how frequently buying Put
and Call options at the time of a reversing Peerless signal
and closing out at the opposite band
would have been profitable. We estimate that an Annualized Rate of
Return of 50% would bring a +100% profit on the typical trade shown below. Depending on whether
one used the DJI, OEX, SP-500, NASDAQ or
QQQQ the average annualized gain was beteen 55% and 64%.
Of the 19 trades for the OEX, only one failed to
produce a gain which annualized at 20% per year.
For the SP-500, 16 of
the 19 trades produced annualized gains of more than 20%. With the QQQQ,
there would have been only 3 unprofitable
cases. In these instances, the annualized rate of return was
under 20%.
...........................................................................................................................................................................
#1 Sample Study of Peerless and Options
Simple Rules:
Use only
Reversing Peerless Buys and Sells. Our Peerless Options' System goes way beyond
these.
.
1. Buy INDEX OPTION 2 MONTH PUTS - Use strike price close to current level.
On a reversing Peerless Buy. Hold until next Sell or until inner upper band
is closed below. Or on expiration. On on reversing Buy signal.
2. Buy INDEX OPTION 2 MONTH PUTS - Use strike price close to current level.
Below 52 week ma (bear market) or after 3 previous S9/S12 Clusters in 6 months.
On a Reversing Peerless Sell. Close puts out after DJIA's rises back above 10-day
ma following its decline below the lower band or when DJI closes down 15%
below level of reversing Peerless Sell. Or on expiration. On on reversing Buy signal
3. Buy INDEX OPTION 2 MONTH CALLS - Use strike price close to current level.
Above 52 week ma (correction in bull market)
On a Reversing Peerless Sell. Close puts out after DJIA's inner upper band is
closed above.
Or on expiration. On on reversing Sell signal.
Results:
There were 19 trades here from 2002-2007
The DJI's avg.gain was 5.57% in 35.3 days on avg. Annualized this is 57.6%
The OEX's avg.gain was 5.37% in 35.3 days on avg. Annualized this is 55.5%
The SP-500's avg.gain was 5.4% in 35.3 days on avg. Annualized this is 55.8%
The NASDAQ's avg.gain was 6.18% in 35.3 days on avg. Annualized this is 63.9%
The QQQQ's avg.gain was 6.17% in 35.3 days on avg. Annualized this is 63.8%
5/15/2002 Buy Puts
5/15/2002
7/15/2002
Pct. Gain. Days Held
Annualized Pct.Gain
-------------- ---------------
---------------- ----------------
--------------------------------
DJI
10244 8639.19
15.6%
61 93.3%
OEX
542.02
457.18 18.6%
61 111.3%
SP-500 1091.05
917.95
15.8%
61 94.5%
NASDAQ 1725.57
1382.20
19.9%
61 119.1%
QQQQ
32.81 25.57
22.1%
61 132.2%
7/24/2002 Buy Calls
7/24/02
8/8/02
Pct. Gain. Days
Held Annualized Pct.Gain
------------
----------- ----------------
---------------- --------------------------------
DJI
8191
8712.02 6.9
15
145.5%
OEX
419.98 447.16
6.1%
15
148.4%
SP-500
843.45
905.45 7.4%
15
178.9%
NASDAQ 1290.23
1316.52
2.0%
15
50.5%
QQQQ
23.62 23.57
- 0.2%
15 -5.1%
1/6/2003 Buy Puts
1/6/2003
3/6/03
Pct. Gain. Days
Held Annualized Pct.Gain
------------
----------- ----------------
---------------- --------------------------------
DJI
8773.57 7740.03
11.8%
59
72.9%
OEX
469.74 416.50
11.3%
59
69.9%
SP-500
929.
822.10 11.5%
59
71.1%
NASDAQ 1421.33
1302.92
8.3%
59
51.5%
QQQQ
26.32
24.49 7.0%
59
43.0%
3/11/2003 Buy Calls
3/11/2003
3/18/03
Pct. Gain. Days Held
Annualized Pct.Gain
-------------- -----------
----------------
---------------- --------------------------------
DJI
7524
8194. 8.9%
7
464.1%
OEX
406.74
440.38 8.3%
7
432.8%
SP-500 800.75
866.45 8.2%
7
427.6%
NASDAQ 1271.47
1400.55
9.2%
7
479.7%
QQQQ
23.80
26.93 13.2%
7
688.3%
2/20/04
Buy Puts - Major S9 .... Presidential Election Year ...Cover at lower band.
2/20/04
3/11/04 Pct. Gain. Days
Held Annualized Pct.Gain
--------------------- -----------------
---------------- ----------------
--------------------------------
DJI
10619.03
10128.38
4.6%
18
93.7%
OEX
564.88
544.16 3.7%
18
74.%
SP-500 1144.10
1106.80 3.3%
18
66.3%
NASDAQ 2037.93
1943.89 4.6%
18
93.5%
QQQQ
36.86
34.87 5.4%
18
109.3%
3/12/2004 Buy Calls - Major Buy B19
.... Presidential Election Year ...Close at upper band.
3/12/2004 4/6/04
Pct. Gain. Days
Held Annualized Pct.Gain
------------------ -------------------
---------------- ----------------
--------------------------------
DJI
10240.08 10570,81
3.2%
25
46.7%
OEX
549.92 561.58
2.1%
25
30.7%
SP-500
1120.55 1148.15
2.5%
25
36.5%
NASDAQ 1984.73
2059.90
3.8%
25
55.5%
QQQQ
35.51
36.98 4.1%
25
59.9%
4/6/2004 Buy Puts
- Major S12
4/6/2004 5/10/04
Pct. Gain. Days
Held Annualized Pct.Gain
-------------- --------------
----------------
---------------- --------------------------------
DJI
10570,81 9990.02
5.5%
34
58.9%
OEX
561.58 532.68
5.1%
34
54.8%
SP-500
1148.15 1087.10
5.3%
34
56.9%
NASDAQ 2059.90
1896.07
8.0%
34
85.9%
QQQQ
36.98
34.67 6.2%
34
66.6%
5/10/2004 Buy Calls B20 in
Presidential Election Year.
5/10/2004 6/7/2004
Pct. Gain. Days
Held Annualized Pct.Gain
-------------- -------------
----------------
---------------- --------------------------------
DJI
9990.02 10391.08
4.0%
28
52.1%
OEX
532.68 555.7
4.3% 28
56.1%
SP-500
1087.10 1140.4
4.9% 28
63.9%
NASDAQ 1896.07
2020.62
6.6% 28
86.0%
QQQQ
34.67 37.05
6.9% 28
89.9%
6/7/04 Buy
Puts S13 in Presidential Election Year
6/7/2004 7/22/2004
Pct. Gain. Days Held
Annualized Pct.Gain
-------------- -------------
----------------
---------------- --------------------------------
DJI
10391.08 10050.33
3.3%
45
26.6%
OEX
555.7 535.50
3.6%
45
29.5%
SP-500
1140.4 1096.85
3.8%
45
31.0%
NASDAQ
2020.62 1889.06
7.0%
45
56.5%
QQQQ
37.05 34.87
5.9%
45
47.7%
7/22/04 Buy Calls
B20 in Presidential Election Year. Augmented by Nasdaq B8
7/22/2004 9/2/2004 (S13) Pct.
Gain. Days Held Annualized Pct.Gain
-------------- -------------
----------------
---------------- --------------------------------
DJI
10050.33 10290.28
2.4%
41
21.3%
OEX
535.50 544.16
1.6%
41
14.4%
SP-500
1096.85 1118.30
2.0%
41
17.4%
NASDAQ
1889.06 1873.43
-0.8%
41
-7.1%
QQQQ
34.87 34.78
-.0.3%
41
-2.7%
9/2/04 Sell
Short/Buy Puts S13 in Presidential Election Year
Because of NASDAQ Buy B8, the minot S13 was doubtful.
9/2/2004 (S13) 10/14/04 B20
Pct. Gain. Days Held Annualized
Pct.Gain
--------------
---------------------- ----------------
---------------- --------------------------------
DJI
10290.28
9894.45 3.8%
42
33.0%
OEX
544.16
529.58 2.7%
42
23.5%
SP-500
1118.30
1103.03 1.4%
42
11.9%
NASDAQ
1873.43
1903.02 -1.6%
42 -13.7%
QQQQ
34.78
35.45 -1.9%
42 -16.5%
10/14/04 Buy Calls
B20 in Presidential Election Year.
10/14/04 B20 1/3/05 Sell
Short/Buy Puts NASDAQ-S8
Pct. Gain. Days Held Annualized
Pct.Gain
--------------
---------------------- ----------------
---------------- --------------------------------
DJI
9894.45
10729.29
8.4% 81
38.0%
OEX
529.58
572.34
8.1% 81
36.4%
SP-500
1103.03
1202.10
9.0% 81
40.6%
NASDAQ
1903.02
2152.15
13.1%
81
59.0%
QQQQ
35.45
39.50
10.3% 81
46.4%
1/3/05 Sell
Short/Buy Puts NASDAQ-S8
1/3/05
1/20//05 B11 Pct. Gain. Days Held
Annualized Pct.Gain
---------------- -------------------
----------------
---------------- --------------------------------
DJI
10729.29
10471.47 2.4%
17
51.5%
OEX
572.34
561.20 1.9%
17
40.8%
SP-500
1202.10
1175.40
2.2%
17
47.2%
NASDAQ
2152.15
2045.88
4.9%
17
105.2%
QQQQ
39.50
37.35
5.4% 17
115.9%
4/21/05 Buy Calls
B19
4/21/05
5/23//05 - Hit Upper band.
Pct. Gain. Days Held Annualized Pct.Gain
----------------
-------------------
---------------- ----------------
--------------------------------
DJI
10218.60
10523.56 3.0%
32
34.0%
OEX
554.66
567.54 2.3%
32
26.2%
SP-500
1159.95
1193.85 2.9%
32
33.1%
NASDAQ
1962.41
2056.65 4.8%
32
54.8%
QQQQ
35.62
37.85 6.3%
32
71.9%
5/5/06 Buy
Puts
S9
lower band
5/5/2006
6/7/2006 Pct. Gain. Days
Held Annualized Pct.Gain-
========= =========
---------------- ----------------
--------------------------------
DJI
11577.74
10930.90 5.6%
32
63.9%
OEX
603.4
575.00
4.7% 32
53.6%
SP-500
1325.75
1256.15 5.2%
32
59.3%
NASDAQ
2342.57
2151.80 8.1%
32
92.4%
QQQQ
42.16
38.46
8.8% 32
100.4%
6/12/06 Buy Calls
NASDAQ-B8 (S9 -profit-taking. not
reversing)
6/12/2006
6/30/2006 Pct. Gain. Days Held
Annualized Pct.Gain
========= ========
---------------- ----------------
--------------------------------
DJI
10792.58 11150.22
3.3%
18
66.9%
OEX
566.98
579.56 2.2%
18
44.6%
SP-500
1236.40 1270.20
2.7%
18
54.8%
NASDAQ
2091.32 2172.09
3.9%
18
79.1%
QQQQ
37.4
38.77 3.7%
18
76.4%
1/5/07
Sell Short/Buy Puts
S9
1/5/2007
3/5/2007- NASDAQ-B8
Pct. Gain. Days Held Annualized Pct.Gain
========= ========
---------------- ----------------
--------------------------------
DJI
12398.01 12050.41
2.8%
59
17.3%
OEX
657.50
630.48 4.1%
59
25.3%
SP-500
1409.70
1374.10 2.5%
59
15.6%
NASDAQ
2434.25
2340.68 3.8%
59
23.8%
QQQQ
43.85
42.15
3.9% 59
23.9%
3/5/2007
Buy Calls NASDAQ-B8
3/5/2007-
4/`17/2007 upper band
Pct. Gain. Days Held Annualized Pct.Gain
============= ==========
---------------- ----------------
--------------------------------
DJI
12050.41
12773.04 6.0%
43
50.9%
OEX
630.48
673.56 6.8%
43
57.7%
SP-500 1374.10
1471.50 7.1%
43
60.3%
NASDAQ 2340.68
2516.95 7.5%
43
63.7%
QQQQ 42.15
45.16
7.1% 43
60.3%
7/17/07
Sell Short/Buy Puts S12
7/17/2007-
7/`30/2007 lowerband
Pct. Gain. Days Held Annualized Pct.Gain
========
========== ---------------- ----------------
--------------------------------
DJI
13971.55
13358.31 4.4%
13
123.5%
OEX
717.22
685.10
4.5%
13
126.3%
SP-500 1549.35
1473.90 4.9%
13
137.6%
NASDAQ 2712.29
2583.28 4.8%
13
134.8%
QQQQ 50.23
48.55
3.3%
13
92.7%
...........................................................................................................................................................................
There were 19 trades here:
The DJI's avg.gain was 5.57% in 35.3 days on avg. Annualized this is 57.6%
The OEX's avg.gain was 5.37% in 35.3 days on avg. Annualized this is 55.5%
The SP-500's avg.gain was 5.4% in 35.3 days on avg. Annualized this is 55.8%
The NASDAQ's avg.gain was 6.18% in 35.3 days on avg. Annualized this is 63.9%
The QQQQ's avg.gain was 6.17% in 35.3 days on avg. Annualized this is 63.8%
==========================================================================================
#2 Sample Study of Peerless and Options
It's easy to show the power of the
Peerless Sell S9 signals and Sell S12 signals.
Let's Assume we buy the puts on the OEX
(SP-100) or the SP-500, when either of these signals occur
and we sell them when the DJI's inside
lower band is closed at or below. In a few cases we sell the puts
when we have a reversing major Buy.
These are noted. Here are the results using the
DJIA. The declines are
greater for the SP-500 and the OEX, as these have more volatility.
We theorize that
the rate of decay of premium in a 3 month put option bought with a strike price
near the current price is an annualized
20% per year. Thus, any shown trade
below with an
an Annualized Rate of Return greater than
20% would have been closed out profitably. In fact,
premiums vary widely, as do the rates of
premium decay. Nevertheess, this simple approach
lets you see how frequently buying Put
options at the time of a Sell S9 or Sell S12 would have been
profitable. We estimate that an Annualized Rate of Return of 50% would bring a +100%
profit on
the typical trade shown below.
Using this overly
simple approach, 41 of the 92 trades would have have brought a gain between
100% and 200%. In 31 cases the puts
would have been closed with some or all the original investment
lost. In the remaining 20 cases the
profit would have been between 0% and 100%. I wish we could be
more exact, but that's all we can offer.
The main conclusion, is that Peerless produces a profit in
66.3% of the cases. The gains in 41
cases, or 44.6% of all cases, were more than 100%. So, using
Peerless S9s and S12s is profitable, and
this is in a market that has risen from 900 to 14,000 in
this time period.
We spell out a much
more effective and detailed approach for only $38.50 that should be
biught along with the Peerless/Tiger
Special.
---------- Buy Puts
--------- ---- Sell Puts
--------
Calender
Days Annualized
Sell
Date DJI
Date
DJI
Pct Gain between
signals Rate of Return
Signal
up to 3 months.
---------- --------------
------------- -------------
----------- ---------------
---------------------------------------------------------------------------
1. S12 3/17/67
869.77
4/10/67 842.43
3.14% 24 days
47.8%
2. S12
9/15/66 814.3
10/3/66 757.96
6.91% 18 days
140.1%
3. S12 10/19/66
785.35 11/22/66 B9 794.98
1.23% 34 days
13.2%
4. S12 10/27/66
809.57 11/22/66 B9 794.98
1.8% 26 days
25.3%
5. S12 9/14/67
929.44
10/18/67 903.49
2.79% 35 days
29.1%
6. S9
11/28/67
884.88 1/23/68 864.77
2.16%
53 days
14,9%
7. S12 1/3/68
904.13 1/23/68
864.77 4.35%
20 days
79.4%
8. S9
3/28/69 936.48
6/3/69 930.78
0.01% 67
days
3.3%
9. S9
4/30/69 950.18
6/3/69
930.78
2.04% 34 days
21.9%
10. S12 10/16/69
838.77
11/20/69 831.18 0.01%
35 days
1.0%
11. S12 1/2/70
809.7
1/27/70
763.99 5.6%
20 days
102.2%
12. S9
2/27/70 777.59
4/23/70 750.59
3.47% 55 days
23.0%
13. S12 8/17/71
892.38 9/27/71
883.47 0.99%
41 days,
8.8%
14. S9
8/24/71
904.13
9/27/71 883.47
2.88% 34 days
30.9%
15. S9
4/6/72 959.44
5/10/72 931.07
2.89% 34
days
31.3%
16. S12 5/22/72
965.31
7/19/72 916.69 5.0%
56 days
32.6%
17. S12 8/7/72
953.12
10/16/72 921.66 3.31%
71 days
17.0%
18. S9
1/3/73
1043.8
1/26/73 1003.54 3.86%
23 days
61.3%
19. S9
4/11/73 967.41
4/27/73 922.19 4.67%
16 days
88.1%
20. S9
4/19/73
963.2
4/27/73 922.19
4.26% 8
days
194.4%
21. S9
6/13/73
915.49
6/18/73 874.08 4.5%
5 days
328.5%
22. S9
9/5/ 73
899.08 9/25/73 B4
940.55 -4.6%
20 days
-
84.0%
23. S9
10/26/73
987.06
11/2/73 935.28 5.25%
7 days
273.8%
24. S12
1/2/74
855.32
1/11/74 841.48
1.62%
9 days
65.7%
25. S9
4/19/74 865.77
4/24/74 832.37
3.86% 14 days
100.64%
26. S9
5/9/74
865.77 5/20/74 812.42
6.16% 11 days
204.4%
27. S9
6/6/74
845.35 6/27/74 803.66
3.93% 21 days
85.7%
28. S9
8/29/1975 835.34
9/17/74 799.05
4.34% 19 days
83.4%
29. S12
10/9/1975 824.54
12/4/1975 829.11
0.55% 56 days
-3.58%
30. S12
3/9/76
993.7
4/9/76 968.18
2.57% 31 days
30.26%
31. S12
7/17/78 839.05
8/3/78 B4 886.87 -5.71% 17
days -122.6%
32. S12 10/10/78
891.63 10/20/78
838.01 6.01% 10
days
219.4%
33. S9
9/21/79
893.94 10/10/79 849.32
4.99% 20
days
91.1%
34. S9
10/5/79
897.61 10/10/79 849.32
5.38% 5
days
392.7%
35, S12
1/16/80 865.19
2/28/80 854.44 1.24%
43 days *
10.5%*
36. S9
10/16/80 958.70
10/31/80 924.9
3.52% 15
days
85.6%
37. S12
11/14/80 986.35
12/9/80 934.04
5.30% 25 days
77.3%
38. S12
11/25/80 982.62
12/9/80 934.04
4.94% 14 days
128.8%
39. S12
1/2/81 972.78
1/22/81 940.44
3.32% 20 days
69.6%
40. S9
2/26/81 966.81
5/2/81 979.11 -1.17% 65 days
-6.6%
41. S9
7/12/82
824.87 8/5/82
795.85 3.52% 24 days
53.5%
42. S12
1/7/83 1076.07
1/24/83 1030.17 4.27%
17 days
91.7%
43. S9
9/1/83 1206.81
10/31/83 1225.20 -1.52% 62
days
-8.9%
44. S9 11/22/83
1275.81 12/15/83
1236.79 3.06% 23 days
48.5%
45. S12 1/6/04
1286.64
1/26/84 1229.69 4.43%
20 days
80.8%
46. S9
3/16/84
1184.36 4/6/84
1132.22 4.40% 21 days
76.5%
47. S12
5/1/84
1182.89 5/21/84 1125.31
4.87% 20 days
88.8%
48. S9
10/14/85 1354.73 11/18/85 B4
1440.02 -6.30% 35 days
-65.7%
49. S9
6/4/86
1863.29 7/8/86 1820.74
2.28% 34
days
24.5%
50. S9
8/12/86
1835.49 9/11/86 1792.89
2.32% 30 days
28.2%
51. S9
4/3/87
2390.34 4/16/86 2276.99
4.74% 13 days
133.1%
52. S12
5/6/87
2342.19 5/19/86 2221.28
5.16% 13
days
144.9%
53. S12
6/8/87
2351.64 6/22/87 B4 2445.51
3.99% 14 days
-104.0%
54. S9
10/1/87 2639.20
10/8/87 2516.64 4.64%
7 days
241.9%
55. S9
10/3/89
2764.56 10/16/89
2657.38 3.88% 13 days
108.9%
56. S9
1/3/90
2809.73 1/16/90
2692.62 4.52% 13 days
126.9%
57. S9
7/13/90 2980.20
8/3/90 2809.65
5.72% 20 days
104.4%
58. S9
4/14/92 3306.13
6/18/92 3274.12 0.97% 65
days
5.4%
59. S9
10/19/94 3936.04
11/23/94 3674.63 6.64% 35 days
69.2%
60. S9
1/29/96 5304.98
2/1/96 B18 5405.06 -1.87% 2 days
-340.86%
61. S9
8/2/96
5679.84 9/13/96 B10
5838.52 -2.79% 43
days - 23.7%
62. S9
1/10/97 6703.79
1/22/97 B4 6850.03 -2.18% 12 days
- 66.3%
63. S9
2/14/97 6988.96
3/7/97 B18 7000.89 -1.71% 35 days
-17.8%
64. S9
4/22/97 6833.59
5/5/97 B4 7214.49 -5.57% 11 days
-184.8%
65. S12
10/1/97 8015.50
10/24/97 7715.41 3.74% 20
days 68.3%
66. S12
11/20/97 7826.61
12/23/97 7691.77 1.72% 31 days
20.3%
67. S9
4/16/98
9076.57 6/3/98
8803.80 3.0% 48 days
22.9%
68. S9
6/29/98 8997.36
7/30/98 9026.95 -3.29% 31 days
-38.7%
69. S12 7/7/98
9085.04
7/30/98 9026.95 0.64% 23
days 10.1%
70. S9
1/4/99
9184.27 1/22/99
9120.67 0.69% 18 days
14.0%
71. S9
2/22/99 9552.67
4/19/19
10440.63
loss
72. S9
3/5/99 9736.07
4/19/19
10440.63 loss
73. S9
3/17/99 9879.41
4/19/19 10440.63 loss
74. S9
6/18/99 10855.55
8/2/99
10645.96 1.93% 46 days
15.3%
75. S12 8/17/99
11117.07
9/15/99 10801.42
2.84% 29 days
35.7%
76. S9
1/3/2000 11357.51
1/24/2000 11008.17 3.08%
21 days
53.5%
77. S12
3/17/2000 10595.23
4/14/2000 10307.32 2.71% 28 days
35.3%
78. S9
3/30/2000 10980.25
4/14/2000 10307.32 6.13%
15 days 149.2%
79. S9
4/25/2000 11124.82
5/4/2000
10412.49 6.40% 9 days
259.6%
80. S9
6/5/2000 10815.3
7/3/2000
10560.67 1.77% 28 days
23.1%
81. S12
8/8/2000 10976.89
9/18/2000 10808.52
1.53% 41 days
13.6%
82. S12 10/27/2000
10590.62 11/21/2000
10494.50 0.91% 26 days
12.7%
83. S12
1/4/01 10912.41
2/26/01
10642.63 2.47% 53 days
17.0%
84. S9
4/16/01 10158.56
6/15/01
10623.64 -4.58% 60
days -27.9%
85. S9
1/7/02
10197.04
1/17/2002 9850.04 3.40%
10 days 124.1%
86. S9
2/14/02
10001.99 4/1/2002
10362.70 -3.61%
50 days -26.4%
87. S12
5/15/02 10243.68
6/5/2002
9796.80 4.36% 20 days
84.0%
88. S9
1/6/03
8773.57
1/23/03
8369.47 4.61% 17 days
99.0%
89. S9
4/6/04
10570.81 5/10/04
9990.02 5.81% 36 days
58.9%
90. S9
5/5/06 11577.74
5/19/06
11144.06 3.75% 14 days
97.8%
91. S12
6/30/06 11150.22
7/17/2006 10747.36
3.61% 17 days
77.5%
92. S12
7/17/2007 13971.55 7/27/07
13265.47 5.05% 10 days
184.3%
For any given
trade, the degree to which the DJI tends to moves less than the other
indices will vary considerably. The most
recent S12 on 7/17/2007 shows this. In this case
the SP-500 fell 5.83% while the DJI fell 5.05%.
In this instance the QQQQ fell less.
7/17/2007 Index
7/27/07
DJI 13971.55 13265.47
5.05% 10 days
184.3%
OEX 717.22
679.14
5.31%
193.8%
SP-500 1549.35
1458.95 5.83%
212.8%
NASDAQ 2712.29
2562.24 5.53%
201.8%
QQQQ 50.23
47.99
4.46%
162.8%
But in the 2000-2003 bear market, the QQQQ fell
from over 117.35 to 23.81, a decline of 79.7%.
The DJI fell about 36%, less than half as
much as the QQQQ. The QQQQ's beta is 1.47. This means
it has, on average, 47% more voilatility than
the DIAMONDS (DIA) which track the DJI-30 and the
SPY (SP-500 ETF).
=========================================================================================
========================================================================================