Superimposed on QQQQ: 1999-2005
$500 in October 1999 Has Become nearly $10,000 in November 2005.
The Peerless signals appear when charting the NASDAQ.
with the NASDAQ Peerless system and then superimposing the
automatic signals on a chart of the QQQ.  There were only
25 trades in 6 years, or an average of 4.2 a year.
Being automatic, this system is very easy to follow.
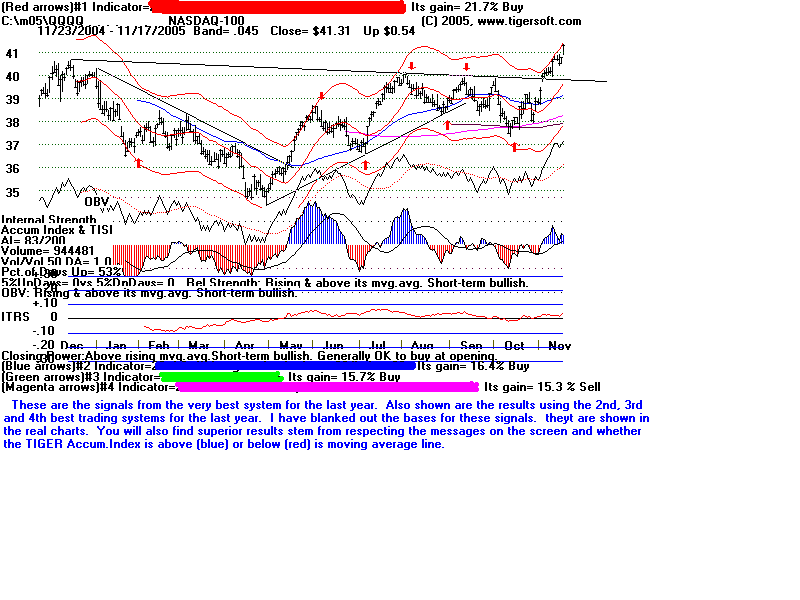
Results show that $500 in 1999 would have grown to $9272 in 2005. No commissions or taxes are factored in and short sales would have been employed. Still, the $500 traded with these signals grew by a factor of 20 times in 6 years. Meanwhile the QQQQ, itself, lost about 30% in this period. This trading system was built in the beginning of 2002. It was the distillation of 35 years' trading experience. It is mostly a trend-following system because technology and NASDAQ moves are often very big. The biggest drawdown occurred in the 2001-2003 bear market. Using a stop loss of 12.2% would have served us better. That is now recommended. Of the 25 trades entered, 9 never showed a loss. In 19 cases (76% of the time) the biggest drawdown was under 7%. This is an intermediate-term system. As you can see below, It can be fine-tuned nicely with the Tiger automatic BUY/SELL arrows shown on the QQQQ chart. These are based on the best trading system for the last year from among more than 50 very good ones.... You can see how well these signals have worked in the market's extended trading range. PEERLESS NASDAQ TRADES: 1999-2005 Date Peerless QQQQ Gain What MAX of Nasdaq Pct. Happens DRAWDOWN Trade Signal to $500 Points PCT ======== ======== ===== ===== ======== ==== ==== Start with $500 19991018 B8 59.15 .944 $972.10 0 0% 20000309 S3 115 .307 $1270.08 -5 -4.3% 20000414 B7 79.75 .100 $1397.48 -7.24 -9.1% 20000801 S1 87.75 .365 $1907.42 -3 -3.4% 20001220 B13 55.73 -.121 $1677.08 -6.73 -12.1% 20010227 S10 49 .293 $2167.88 0 0% 20010403 B7 34.66 .382 $2996.01 0 0% 20010517 S5 47.9 .412 $4228.81 -4 -8.4% 20010921 B7 28.19 .462 $6181.96 0 0% 20020107 S8 41.21 .280 $7914.95 -1 -1.2% 20020605 B9 29.66 -.184 $6454.95 -9.66 -32.6% 20030204 S10 24.19 -.002 $6444.28 -1.34 -5.5& 20030312 B9 24.23 .050 $6768.75 0 0% 20030401 S1 25.45 -.086 $6188.95 2.3 -9.4% 20030423 B1 27.63 .242 $7685.23 0 0% 20040322 S10 34.31 -.047 $7326.84 -1.5 -4.4% 20040330 B1 35.91 -.035 $7073.84 -1 -2.8% 20040510 S10 34.67 -.061 $6641.29 -2 -5.8% 20040615 B1 36.79 -.019 $6514.93 -2.5 -6.8% 20040707 S1 36.09 .100 $7168.4 0 0% 20040812 B8 32.47 .217 $8720.42 0 0% 20050103 S8 39.5 .058 $9226 0 0% 20050518 B2 37.2 .035 $9541 0 0% 20050921 S2 38.5 -.021 $9272 -2.1 -5.5% 20051110 B10 40.6 open |
TIGERSOFT CHART OF QQQQ as of November 17, 2005
