Tiger Software - Helping Investors since 1981
Make Your Retirement Grow
Suggestions:
Peerless Stock
Market Timing: 1928-1966
Track
Record of Major Peerless Signals
Earlier
Peerless-DJIA charts 7 Paths To Making 25+%/Yr. Using
TigerSoft
Index Options
FOREX trading
Investing
Longer-Term Mutual Funds
Speculative
Stocks Swing
Trading Day Trading
Stock Options
Commodity Trading
Research on Individual Stocks upon Request:
Composite Seasonality Graph of Any Stock for $125.
Example of
historical research NEM - Newmont Mining. Order Here.
Previous
TigerSoft Blogs on Silver:
This is not the first recommendation made here of Silver and
SSRI. Here are the earlier mentions of SSRI.
February 10,
2007 As
Silver Moves Past $17, Is This The Start of An Exciting Third Wave Up
November
2, 2007 Silver
Stocks: A New Run Is Starting
October 28, 2007 Evaluating Breakouts:
Case Study: The Silver Stock SSRI
September 19, 2007 Gold Breaks out with
Power as Fed Cuts Interest Rates by 1/2%
June 26, 2007 Silver Is Starting To
Tarnish.
May 18, 2006 Calling A Bottom Using The
Diagonal Lines Command with SSRI.
February 2, 2006 "Hi-Ho,
Silver"...>$10/ounce SIL
November 29, 2005 Silver Stocks Are Shining
|
Silver Is Now Roaring Up. How Much Higher?
How Will We Recognize A Top?
-------------------
Silver ETF - SLV Now -------------
Silver is up about 50% since the breakout in October 2007..
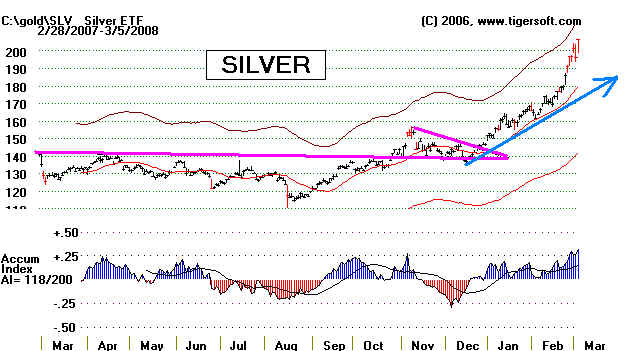
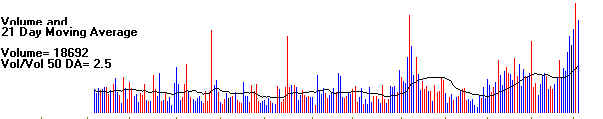
Recent Volume is high
Historically silver has sold between
1/12th and 1/16th
the price of Gold. Silver is now at about 1/46th the price
of Gold. If Gold surpasses $1,000, Silver will go along for the
rise very nicely.
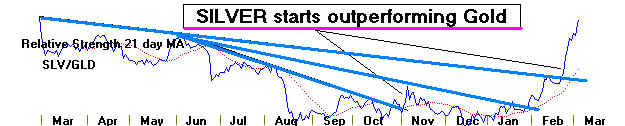
Silver is used more for industrial purposes than
Gold, so it might have been expected that Silver would
now be under-performing Gold, because of fears of a world-
wide economic slowdown. But that is not true. Americans
see Silver as a way to protect themselves against the decline
in the dollar, which is now falling at an annualized rate of 11.1%/year.
By contrast, Silver is rising at an annualized rate of 32%/year.
The Silver ETF (SLV) is making it very easy to buy some
protection against the Dollar's declining further. So Silver
may go much higher. But that will depend, in part, on the Federal
Reserve. Lowering interest rates weakens the Dollar and boost
speculation in precious metals. In addiiton, low interest rates
reduce the comparative cost for someone buying Silver, which
pays no interest. In 1980, the Fed had to raise interest rates to
20% to stop the rise in precious metals and commodities. Current
rates are very much below that.
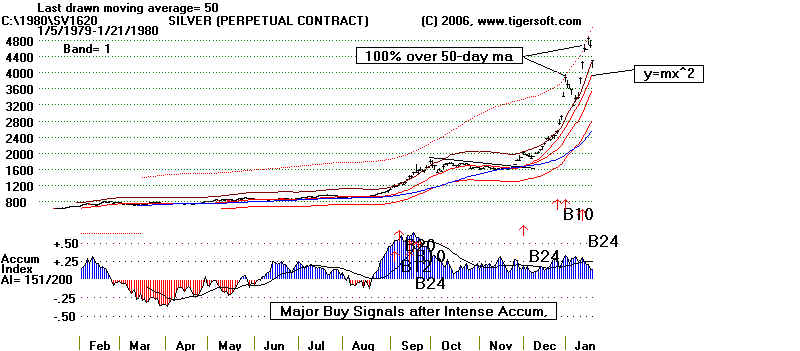
TigerSoft Tools in Action.... When
Should We Sell.
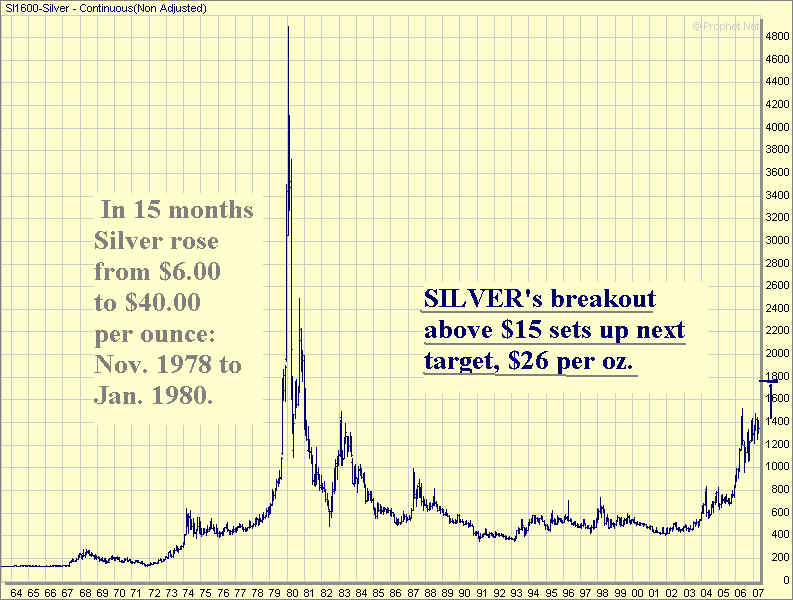
A blow-off top is very likely. That's what happened in
January 1980
after
Silver had risen from $9.00 to $48 in 4 months. In the chart below
you
can see how the TigerSoft program would have spotted the insider
buying
in August and September as the Hunt brothers bought up all the
silver
contracts as they could. The breakout in November over 17 is
interesting
because that compares with Silver's breakout this past year
above
15. Once Silver cleared 20 a second time, on 12/12/79, it rose
spectacularly.
It peaked on 1/17/80 at 48.50. Some may compare this with
what
Silver does this time around.
What
can we learn from how the 1979-1980 blast-off in Silver about how
to know when Silver has peaked?
1, The TigerSoft chart lets you put in
different length moving averages and bands above them The peaks
at 39 and 48 hit a band 100% above
the rising 50-day ma. This is a possibility, of course. I think
we should watch for that again.
2, We also use hyperbolic uptrend lines.
On the chart below is the hyperbolic function y=mx^2. Placing
a sell stop beneath the uptrendline
seems a good approach. Commodities are famous for rising
hyperbolicaly and then collapsing.
(Editor's note - This was used on our Hotline)
3. Another is to sell when silver hesitates
after a double from the breakout above a 3-month
consolidation such as we see
in the surrent silver chart at 14 last October and in the 1979-1980
chart above 17 in November.
4. And yet another, is to sell if it doubles in a
month, such as it did from 12/19/79 (23.63) to
1/17/80 (48.50)
--------------------------------------------- Silver's 1979-1980 advance.
----------------------------------------------------------------- -
More Comments
Silver had been dormant for many years since 1980. To a chartist, $48.5 is a
reasonable goal on the
current advance. The current amount of
Accumulation is much lower than it was in 1979 when the Hunt Brothers
were trying to corner the market in Silver.
But volume today is relatively higher on the current rally and the
Silver ETF make sit much easier for the public to Buy
Silver. That could produce a very dramatic rise.
The mid-1980 peak at 25 will prpably act as some
resistance to the immediate rally. At this point, $24-$26
looks like a good initial goal, but we'll have
to wait and see.
Subscribe to our Hotline and
stay informed about our views on Silver and much more.
Long-Term Chart of Silver
========================================================
Previous
TigerSoft Blogs on Silver:
This is not the first recommendation made here of Silver and SSRI.
Here are the earlier mentions of SSRI.
February 10,
2007 As
Silver Moves Past $17, Is This The Start of An Exciting Third Wave Up
November
2, 2007 Silver
Stocks: A New Run Is Starting
October 28, 2007 Evaluating Breakouts:
Case Study: The Silver Stock SSRI
September 19, 2007 Gold Breaks out with
Power as Fed Cuts Interest Rates by 1/2%
June 26, 2007 Silver Is Starting To
Tarnish.
May 18, 2006 Calling A Bottom Using The
Diagonal Lines Command with SSRI.
February 2, 2006 "Hi-Ho,
Silver"...>$10/ounce SIL
November 29, 2005 Silver Stocks Are Shining
=======================================================
|