| Daily Blog - Tiger Software |
Tuesday - June 26, 2007
Silver Is
Starting To Tarnish.
On
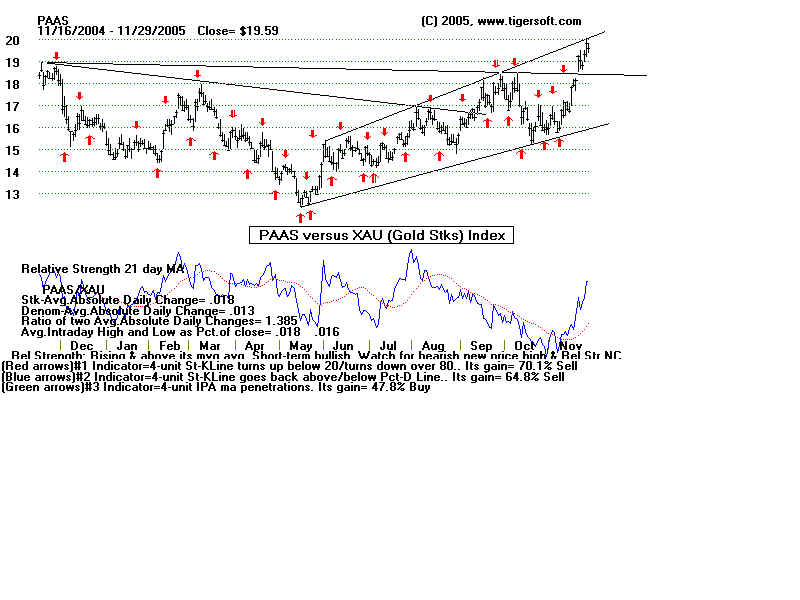
11/29.2005, I wrote for subscribers that "Gold has just broken $500 an ounce....
Silver had just
surpassed $8.00 for the first time in 20 years". I noted the bullish
breakouts
of NEM, PAAS and SSRI. But nearly all good
things and certainly all bull markets come to
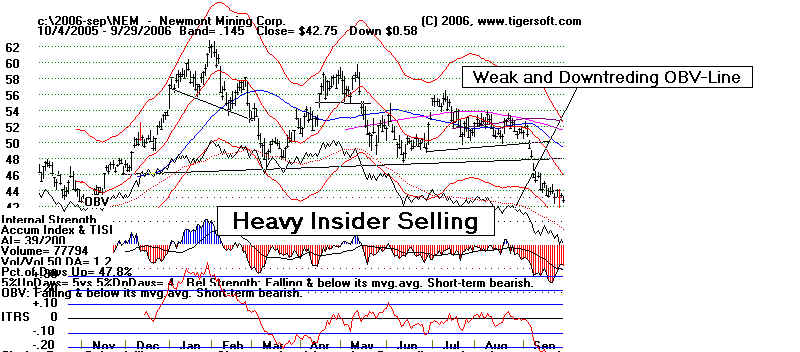
an end eventually. NEM showed heavy insider trading when it was above 50 and we
recommended it as a short sale. We now know that insiders were dumping the stock
because they knew that their Central Asian properties were being nationalized and
their
earnings outlook was poor. They waited until the stock was down 10 points to tell
their
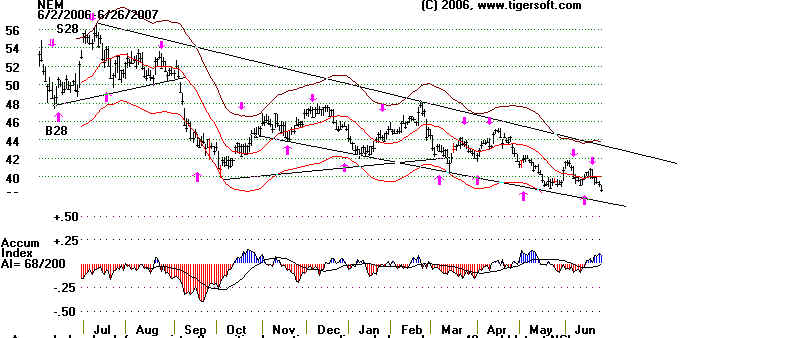
shareholders. It is now 38 and threatening to make new lows for the last
year.
Newmont - 2005-2006
Newmont 2006-2007
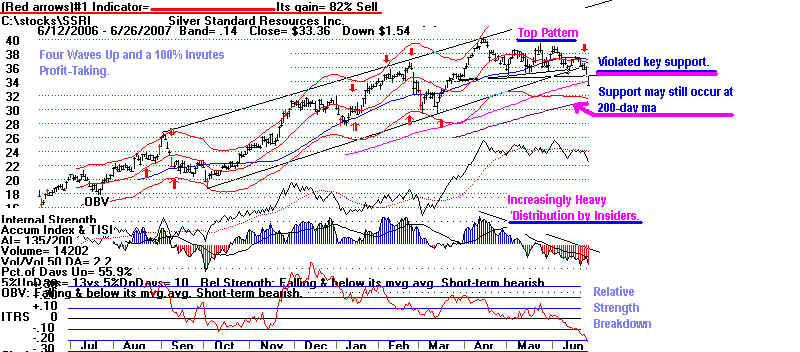
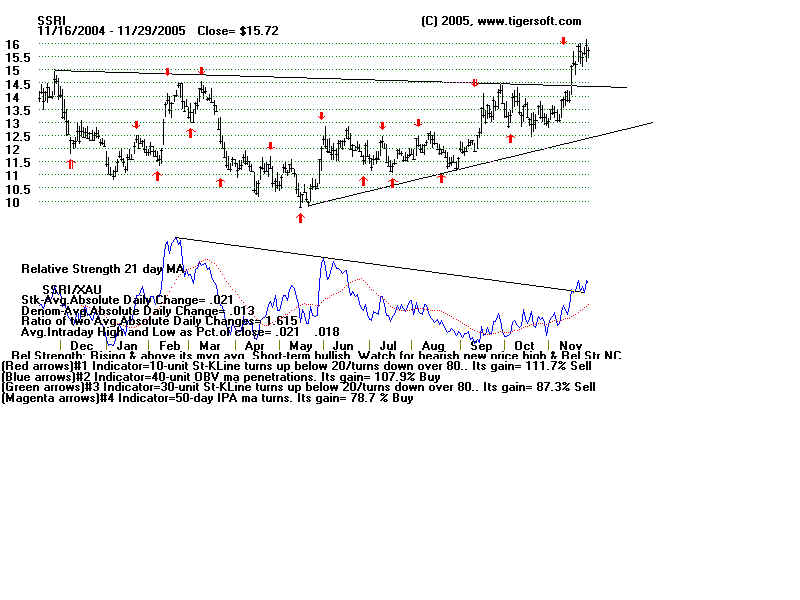
SSRI has risen 150%
since TigerSoft recommended it here in November 2005. It
keeps
finding more silver in South America. But even it, the strongest of the gold and
silver stocks, has turned bearish, having shown heavy distribution from the Tiger Accumulation
Index and completed a bearish price-pattern.
As traders, we should also recognize the possibility
that SSRI will hold above 32
and then come charging back above 36. (False moves to the down-side are part of this
stock's 'MO'.) A move quickly back above 36 would be
bullish and get us to buy it again. The
current decline owes, I think, to the Fed not wishing to let the
dollar weaken any further. As the
British Pound reached $2 and the EURO made 5 year highs a month
ago, they have tried to drive
up the dollar by threatening to raise interest rates. In
the long run, the dollar looks very weak
and silver and gold are natural hedges. But for now, SSRI has broken key support and I would
advise staying clear of it.
Silver Standards - 2006-2007
Silver 2006-2007
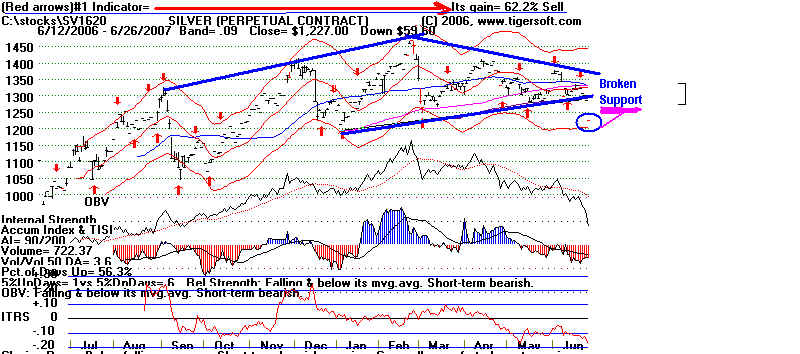
Silver (SL1620 Perpetual Commodities' Contract using Dial
Data)
shows distribution from our Accumulation Index and very aggressive
selling from
the downtrending OBV
Line. The price pattern is a bearish head and shoulders
pattern, whose neckline
has already been violated..
![]() So, what's going on here with Gold and Silver? The Federal Deficits
So, what's going on here with Gold and Silver? The Federal Deficits
are as massive
and scary as ever. I think it's that interest rates are going to be
raised by the Fed
in the next few months or even much sooner, as they try to defend
the dollar.
More about this linkage in coming reports here.
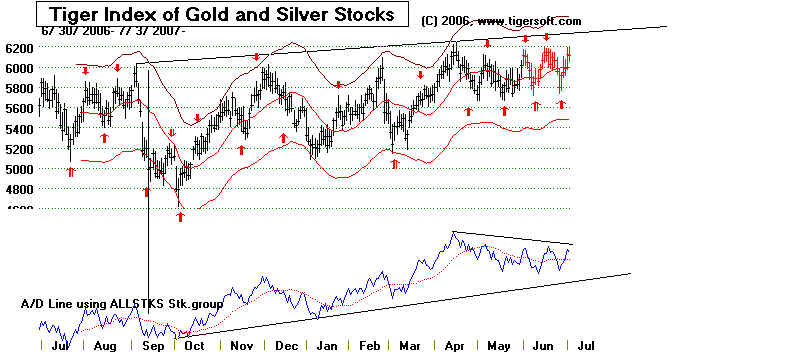
Tiger's Automatic Buy and Sell Signals have gained 60.6% on XAU (Gold Index) chart
for the past year, The XAU (Gold Stocks' Index) has gained nearly 100%. Investors in
gold and silver stocks would have done much better for the past few years using our
automatic signals than just buying and holding.
An XAU move above 150 would be a meaningful breakout. More about this linkage in coming
reports here, especially if the XAU makes its move. The chart below lends itself to the belief
that there will be an upside breakout, unless the Fed raises rates to protect the dollar.