TigerSoft News Service 10/16/2009
www.tigersoft.com
TigerSoft News Service 10/16/2009
www.tigersoft.com Other Free Tiger Blogs - http://www.tigersoft.com/Tiger-Blogs/index.htm
UNEMPLOYMENT'S REAL STORY
ENREPRENEURIAL CAPITALISM MUST NOT BE
DEFINED BY AND DESTROYED BY UNFETTERED
WALL STREET GREED, Mr. OBAMA!
WHAT YOU WON'T HEAR ON CNN OR CNBC!
Real unemployment statistics are not collected. Too embarassing.
The poor and unemployed are de-humanized. Real unemployment
is 50% above the official rate. 15.6% is a better estimate. That's
1 of every 7 workers in the US now. There has to be a better way to
maximize human potential!
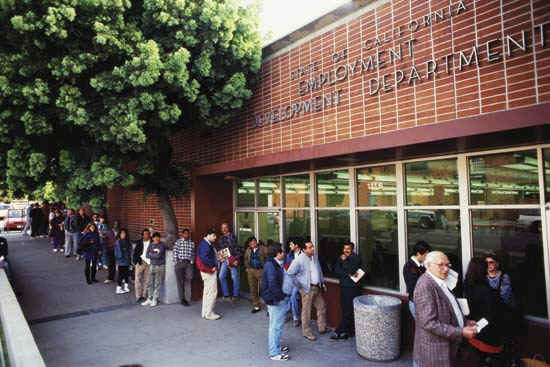
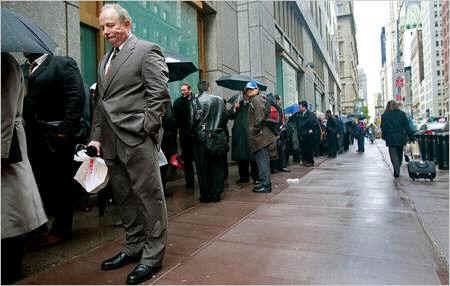
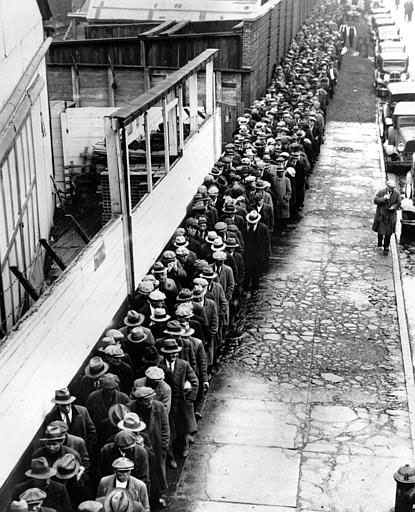
When was the last time you saw CNN or CNBC interview people
wait in line for a job? The fact is that unemployment disciplines
workers. It forces them to have to accept any job at poverty
wages. And full employment is largely a fantasy. Since 1971,
that 38 years ago, there have been only seven years when there
was "full" employment, i.e. the rate of official employment was
under 5%. It will be years we get full employment again. Yahoo
ran a story on 10/20/2009 "High Jobless Rate Could Be Permanent."
"The job market is caught in a vicious circle: Without more jobs, U.S. consumers
will have a hard time increasing their spending; but without that spending,
businesses might see little reason to start hiring... 'I think the unemployment
rate will be permanently higher, or at least higher for the foreseeable future,'
said Mark Zandi, chief economist and co-founder of Moody's Economy.com."
Meanwhile Goldman Sucks just reported profits of 3.4 Billion,
after paying saleries and bonues averaging $700,000 per employee.
JP Morgan just reported 3.6 billion in profits. Obama's subservience
to Wall Street is seen by all. The socialists' view is becoming more
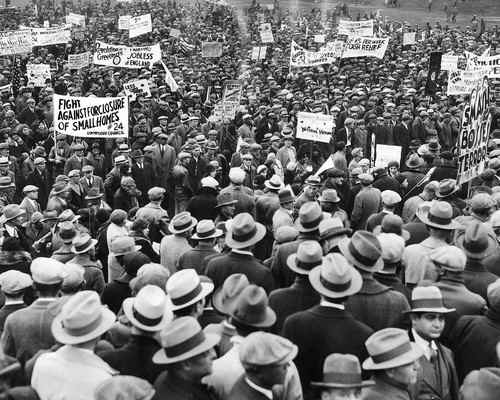
and more Main Street's. It is often said that FDR saved capitalism by
taming and regulating Wall Streets. Obama should do the same.
Wall Street greed is not capitalism.
HOW MANY MONTHS' MUST WE WAIT FOR UNEMPLOYMENT
TO START TO GO DOWN AND WILL IT GO DOWN SIGNIFICANTLY?
SHOULD AMERICAN WORKERS BE EXPECTED TO WAIT THREE YEARS
OR MUCH MORE FOR "FULL EMPLOYMENT"?
A MASSIVE PUBLICS' WORK PROGRAM SHOULD BE IMPLEMENTED NOW.
LET BANKERS RAISE MONEY FOR INVESTORS NOW. AND IMMEDIATELY
PAY BACK ALL THEY OWE THE TREASURY. AND LET THE PUBLIC PEER INTO
THE SWEAThEART DEALS THE FEDERAL RESERVE HAS WORKED OUT
WITH THE BANK-HEDGE FUNDS THAT NOW DERIVE ALMOST ALL THEIR
PROFITS FROM TRADING STOCKS.

by William Schmidt, Ph.D.
Other TigerSoft Blogs on Closely Related Topics:
3/7/2008 - Why Is Bush Bankrupting The US
3/8/2008 - Seepless in San Diego
6/30/2008 - TigerSoft's Approach for Job Finders
9/1/2008 - Labor's Untold Story in The US
5/15/2009 - Obama Is 98% Fraud and 2% Backbone
===================================================================
Buy
and Holding Is Dangerous See All The Peerless Real-Time
Signals: 1981-2009
Tiger Software - Helping Investors
since 1981 Make Your Retirement Grow
Suggestions:
Peerless Stock Market Timing: 1928-1966
Track
Record of Major Peerless Signals
Earlier Peerless-DJIA
charts
7 Paths To Making 25+%/Yr. Using
TigerSoft
Index Options
FOREX trading
Investing Longer-Term
Mutual Funds
Speculative Stocks
Swing Trading
Day Trading
Stock Options
Commodity Trading
Research on Individual Stocks upon Request: Composite Seasonality Graph
of Any Stock for $125. Example of
historical research NEM - Newmont Mining. Order Here.
FOR UNEMPLOYMENT TO START TO GO DOWN?
"LAG" Stock Market Bottoms Unemployment Peaks Results Buying
Charts are shown below. Unemployment Data are shoiwn below. When Unemployment Drops
To Next DJI High before
DJI decline to lower band.
-------------------------------------------------------------------------------------------------------------------------
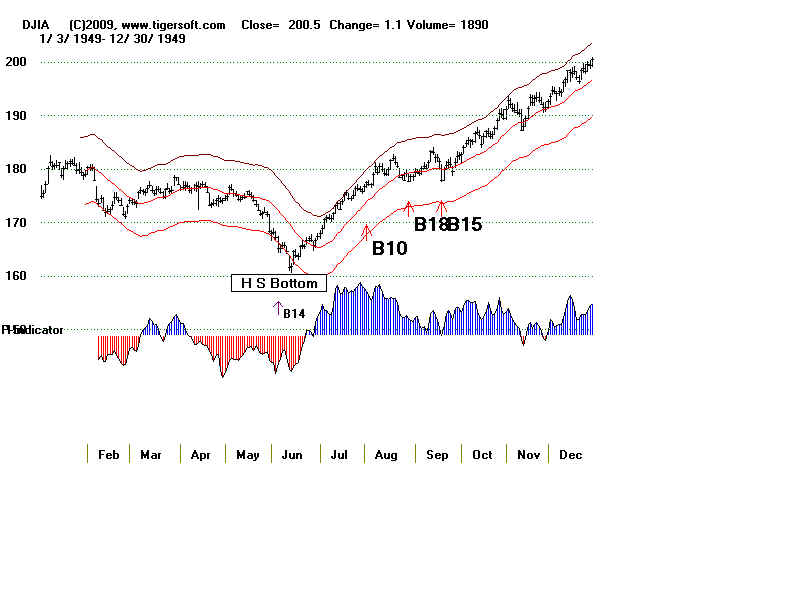
5 months June 1949 October 1949 Nov 49 Gain = 19.4%
DJI rose from 191
and ralled to 228 in June 1950
-----------------------------------------------------------------------------------------------------------------------------
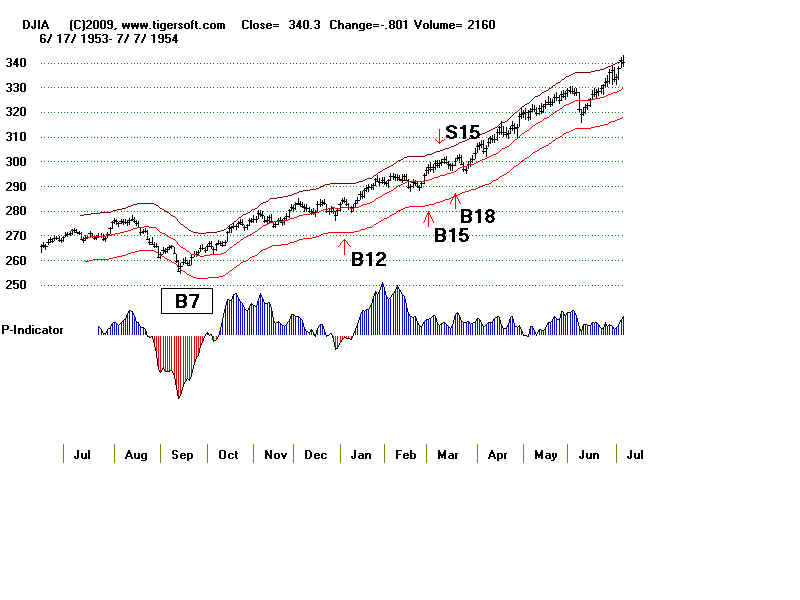
12 months September 1953 September 1954 Oct 1954 Gain = 21.7%
DJI rose from 345
and ralled to 420 in February 1955
----------------------------------------------------------------------------------------------------------------------------
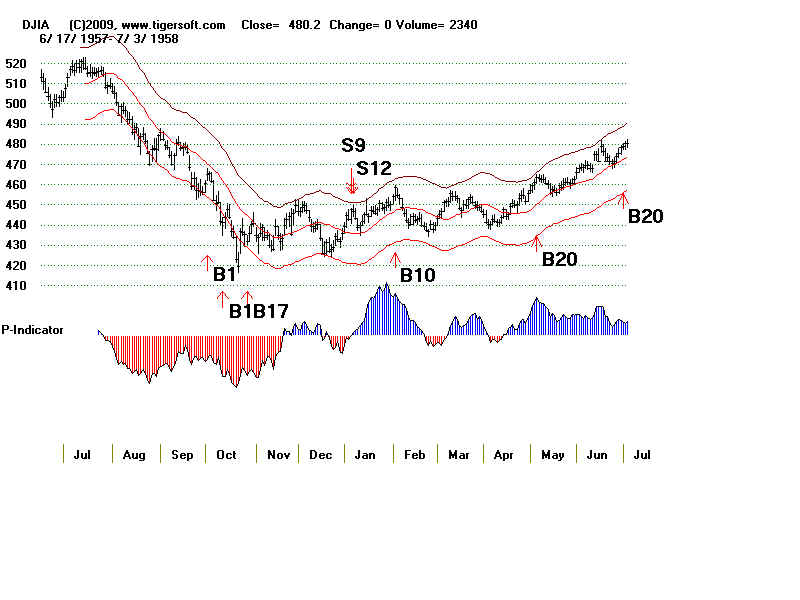
12 months October 1957 July 1958 Aug 1958 Gain = 18.6%
DJI rose from 506
and ralled to 600 in January 1959
---------------------------------------------------------------------------------------------------------------------------
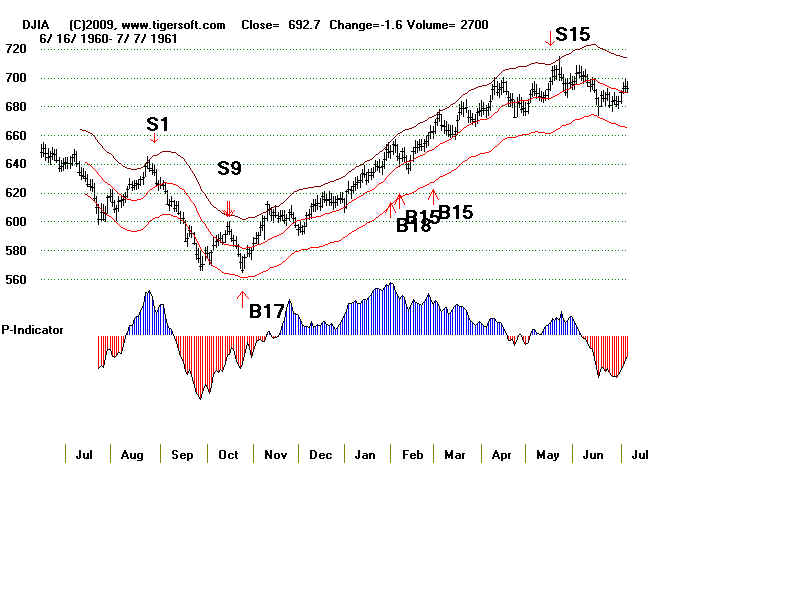
7 months October 1960 May 1961 June 1961 Gain = 3.1%
(Typical 3-4 year cycle broken by US War on Viet Nam) DJI fell from 702 to 681
and ralled to 724 in August 1958
--------------------------------------------------------------------------------------------------------------------------
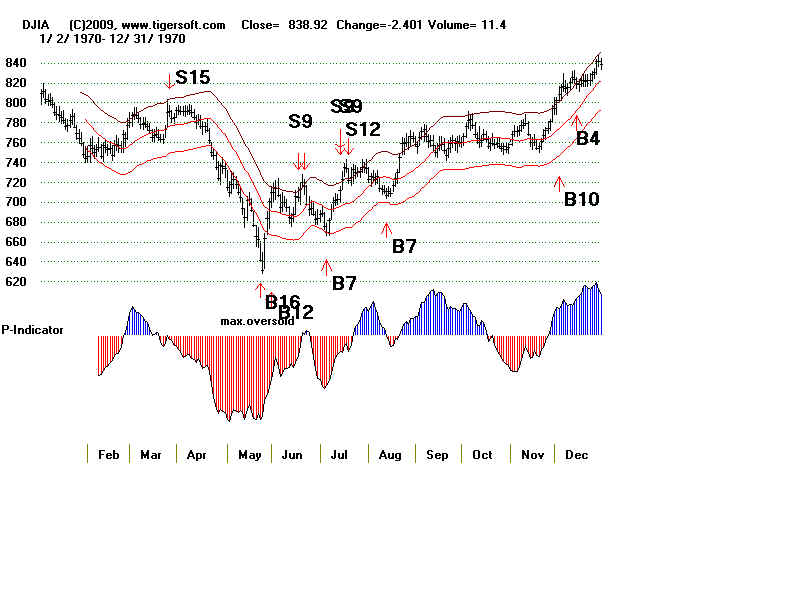
7 months May 1970 December 1970 Jan 1971 Gain = 14.0%
DJI rose from 837
and ralled to 950 in April 1971
---------------------------------------------------------------------------------------------------------------------
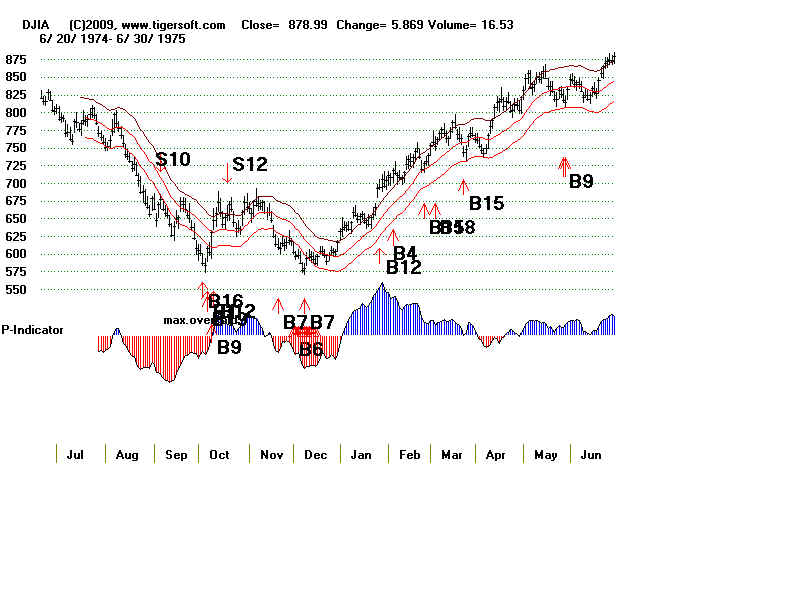
6 months December 1974 May 1975 June 1975 Gain = 3.8%
(Typical 3-4 year cycle broken. Carter Adm. failed to bring much recovery)
DJI rose from 840
and ralled to 872 in July 1975
--------------------------------------------------------------------------------------------------------------------
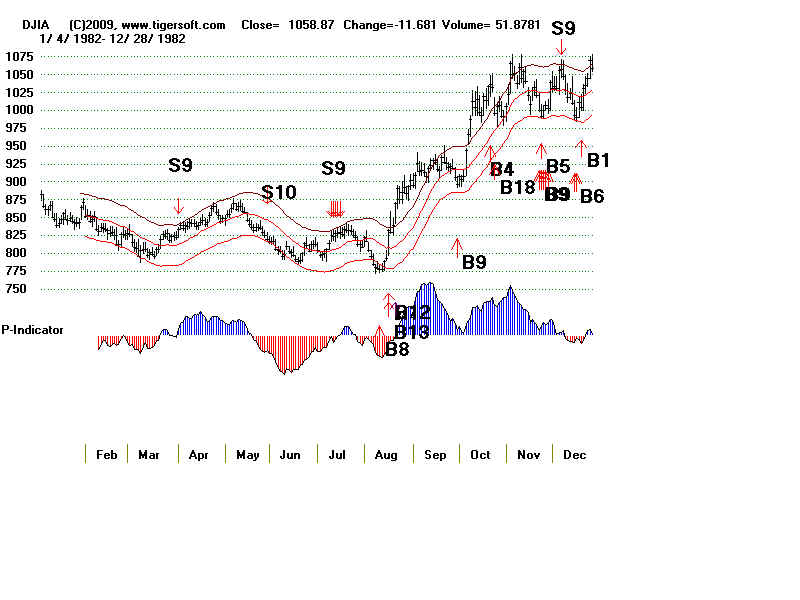
4 months August 1982 December 1982 Jan. 1983 Gain = 1.0%
(Typical 3-4 year cycle broken. No recovery to full employment. ) DJI rose from 1071
and ralled to 1092 three days later
It then fell to lower band and
rallied from 1030 to 1250 in June 82
-------------------------------------------------------------------------------------------------------------------
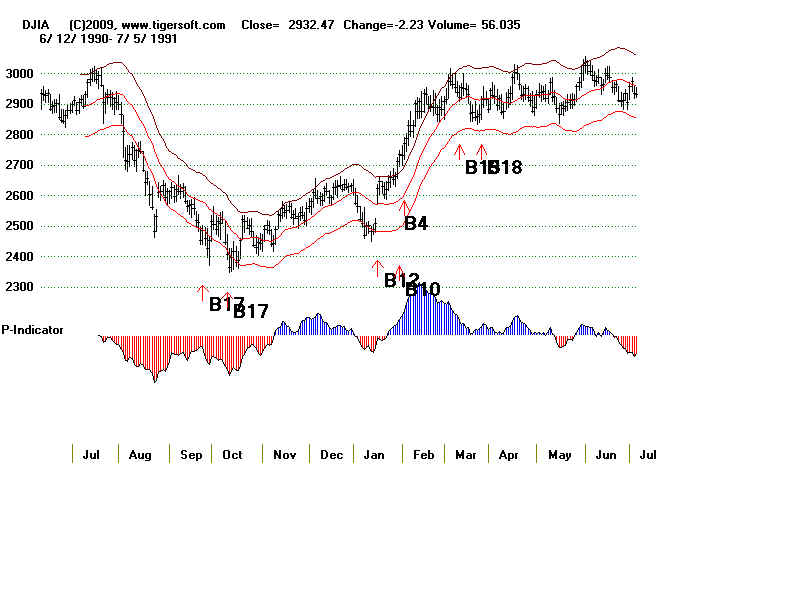
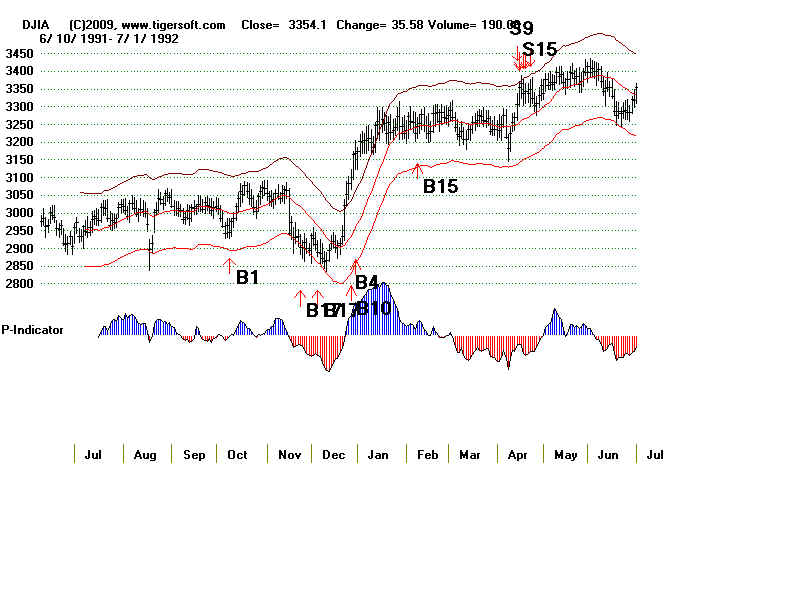
8 months November 1991 June 1992 July. 1992 Gain = 3%
DJI rose from 3295
and ralled to 3393 in two wks..
It then fell below lower band
to 3137 in October and
rallied to 3978 in Jan 93
-----------------------------------------------------------------------------------------------------------------
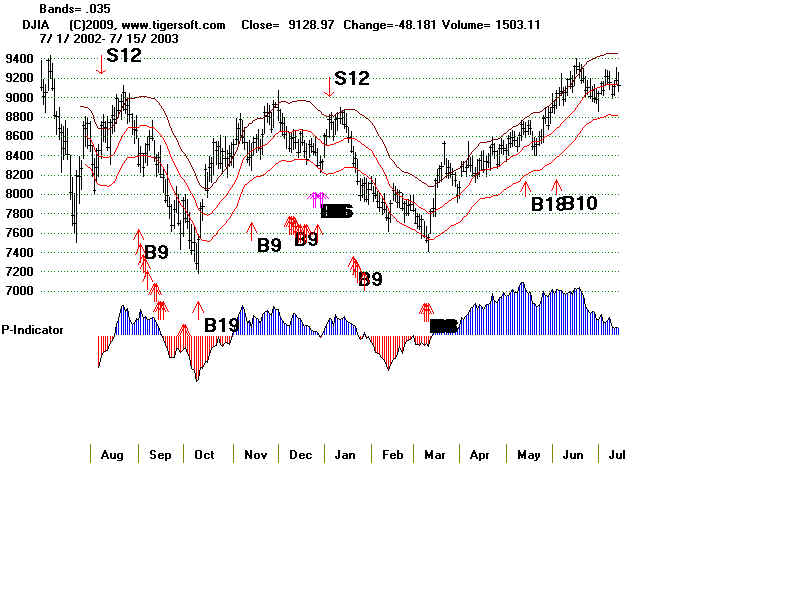
9 months October 2002 June 2003 July 2003 Gain = 4.6%
DJI rose from 9217
and ralled to 9645 in Aug 2003
====================================================================
7 months' lag is typical.
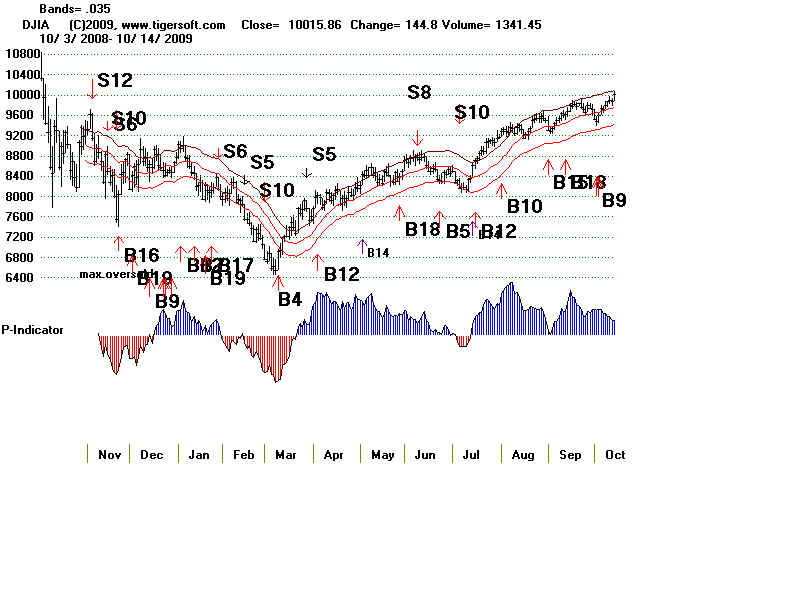
9 months? March 2009 December 2009 ??????? 10% rally the the next
peak before a decline to
the lower band.
But since 1975, the avg
gain has only been 3.2%
_____________________________________

_______________________________________
HOW QUICK WILL THERE BE A REAL RECOVERY?
Unemployment statistics should start dropping soon. It has been seven months since
the stock market turned up. Typically, 7 months after a bottom by the Dow Jones Industrial
Average, the rate of unemployment peaks, though in 1954 and 1958 it took a year. The last
two recessions, 1991-1992 and 2001-2003, did not bring an improvement for 8 and 9 months
after the market's bottom.
The real questions should be will there be much of a recovery? And if not, what must the
Government do this time around to bring about full employment. If we take full employment
to be under 5%, the answer is it could take a very long time.
HOW MANY MONTHS' MUST WE WAIT
FOR "FULL" EMPLOYMENT, UNDER 5% UNEMPLOYMENT?
The statistics below show that it will take years and years before we see full
employment. This in intolerable, and even more so, considering the trillions
given the very bankers whose greed caused do much human misery. A new
economic system that guyarantees employment for all at a decent wage is
obviously needed. Employment should be a human right in the US. Three
years, if we are lucky, is far too long to have to wait for a job. No wonder
5% own 95% of America! The Democrats and Obama refuse to face these
inescapable conclusions. This is disgraceful!
"LAG" Stock Market Bottoms Unemployment Drops below 5%
Charts are shown below.
13 months June 1949 August 1950 with "help" of Korean War.
16 months September 1953 January 1955
28 months October 1957 February 1960
34 months October 1960 July 1964
(Typical 3-4 year cycle broken by US War on Viet Nam)
32 months May 1970 January 1973
6 months December 1974 May 1975
(Typical 3-4 year cycle broken. Carter Adm. failed to bring much recovery)
15 years!!! August 1982 July 1997
(Typical 3-4 year cycle broken. No recovery to full employment. )
68 months November 1991 July 1997
35 months October 2002 August 2005
====================================================================
Green - "Full" employment
| Year | Jan | Feb | Mar | Apr | May | Jun | Jul | Aug | Sep | Oct | Nov | Dec | BACKGROUND |
|---|---|---|---|---|---|---|---|---|---|---|---|---|---|
| 1948 | 3.4 | 3.8 | 4.0 | 3.9 | 3.5 | 3.6 | 3.6 | 3.9 | 3.8 | 3.7 | 3.8 | 4.0 | |
| 1949 | 4.3 | 4.7 | 5.0 | 5.3 | 6.1 | 6.2 | 6.7 | 6.8 | 6.6 | 7.9 | 6.4 | 6.6 | |
| 1950 | 6.5 | 6.4 | 6.3 | 5.8 | 5.5 | 5.4 | 5.0 | 4.5 | 4.4 | 4.2 | 4.2 | 4.3 | WAR |
| 1951 | 3.7 | 3.4 | 3.4 | 3.1 | 3.0 | 3.2 | 3.1 | 3.1 | 3.3 | 3.5 | 3.5 | 3.1 | WAR |
| 1952 | 3.2 | 3.1 | 2.9 | 2.9 | 3.0 | 3.0 | 3.2 | 3.4 | 3.1 | 3.0 | 2.8 | 2.7 | WAR |
| 1953 | 2.9 | 2.6 | 2.6 | 2.7 | 2.5 | 2.5 | 2.6 | 2.7 | 2.9 | 3.1 | 3.5 | 4.5 | WAR |
| 1954 | 4.9 | 5.2 | 5.7 | 5.9 | 5.9 | 5.6 | 5.8 | 6.0 | 6.1 | 5.7 | 5.3 | 5.0 | |
| 1955 | 4.9 | 4.7 | 4.6 | 4.7 | 4.3 | 4.2 | 4.0 | 4.2 | 4.1 | 4.3 | 4.2 | 4.2 | |
| 1956 | 4.0 | 3.9 | 4.2 | 4.0 | 4.3 | 4.3 | 4.4 | 4.1 | 3.9 | 3.9 | 4.3 | 4.2 | |
| 1957 | 4.2 | 3.9 | 3.7 | 3.9 | 4.1 | 4.3 | 4.2 | 4.1 | 4.4 | 4.5 | 5.1 | 5.2 | |
| 1958 | 5.8 | 6.4 | 6.7 | 7.4 | 7.4 | 7.3 | 7.5 | 7.4 | 7.1 | 6.7 | 6.2 | 6.2 | |
| 1959 | 6.0 | 5.9 | 5.6 | 5.2 | 5.1 | 5.0 | 5.1 | 5.2 | 5.5 | 5.7 | 5.8 | 5.3 | |
| 1960 | 5.2 | 4.8 | 5.4 | 5.2 | 5.1 | 5.4 | 5.5 | 5.6 | 5.5 | 6.1 | 6.1 | 6.6 | |
| 1961 | 6.6 | 6.9 | 6.9 | 7.0 | 7.1 | 6.9 | 7.0 | 6.6 | 6.7 | 6.5 | 6.1 | 6.0 | |
| 1962 | 5.8 | 5.5 | 5.6 | 5.6 | 5.5 | 5.5 | 5.4 | 5.7 | 5.6 | 5.4 | 5.7 | 5.5 | |
| 1963 | 5.7 | 5.9 | 5.7 | 5.7 | 5.9 | 5.6 | 5.6 | 5.4 | 5.5 | 5.5 | 5.7 | 5.5 | |
| 1964 | 5.6 | 5.4 | 5.4 | 5.3 | 5.1 | 5.2 | 4.9 | 5.0 | 5.1 | 5.1 | 4.8 | 5.0 | |
| 1965 | 4.9 | 5.1 | 4.7 | 4.8 | 4.6 | 4.6 | 4.4 | 4.4 | 4.3 | 4.2 | 4.1 | 4.0 | WAR |
| 1966 | 4.0 | 3.8 | 3.8 | 3.8 | 3.9 | 3.8 | 3.8 | 3.8 | 3.7 | 3.7 | 3.6 | 3.8 | WAR |
| 1967 | 3.9 | 3.8 | 3.8 | 3.8 | 3.8 | 3.9 | 3.8 | 3.8 | 3.8 | 4.0 | 3.9 | 3.8 | WAR |
| 1968 | 3.7 | 3.8 | 3.7 | 3.5 | 3.5 | 3.7 | 3.7 | 3.5 | 3.4 | 3.4 | 3.4 | 3.4 | WAR |
| 1969 | 3.4 | 3.4 | 3.4 | 3.4 | 3.4 | 3.5 | 3.5 | 3.5 | 3.7 | 3.7 | 3.5 | 3.5 | WAR |
| 1970 | 3.9 | 4.2 | 4.4 | 4.6 | 4.8 | 4.9 | 5.0 | 5.1 | 5.4 | 5.5 | 5.9 | 6.1 | WAR |
| 1971 | 5.9 | 5.9 | 6.0 | 5.9 | 5.9 | 5.9 | 6.0 | 6.1 | 6.0 | 5.8 | 6.0 | 6.0 | WAR |
| 1972 | 5.8 | 5.7 | 5.8 | 5.7 | 5.7 | 5.7 | 5.6 | 5.6 | 5.5 | 5.6 | 5.3 | 5.2 | WAR |
| 1973 | 4.9 | 5.0 | 4.9 | 5.0 | 4.9 | 4.9 | 4.8 | 4.8 | 4.8 | 4.6 | 4.8 | 4.9 | WAR |
| 1974 | 5.1 | 5.2 | 5.1 | 5.1 | 5.1 | 5.4 | 5.5 | 5.5 | 5.9 | 6.0 | 6.6 | 7.2 | WAR |
| 1975 | 8.1 | 8.1 | 8.6 | 8.8 | 9.0 | 8.8 | 8.6 | 8.4 | 8.4 | 8.4 | 8.3 | 8.2 | |
| 1976 | 7.9 | 7.7 | 7.6 | 7.7 | 7.4 | 7.6 | 7.8 | 7.8 | 7.6 | 7.7 | 7.8 | 7.8 | |
| 1977 | 7.5 | 7.6 | 7.4 | 7.2 | 7.0 | 7.2 | 6.9 | 7.0 | 6.8 | 6.8 | 6.8 | 6.4 | |
| 1978 | 6.4 | 6.3 | 6.3 | 6.1 | 6.0 | 5.9 | 6.2 | 5.9 | 6.0 | 5.8 | 5.9 | 6.0 | |
| 1979 | 5.9 | 5.9 | 5.8 | 5.8 | 5.6 | 5.7 | 5.7 | 6.0 | 5.9 | 6.0 | 5.9 | 6.0 | |
| 1980 | 6.3 | 6.3 | 6.3 | 6.9 | 7.5 | 7.6 | 7.8 | 7.7 | 7.5 | 7.5 | 7.5 | 7.2 | |
| 1981 | 7.5 | 7.4 | 7.4 | 7.2 | 7.5 | 7.5 | 7.2 | 7.4 | 7.6 | 7.9 | 8.3 | 8.5 | |
| 1982 | 8.6 | 8.9 | 9.0 | 9.3 | 9.4 | 9.6 | 9.8 | 9.8 | 10.1 | 10.4 | 10.8 | 10.8 | |
| 1983 | 10.4 | 10.4 | 10.3 | 10.2 | 10.1 | 10.1 | 9.4 | 9.5 | 9.2 | 8.8 | 8.5 | 8.3 | |
| 1984 | 8.0 | 7.8 | 7.8 | 7.7 | 7.4 | 7.2 | 7.5 | 7.5 | 7.3 | 7.4 | 7.2 | 7.3 | |
| 1985 | 7.3 | 7.2 | 7.2 | 7.3 | 7.2 | 7.4 | 7.4 | 7.1 | 7.1 | 7.1 | 7.0 | 7.0 | |
| 1986 | 6.7 | 7.2 | 7.2 | 7.1 | 7.2 | 7.2 | 7.0 | 6.9 | 7.0 | 7.0 | 6.9 | 6.6 | |
| 1987 | 6.6 | 6.6 | 6.6 | 6.3 | 6.3 | 6.2 | 6.1 | 6.0 | 5.9 | 6.0 | 5.8 | 5.7 | |
| 1988 | 5.7 | 5.7 | 5.7 | 5.4 | 5.6 | 5.4 | 5.4 | 5.6 | 5.4 | 5.4 | 5.3 | 5.3 | |
| 1989 | 5.4 | 5.2 | 5.0 | 5.2 | 5.2 | 5.3 | 5.2 | 5.2 | 5.3 | 5.3 | 5.4 | 5.4 | |
| 1990 | 5.4 | 5.3 | 5.2 | 5.4 | 5.4 | 5.2 | 5.5 | 5.7 | 5.9 | 5.9 | 6.2 | 6.3 | |
| 1991 | 6.4 | 6.6 | 6.8 | 6.7 | 6.9 | 6.9 | 6.8 | 6.9 | 6.9 | 7.0 | 7.0 | 7.3 | WAR |
| 1992 | 7.3 | 7.4 | 7.4 | 7.4 | 7.6 | 7.8 | 7.7 | 7.6 | 7.6 | 7.3 | 7.4 | 7.4 | |
| 1993 | 7.3 | 7.1 | 7.0 | 7.1 | 7.1 | 7.0 | 6.9 | 6.8 | 6.7 | 6.8 | 6.6 | 6.5 | |
| 1994 | 6.6 | 6.6 | 6.5 | 6.4 | 6.1 | 6.1 | 6.1 | 6.0 | 5.9 | 5.8 | 5.6 | 5.5 | |
| 1995 | 5.6 | 5.4 | 5.4 | 5.8 | 5.6 | 5.6 | 5.7 | 5.7 | 5.6 | 5.5 | 5.6 | 5.6 | |
| 1996 | 5.6 | 5.5 | 5.5 | 5.6 | 5.6 | 5.3 | 5.5 | 5.1 | 5.2 | 5.2 | 5.4 | 5.4 | |
| 1997 | 5.3 | 5.2 | 5.2 | 5.1 | 4.9 | 5.0 | 4.9 | 4.8 | 4.9 | 4.7 | 4.6 | 4.7 | |
| 1998 | 4.6 | 4.6 | 4.7 | 4.3 | 4.4 | 4.5 | 4.5 | 4.5 | 4.6 | 4.5 | 4.4 | 4.4 | |
| 1999 | 4.3 | 4.4 | 4.2 | 4.3 | 4.2 | 4.3 | 4.3 | 4.2 | 4.2 | 4.1 | 4.1 | 4.0 | |
| 2000 | 4.0 | 4.1 | 4.0 | 3.8 | 4.0 | 4.0 | 4.0 | 4.1 | 3.9 | 3.9 | 3.9 | 3.9 | |
| 2001 | 4.2 | 4.2 | 4.3 | 4.4 | 4.3 | 4.5 | 4.6 | 4.9 | 5.0 | 5.3 | 5.5 | 5.7 | |
| 2002 | 5.7 | 5.7 | 5.7 | 5.9 | 5.8 | 5.8 | 5.8 | 5.7 | 5.7 | 5.7 | 5.9 | 6.0 | |
| 2003 | 5.8 | 5.9 | 5.9 | 6.0 | 6.1 | 6.3 | 6.2 | 6.1 | 6.1 | 6.0 | 5.8 | 5.7 | |
| 2004 | 5.7 | 5.6 | 5.8 | 5.6 | 5.6 | 5.6 | 5.5 | 5.4 | 5.4 | 5.5 | 5.4 | 5.4 | |
| 2005 | 5.2 | 5.4 | 5.2 | 5.2 | 5.1 | 5.1 | 5.0 | 4.9 | 5.0 | 5.0 | 5.0 | 4.8 | |
| 2006 | 4.7 | 4.8 | 4.7 | 4.7 | 4.7 | 4.6 | 4.7 | 4.7 | 4.5 | 4.4 | 4.5 | 4.4 | |
| 2007 | 4.6 | 4.5 | 4.4 | 4.5 | 4.5 | 4.6 | 4.7 | 4.7 | 4.7 | 4.8 | 4.7 | 4.9 | |
| 2008 | 4.9 | 4.8 | 5.1 | 5.0 | 5.5 | 5.6 | 5.8 | 6.2 | 6.2 | 6.6 | 6.8 | 7.2 | |
| 2009 | 7.6 | 8.1 | 8.5 | 8.9 | 9.4 | 9.5 | 9.4 | 9.7 | 9.8 |