|
==== THIS IS A PERFECT TIME TO TRADE GOLD STOCKS WITH
TIGERSOFT ======

See TigerSoft Introduction http://tigersoft.com/--3--/Explanation/index.html
===================================================================================
THE MONETARY FIX,
INCOME INEQUALITY IN THE US
AND THE BEST
GOLD STOCKS TO BUY AND TRADE
3% INTEREST RATES BOOST GOLD
The dramatic Federal Reserve Rate cuts are doing exactly what they are really intended to
do, help
"financials" make
more money, boost their depressed stock prices and avert a need for a Federal bailout
of a major bank, like Northern Rock
in the UK last year. The drop in interest rates puts strong downward
pressure on the Dollar.
Higher interest rates prevail overseas. So, hot money moves away from the US.
Americans on fixed incomes should
investigate the returns they can get from overseas utilities.
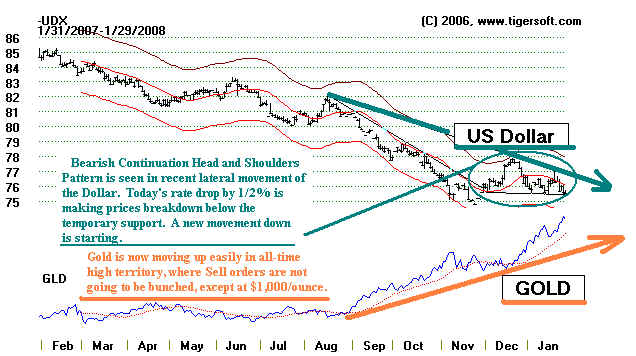
 The Dollar Index is flirting with making
a new all-time low The Dollar Index is flirting with making
a new all-time low 
against a basket of foreign currencies.
Gold is making more record new highs. Gold is a haven for those
concerned about currency volatility.
Since its upturn in 2002,
it has provided a positive return, unlike real
interest rates (annual interest minus
inflation) and it provides safety to those who have read about the collapse
of currencies. I have written about
the collapse of the German
Mark in the 1920s and the Argentina's Peso
in 2002. Yes, it most certainly
could happen here.
-------- As
The Dollar Goes Down, Gold Rises Inversely
--------------
-----------------------
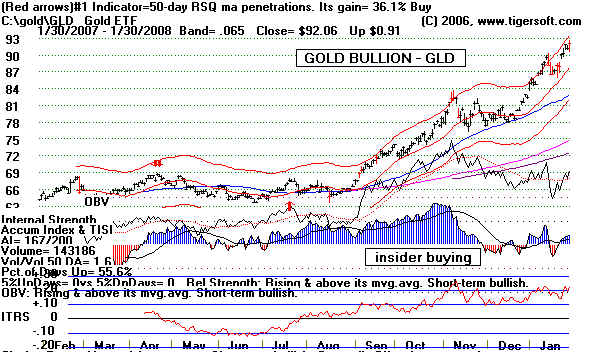
GOLD ETF MAKES NEW HIGHS -----------------------------
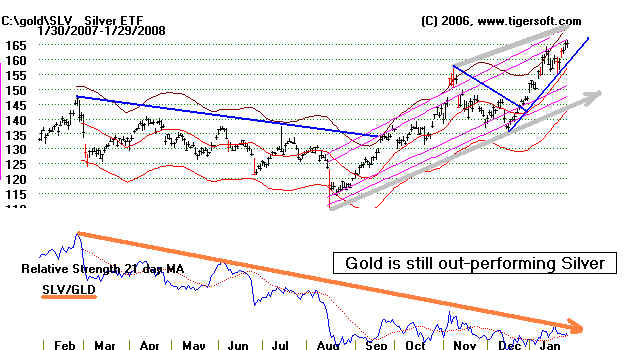
----------------- SILVER
ETF MAKES NEW HIGHS -----------------------
I believe that before the precious metals' markets uptrend finally ends, Silver will rise
spectacularly
as it did in early 1980.
Then in tripled, from $15 to $50/ounce. While there are limits on the number
of futures' contracts an
individual trader can buy, thereby preventing some like the Hunt Brothers from
"cornering" the
silver market to run in the shorts, the existence of Exchange Traded funds makes the
buying of gold and silver an
easy commodity to speculate in. And most extreme markets end in "bubbles
of wild speculation".
The metals market have not begin to approach the wild final phase.
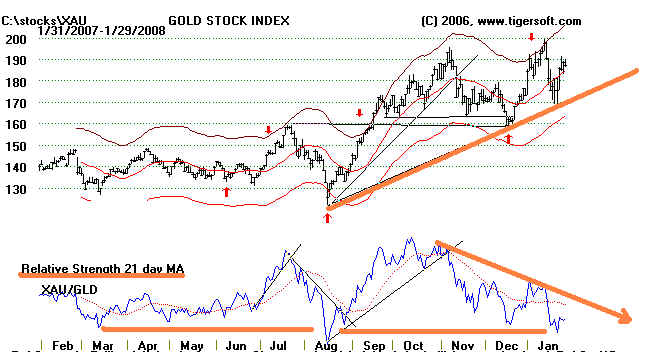
================= Gold
Stocks Index (XAU) ===================================
Should you buy Gold or Gold Stocks? Gold is less volatile. The two have tracked each
other
quite closely. You can use a
relative strength tool like Tiger's, RSQ - Relative Strength Quotient -
and plot the quotient of GLD
(gold bullion) divided by the XAU Index of Gold and Silver stocks.
It will show you uptrends and
downtrends. Draw trendlines to capture these swings. But also notice
the floor of support of the
RSQ for XAU/GLD at current levels. This makes Gold Stocks attractive
now, it seems to me. I
will take up the matter of finding the right gold and silver stocks further below.
But first I want to raise
questions about the very suitability of the Fed's monetary as a solution for
the coming recession.
========= Rate Cuts Won't Fix What Is Broken
about The US Economy =========
INCOME INEQUALITY IS BIGGEST THREAT
TO THE AMERICAN ECONOMY
The US Dollar's previous low was set in 1974 as Nixon
resigned. Some might see this as a sign that
things can only get better.
But the Dollar decline will eat up those on fixed incomes as import prices rise.
And with so many
manufacturing jobs already gone overseas, it is not clear how much more the US
will export. Watch to
see if the interest on your bank and credit loans do, in fact, go down. So, cuts in
interest rates and a lower
Dollar are not even a trade-off. They won't increase exports and they will
encourage hot capital
(including US savings) to leave the US.
They are being set out as an economic stimulus. In reality, they only help shore up the US
stock markets
until the Presidential
Election is over. Next year, all bets will be off. The basic problems remain
untouched by monetary
(interest rate) palliatives. Bush's $2 trillion blunder - the Iraq war - continues
on and on. For what?
To help him save face. Because he is stubborn. Because he wants his
cronies
to get all they can while
they can and leave the US Federal Deficit so over-drawn, there will be little
a new White House can do,
except to cut spending when they come into office. If they tax the wealthy,
they will only ensure a
deeper bear market with all the attendant political risks. The truth is Bush's was
has benefited only the
zero-bid and hugely wasteful military industrial complex and those who are content
that hatred for the US is
spreading so that more military spending will be justified.
The rate cut does very little to help bring back the millions and millions of white collar
and manufacturing
US jobs that have been outsouced
for the sake of higher multinational profits. Though productivity is rising,
real wages have been declining
since 1973, and the trend is now worsening.
"During the 17 years after 1973, real wages declined to 86 percent in 1995 and
recovered
to only 92 percent of real wages in
2000 during the "economic boom" of the late 1990s. "If 'free trade' had
been a better policy. . . their
real wages in 2000 should have been significantly more than 175 percent of 1973
--not a reduction," http://www.nikutai-to-kageboushi.com/uspovrty.html
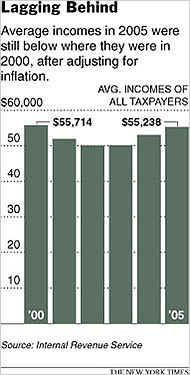
"Americans earned a smaller average income in 2005 than in 2000, the fifth
consecutive year that
they had to make ends meet with less
money than at the peak of the last economic expansion."
 Real income growth here was
calculated using BLS data measures Real income growth here was
calculated using BLS data measures
of CPI. It’s even worse than this in
reality, as we have long demonstrated that CPI does not accurately
measure inflation. So the true, after
inflation, "Real Income," is actually far, far worse. Perhaps
this explains
why 2/3rds of the people interviewed in a WSJ/NBC survey
believe that we are either in a recession or will
be within a year.
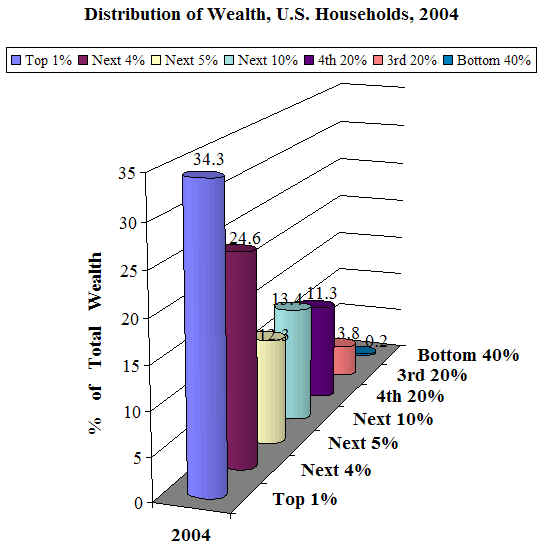
Also, it is no secret:that income growth has been concentrated in the highest few
percentile:
"The growth in total incomes was
concentrated among those making more than $1 million. The number of such
taxpayers grew by more than 26 percent, to
303,817 in 2005, from 239,685 in 2000. "These individuals, who
constitute less than a quarter of 1 percent of
all taxpayers, reaped almost 47 percent of the total income gains
in 2005, compared with 2000. People with
incomes of more than a million dollars also received 62 percent of the
savings from the reduced tax rates on long-term
capital gains and dividends that President Bush signed into law in
2003, according to a separate analysis by
Citizens for Tax Justice, a group that points out policies that it says
favor the rich. The group’s
calculations showed that 28 percent of the investment tax cut savings went to just
11,433 of the 134 million taxpayers, those who
made $10 million or more, saving them almost $1.9 million each.
Over all, this small number of wealthy
Americans saved $21.7 billion in taxes on their investment income as a
result of the tax-cut law." (Source:
http://bigpicture.typepad.com/comments/2007/08/real-income-fai.html
)
By all measures, poverty is dramatically on the rise. Sickness and suffering are on the
rise, too, because
health insurance is pricing itself beyond
the reach of 40 million Americans. And millions more can afford only
very high deductibles, $5,000 a year, and
so avoid going to doctors for basic tests. Math and science education
suffer; because college education is made
more and more impossibly expensive. Tuition is 36 times higher now
than when I went to school in the 1960s.
Meanwhile,
the greed and insider trading of corporate CEOs knows no bound. But Federal trade
and
government deficits are now so big, there
is no money to rebuild American infrastructure and provide unemployed
American workers decent jobs. So,
most Americans go deeper and deeper in debt and work longer and longer
hours. When their equity in their
house goes to zero, they walk away from it. That's what CEO and business
schools teach. So, I can't see how
lowering interest rates will help much, except in the short run.
The
income inequality in the US is the greatest its been since the 1920's. It is also
the greatest
threat to the American economy and
American Democracy. The Keynesians were correct. Under consumption
led to the Great Depression, not mixed up
monetary policies, as Friedman and his pupil Ben Bernacke would
have us believe. With many credit
markets receiving emmergency bail-out remedies, we should, I think, go
back over the records of FDR's Federal Reserve Chairman, Marriner Eccles. In the late 1920s, before
the Crash, Eccles gave speeches to other
bankers in which he warned about the dangers inherent in the
then widening gap of wealth. He was
laughed at!
"We
sustained high levels of employment in that period with the aid of an exceptional
expansion
of debt outside of the banking
system. This debt was provided by the large growth of business savings as well as
savings by individuals, particularly in
the upper-income groups where taxes were relatively low. Private debt outside
of the banking system increased about
fifty per cent. This debt, which was at high interest rates, largely took the
form of mortgage debt on housing,
office, and hotel structures, consumer installment debt, brokers' loans, and
foreign debt. The
stimulation to spending by debt-creation of this sort was short-lived and could not be
counted on to sustain high levels of
employment for long periods of time. Had there been a better
distribution of the current income from
the national product -- in other words, had there been less savings
by business and the higher-income groups
and more income in the lower groups -- we should have had far
greater stability in our economy.
Had the six billion dollars, for instance, that were loaned by corporations and
wealthy individuals for stock-market
speculation been distributed to the public as lower prices or higher wages and
with less profits to the corporations and
the well-to-do, it would have prevented or greatly moderated the economic
collapse that began at the end of
1929.".
( http://www.tpmcafe.com/discussiontables/economics_table/2007/dec/03/income_inequality_caused_depression_marriner_eccles#comment
)
Politicians
Have Learned Little from The 1920s
"The Roaring Twenties were an era dominated by Republican presidents: Warren Harding
(1920-1923),
Calvin Coolidge (1923-1929) and Herbert
Hoover (1929-1933). Under their conservative economic philosophy
of laissez-faire ("leave it
alone"), markets were allowed to operate without government interference. Taxes and
regulation were slashed dramatically,
monopolies were allowed to form, and inequality of wealth and income
reached record levels. The country was on
the conservative's preferred gold standard, and the Federal Reserve
was not allowed to significantly change
the money supply.
"The fact that the Great Depression began in 1929, then, on the Republicans' watch,
is a great
embarrassment to conservative economists.
Many try to blame the worsening of the Depression on Hoover,
for supposedly betraying the laissez-faire
ideology." (Or the Federal Reserve for not dropping interest rates.)
But much more importantly, the economy
was clearly turning downward even before Hoover took office in 1929.
Entire sectors of the economy were
depressed throughout the decade, like agriculture, energy and mining. Even the
two industries with the most spectacular
growth -- construction and automobile manufacturing -- were contracting
in the year before the stock market crash
of 1929. About 600 banks a year were failing. Half the American people
lived at or below the minimum subsistence
level. By the time the stock market crashed, there was a major glut of
goods on the market, with inventories
three times their normal size."
"A depression, Keynes believed, is an especially severe recession in which people
hoard money no
matter how much the central bank tries to
expand the money supply. In that case, he suggested that government
should do what the people were not: start
spending. He called this "priming the pump" of the economy. Indeed,
most economists believe that only massive
U.S. defense spending in preparation for World War II cured the
Great Depression."
(Source: http://www.huppi.com/kangaroo/Causes.htm
)
With the Dollar falling, rich Americans are smart enough to know to buy overseas precious
metal stocks
and get higher real interest rates by sending
their money overseas.
(Source: http://www.faculty.fairfield.edu/faculty/hodgson/Courses/so11/stratification/income&wealth.htm
)
For historical trends in distribution of wealth
see:
http://sociology.ucsc.edu/whorulesamerica/power/wealth.html
Comparisons among Countries
Wealth Owned by Top Ten Percent
US 70%
France 61%
Sweden 59%
UK 56%
Canada 53%
Norway 51%
Germany 44%
Finland 42%
|
What Gold Stocks Should You Buy?
Past trends do tend to continue in the stock market. If you had bought the top best
performing
five stocks of 2006, you would have
gained about 37.4% for the last 12 months. If you had bought
the next five best, you would have
gained 29.5%. If you had bought the five highest
Tiger Accumulation
Index stocks, you would have gained
50.8%. Buying the top 5 Power-Ranked (which is
a 3-6 months'
out tool, you would have gained 13.7%.
Interestingly, if you had bought the next highest 5 Power-Ranked
stocks, you would have gained 54.7% for
the last 12 months.
So what are the highest Accumulated Gold Stocks now.
Top 10
Accumulation Index
12/29/2008
====================
AZS
174
17.81
GLD
167
91.15
IAU
159
91.19
GOLD 156
46.72
MVG
144 13.50
What
are the best performing Gold stocks for the last year?
Top 5 Percent Change
Last 250 Days
1/31/2007
====================
SA
103%
24.77
GOLD 98%
46.72
MVG 98%
13.50
ABX
79% 53.23
KGC
65% 21.97
Second Five Power Ranked
1/29/2007
====================
GOLD 359
46.72
GLD 348
91.15
RIC 325
3.3
GDX 311
50.7
GG
264
37.72
-------- HISTORICAL STUDY ------------------------------------
12/26/2006
Top 10 Percent Change
250 Days
12/28/2005 to 12/26/2006
1/29.2007 Pct Change
====================
=======
========
AZK +112%
3.13
4.10
+31.0%
AEM +106%
40.41
62.73
+55.2%
SSRI +98%
30.26
34.93
+15.4%
AUY +92%
12.65
16.27
+28.6%
SLW +83%
10.42
16.31
+56.5%
HL +76%
7.32
9.45
+29.1%
MFN +51%
8.20
11.50
+40.2%
GOLD +39%
22.77
46.72 +105.2%
CEF +38%
9.23
12.01 +30.1%
GRS +37%
16.07
6.91 -56.8%
Top 10 Accumulation Index
12/28/2005 to 12/26/2006
1/29/2007 Pct Change
====================
=======
========
AUY 161
12.65
16.27
+28.6%
AZS 153
12.15
17.81 +46.6%
GLD 136
61.98
91.15 +47.1%
GBN 136
1.63
3.01 +84.7%
IAU 127
62.05
91.19 +47.0%
Top 10 Power Ranked
12/28/2005 to 12/26/2006
1/29/2007
Pct Change
====================
=======
========
AUY 278
12.65
16.27 +28.6%
AZS 235
12.15
17.81 +46.6%
XAU 165
139.34
187.36 +34.5%
GRS 163
16.07
6.91 -56.8%
SSRI 156
30.26
34.93 +15.4%
HL 135
7.32
9.45 +29.1%
GLD 92
61.98
91.15 +47.1%
AEM 83
40.41
62.73 +55.2%
GOLD 80
22.77
46.72 +105.2%
GG 62
27.52
37.72 +37.1%
Pct. Gains Using Optimized
Trading System when Stochastic
Is Best System, 12/26/2006
======================
Long & Short Buy Next Day's Opening
Sell Next Day's Opening
----------
--------------
--------------------------
ABX
71.5% 40.1%
AEM
206%
77.2%
AU
87.8% 33.6%
AZK
146.4%
139.5%
CEF
91.5%
51.4%
GBN
77.3%
47.4%
GDX
76.2%
31.4%
GFI
85.5%
33.6%
GLD
52.4%
25.1%
GOLD
126.7%
73.1%
HL
251.9% 130.5%
IAG
112.3%
52.0%
KGC
84.3%
30.6%
MFN
236.6%
85.1%
NEM
75.8%
28.4%
SIL
121.3%
30.5%
SLW
159.7%
61.2%
SSRI
124.1%
78.2%
XAU
11.3%
57.0%
Top 10 Percent Change
Last 250 Days
1/31/2007
====================
SA
103%
24.77
GOLD 98%
46.72
MVG 98%
13.50
ABX
79% 53.23
KGC
65% 21.97
GBN
61% 3.01
AEM
55% 62.73
SLW
51% 16.31
AZS
47%
17.81
GLD
40%
91.15
Top 10 Accumulation Index
12/29/2008
====================
AZS
174
17.81
GLD
167
91.15
IAU
159
91.19
GOLD 156
46.72
MVG
144 13.50
Top 10 Power Ranked
1/29/2007
====================
AZS 174
17.81
IAU
159 91.19
XAU 398
187.36
AZK 364
4.1
GBN 360
46.72
GOLD 359
46.72
GLD 348
91.15
RIC 325
3.3
GDX 311
50.7
GG
264
37.72
==================================================================================
WHAT
GOLD AND SILVER STOCKS SHOULD YOU TRADE
WITH TIGERSOFT'S BUYS AND SELLS?
TigerSoft's Red Buys and Sells will help you trade
the volatility and trading ranges that
Presidential Election
years usually produce. Here are the gold
and silver stocks
that have traded best for the last two year.
Often the trading
gains are much moe than Buying and Holding.
By way of
illustration, look at the effectiveness of SLW's
buys and sells.
Stocks to trade using TigerSoft tools. Come
back here and I will post more examples.
See http://tigersoft.com/--3--/Explanation/index.html
Pct. Gains Using Optimized
Trading System when Stochastic
Is Best System, 1/28/2006
======================
Long & Short Buy Next Day's Opening
Sell Next Day's Opening
----------
--------------
--------------------------
ABX
93.7% 99.6%
AEM
232.9% 105.4%
AU
181.3% 56.9%
AUY
157.1% 86.1%
AZS
186.4% 115.5%
CDE
104.5% 50.3%
GDX
98.3% 46.4%
GFI
66.0% 19.2%
GG
92.0% 70.7%|
HL
140.4% 58.1%
IAG
126.1% 76.3%
KGC
253.5%
106.7%
MFN
111.9%
36.5%
PAAS
129%
58.6%
SLW
190.5% 131.4%
SSRI
130%
64.8%
SWC
136.4%
57.6%
XAU
85.7% 55.2%
Pct. Gains Using Optimized
Trading System when Stochastic
Is Best System,
12/26/2006
======================
Long & Short Buy Next Day's Opening
Sell Next Day's Opening
----------
--------------
--------------------------
ABX
71.5% 40.1%
AEM
206%
77.2%
AU
87.8% 33.6%
AZK
146.4%
139.5%
CEF
91.5%
51.4%
GBN
77.3%
47.4%
GDX
76.2%
31.4%
GFI
85.5%
33.6%
GLD
52.4%
25.1%
GOLD
126.7%
73.1%
HL
251.9% 130.5%
IAG
112.3%
52.0%
KGC
84.3%
30.6%
MFN
236.6%
85.1%
NEM
75.8%
28.4%
SIL
121.3%
30.5%
SLW
159.7%
61.2%
SSRI
124.1%
78.2%
XAU
11.3%
57.0%
|