|
TigerSoft
Indexes of Selected Stocks:
(1)
Trade Their Trends and Buys and Sells.
(2)
Use sector A/D Lines to confirm price new highs and lows and see trend-changes..
(3)
Note Support and Resistance.
(4)
Is there aggressive Buying or Selling?
(5)
Is there big money accumulation or distribution?
(6)
Is this a good group to be in based on relative strength?
The first chart below is the TigerSoft Index of 18 Stock Brokerages.
Use
the red arrows to take positions at the next day's opening.
TigerSoft's
Big Trading Profits
Longs
Only Profit = +43.5%
Shorts
Only Profit = +296.6%
Charts
shown below:
Stock Brokerages
Chinese Stocks
Home-Building Stocks
Gold/Silver Stocks
Oil Stocks
FTSE (UK) Stocks
(1) Trade Their Buys and Sells.
(2) Use sector A/D Lines to confirm price new highs and lows and see trend-changes..
(3) Spot Support and Resistance.
(4) Is there aggressive Buying or Selling?
(5) Is there big money accumulation or distribution?
(6) Is this a good group to be in based on relative strength?
TigerSoft gives you
many trading advantages. The one I want to emphasize today is the ability
to build indexes of your choice of stocks. This lets you
see all the key indicators, as well as
automatic TigerSoft Buy and Sell signals and an Advance-Decline
for your group of stocks.
Our Tiger Data base is organized to make this easy. And you
can designate the stocks you wish
to use in an index.
Below is
the current TigerSoft Index Chart for 18 Stock Brokerages. Trading
the short side
when a red down-arrow appears has been very profitable.
Using the red arrows with the top
trading system would have gained a trader 296% using just the
short side. This assumed $10,000
was started with and each trade conservatively costs $40 in
commissions and slippage. The software
lets you see that there were 19 trades, including the last one
which is still open. The average gain
was 4.9% for the 16 winning trades. Only 2 were
unprofitable.
------------------------------------
Tiger Index of Stock Brokerages -----------------------------------
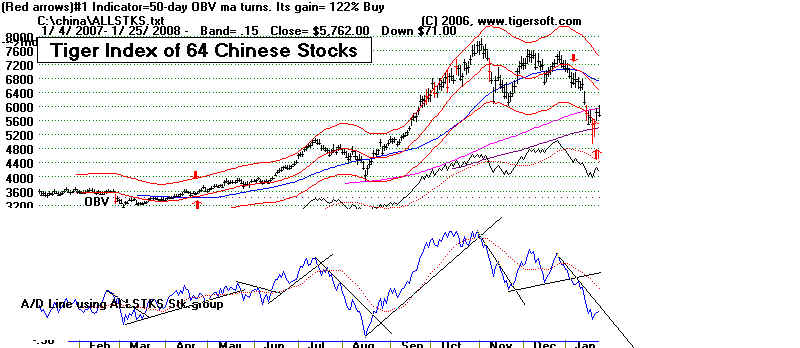
The top
row of a TigerSoft chart shows the basis for the Red Up (Buy) and Down (Sell)
When this system does not give enough
buys and sells, use the Advance-Decline
feature and
draw trendlines. This makes trading
the wild Chinese market a lot safer.
-------------------------------- Tiger Index of Chinese
Stocks --------------------------------------------------------
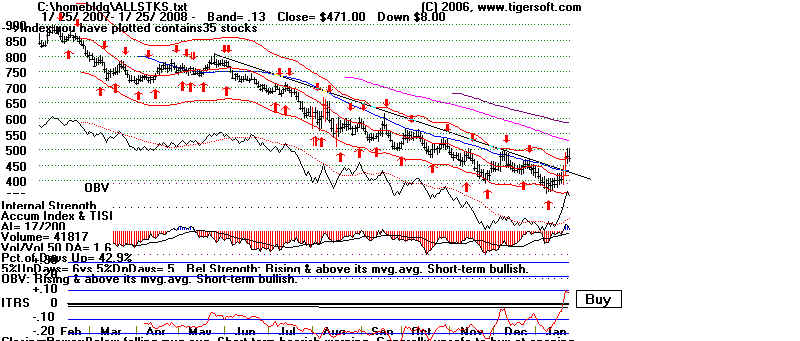
Home Building stocks have been in a long
decline. But that may be changing. The Tiger
ITRS
(relative strength) indicator has finally turned positive and the Advance-Decline Line for
the group is about to
break its long down-trendline. The group is on a Red Buy.
--------------------------------- Tiger Index of Home-Building Stocks
---------------------------------------------------
  -------------------------- Tiger
Index of Gold/Silver Stocks --------------------------------------------- -------------------------- Tiger
Index of Gold/Silver Stocks ---------------------------------------------
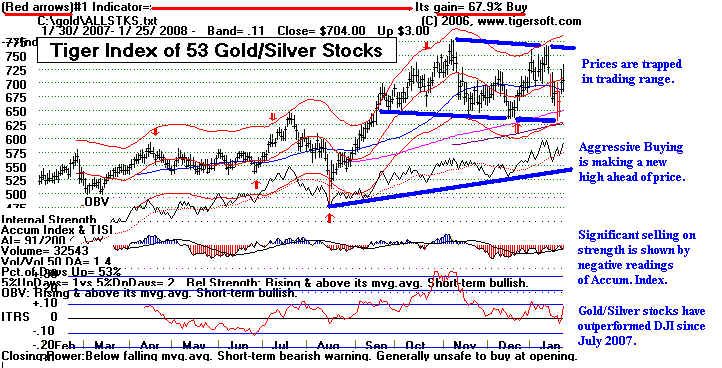
The chart of the Tiger Index of
Gold and Silver stocks gives very good Buys and Sells. Trading
these signals would have gained 67% for the period
shown. In addition, we can clearly see that
these stocks are locked in a trading range. e
can see the levels to Buy and Sell. We see that there
is aggressive Buying from the fact that the OBV Line
is making new highs ahead of price. We also
must note that significant selling on strength is
taking place. This a bullish sector. It has outperformed the
DJI since July. Finally, we are told, in
general, to avoid buying these stocks at the opening, as there
usually are better prices later in the day.
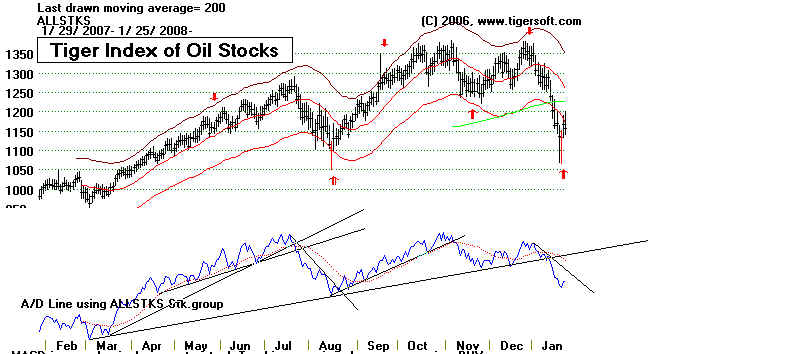
-------------------------- Tiger Index of Oil Stocks
---------------------------------------------------
Oil stocks should rally.
Prices have retreated back to their March lows and there is a new
red Buy on the screen.
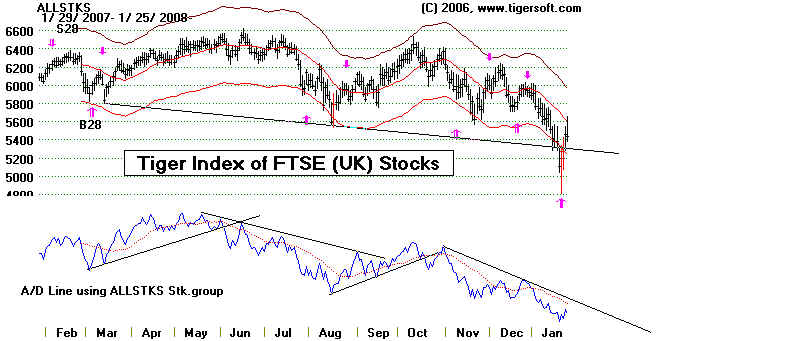
------------------------------ Tiger Index of FTSE (UK)
Stocks -----------------------------------------------------
See how the May peak, and the
high for 2007, was not confirmed by the FTSE A/D Line.
|