|
Rules for Trading NEM Profitably
1. Wait for Buy B28 using Stochastic-60-K-Line falls below 20 and
turn up.
Then Buy NEM when either Blue Tiger Closing Power breaks
its downtrend or moves back above its own
21-day ma. This would have meant buying a little
above 34. See heavy purple line in late April.
2. Take profits at the old old highs if there has been an intervening decline of
20% or more. (one option)
3. Alternatively, watch for the next Sell S28 (Stochastic-60-K-Line rises above 80
and turns down).
Then Sell NEM when the Blue Tiger Closing Power moves up
above its downtrend or moves back above
its own 21-day ma. This would have meant
selling NEM at 40 in August..
4. If a purchase turns into a
loss of more than 10%, consider selling and re-Buying on the next Action-Buy,
either the break in the Closing Power trendlines and or its
surpassing its 21-day ma. See 1992, 1998
5. Aggressive Buy - Buy on a successful test of a rising (blue) 50-day ma when the
Tiger Accumulation Index
has recently shown a bulge past +.25 . (1993)
Buy at the 50-day ma when the Accumulation Index is
steadily positive and frequently reaches +.25.
Closing Power should be in a steady uptrend. (2003)
6. Aggressive Buy - Buy when the blue Closing Power moves above its own flat,
well-tested (3x or more)
resistance line. May 1995, August and September
2007,
7. Aggressive Sell - Sell when the blue Closing Power moves below above its
own flat, well-tested (3x or more)
support line. September 1995
8. Aggressive Short Sale - Sell short on challenge of high or new high with the
Tiger Accumulation Index in red,
negative territory, showing heavy distribution and
insider selling.
9. Aggressive Sell - Sell NEM when the stock doubles from its lows in a month.
See 1998.
10. Aggressive traders' buy when prices break above well-tested flat resistance. A
close above such flat
resistance should bring another 10%-20% advance, just as
happened in November 2005 and October 2007.
Traders, note that there is always the possibility of a
false breakout/.
11. Questionable - Aggressive Sell - Sell after NEM rises 50% in two weeks in a
highly speculative market. 1999.
| 1990 Rules for Trading NEM Profitably: 1. Wait for Buy B28 using Stochastic-60-K-Line falls below 20 and turn up. Then Buy NEM when either Blue Tiger Closing Power breaks its downtrend or moves back above its own 21-day ma. This would have meant buying a little above 34. See heavy purple line in late April. 2. Take profits at the old old highs if there has been an intervening decline of 20 or more. (one option) This would have meant selling at 43. When placing a Sell at an old high, know that others will do this. So, if 47 is the old high, place the Sell GTC order 1/2 below that. Here 46.5 would have gotten you out right at the top. See 1994. 3. Alternatively, watch for the next Sell S28 (Stochastic-60-K-Line rises above 80 and turns down). Then Sell NEM when the Blue Tiger Closing Power moves up above its downtrend or moves back above its own 21-day ma. This would have meant selling NEM at 40 in August.. 4. Repeat rules for Step 1 above. This would have meant buying at 29 in November. Confidence to buy might have properly been gained by noting the bullish divergences between the price new lows in December and the rising blue Closing Power and the rising Accumulation Index. 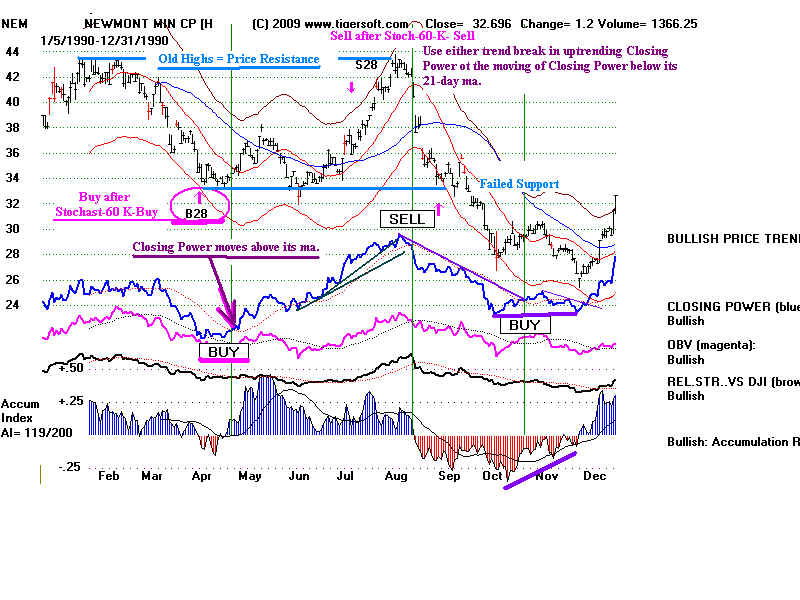 |
| 1991 Use the same rules for buying and selling posted
above for 1990, namely watch for the Stochastic-60 buys and sells followed by an action-Buy or action-Sell based on the break in the Closing Power trendlines and or its surpassing its 21-day ma. 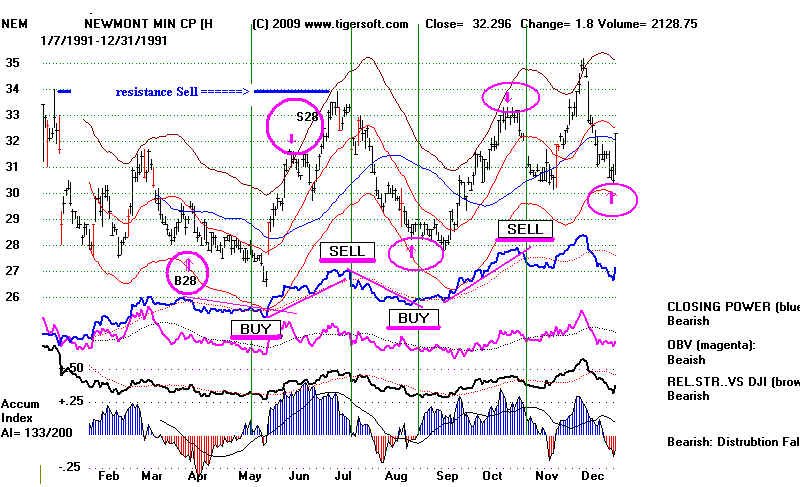 |
| 1992 Use the same rules for buying and selling posted above
for 1990, namely watch for the Stochastic-60 buys and sells followed by an action-Buy or action-Sell based on the break in the Closing Power trendlines and or its surpassing its 21-day ma. The August Buy of NEM at 38 in August turns into a loss of 8 points by November. This is more than 20%. It would have been a lot easier on the nerves to have worked with a Sell Stop Loss when the stock fell more than 10% below the purchase price. Re-buying it when the Closing Power rises above its down-trendline and surpasses it own 21-day ma would have meant Buying at 32. 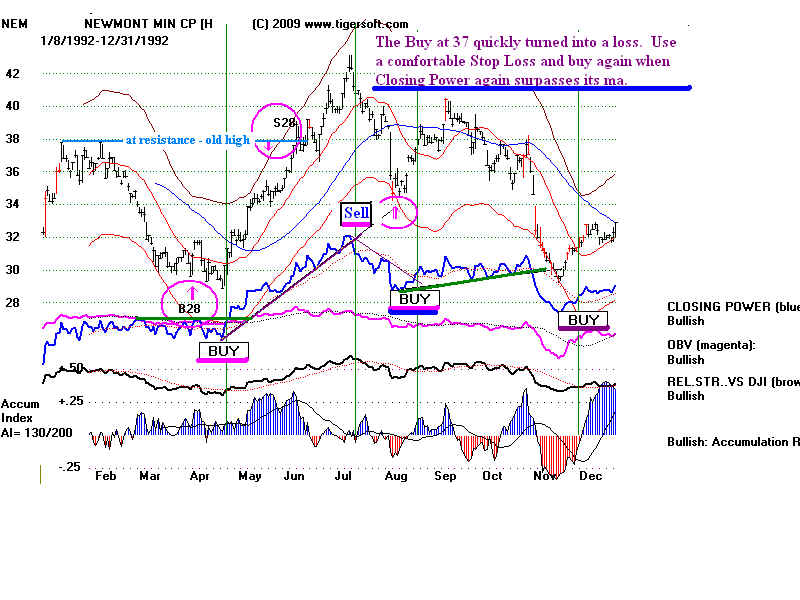 |
| 1993 The Buy at 38 in September using the combination B28 + Action Buy rules was profitable. But an aggressive Buy rule might also have been applied successfully here. Aggressive Buy - Buy on a successful test of a rising (blue) 50-day ma when the Tiger Accumulation Index has recently shown a bulge past +.25 or is rising steadily toward just below +.25. 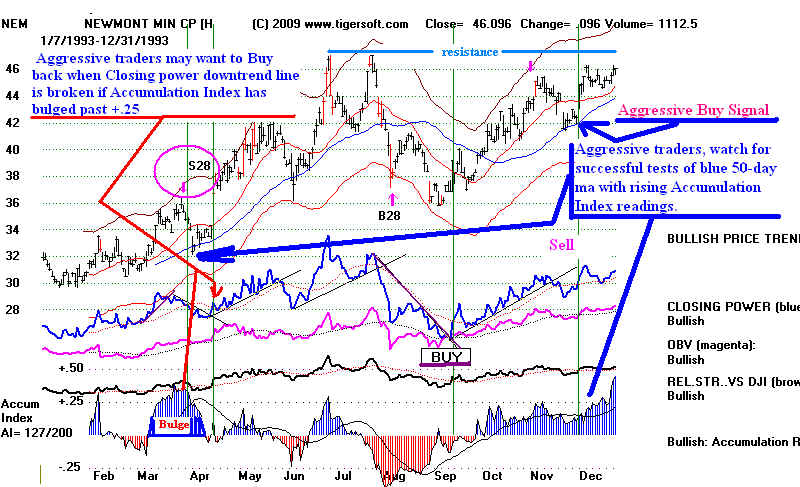 |
| 1994 1994 offered opportunities to use the rules above. When placing a Sell at an old high, know that others will do this. So, if 47 is the old high, place the Sell GTC order 1/2 below that. Here 46.5 would have gotten you out right at the top. 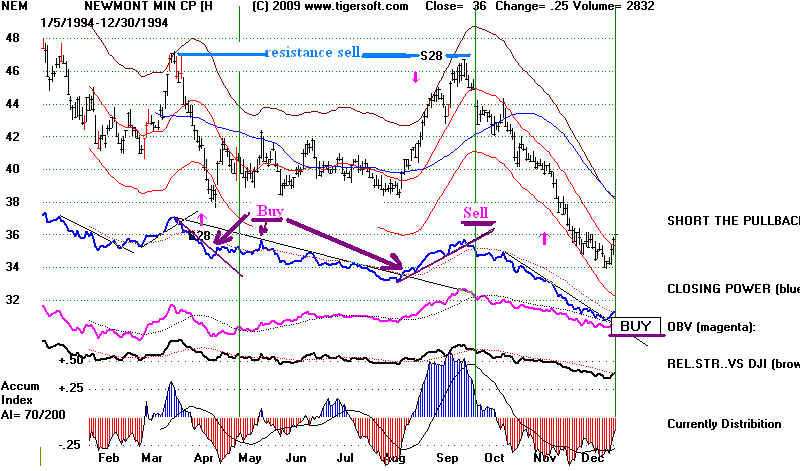 |
| 1995 This year offered opportunities to use
the rules above. Aggressive Buy - Buy when the blue Closing Power moves above its own flat, well-tested (3x or more) resistance line. May 1995 Aggressive Sell l- Sell when the blue Closing Power moves below above its own flat, well-tested (3x or more) support line. September 1995 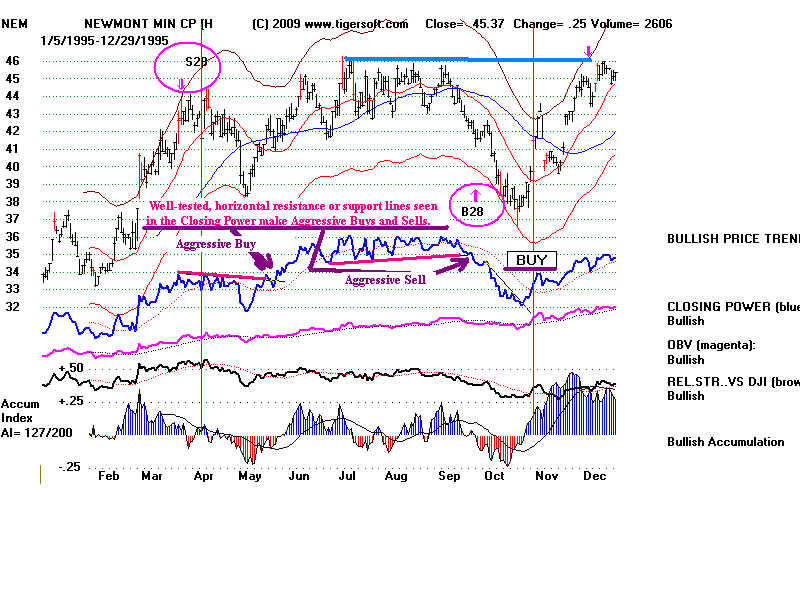 |
| 1996 Aggressive Short Sale -Challenge of high or new high
with the Tiger Accumulation Index in red, negative territory, showing heavy distribution and insider selling. 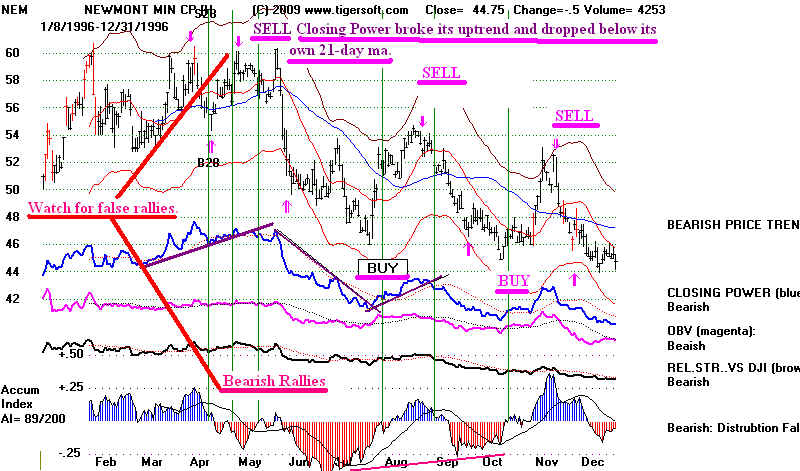 |
| 1997 Usually buying on a price-trend-break when
the down-trendline is well-tested often produces a quick rally. This can be considered an aggressive Buy when there has previously been a Buy B28.. 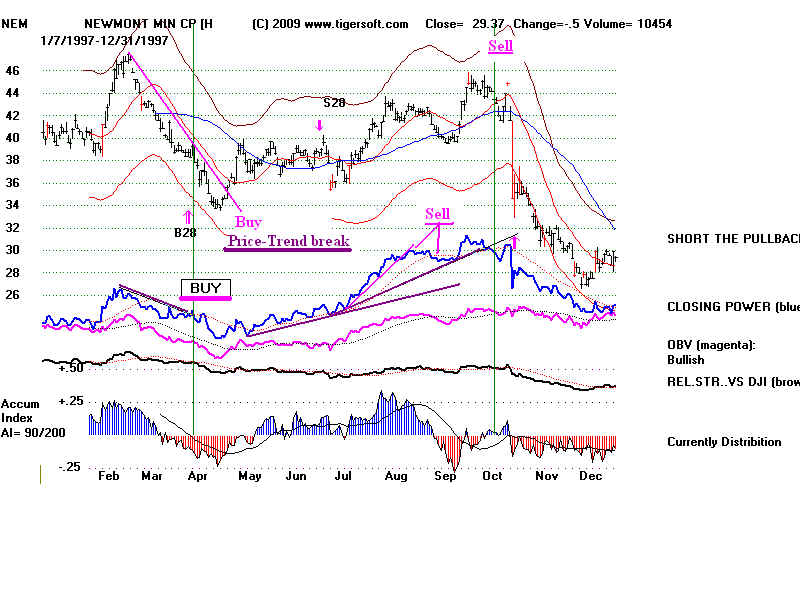 |
| 1998 When a loss is more than 10% on a Buy, it usually
is safer to sell and buy back when the Closing Power breaks its downtrend. Aggressive Sell - Sell NEM when the stock doubles from its lows in a month. 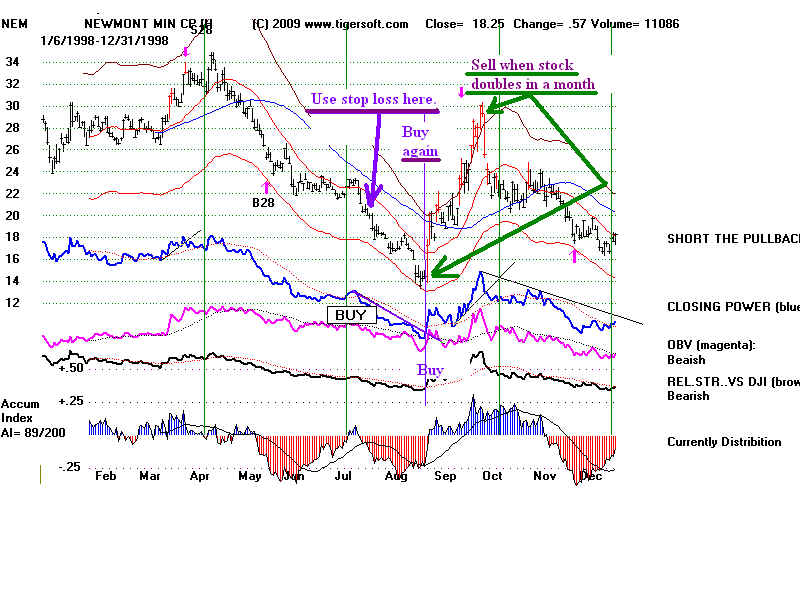 |
1999 Aggressive Sell - Sell when NEM rises 50% in three
weeks.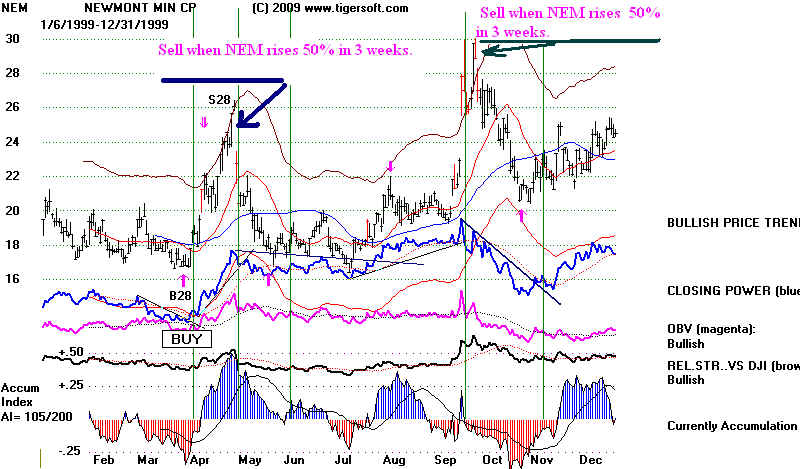 |
2000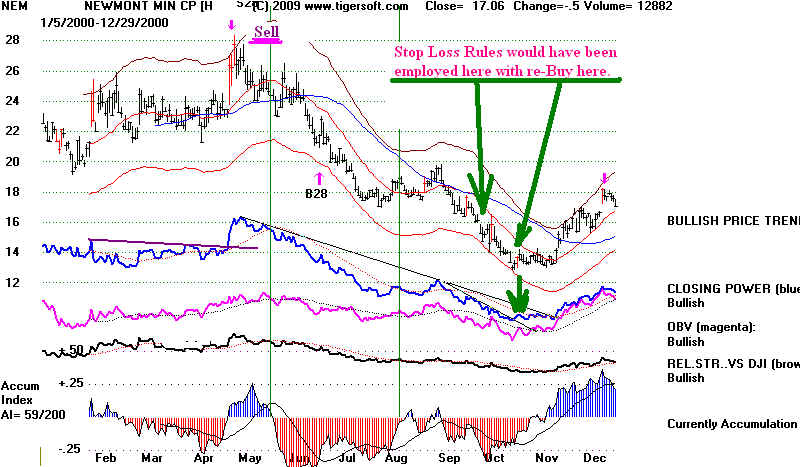 |
2001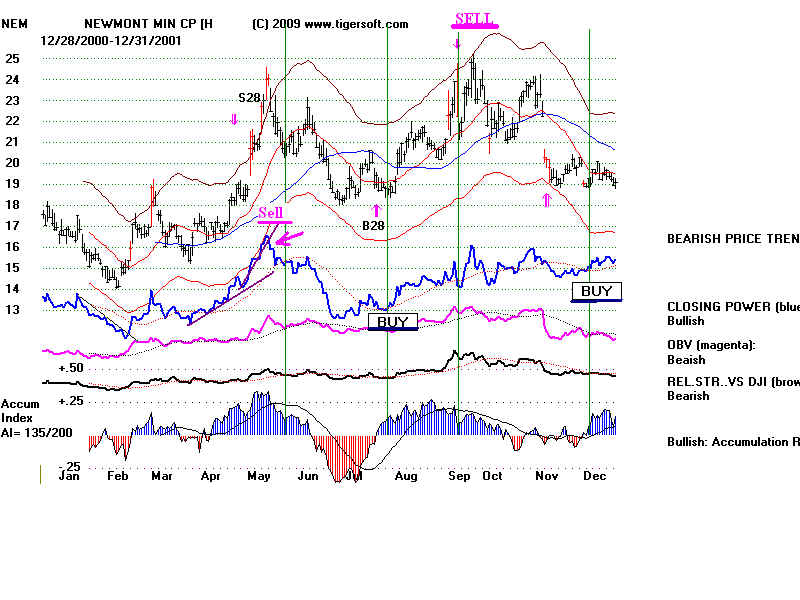 |
| 2002 Aggressive Buy - Buy on successful test of well-tested price
support when the Tiger Closing Power breaks its downtrend. 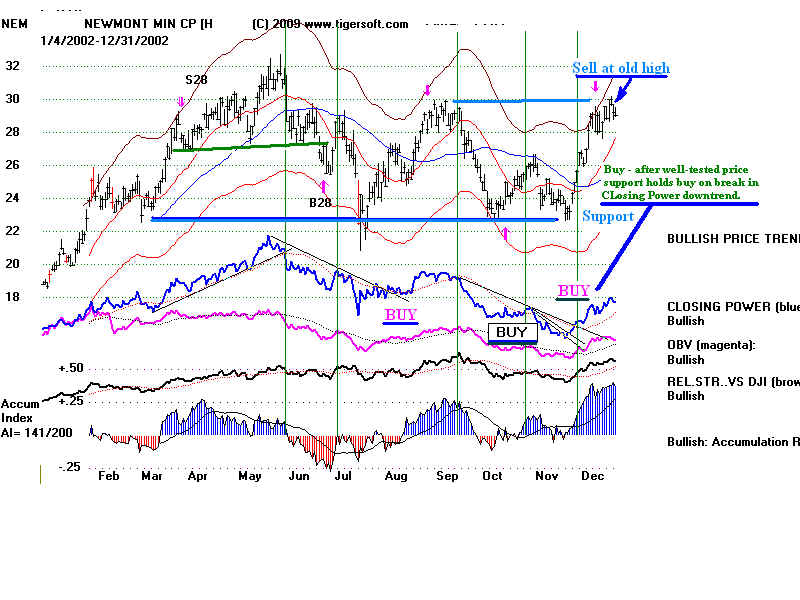 |
| 2003 Buy at the 50-day ma when the Accumulation Index is
steadily positive and frequently reaches +.25. Closing Power should be in a steady uptrend. 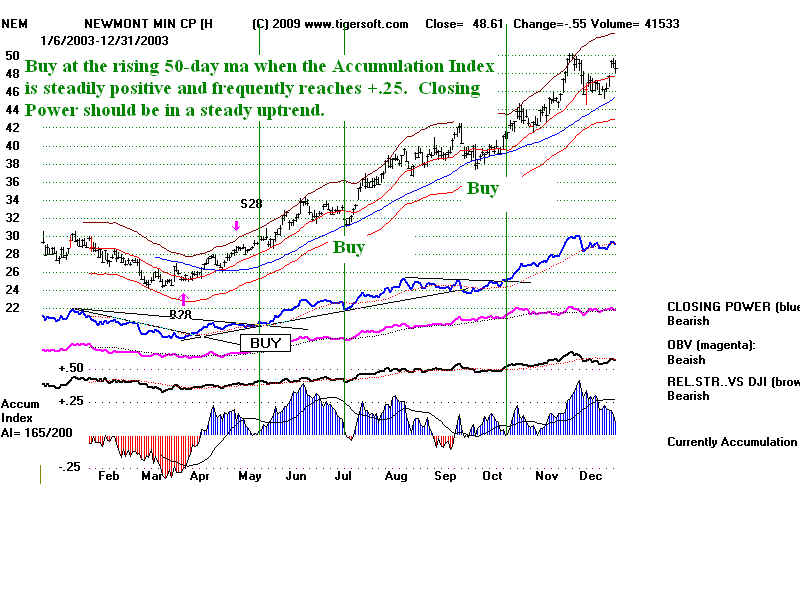 |
2004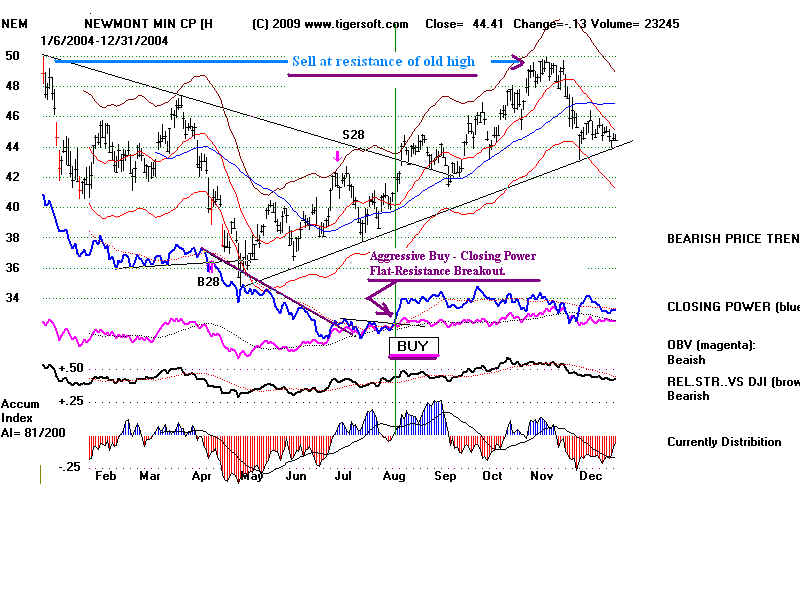 |
2005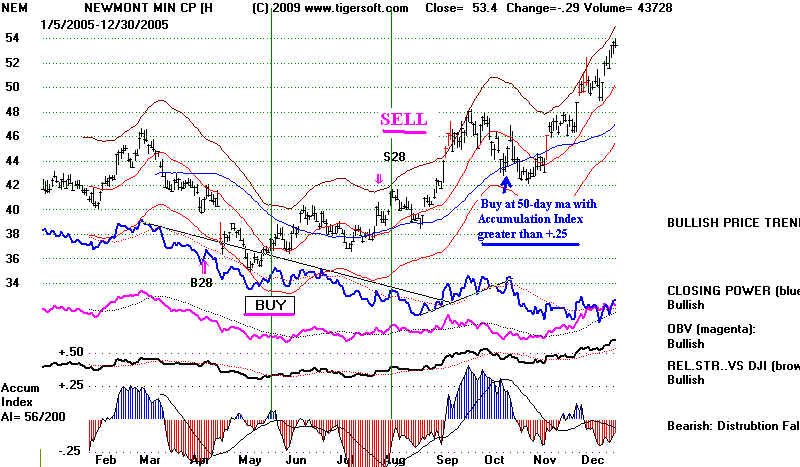 |
2006 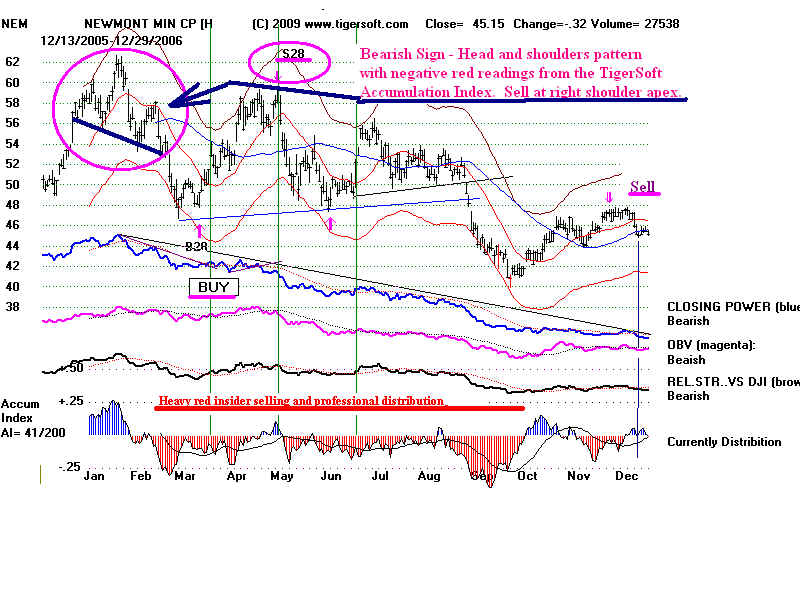 |
2007 Aggressive Buys - when Closing Power broke out above flat
resistance. 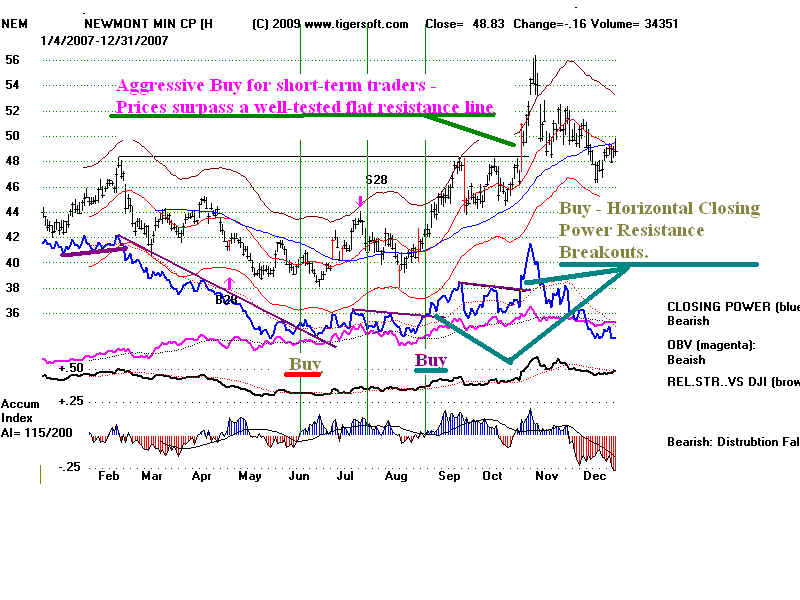 |
2008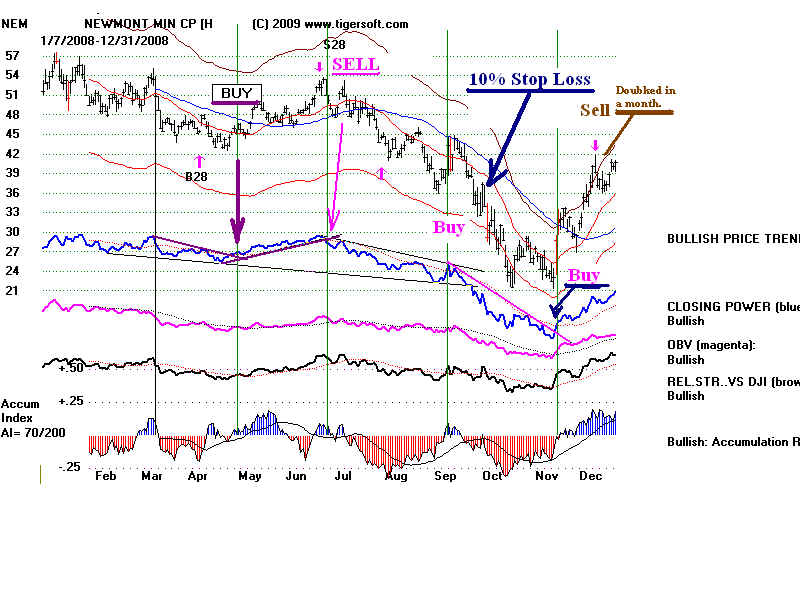 |
2009 Note the use of the 10% stop loss in September as stock broke below 40 and re-Buy when Closing Power's down-trendline was exceeded in November. Stock is now (3/20/2009) back to its old highs after more than a 20% decline. This usually warrants a Sell. However, there is a flat and well-tested price resistance at 45. A close above that should bring another 10%-20% advance, just as happened in November 2005 and October 2007.. 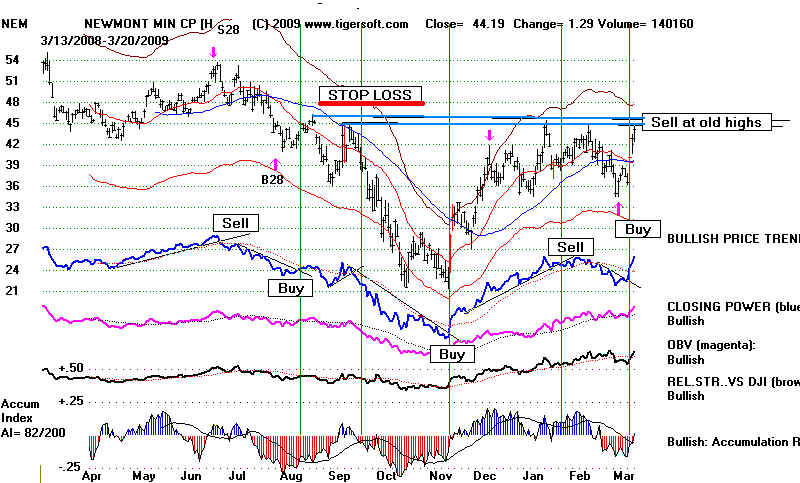 |