
last rev. December 29, 2014
last rev. December 29, 2014
Here we want to walk you through the basics of
TigerSoft. We start with
the
most obvious and worth through to the more advanced steps. You will
also
see find links here to more detailed studies on each topic. The sections
here
are entitled:
1. Always Begin by Determining How Safe The General Market Is.
Use Peerless, Seasonality and On-Going Hotline Studies.
2. Basics of Technical Analysis
Price Bands,
Overbought/Oversold
Stochastic Indicators
RSI Indicator
Commodity Channel Index
3. TigerSoft's Contributions to Technical Analysis:
Price Bands
Optimized Red Buys and Sells
Accumulation Index
Relative Strength Quotient
Intermediate-Term Relative Strength
Split-Volume
Opening Power
Closing Power
Tiger Day Traders' Tool
Red Price Bars
Numbered Technical Signals
4. Percent Change
First-out-of-Gate
Momentum
Streaking up/down
5. Support and Resistance
6. Trading Range Dynamics
7. Trending Stocks and Markets.
8. Broken Support becomes Resistance
9. Broken Resistance becomes Support
10. Well-tested Trendlines of Support and Resistance
11. Bullish Breakouts and Pullbacks before Continuation of Up Trend
12. Bearish Breakdowns and Pullbacks before Continuation of Down Trend
13. False Breakouts.
14. Well-Tested Uptrendlines
15. Well-Tested Downtrendlines
16. Bullish Price Gaps and Red High Volume
17. Bearish Price Gaps and Red High Volume
18. Classic Price Patterns
Broadening Tops
Head and Shoulders
Inverted Head and Shoulders
Line Formations (usually low-priced and thinly traded stocks)
Horizontal Breakouts and Ascending Triangles
Horizontal Breakdowns and Descending Triangles
Bullish Flag Pattern Breakout
Bearish Flag and Pennant Pattern Breakdown
Triangle Breakouts
Triangle Breakdowns
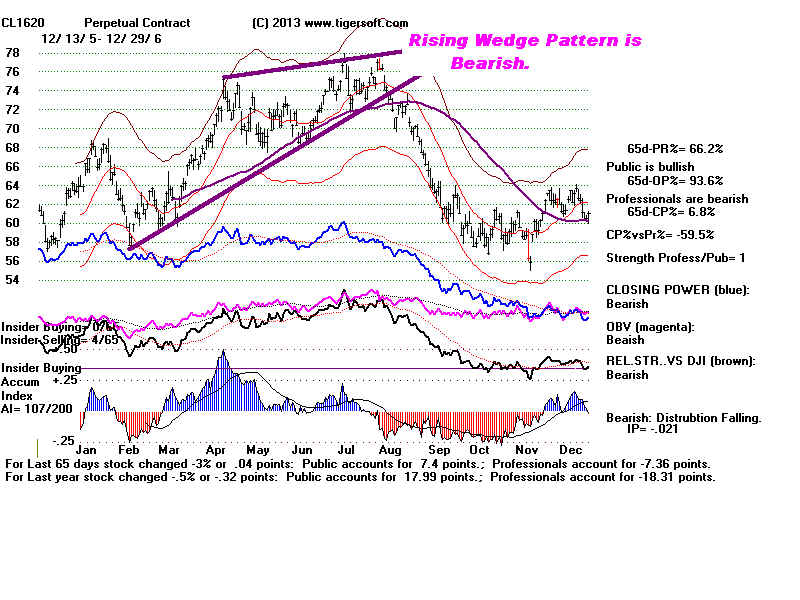
Bearish Rising Wedge Patterns
Bullish Falling Wedge Patterns
19, Internal Strength Indicators' Confirmations,
Non-confirmations, Divergences
1. Accumulation - IP21
2. Closing Power
3. Both-Up and Both-Down
4. OBV Pct.
5. Asynchronicity (Moves against DJI trend.)
6. Symmetry (Moves with DJI trend.)
.
Peerless
Stock Market Timing: 1915-2015
Peerless helps us correctly judge the direction and
safety of the general market.
This
is immensely important because most stocks rise in a bull market
and
also even in a small 5%-10% advance by the DJI. With the
added
confidence that comes from knowing Peerless will probably
tell
us when the DJI is going to fall more than 10%, we not only
can
sleep better, relax and let a stock run more, we can also use more
leverage. Since 1945, there have only been 23 cases where Peerless
failed to call a DJI top which was followed by a 6% or more decline.
There
was only one instance where the DJI fell 9%.
Peerless uses bands, divergences and seasonality.
You can readily see how well the stocks in a Tiger stocks directory
behave or confirm to the Peerless Buys and Sells. Use the commands:
Peercomm + Charts-2013 + Runs/Setups + Compute Peerless Gains for
All Stocks
Below see the Peerless reversing Buys and Sells
applied to the 37 stocks
and
major market ETFs in c:\DJI-30
Peerless Signals and Trading Gains Starting with $10000
--------------------------------------------------------------------------------------
Directory=C:\dji-30        11/ 6/ 12- 11/ 18/ 13    Number of Symbols= 37
Symbol $10000. Biggest-- Gains/Losses 5% Stops- 10% Stops ------ becomes Paper---- ------------ triggered triggered ------ ------- Loss Pct ============================================================================ AXP Long 15393 3 4 AXP Short 10893 4.2 3 BA Long 16613 5.1 4 1 BA Short 9193 11 3 2 1 CAT Long 9858 14.9 3 1 1 1 CAT Short 10965 1.9 3 CSCO Long 11729 9.7 3 1 1 CSCO Short 11047 3 2 1 CVX Long 12238 3.2 4 CVX Short 11154 3 3 DD Long 13235 2.3 4 DD Short 9829 10.8 2 1 1 1 DIA Long 12678 1.8 4 DIA Short 10591 3.4 3 DIS Long 14755 1.4 4 DIS Short 10747 7 2 1 1 FAS Long 21824 7.4 4 2 FAS Short 11446 9.4 3 3 GE Long 12481 3.9 4 GE Short 9885 5.2 2 1 1 GS Long 14120 4.1 4 GS Short 11142 4.2 3 HD Long 13576 2.7 4 HD Short 10751 5.5 2 1 1 IBM Long 10271 6.2 3 1 1 IBM Short 10835 4.6 3 INTC Long 12861 6.4 3 1 1 INTC Short 11047 5 3 1 IWM Long 12631 3.1 4 IWM Short 9931 3.1 2 1 JNJ Long 13214 3.3 3 1 JNJ Short 9939 5.1 2 1 1 JPM Long 13633 4 4 JPM Short 10963 2.6 3 KO Long 12250 1.3 4 KO Short 11256 2.5 3 MCD Long 11627 1.5 4 MCD Short 10665 2.4 2 1 MDY Long 12515 2.8 4 MDY Short 10060 3.1 2 1 MMM Long 13788 1.5 4 MMM Short 10000 3.8 2 1 MRK Long 12104 7.6 3 1 1 MRK Short 10507 2.3 2 1 MSFT Long 14570 3.9 4 MSFT Short 10604 4.5 2 1 NKE Long 14066 2.6 4 NKE Short 9324 12.3 1 2 2 1 PFE Long 12273 2.8 4 PFE Short 9806 7.5 1 2 2 PG Long 12649 7.2 3 1 1 PG Short 10286 4 2 1 QQQ Long 12381 3 4 QQQ Short 9959 2.7 1 2 SPY Long 12705 2 4 SPY Short 10312 2.9 3 T Long 11006 4.8 4 T Short 10638 3 3 TNA Long 20136 9.4 4 2 TNA Short 10121 9.7 2 1 3 TRV Long 13039 2.2 4 TRV Short 10755 6 2 1 1 UNH Long 12363 8 3 1 2 UNH Short 9427 8.1 1 2 1 UTX Long 13182 2.7 4 UTX Short 10098 7.7 2 1 2 V Long 13229 4.4 4 V Short 10189 8.5 1 2 1 VZ Long 11334 6.7 2 2 1 VZ Short 9913 5.6 1 2 2 WMT Long 12196 2.2 4 WMT Short 10618 3.5 3 XOM Long 11959 2.9 4 XOM Short 10954 2.4 3 |
Market Timing and Seasonality
Peerless gives us a good feel for where we are at
each stage in the stock
market's typical cycle. It lets us see how seasonality plays a big role.
So,
all things being equal, buying in late November and selling in May
has a
long history of succeeding. At the same time, we have to be ready
for
January pivots-down as well as January take-offs.
Peerless is apolitical. It does not ask who is in the White House or whether
expansionary or deflationary policies are being pursued by the Fed, by
President and the Congress. But we should understand how these policies
affect the stock market. This is one of the jobs of our Tiger Hotline,
which
tries to penetrate the smoke and mirrors of Washington for your advantage.
Until the Peerless books are done, it
is best studied through the Hotline and by
viewing the studies of signals at www.tigersoft.com/PeerInst-2012.
One book will
be a
history of the DJI since 1915 with technical comments on the market using
the
NYSED A/D Line and the price charts of the DJI. The second book will
be an
elaborate discussion of the Peerless Buy and Sell signals.
Tiger
technical analysis can be understood by mastering a set of basic
concepts. They can be studied one by one, It is hoped that more links
and
additonal studies with be provided on a continuing
basis.
Basics of Technical Analysis
Prices
Tiger Price Bands
Overbought and Oversold
Stochastic Indicators
RSI Indicator
Commodity Channel Index
Internal Strength
Indicators
Introduction to Finding Explosive
Super Stocks
TigerSoft's Contribution to Technical Analysis
http://www.tigersoftware.com/2012-Explo/2012-EXPLO/Introduction/index.htm
Applied Example
12/27/2014 Gold/Silver Stocks:
Closing Power, Accumulation Index and Candle Stick Charts
http://www.tigersoftware.com/DL/index.html
Pct Change - 1-year
Pct Change - 21 day: First-Out-of-The-Gate at Start
of New Bull Market
Pct
Change - 50-day
Pct
Change - 200 day
Pct
Change over Specified Time.
Pct
Change - 1-day
Momentum: Increasing and Decreasing
Momentum Indicator MVMxxyy
Momentum Indicator PVPxx
Streaking
Support and Resistance
Trading Ranges
Trending Markets
Broken Support Becomes Resistance
Broken Resistance Becomes Support
Well-Tested
Breakdowns below Well Tested Support (Bearish)
Breakouts above Well-Tested Resistance (Bullish)
Bullish
Breakouts
False
Breakouts
Price
Trends and Well-Tested Trendlines
Price
Gaps Upward and Red High Volume (Bullish)
Price
Breakdown Gaps Down and Red High Volume (Bearish)
Red
Price Bars using TigerSoft
Price Patterns
Broadening Top (Bearish)
Head and Shoulders (Bearish)
Inverted Head and Shoulders (Bullish)
Line
Formation Breakouts (Bullish)
Horizontal Breakouts (Bullish)
Horizontal Breakdowns (Bearish)
Flag
Breakouts (Bullish)
Ascending Triangle with Flat Top (Bullish)
Descending Triangle with Flat Bottom (bearish)
Flag
and Pennant Breakdowns (Bearish)
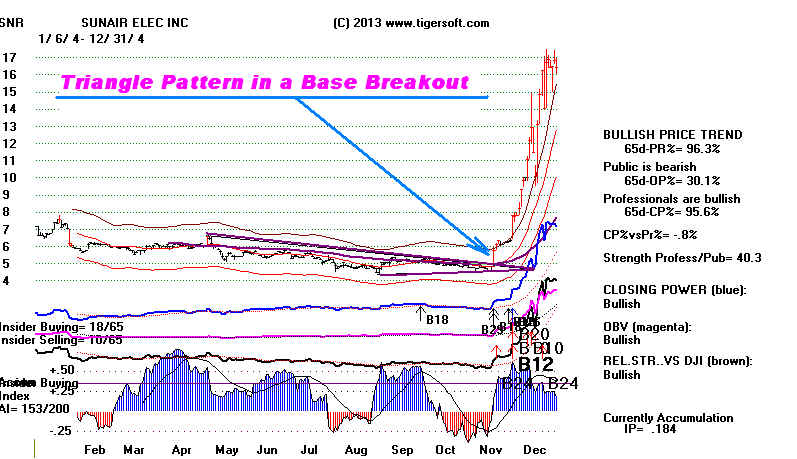
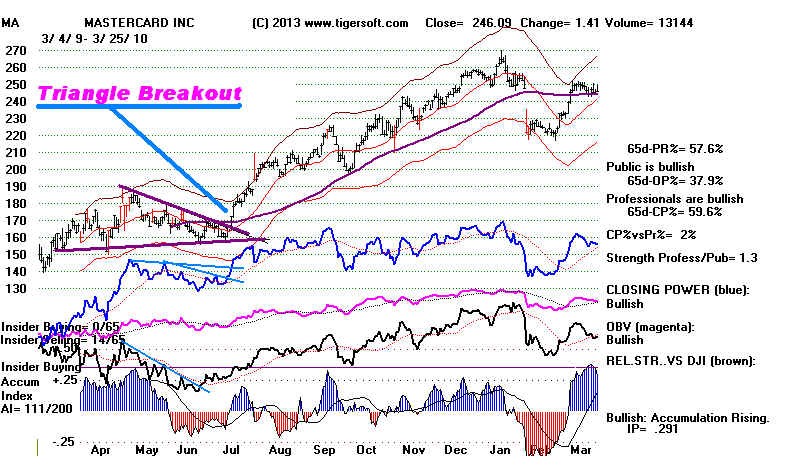
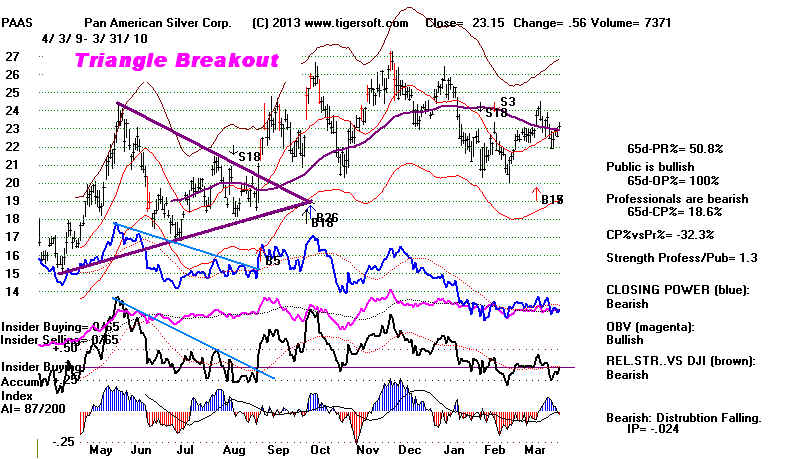
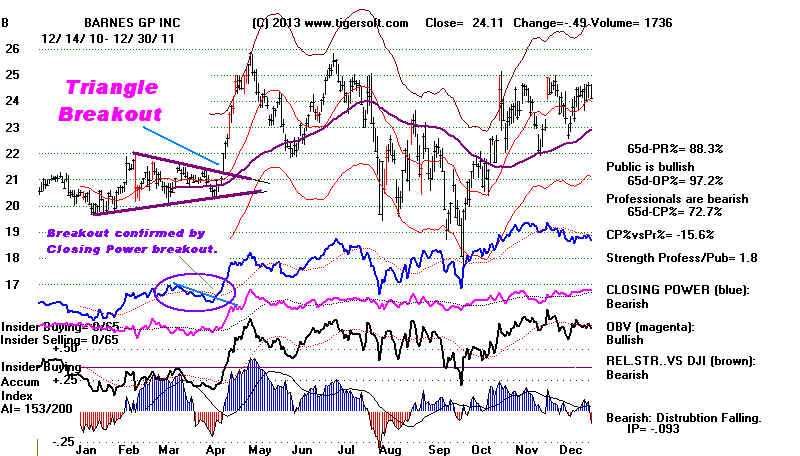
Triangle Breakouts (Bullish)
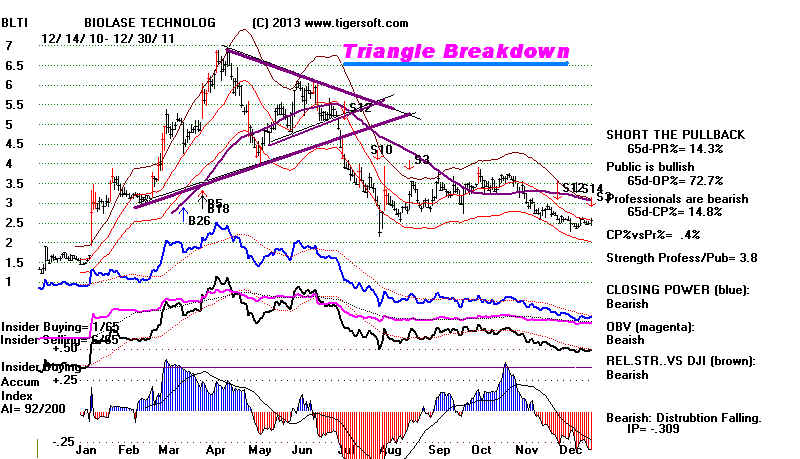
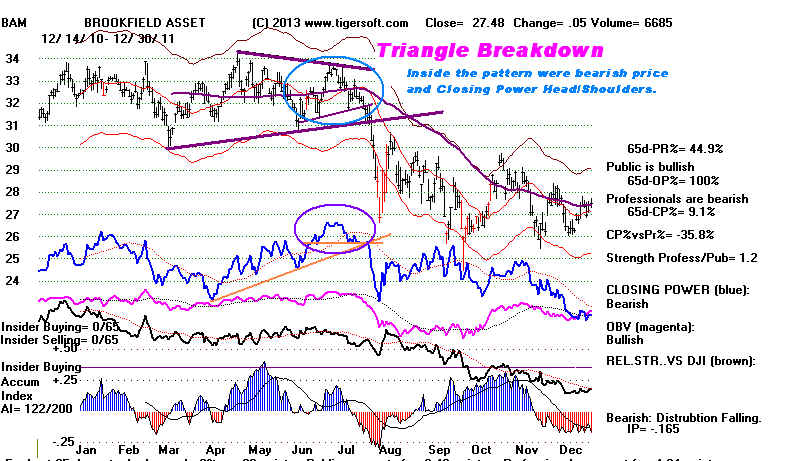
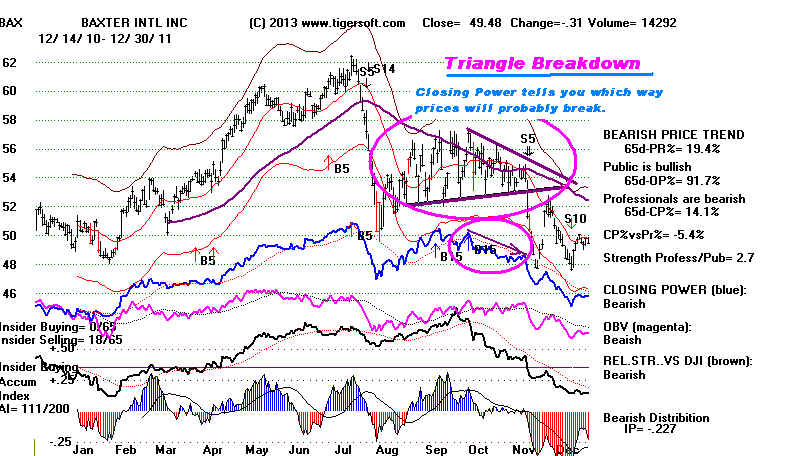
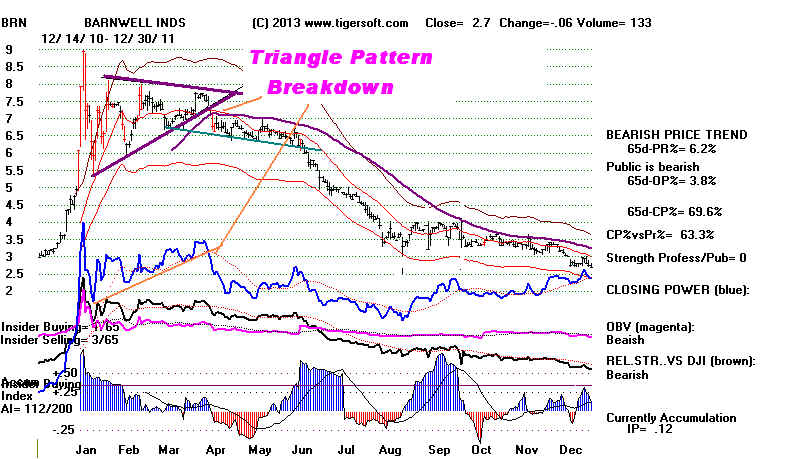
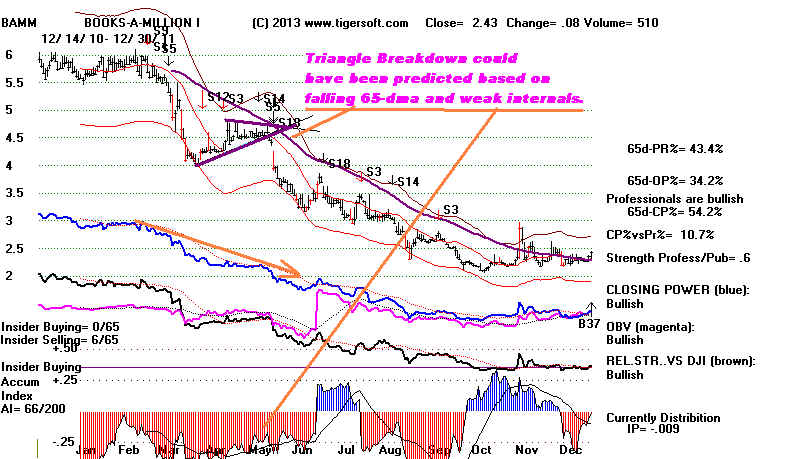
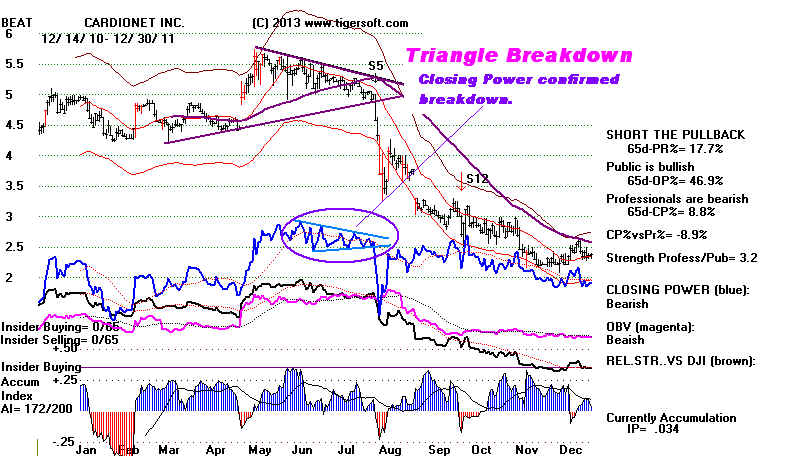
Triangle Breakdowns (Bearish)
Rising Wedge Patterns (Bearish)
Falling Wedge Patterns (Bullish)
Internal Strength Indicators
Tiger Accumulation Index
Tiger Closing Power
Sell on non-confirmation of new price high and then trend-break
Tiger Opening Power
Both Up Condition
Both Down Condition
Tiger Relative Strength RSQ
TIger Relative Strength ITRS-50
Tiger Day Traders Tool
OBV
OBV-PCT
Asynchronicity Index (with direction of daily DJI move)
Symmetry Index (against direction of daily DJI move.)
It may
help to read the rest of this page as a whole, in place of looking
at each
item above.
1) Support
and Resistance
A stock or index will often recover several or more times from approximately
the same price
leve or support-line. It also often will fall back from the same
price level or
resistance-line. The tests of the line are often suprisingly exact
and close.
There can be small differences here, but the important thing is to
watch for a
successful test of this price level. When it succeeds, traders quickly
make prices
reverse. Big institutions will tend to place orders to buy or sell
in a concentrated
way. A good number of buy orders concentrated at a
given price level
often brings new confidence to that market. Similarly, when
prices fail
repeatedly to get past a certain level, we should assume that there
is big money
selling and confidence in the stock or the market will thus be hurt.
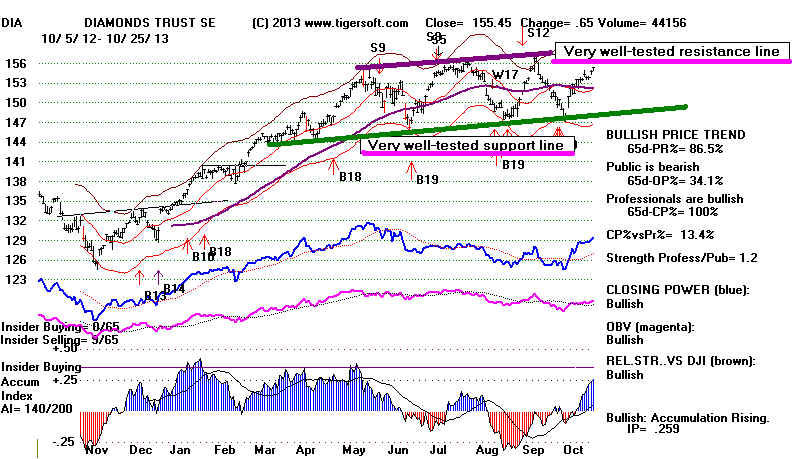
A well-tested
support line is more likely to succeed in reversing prices when
parallel to it is
a resistance line. The DIA shows a well-defined trading
range in 2013.
Horizontal Support at a 3x tested line drawn through lows
at same price
approximately is considered to be "well-tested". Similarly,
horizontal
resistance at a 3x tested line drawn through highs at about
the same price or
at at a resistance line is said to be "well-tested."
So, we should
watch for well-tested (=>3X) successful support and resistance.
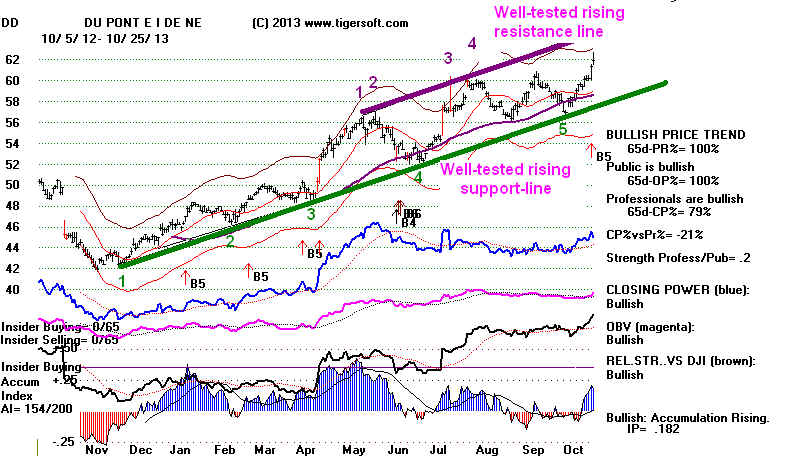
Support and
resistance that is well-tested can also occur on a trend-line and
at a particular
moving average. They can form price channels as shown below
in DD in 2013.
Professionals watch these trendlines. They are the ones
that make them
work. So, a well-tested support lines tend to show
Professional
buying. Similarly, a well-tested resistance line usually
shows
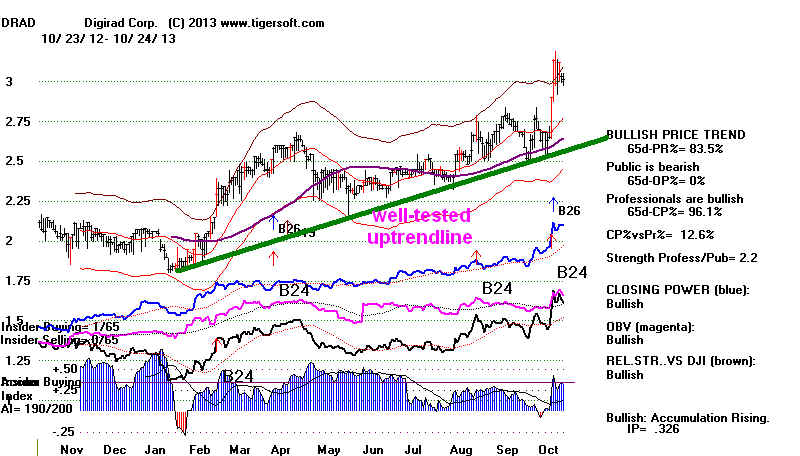
Professional selling. Accordingly, successful tests of a well-tested
uptrendlines that
go back over a few months should be used for buying.
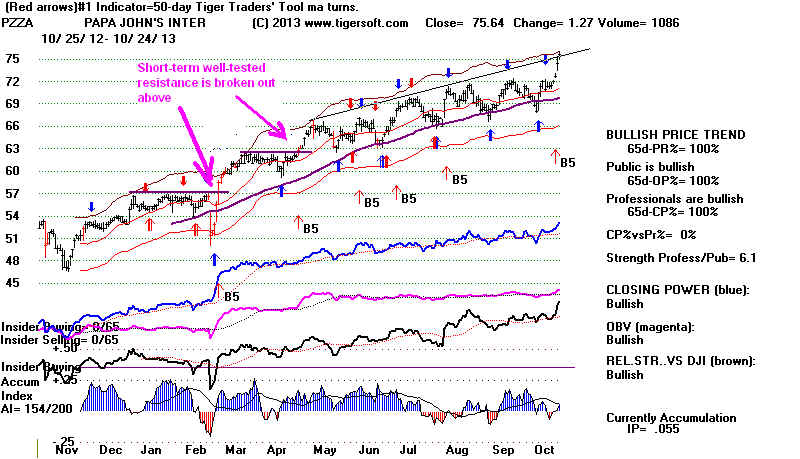
Short-term support lines are much less reliable. They are more likely
to be penetrated,
as when a short-term support is broken in a head/shoulders
pattern.
They are more likely to be penetrated to the upside when
a brief
resistance line is drawn in an uptrend. Here are two examples,
but look below
under chart patterns to see more.
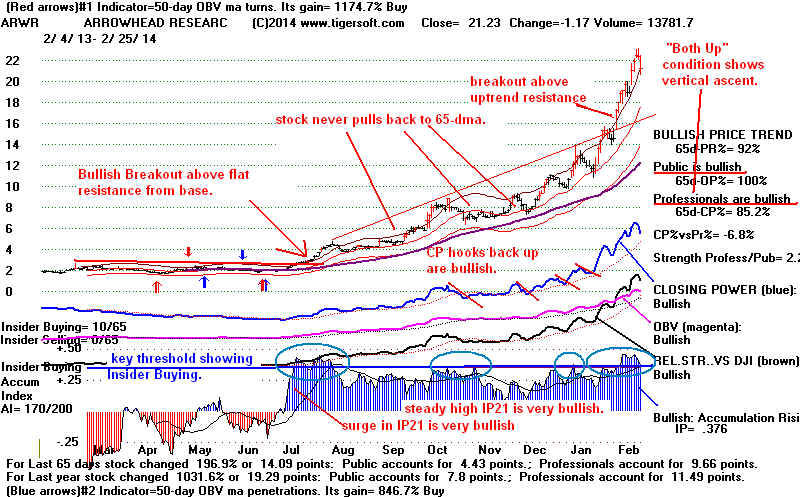
We use the hooks
upward by the blue Closing Power to decide when to buy.
The same thing
works in reverse for short sellers.
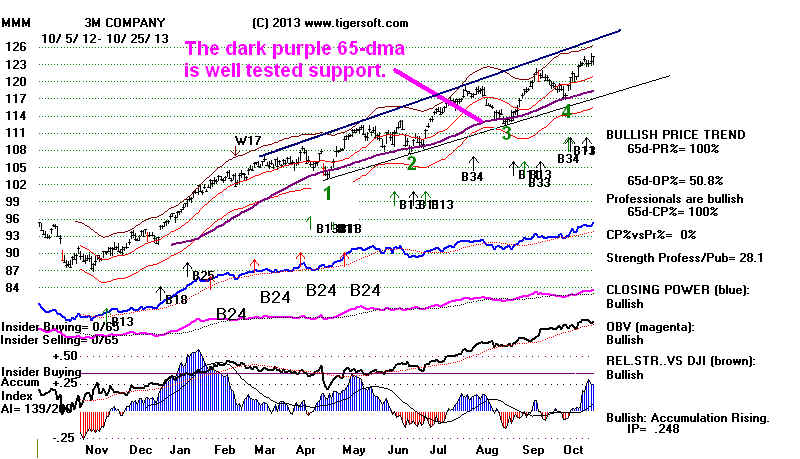
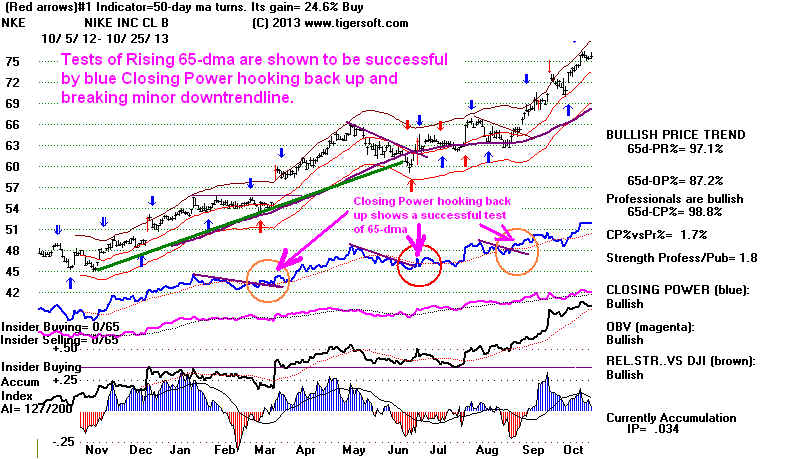
When the 65-dma becomes
well-tested as support, we want to buy on
what appear to be
successful tests of it. In particular, we watch the blue
Tiger Closing Power to
hook back up. This shows that Professionals
are net buyers again
and are aggressively buying.
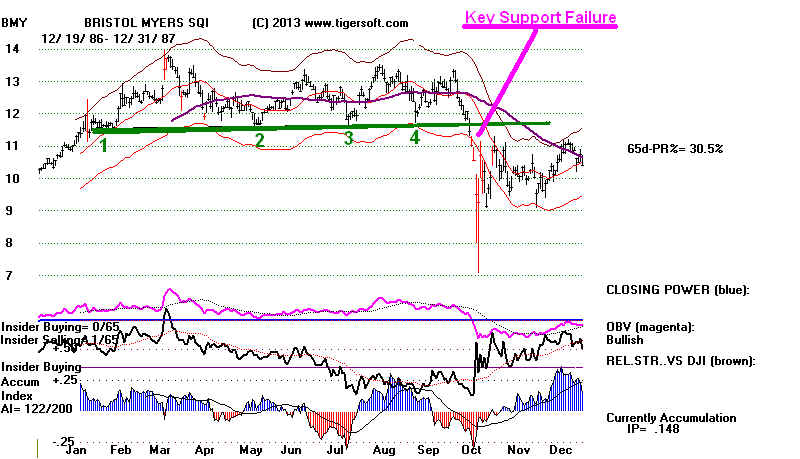
2) Bearish Breakdowns
But support
and resistance will sometimes finally fail and the failures
can lead to
rapid and deep declines. This was abundantly true in the
1987
October Crash, 2001 or 2008.
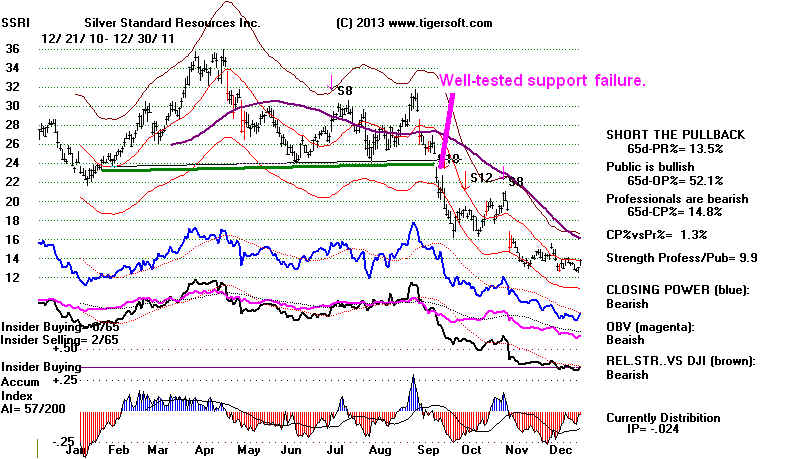
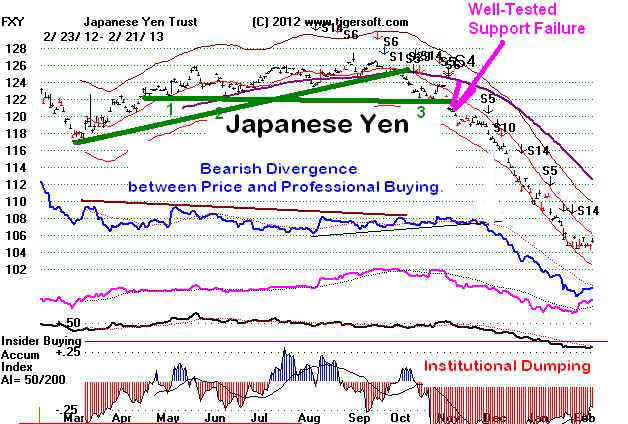
Individual stocks can break below well-tested support even in a rising market,
but
they are more likely to be mining stocks like SSRI below, currencies like the
Japanese Yen or bond funds early in 2013.
There can
be "false" breakdowns below support and "false" breakouts
above
resistace. Prices should be required to close below the support
line and close above the resistance level by 1% or more. In addition, we
will want
to see confirmation by our Tiger internal strength indicators of the
breakdown
andbreakout. More on this below.
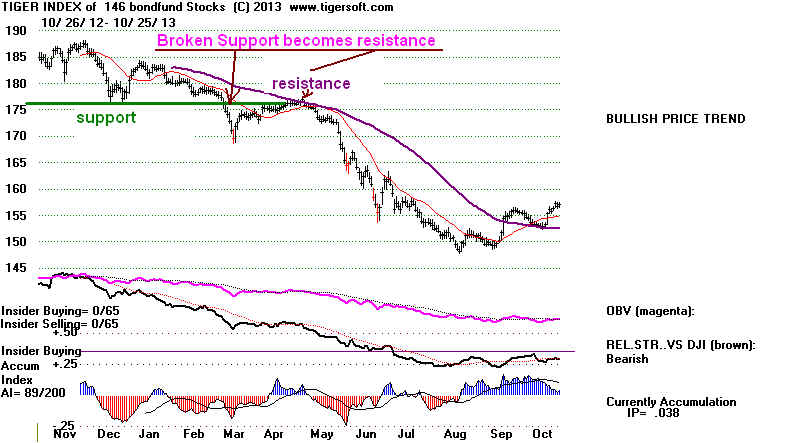
When key
support fails, the broken support level usually becomes resistance
on the next
rally. Traders should sell short on breakdowns and also when
the next
rally fails at the expected resistance of the broken support level.
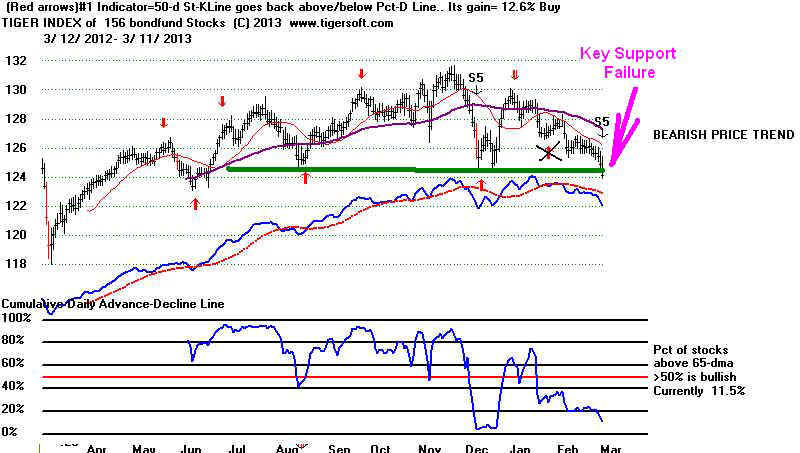
In the next two charts, see the Tiger Index of Bond
Funds for 2012 and 2013.
The
breakdown below key support was considered so significant I wrote a blog
about it.
Though after the breakdown, there was a pullback to the point of
breakdown,
this acted as resistance and the Index soon down sharply.
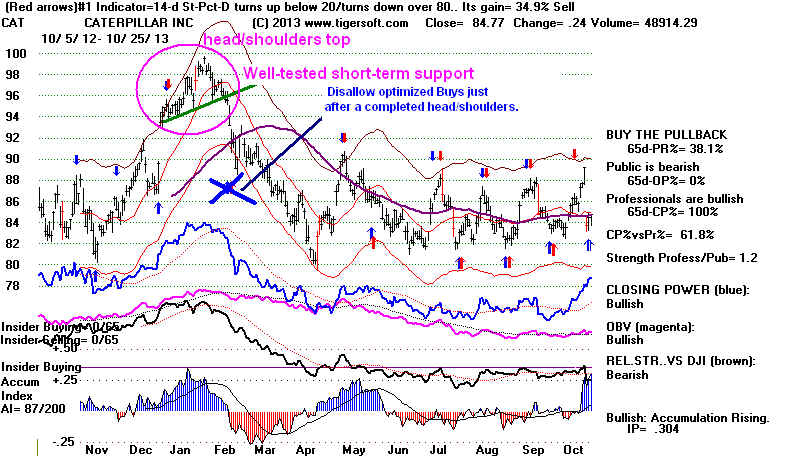
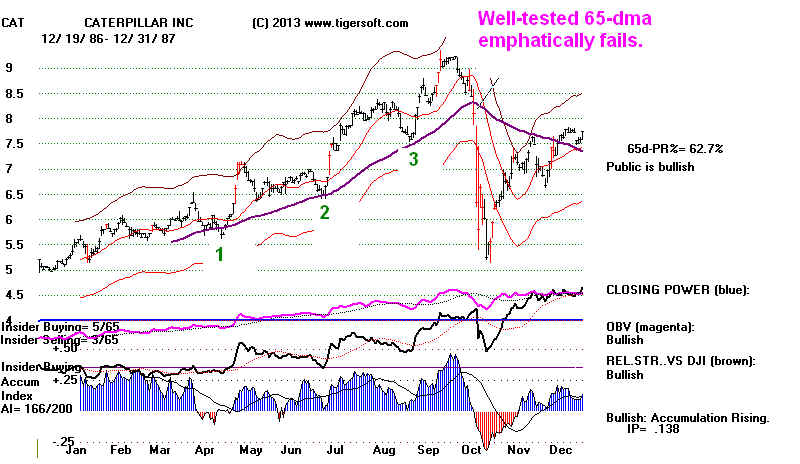
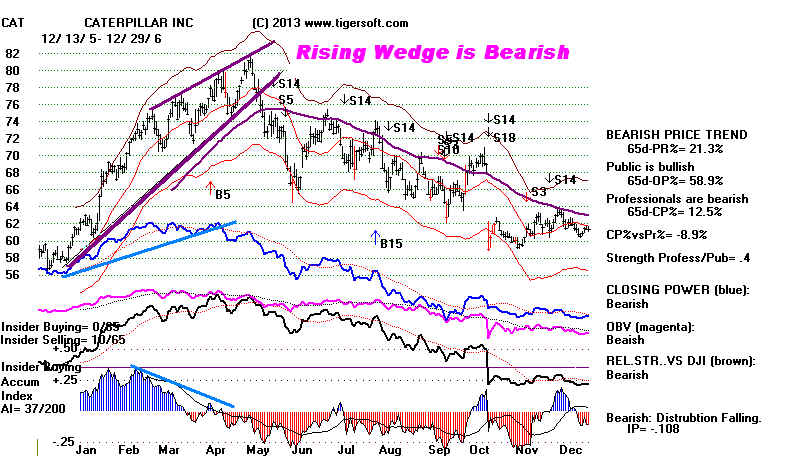
Commonly a
break in well-tested support usually gives way to a declin
A break in
well-tested support that occurs on red high high volume and
a price gap
is more likely to decline very steeply. See how CAT broke
below its
well-tested 65-dma.
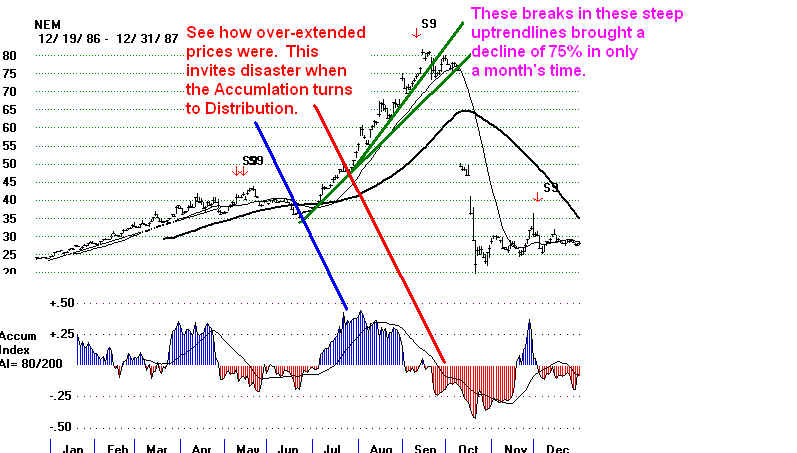
The
severity of a decline on a price-breakdown below support is most often
a function
technically of how over-extended prices are and how serious is the
underlying
technical weakness. NEM was very over-extended and showed heavy
distribution at the top. Its Accumulation Index had turned negative. The Tiger
Sell S9
warns of this.
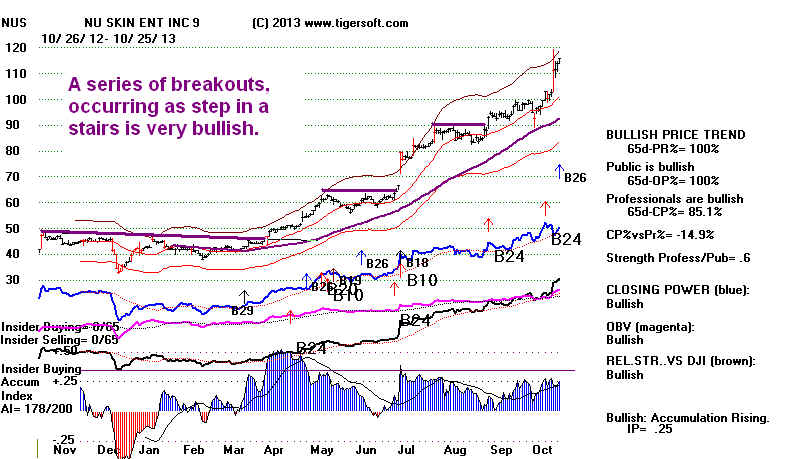
3) Bullish Breakouts
Broken
well-tested resistance most often leads to much higher prices. The
minimum
upside target then is the height of the pattern added to the point of
breakout
from the pattern. However, when Peerless is on a new Buy signal
and the
stocks shows bullish internals, as discussed below, the stock will
usually go
much higher. It is usually best to hold the first such breakouts
in a new
intermediate up-turn tightly, at least until they violate their 65-day ma.
When
well-tested resistance fails, the broken resistance level usually becomes
support
on the next rally. But do not count on a decline soon after the first
few
breakouts
whicxh will give you a convenient entry point. Too often in the
best
stocks, there are no such pull-backs.
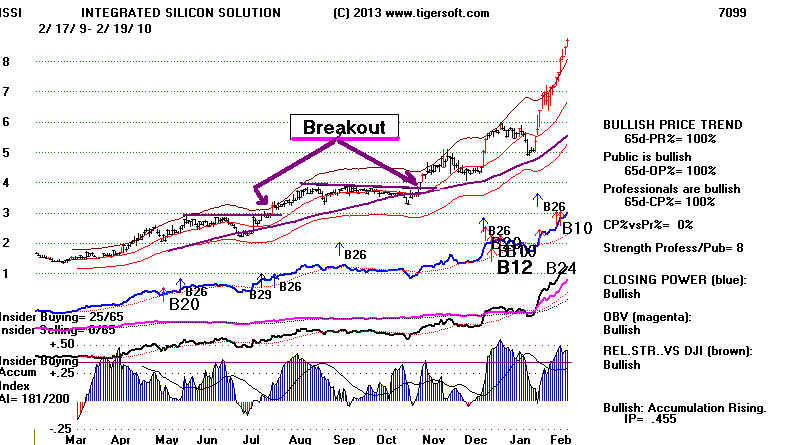
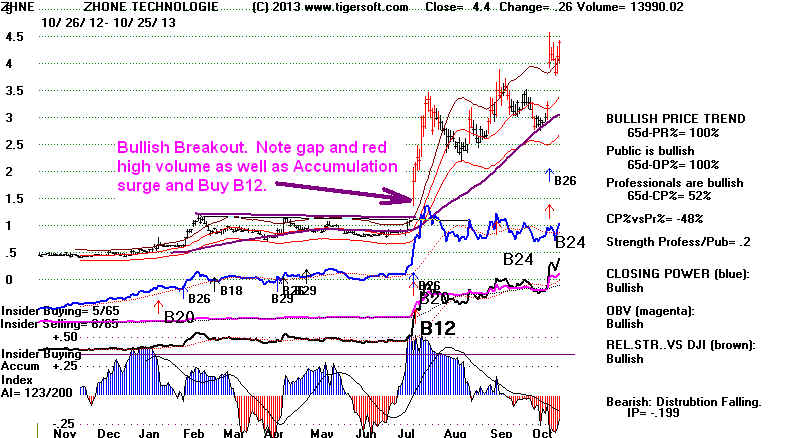
So traders
should buy on breakouts when:
1) Peerless is on a new Buy;
2) the price breakout takes prices clearly above well-tested resistance;
3) there is a price gap;
4) there is red high volume;
5) the Accumulation Index is or has recently bulged above +.375;
6) the Closing Power makes a new high to confirm the breakout;
7) the Relative Strength Quotient Line makes a new high.
8) the Tiger program puts major Buy signals on the screen:
B10 - major conformed breakout.
B12 - IP21>.45 and ITRS (relative strength) >.30
B20 - Take-off velocity has been achieved.
B24 - there has previously been a bulge of IP21>.45
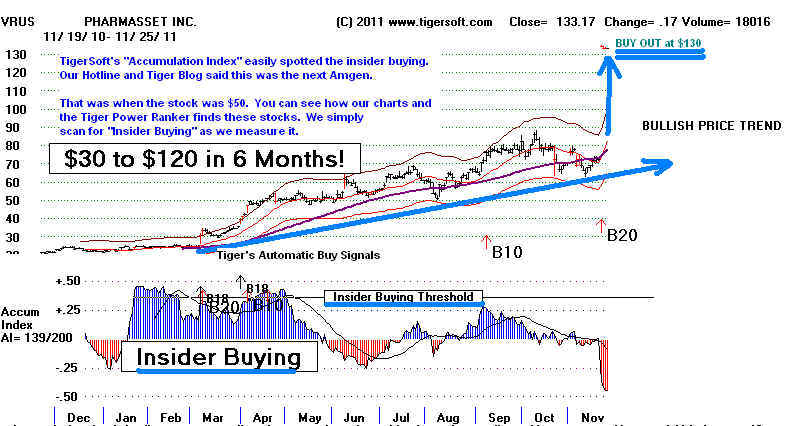
Every bull market shows
dozens or even hundreds of explosive
super stocks like this.
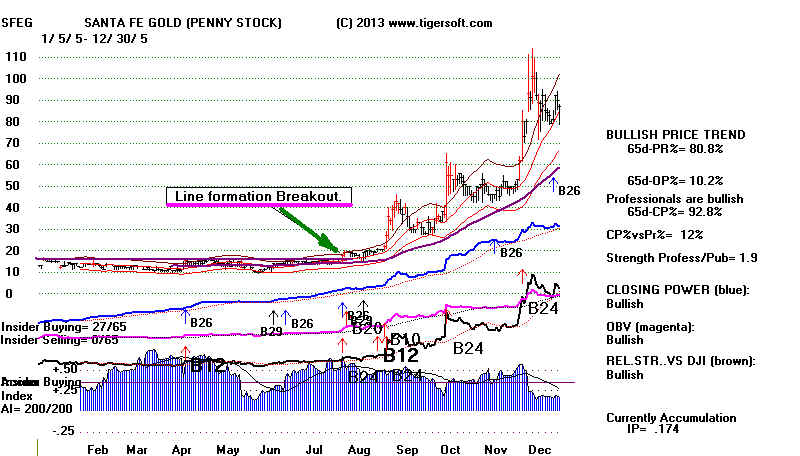
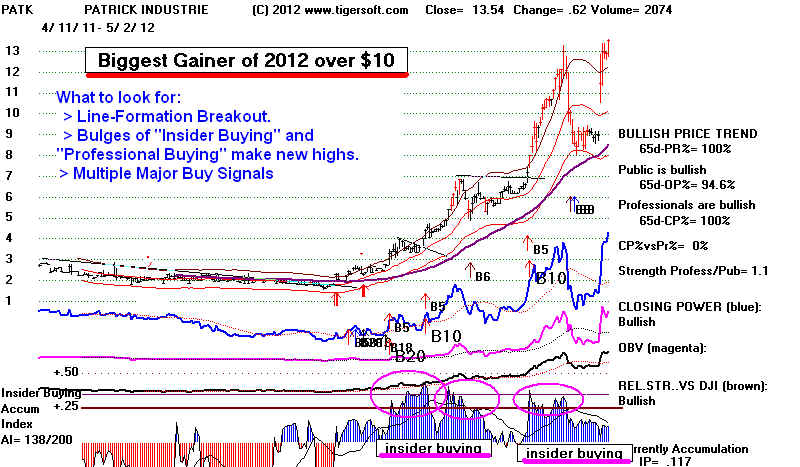
The biggest percent moves are usually made in
low priced stocks, like
SFEG. It prices have been multiplied by 100. You
can see this easily
enough. Run the Power Ranker against the stocks
making new highs.
Then view the stock up the most for 250 days.
From Tiger screen
choose Ranking Results + 250-day Pct Change.
Most of them have these
characteristics early-on in their moves.
More examples: 1990-2006 2007 2007-2008 2008-2009 2010 2011
See http://www.tigersoft.com/Tigers-Original-Indicators/index.html
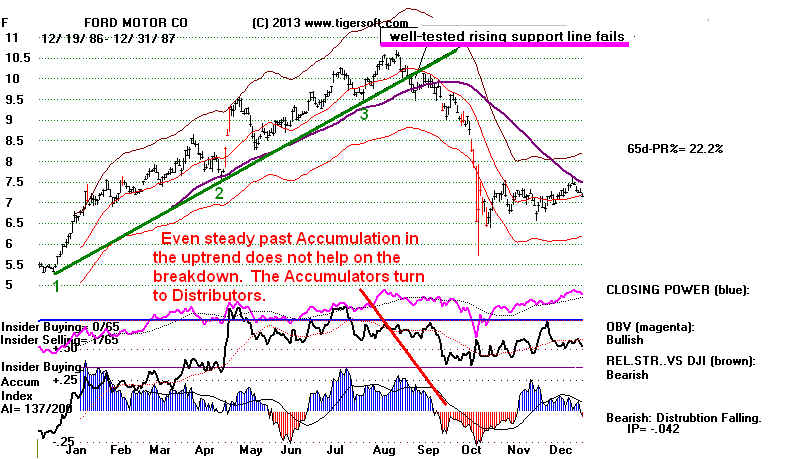
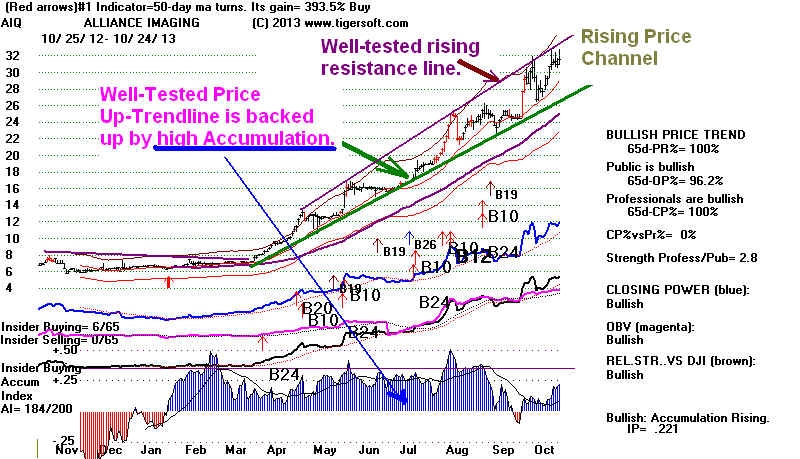
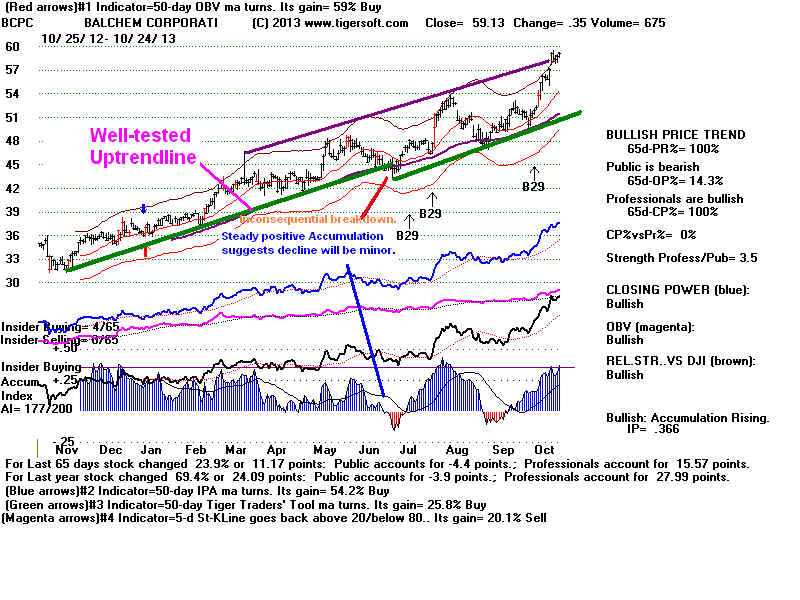
4) Price Trends and Well-Tested Trendlines
Uptrends can be
defined by their uptrend-support-line. Prices must have bounced
up from it at
least 3 times for it to be considered "well-tested". Successful
tests of a
well-defined up-trendline themselves show careful professional buying.
A price channel
may be said to have formed when there is a resistance line
that is roughly
parallel to the support line.
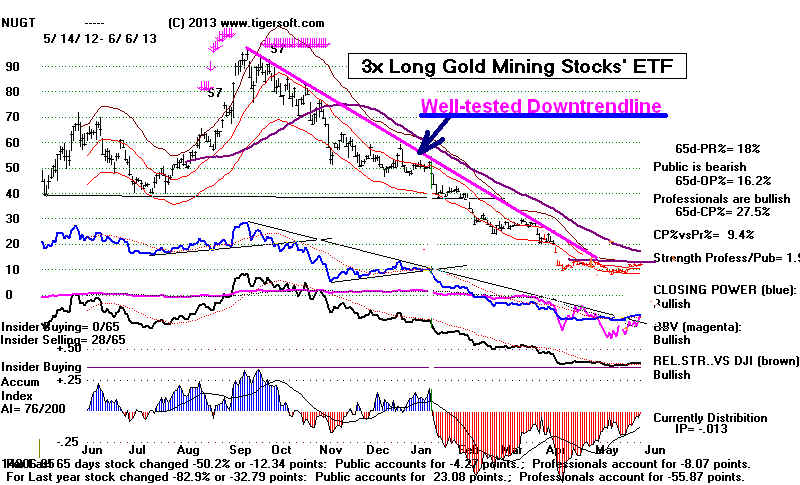
Downtrends are
defined by their falling resistance line. Prices must have fallen
off the
downtrendline 3x for it to be considered well-tested. Successful
tests of a
well-defined down-trendline themselves show careful professional
selling.
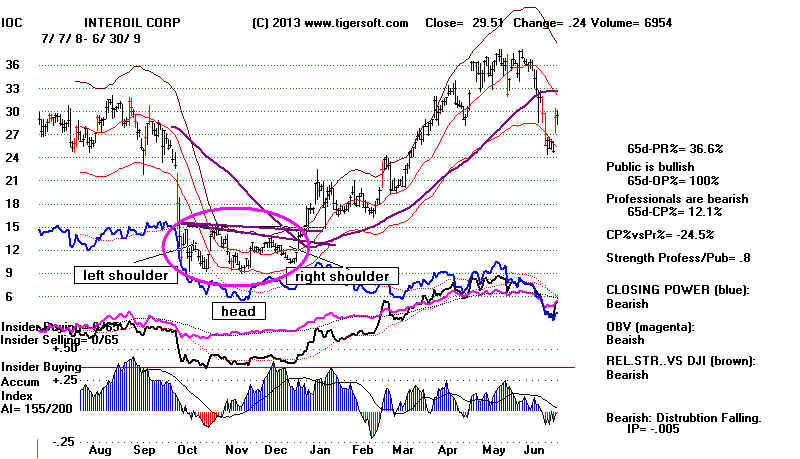
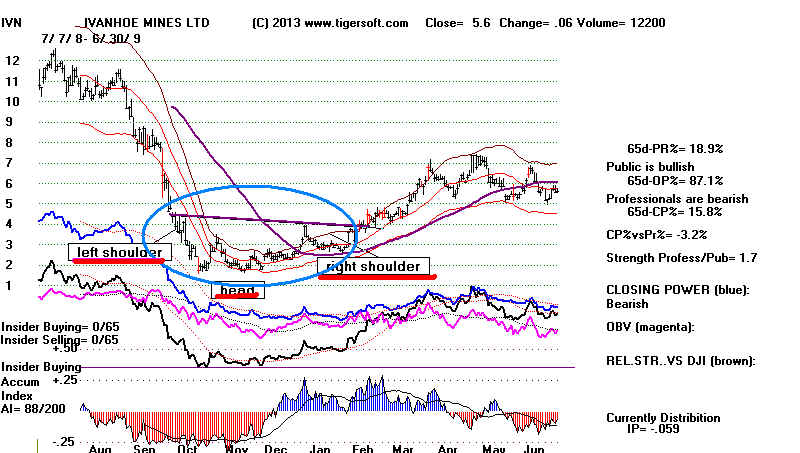
5) Price Patterns
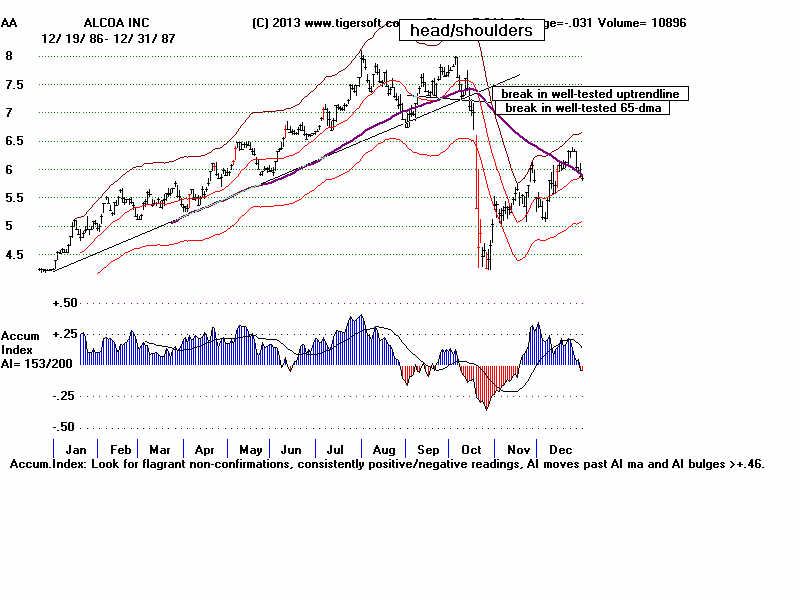
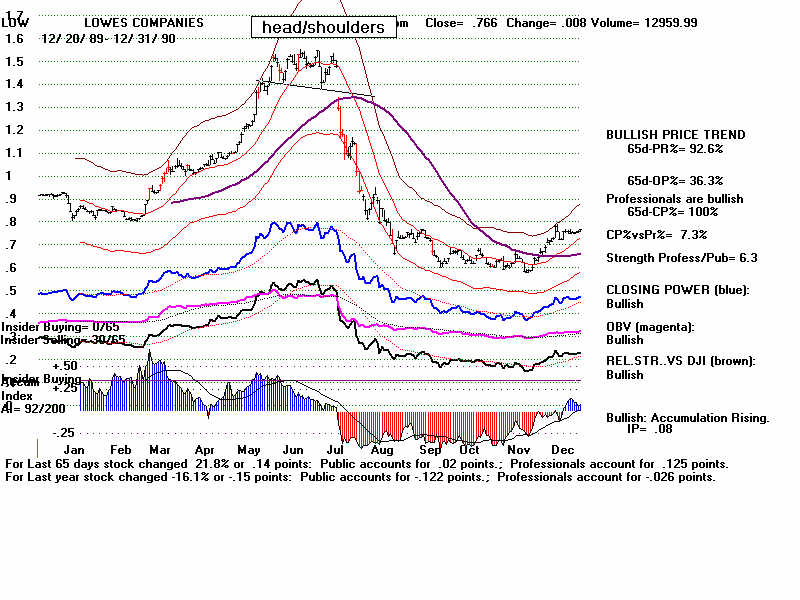
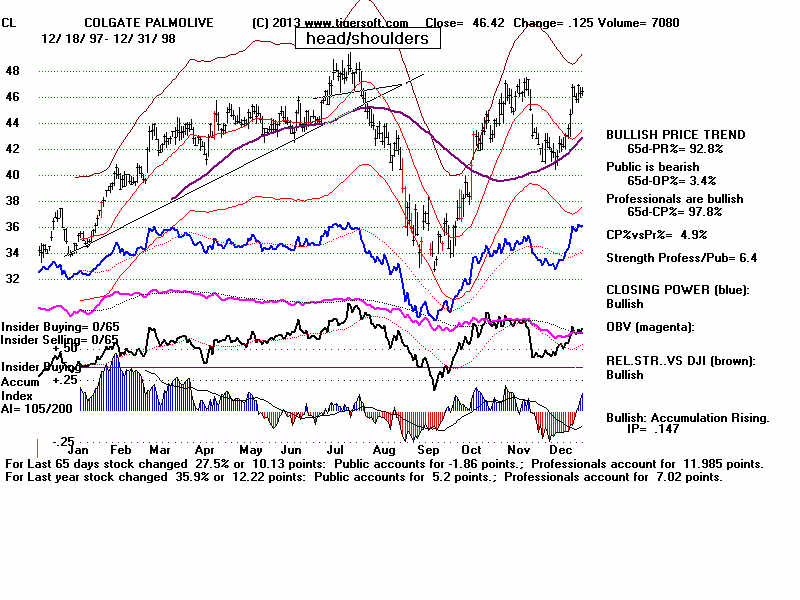
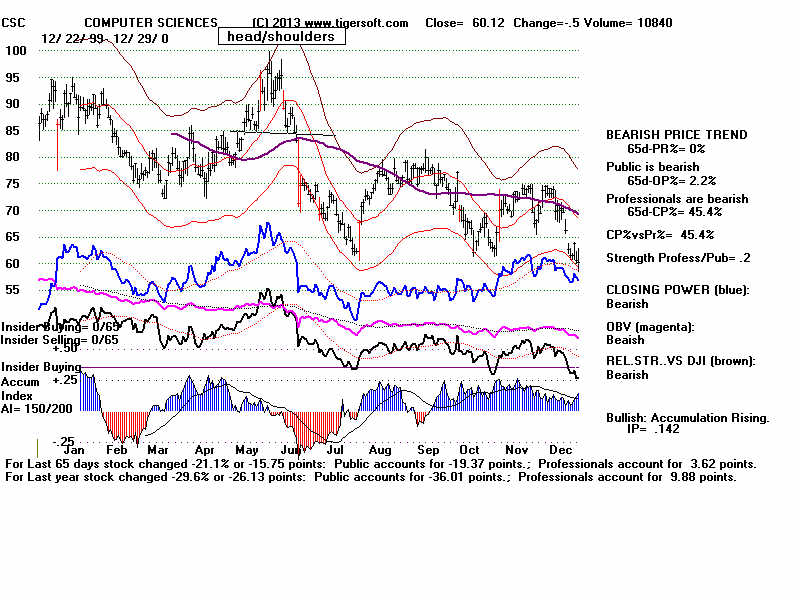
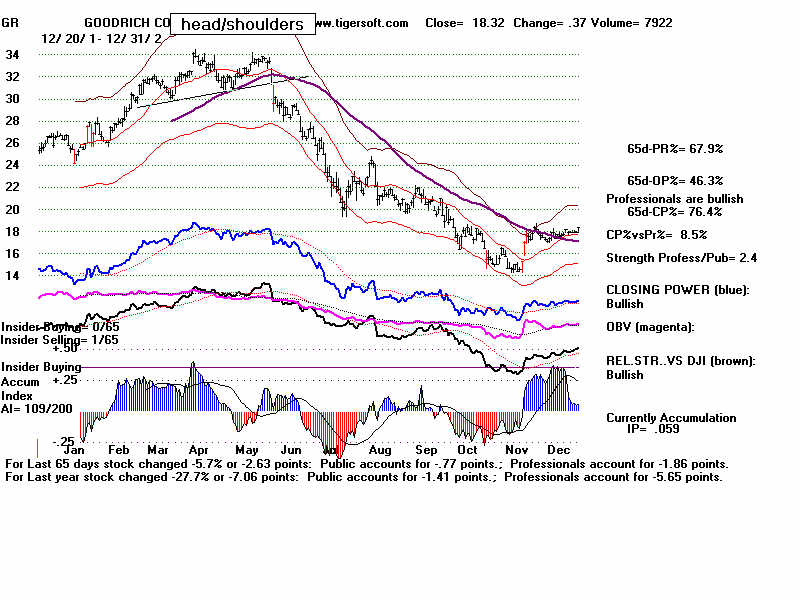
Bearish Head/Shoulders Reversal Patterns
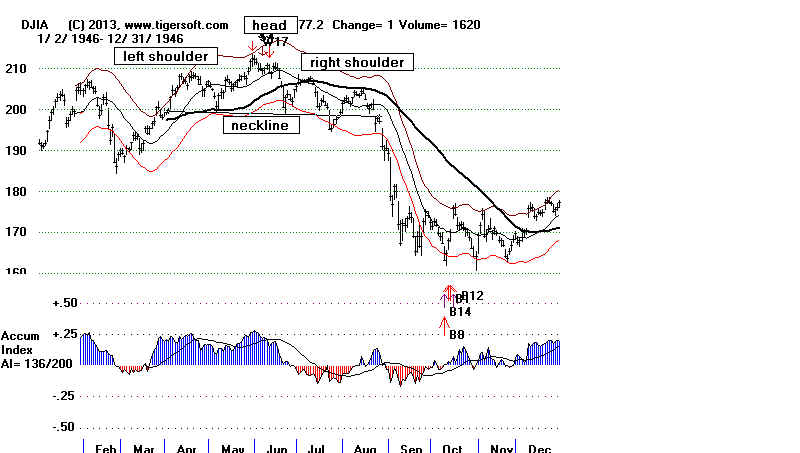
These bearish H/S
patterns can occur in any market environment. A close
below the neckline and
also the 65-dma completes the pattern and
increases the chances
for a significant decline. Markedly lower
Accumulation on the
right shoulder adds to the bearishness, as does
a price gap down on red
high volume. Compare the outcome of the
completed
head/shoulders pattern in VLO (below) during the 2013
bull market with
head/shoulders patterns at the start of general bear
markets in 1987(AA), 1990(LOW),
1998 (CL), 2000 (CSC),
2002 (GR)
and 2008 (HOT). It is a fact
that these patterns cannot be searched
for by the computer.
This means you will have to be on the alert for
them. One way to
save time is to look only a the stocks that have
fallen below their
65-dma and then note the ones that have just
completed a
head/shoulders pattern. While this bring a short sale
a little late, the
subsequent decline is usually ample enough to
make unimportant the
lateness of the short sale. 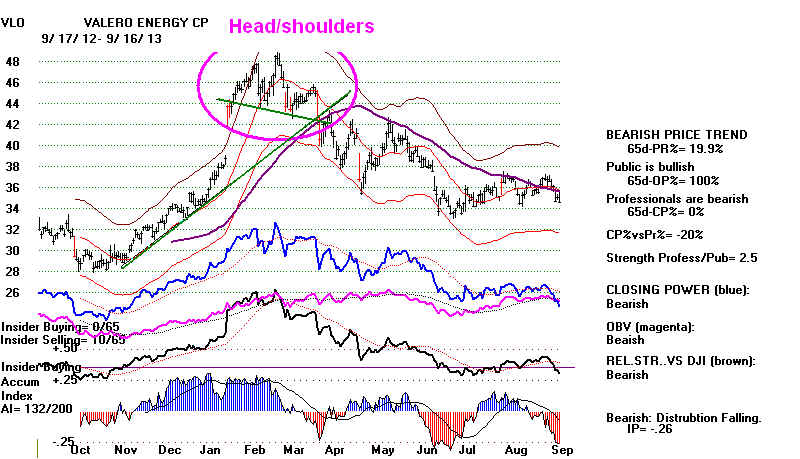
Examples
See DJIA Head/shoulders
patterns
SPY Head/shoulders
patterns
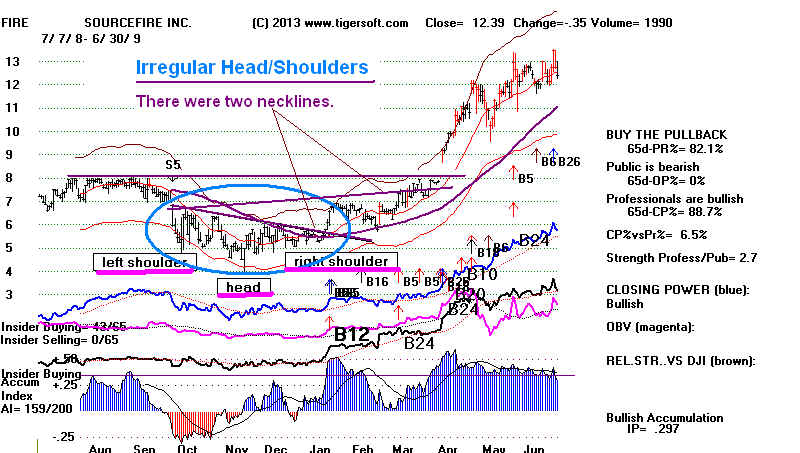
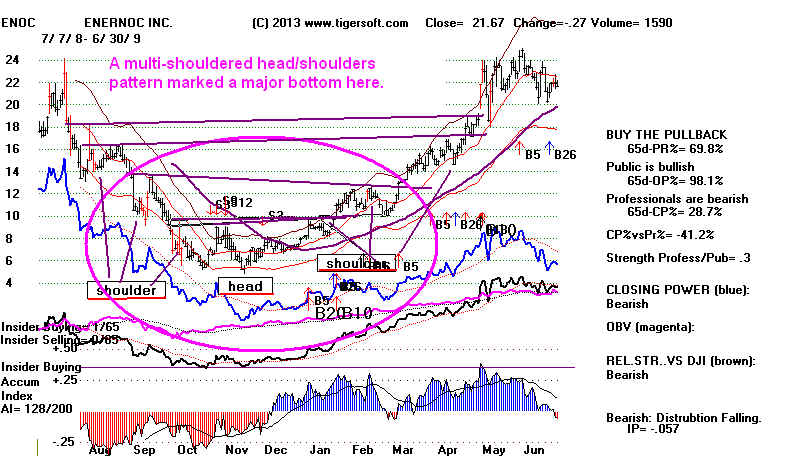
Bullish Inverted Head and Shoulders Reversal
Patterns
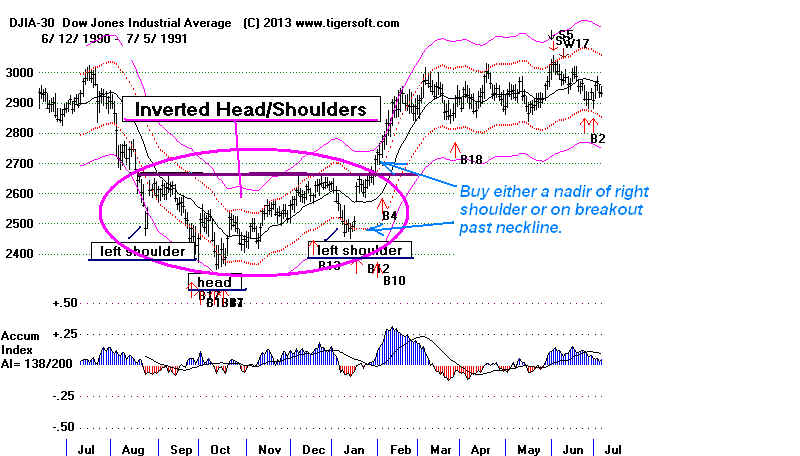
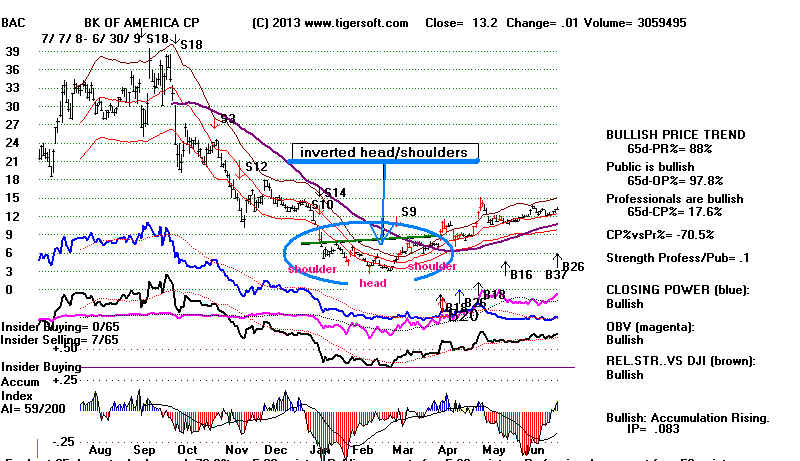
These
inverted head/shoulders patterns usually have less symmetry
then
regular head/shoulders do. The necklines sometimes are less precise.
Still, you
will see the basic outlines of the pattern, I hope, in these examples
from the
bottom in early 2009.
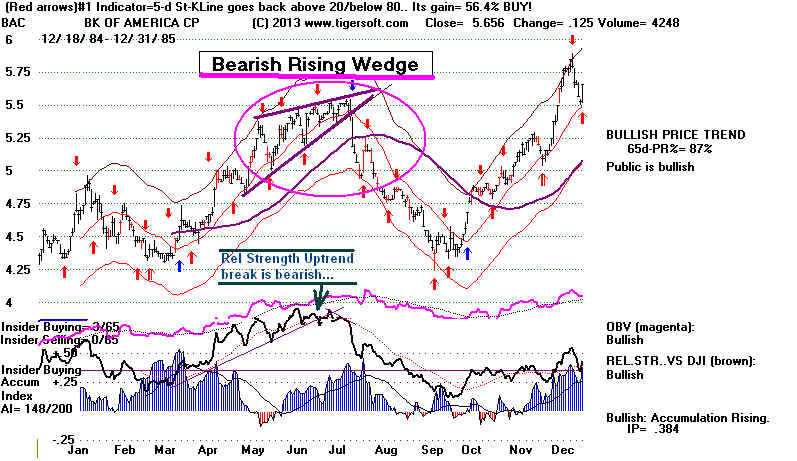
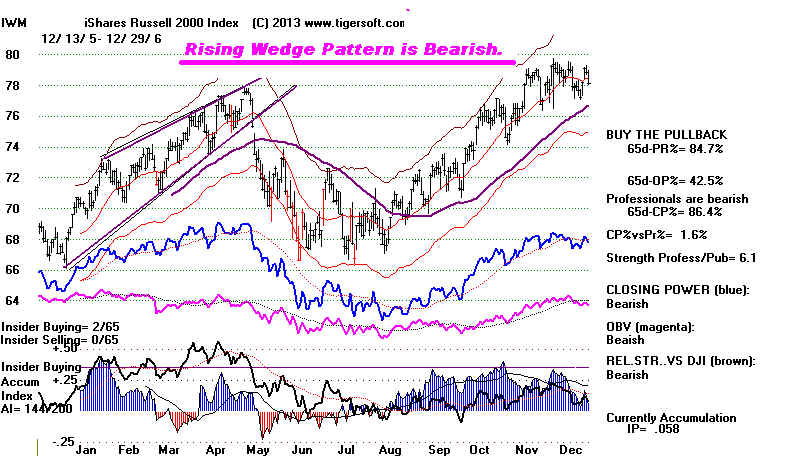
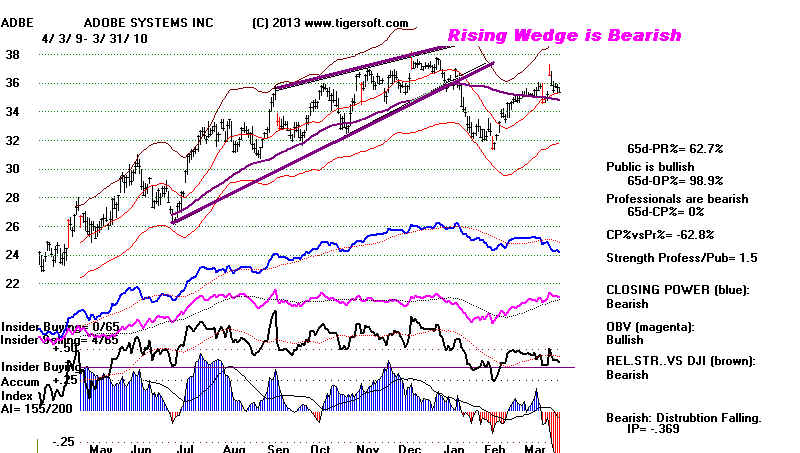
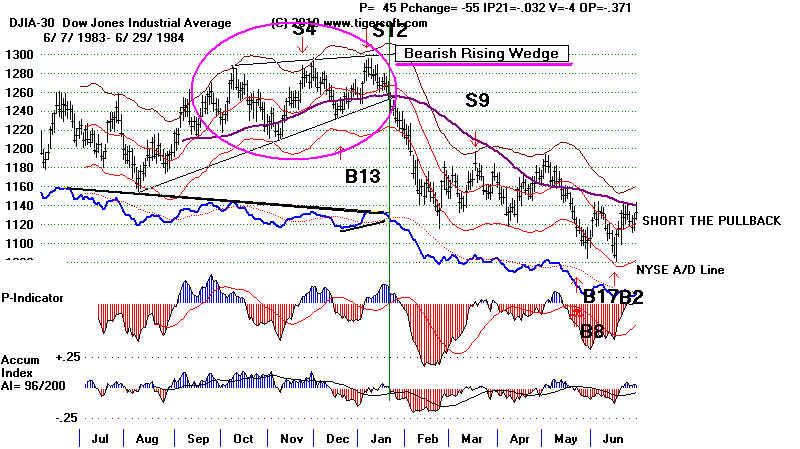
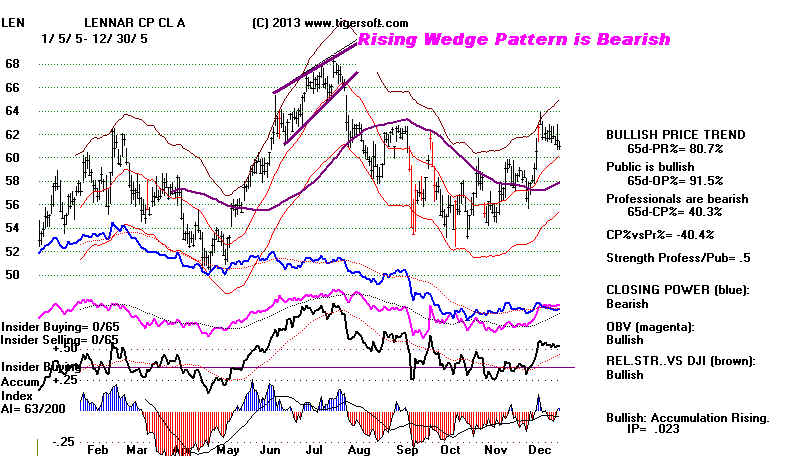
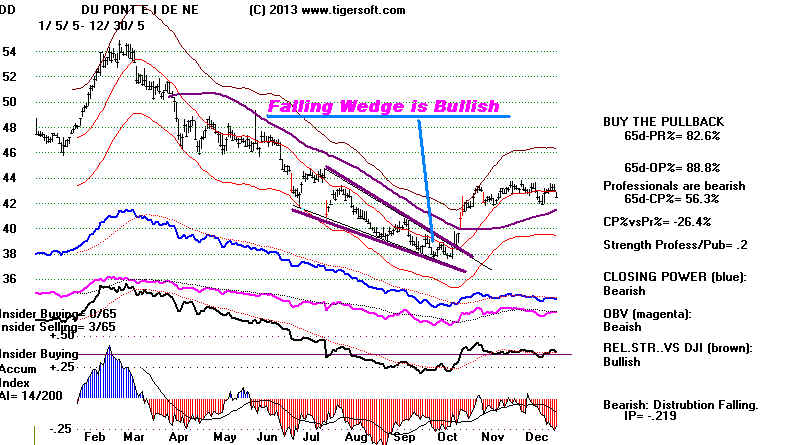
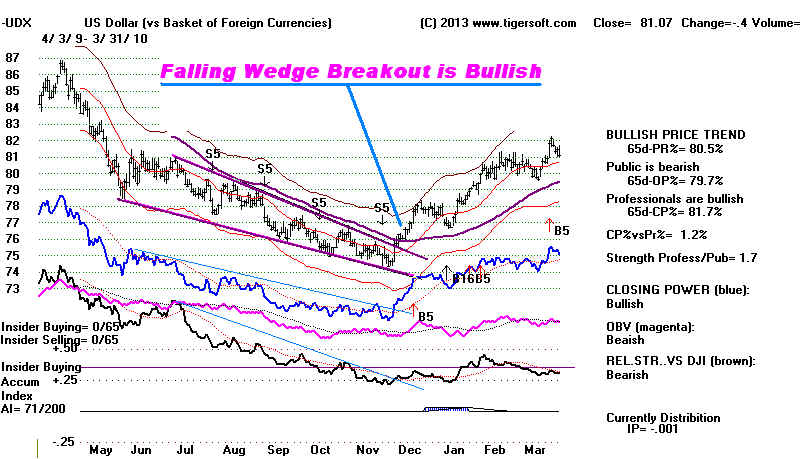
Bearish Rising
Wedge Patterns and Bullish Falling Wedge Patterns
Triangle Pattern
-Bullish Breakouts and Bearish Breakdowns
TRANGLE BREAKDOWNS
TRANGLE BREAKOUTS
Bullish
Flags and Flat-Topped Consolidation patterns. "They beckon for a
breakout".
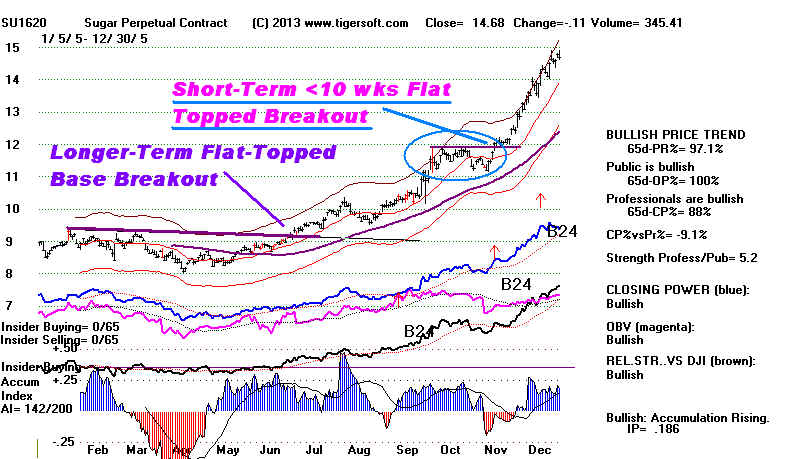
Trading Ranges
whose Prices may ultimately breakout out or breakdown.
Read also some of
the classics on Technical Analysis or goggle price chart patterns
2) Price Bands
Our bands automatically bracket about 93% of a stock's movements.
Very often the
bands bring reversals because they capture the stock's
over-bought and
oversolf conditions. Reversals are most likely at
the bands when
there are internal strength indicator divergences or
non-confirmations
are the upper or lower band. Peerless Sell S9 signals,
for example,
occur when the DJI reaches the upper band but the P-Indicator
is negative.
Sell S12s in Peerless register the fact that the Accumulation
Index for the DJI
is negative even as prices have reached the upper band.
With stocks, we
can place a Tiger Sell S9 on a chart. These show the
the stock's
Accumulation Index is negative with prices at the upper band.,
3) Price Breakouts occur when prices close above a well-tested
resistance line.
Price Breakdowns occur
when prices close below a well-tested support line.
Band Breakouts are
similar. Warning - do not trust
automatic Optimized
Stochastic sell signals on such breakouts.
The stocks are showing abnormal
strength or weakness.
4) We use our internal strength indicators to judge the likely
direction and power
of the moves from these patterns. This is
the analysis of divergences and
confirmations. Breakouts may be confirmed or unconfirmed by other indicators
or indexes making similar highs or lows at the
same time.
5) Momentum - Speed and Direction of the 21-day mvg avg (one
month),
65-day ma (one quarter), 52-week ma (one year using weekly charts).
6) Typical Over-Bought
Condition occurs when prices reach
automatically
drawn upper band above 21-dma.
Other indicators show this differently
Stochastic - above 80
CCI - above 200
RSI - above 80
Typical Over-Sold
Condition occurs when price reach
automatically drawn lower band
below 21-dma.
Other indicators show this differently
Stochastic - above 20
CCI - above -200
RSI - below -20
7) Tiger Accumulation
Index measures Institutional Buying and
Selling.
Steadily positive Accumulation tends to show
there will more new highs or a
price breakout. Steadily negative
Accumulation (red Distribution) suggests
a breakdown or more new lows.
8) High readings from Tiger Accumulation Index above +.375 may show Insider
Buying.
Bulges of Accumulation, especially above +.50
are signs that insiders are preparing
for a big advance in the stock, assuming
general market conditions allow it.
But these stocks on their dips when the Closing
Power hooks up.
9) Extremely High Readings
from Tiger Accumulation Index above
+.45
show intense Insider Buying and our studies
show this is a key factor
occurring in 70% to 80% of the best performing
stocks each year.
10) Closing Power measures daily net Professional Buying and Selling.
This is
very important - Please see our internet-book on subject.
http://tigersoftware.com/2012-EXPLO/ClosingPower/1-Cover/index.html
Start off
by trading IWM - the Russell-2000. It is highly liquid. Volatile.
It has
leveraged ETFs if you like. It is not so easily manipulated and
the Closing
Power trend-changes have worked well over the years.
Closing Power Trend Changes
Applied to IWM and IBB: 2000-2013

11) Optimized Red signals
are best used when a stock is very over-extended
and there is a new Red Buy after a long
decline or a Red Sell after a long
advance.
The 5-day Stochastic also work extremely
well for limited periods of
time, especially in flat trading ranges.
If the trend is strongly up, the
Sells will be terrible, but the Buys can
be usually be be used.
work welli