(c) 2013 www.tigersoft.com All rights strictly reserve

TIGERSOFT's PRICE BANDS
(c) 2013 www.tigersoft.com All rights
strictly reserve
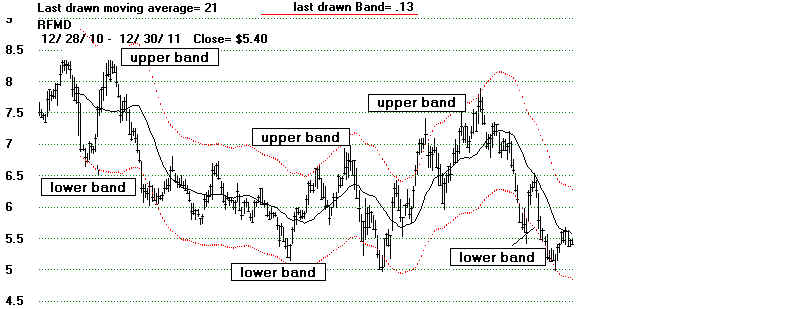
TigerSoft invented fixed percentage interval Price
Bands around a Moving Average
back in 1981.
Now they are used widely by many chartists and technicians.
Our bands
originally were fixed percentage intervals above and below the
21-day ma. Since then we have found it useful to put
bands above 7-hour,
35-hours, 65-day
and 52 week moving averages. Here we focus on the
bands above and
below the 21-day ma which are used in our daily charts.
The bands
represent typical over-bought and over-sold conditions. Reversals
usually take
place at the bands, but not always. We pay close attention
when the bands do
not bring reversals. Just as Sherlock Homes heeded
the dog that did
not bark, we are alerted by bands that do not bring reversals..
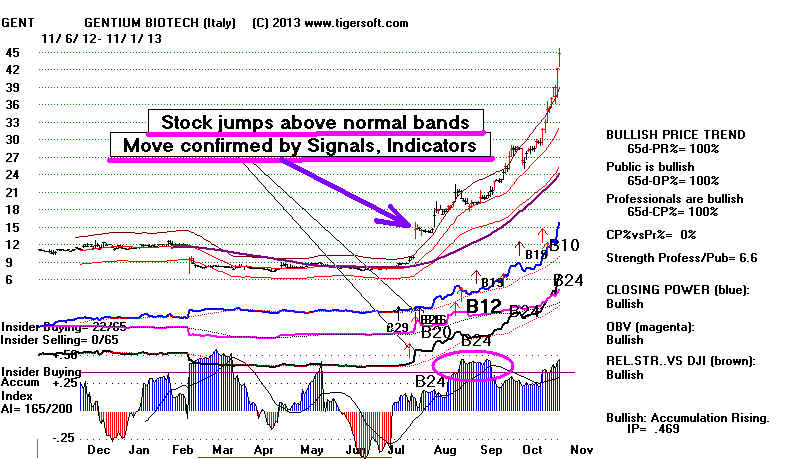
Band
Breakouts/Breakdowns
When prices
move past the bands, the stock is either accelerating up or
accelerating
down. Usually this is a break-away move if there are major Buys
(B10, B12, B20 or
B24) and the TigerSoft Accumulation and TigerSoft Closing
Power are
confirms the moves.
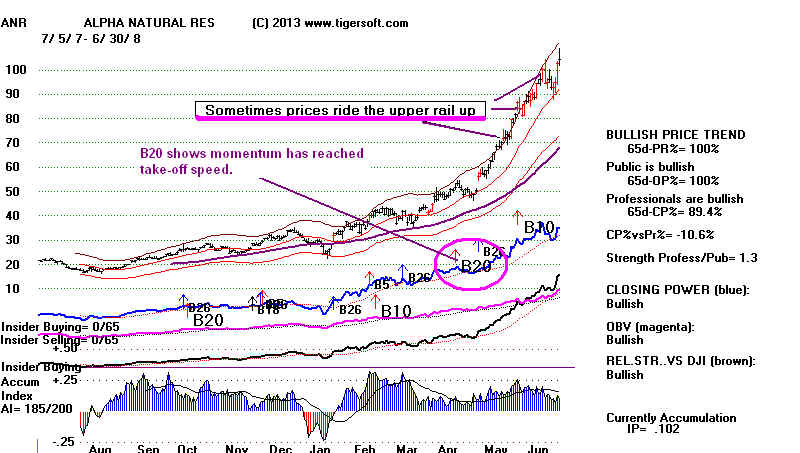
Prices
Ride The Outer Rail: Powerful Momentum Up
Often you
will see prices ride the outer band up. Internals are usually very
good.
You will also see Tiger/Peerless buys at this time if prices are apt to
continue to
advance. With stocks we would look for B12 and B20 signals,
particularly..
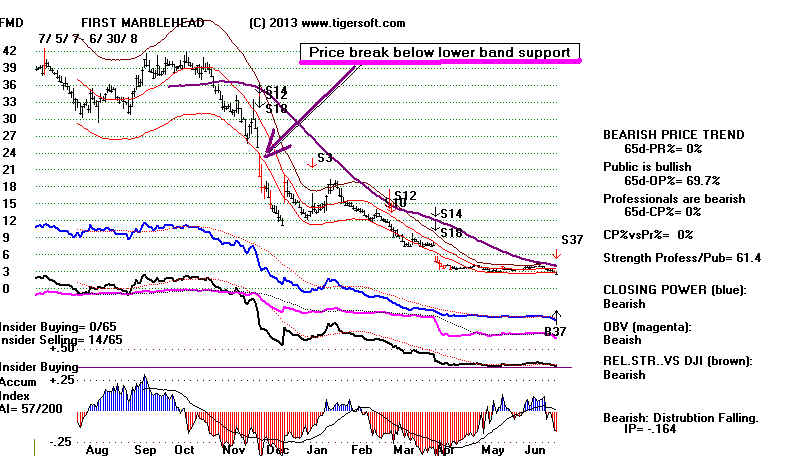
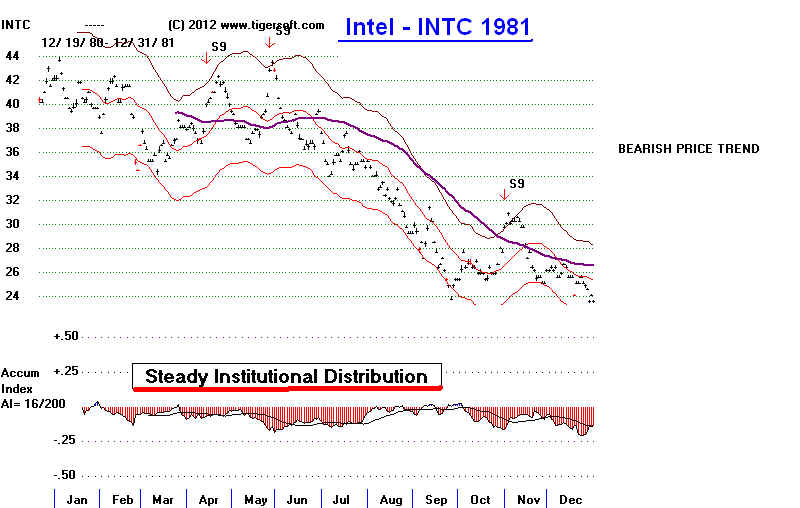
Prices
Ride The Outer Rail: Powerful Momentum Down
Most of the Tiger
and Peerless signals are derived from where the index, stock
or commodity is
in relation to the price bands and how strong (Blue Accumulation
and Insider
Buying) or weak (Red Distribution or Insider Selling) the stock is.
The internal
strength indicators are the bottom of the Tigersoft or Peerless chart
are constantly
measured up against the stock's price action and the ratio of
the stock's
closing price and its 21-day ma. Thus, we simultaneously employ both
momentum and
divergence analysis in generating automatic signals.
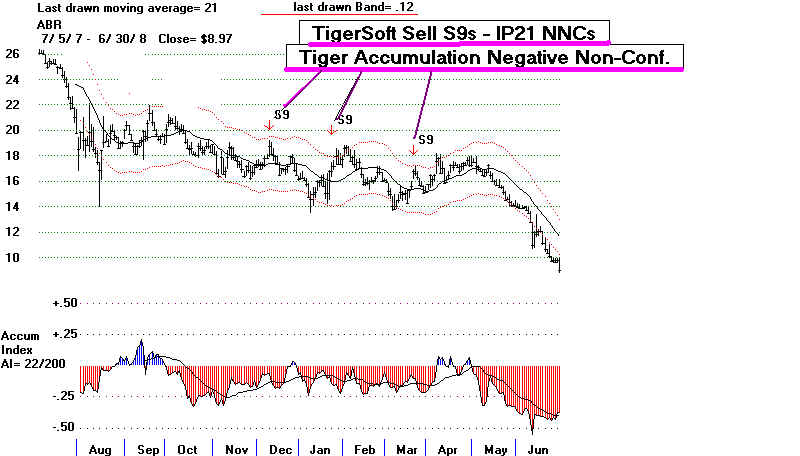
TigerSoft
Sell S9s Show Stock IP21 NNCs.
See more examples
at http://tigersoft.com/--1--/52109index.html
HOW
THE BANDS ARE SET
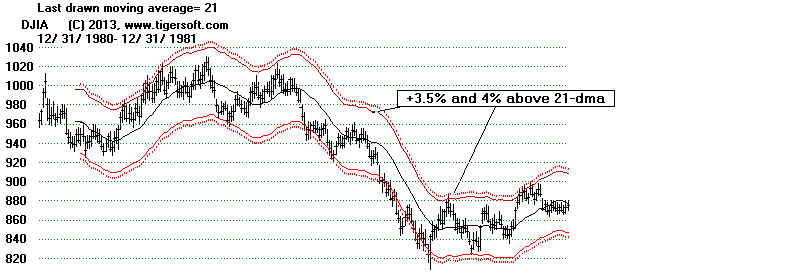
In 1981, the
DJI's upper and lower bands were set at 4% and then 3 1/2%.
You can see how
well the bands showed the path of the DJI back in 1981.
Only in August
did the DJI go beyond the boundaries of the lower band.
The bands, in
effect, captured and bracketted about 93%-95% of the trading.
This is the basis
of the current optimization of bands, done with
PEERCOMM + Tiger
Stocks + Optimize Bands and Drop Earlier Data.
At the time, on an Apple II+, we
considered 8% band the right width for
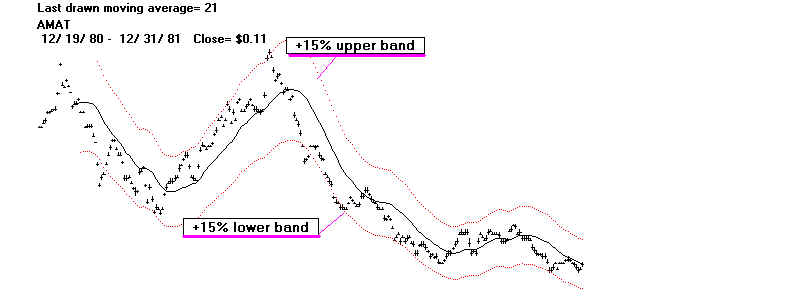
most DJI-30 stocks. A typical NASDAQ stock was about twice as
volatile. So we assigned 5% band to most NASDAQ stocks.
This worked fairly well in 1981 for most stocks. See AA and AMAT below.
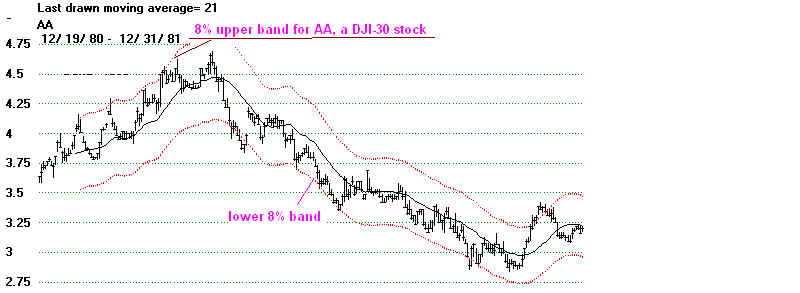
.
![]()
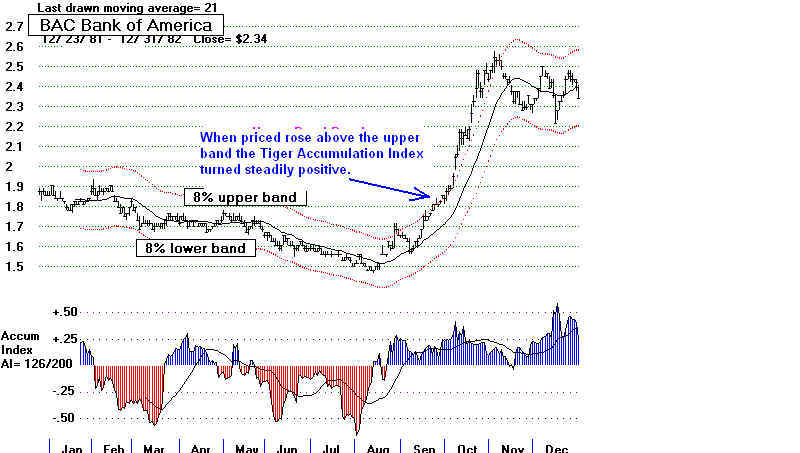
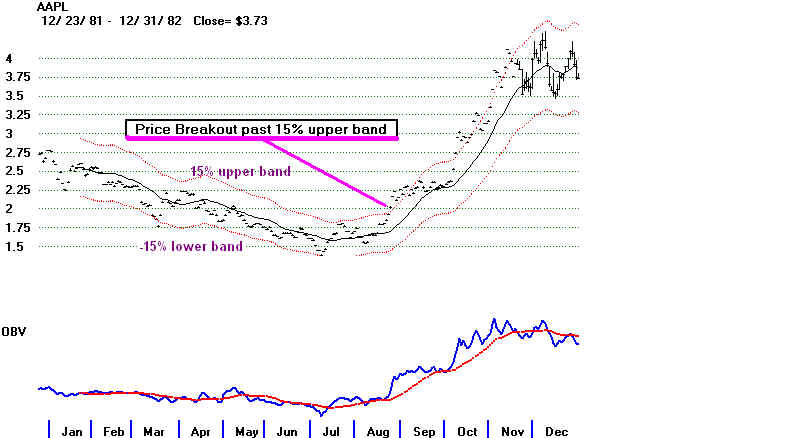
Then, in August 1982, prices moved way past the normal upper bands.
The subsequent bull market showed the importance of such breakouts.
It was also clear that high volume on the breakouts was important.
In AAPL's case the OBV (On-Balance-Volume Line) made a new high
in mid August, long before prices did. Volume led prices. In BAC's
case, the Tiger Accumulation Index (which we invented in 1981, too)
switched from negative to steadily positive for a BAC. Big institutions
were again buying the stock.
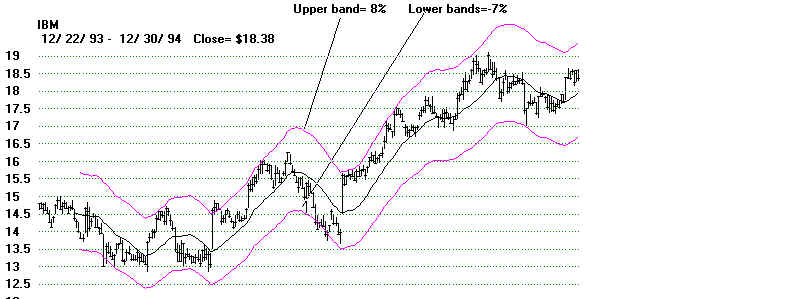
The greater memory of the IBM PC and then
Windows in the 1990s
allowed us to provide
ways for the users to redraw -optimize bands.
The best fitting lower
band did not have to be the same width as the best
fitting upper band.
Below is the optimized band chart for IBM for 1994.
In the table below, see
how the Optimized bands around the 21-day ma
have changed from year
to year.
> The upper bands have ranged from +2.7% (1991) to +18% (2002).
> The upper band does widen in a bull market but it has tended to rise
even more in a bear
market.
> The lower bands have ranged from +2.4% (1985) to +18,5% (1987).
> When the lower band % is low, it shows a bull market environment.
> When the lower band is high, a bear market is signified.
> When the upper band's % is much greater than the lower band's,
it is a sign of a new bull market (1982 -1984, 1991, 1995 and 2009.

IBM PRICE BANDS AROUND 21-DMA
==============================
Upper Lower
Band Band
------------------
1980 +7.5%
-8.0% (mini-bear market)
1981 +5.0%
-5.5%
1982 +9.5%
-5.5% (start of bull market)
1983 +7.0%
-4.5% (bull market)
1984 +6.0%
-4.8%
1985 +4.1%
-2.4% (bull market)
1986 +8.5%
-5.5% (bull market)
1987 +5.5%
-18.5% (bear market)
1988 +5.5%
-4.2%
1989 +4.3%
-3.5%
1990 +4.3%
-7.5% (bear market)
1991 +7.0%
-3.8% (start of bull market)
1992 +2.7%
-3.2%
1993 +2.8%
-2.3%
1994 +3.0%
-3.6%
1995 +4.0%
-2.0%
1996 +4.0%
-3.8%
1997 +6.0%
-6.0%
1998 +10.5% -8.5%
(mini-bear market)
1999 +14.5% -13.0% (bear
market coming)
2000 +10.5% -13.0% (bear
market)
2001 +15.5% -12.0% (bear
market)
2002 +18.0% -14.0% (bear
market)
2003 +6.0%
-6.0%
2004 +5.5%
-4.6%
2005 +7.0%
-6.5%
2006 +6.0%
-3.7%
2007 +6.0%
-7.5% (start of bear market)
2008 +6.5%
-17.0% (bear market)
2009 +9.0%
-6.0% (start of bull market)
2010 +4.5%
-4.8%
2011 +6.5%
-7.0%
2012 +4.3%
-5.5%
2012-2013 +4.6% -6.0%
====================================================================================