currency has either sold-off so much or risen so much that, at least, some kind of
reversal "should" "normally" be expected soon. This begs many questions.
For example, how much of a reversal is one looking for? Mostly TigerSoft
traders are looking for moves longer than a few days. Two-weeks to 6-months
is good goal for traders looking at end-of-day data. So, while we view
end-of-day hourly charts, we are mostly interested in what daily charts
can offer.
Prices may look "oversold" on an hourly chart but still be near the top on a weekly
chart. The hourly "oversold" condition will help the trader only if the uptrend
in the longer-term chart continues. One should therefore be cognizant of the
status of a stock on the basis of the longer term chart, 5 year weekly or longer,
as well as the Tiger Daily chart that goes back a year. If you are a very short-term
trader, having intra-day charts will be helpful, but it is not essential and can
sometimes be mislading.
On the basis of what indicators is "Over-Bought" and "Over-Sold" defined?
1) The bottom of Price Trading Ranges show an "over-sold" condition. The
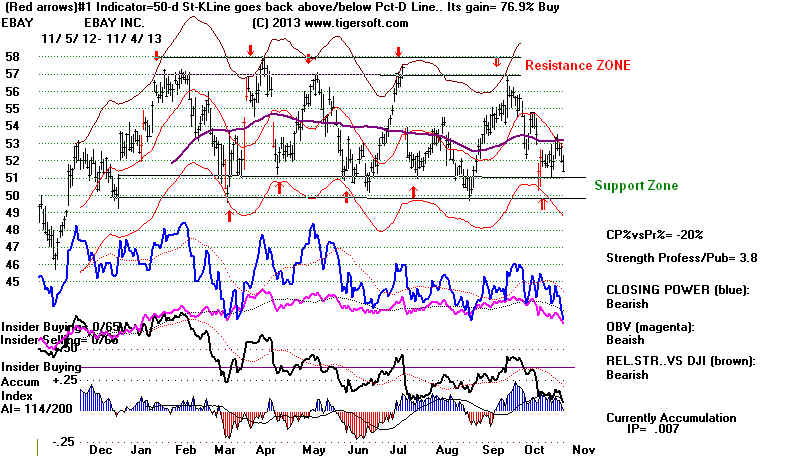
top of the trading range shows the "over-bought" condition. EBAY shows
an unusually well-tested set of parallel support and resistance lines. Most
trading ranges so not have so many swings in them without a breakout or
breakdown.
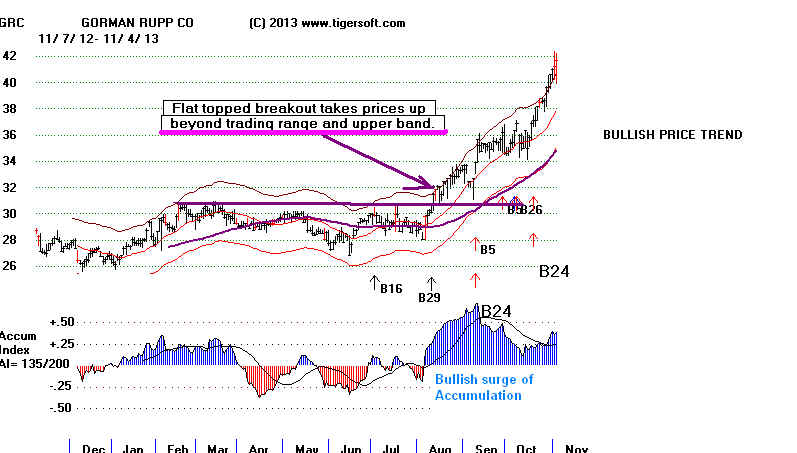
2) Tiger's Price upper and lower price bands on a daily chart are important. But
we know we must also be aware of the internal strength of a stock when the bands
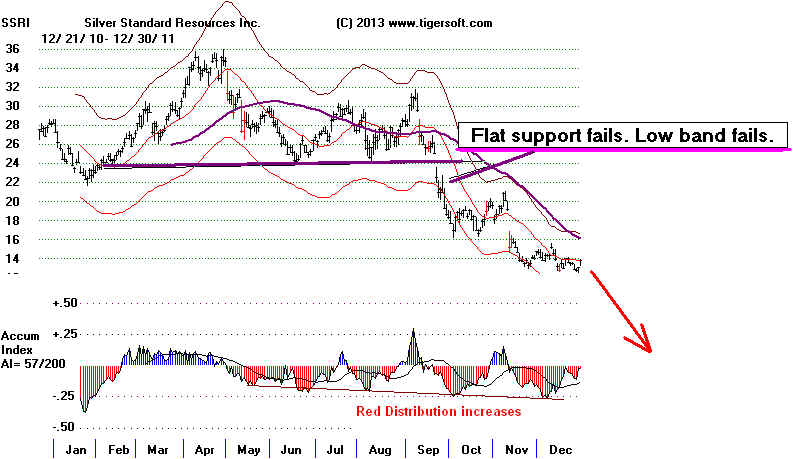
are reached. We should also realize that flat-topped trading range breakouts
will often send a stock up past the simple tagging of the upper band, just as a
breakdown below well-tested support will often cause prices to drop below
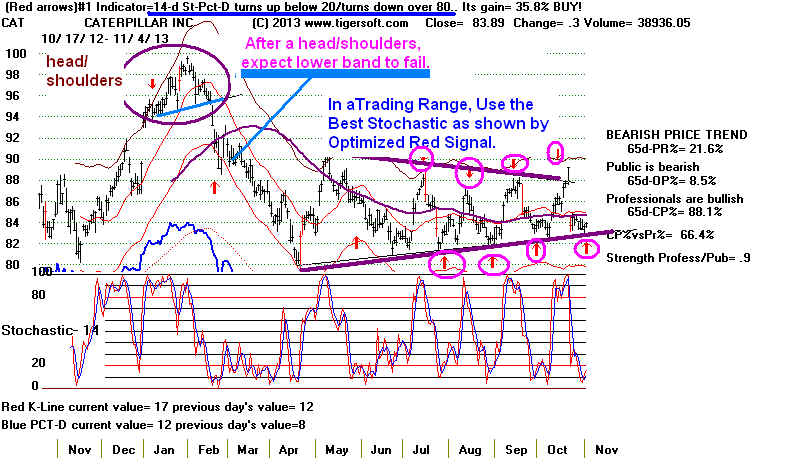
the lower band. Head/shoulders patterns like a trading range breakdown
usually bring too much weakness to use the lower bands, Stochastics, CCI
or the RSI to identify a reliable over-sold condition. See chart of CAT below.
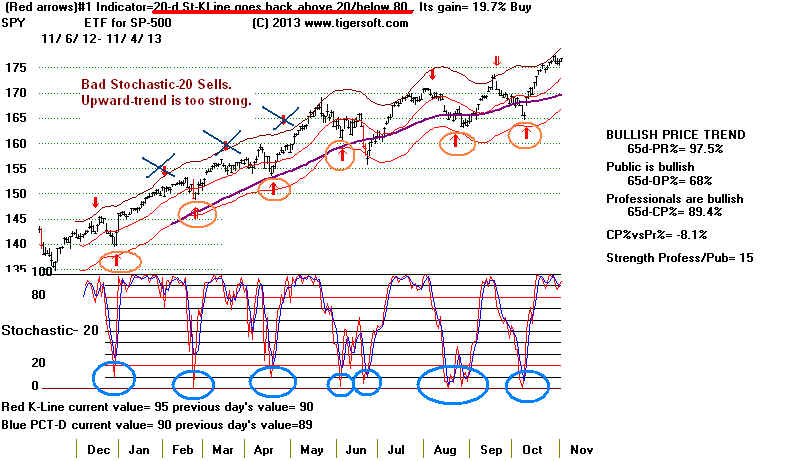
3) Stochastic' Oscillators help. They tell us how far up from the bottom to the top a stock
in within its, say, 5-day range, or its 20-day range, or its 65-day range. A stock
might be expected to have more reversal potential when it is below the 20%-level
in all three time periods, but this is not necessarily so. A trader may prefer a
short-term 5-day over-sold condition when the stock's momentum is still strong.
In the chart below, the 20-day Stochastic Buy signals work nicely, while
three of the 20-day Stochastic Sell signals are premature. This shows that
momentum can trump what are normally "overbought" Stochastic readings.
See at the bottom of the screen the Stochastic oscillators. The second blue
one is a 3-day smoothed "slow" Pct-D Stochastic. Falling below 20 and then
rising above 20 gives the Buy signals.
Stochastic overbought and oversold Buys and Sells work best
as a team together when prices are locked in a trading range.
Tiger's automatic signals will tell you what length stochastic to use.
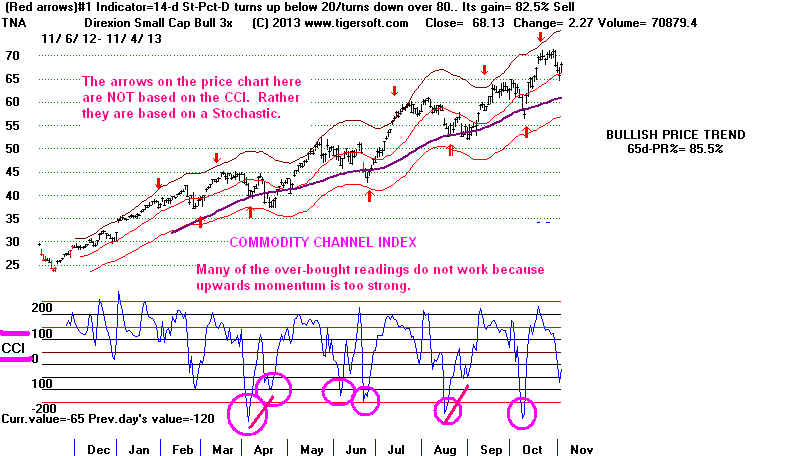
4) The CCI Oscilator helps Index Option traders a lot. They are especially
interested in intermediate-term moves when the CCI (Commodity Channel Index)
registers oversold and the trend is up, especially as defined by Peerless.
When the Tiger Automatic Signals also contribute a reinforcing Buy, it's
clear the uptrend has re-started. If you trade index options, don't wait
for a clinching signal. Buy on weakness when the option premiums
are lowest.
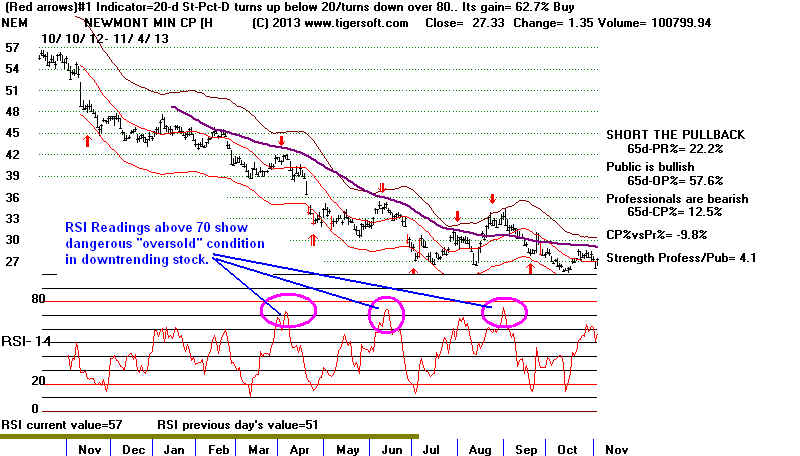
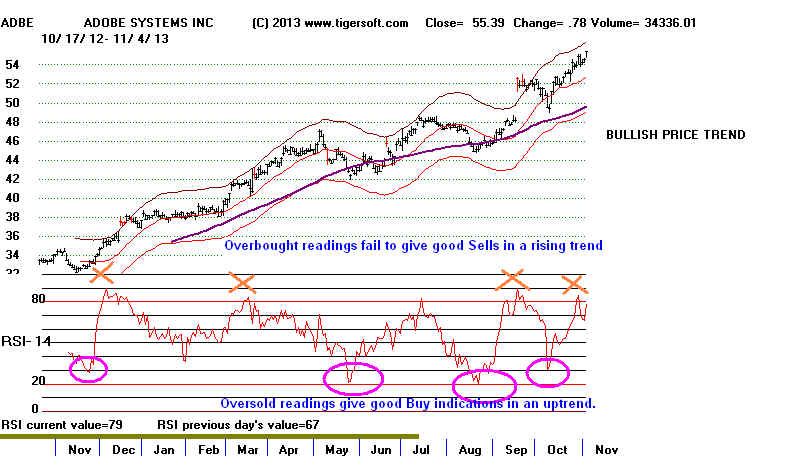
5) RSI (not to be confused with TigerSoft's Relative Strength tools)
also shows over-bought conditions. They work in a way that is similar
to the CCI. There is lot of writing about the RSI on the internet. Buy
the RSI dips below 30 in an uptrend. Do not use the RSI moves over
70 or even 80 to Sell. See ADBE below. The opposite is true for the
stocks in a downtrend. Use the RSI moves above 70 to sell, but do
not use the moves below 30 to buy.
Uptrending Stock. Use RSI Over-Sold Readings to Buy
.:
Down-trending Stock. Use RSI Over-Bought Readings to Sell Short