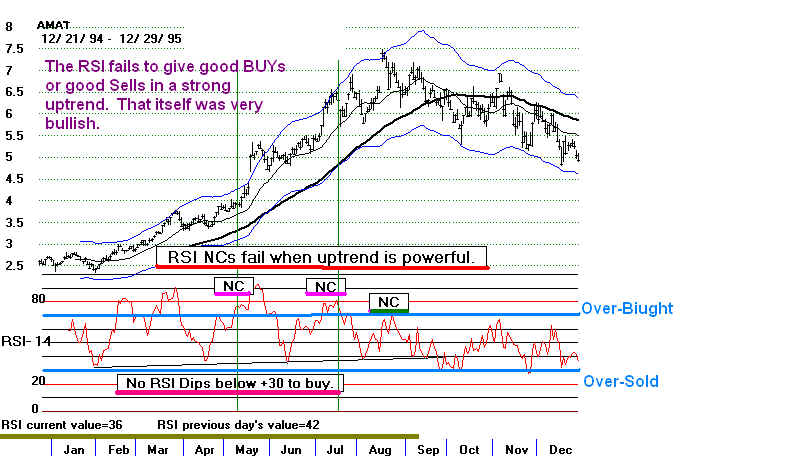
But this is too simple. We want also to factor in the strength of the price trend and our
internal strength indicators. Not all readings above +70 offer good points to sell when prices
are strongly uptrending. Nor should we wait for an oversold reading (<30) to buy if the
stock's 65-dma is rising and its internals are very good. The chart of AMAT shows the
limitations of this tool. Exactly when the stock was strongest, at the beginning of 1995,
there were no good Buy signals, because the RSI did not fall below 30. In addition,
the non-confirmatiion Sells it offered failed until August.
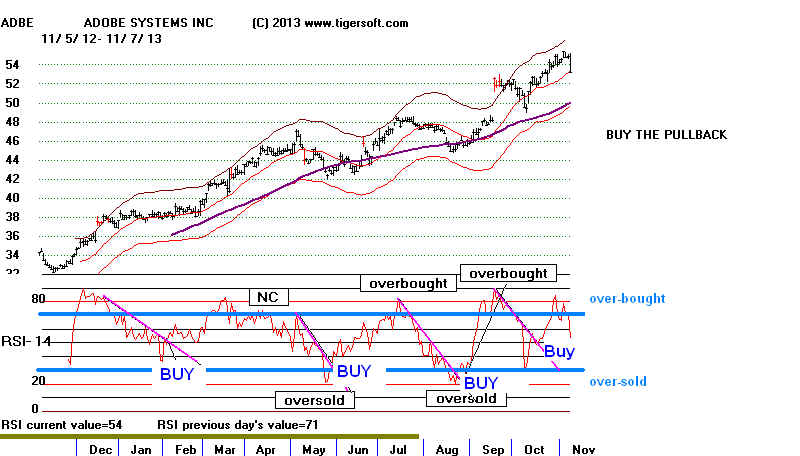
See ADBE's 2013 chart below.
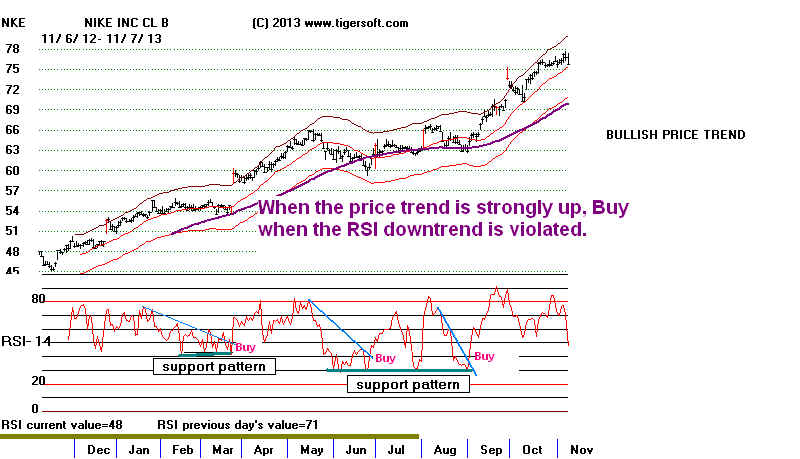
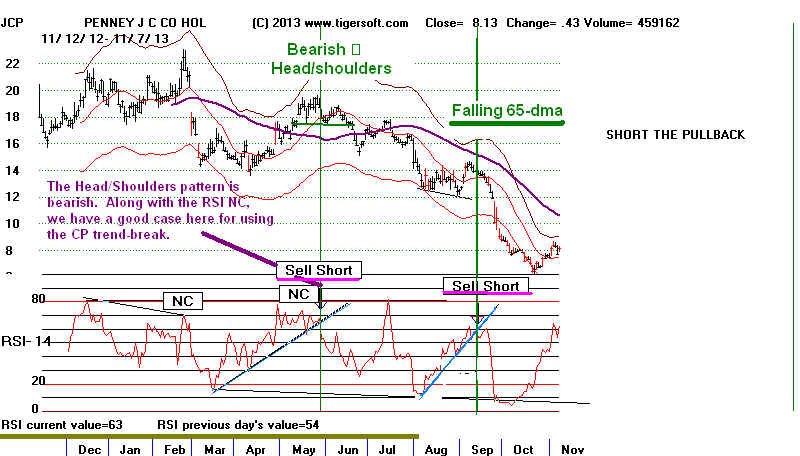
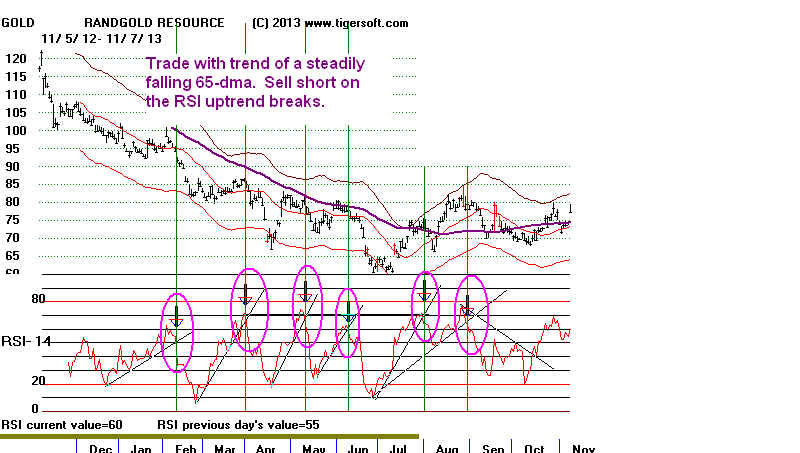
Instead trade the trend-breaks of the RSI downtrends when a stock shows a rising
65-dma.
Commonly, traders also derive signals from its divergences, crosses above and below 50 and also
by its failures to produce expected rallies. Tiger users should know that we also watch for
RSI divergences from price, particularly non-confirmations of new price highs and lows. In
addition, we the technical patterns of RSI itself, most often mostly trading with the trend of
the 65-dma.
RSI Divergences from Price.
Unconfirmed Highs and Lows (NC)
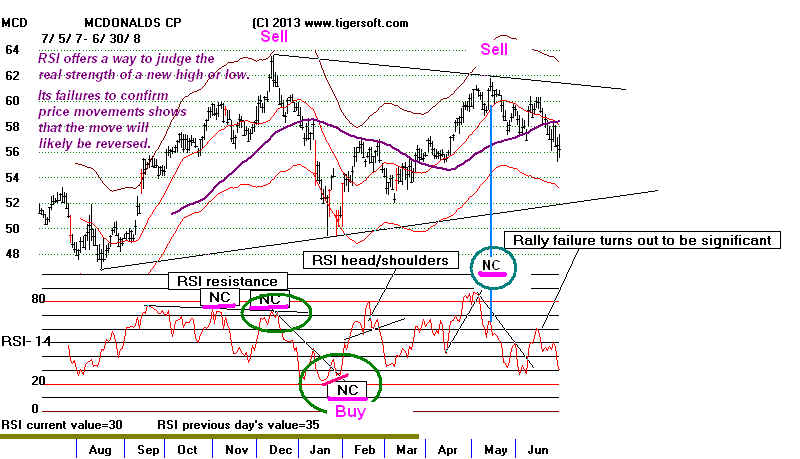
.In the MCD chart below, you can see that MCD reached overbought status using our price
bands. At the same time, the RSI failed to make a new high it it own right. At the upper band
this is a significant non-confirmation (NC) and might have been used to sell short. See how
the RSI itself showed its own flat and well-tested resistance line here. Priced soon fell back
below the lower band. The RSI failed to confirm the final low on this decline at 51. One
might have used the break in the RSI down-trend to cover and even go long. The May 2009
minor new high above its level a week before was widely not-confirmed by the RSI. You will
see Non-cofirmations (NC) by the RSI marked on a number of the charts on this page.