TIGERSOFT and Stochastic Indicators
(c) 2013 www.tigersoft.com All rights
strictly reserve
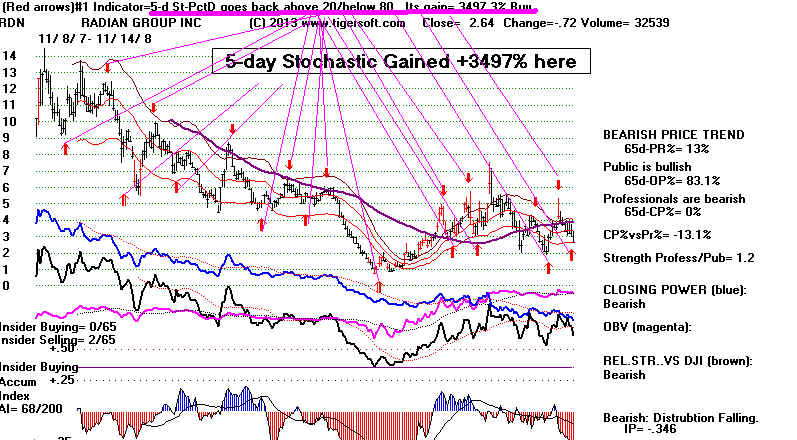
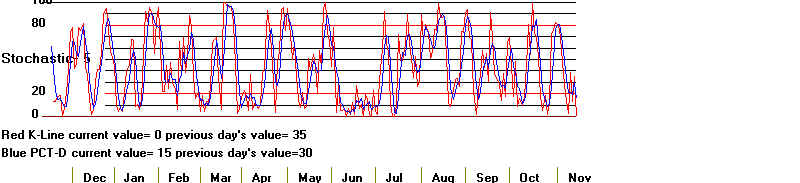
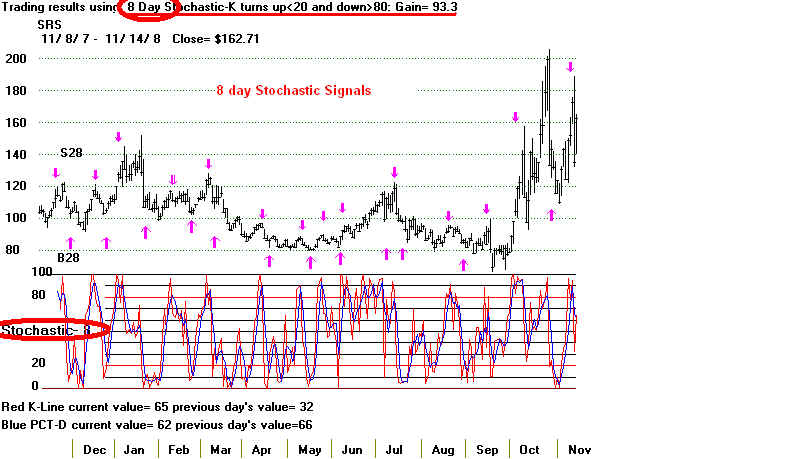
Stochastic oscillators show how far a stock is
between its, say, 20-day low and
20-day high. This is the fast-(red) K-Line.

If the stock's range for the last 20 days is 15 to 20, and the stock
is at 19, then the K-Stochastic's value is 80. At 16, the K-Stochastic
value here would be 20.
We smooth the K-Line with a 3-day mvg.avg and get the blue "slow" stochastic.
Selling Options Is An Option.
Many times a stock is stuck in neutral. Using the red
automatic signals based on short
term stochastics can turn this situation around and make it profitable. Options
could
be written very profitably here. Sometimes, it is more profitable to trade on the next
day's
opening can actually be more profitable. That was true below by 5%. In this
situation, there
was no paper loss bigger than 9.8%. There were 21 qinning trades and 7 losses.
Trading a Trading Range Stock
DUST Case Study
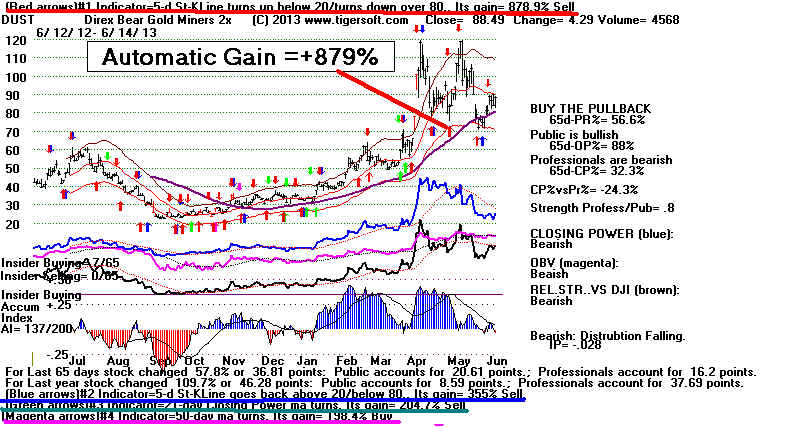
With the leveraged ETF DUST (short on mining stocks), a simple 5-day Stochastic system
all by itself gained 872.7%. Using the next day's opening to trade would have gained
+804%. There would have been 25 winning trades and 13 losing trades.
Unfortunately,
the biggest paper losses were very sizeable: 37.6% on long trades and 32.2%
on short trades. It is necessary to understand the limitations as well as the
strengths of TigerSoft's aututmatic Buys and Sells. There are many steps
Tiger users can take to avoid such big paper losses. This study shows
how find these very profitable trading situations and also how to limit paper losses.
Detailed DUST Case Study
http://tigersoft.com/Automatic-Signals/DUST-CaseStudy/index.htm
The Best of The Best
When a frequency
distribution is done of the various best Tiger automatic systems, we
consistently find that 5-day Stochastics generally occur 3 times more than chance
would
allow. With NASDAQ-100 stocks 29% of all the stocks trade best with one of the 5
different 5-day Stochastics. Among the Stochastic systems, two occur more than
4x more
than chance would suggest. See the separate study of The Frequency of the
5-day Stochastics
Being The Best Trading Systen from 1990-2013. It reaches the same
conclusion but it does show there is considerable variation in their frequencies
from year to year. Even so these 2 Stochastic-5 systems still out performed chance
in
the worst years, 1995-1999, 2003 and 2008-2009.
See http://www.tigersoft.com/Automatic-Signals/IntroAS.htm
Our
optimized signals readily tell you which length stochastic, a 5-day, 14-day,
20-day, 50-day or 90-day Stochastic works best given the data
you are looking
at
for the last year. As long as, prices do not abruptly change their behavior,
this
gives you knowledge you can use which otherwise would take a long time
to
discover by your own testing. TigerSoft in this way also tells yoo whether you
will
want to use a simple crossing of 20 and 80 for buys and sells, respectively, or
that
you will want to use a turning up below 20 or a turning down above 80 or
that
you shuld probably use the K-Line crossing the Pct-D. If you prefer,
a
different length Stochastic, clear the signals using
PEERCOMM + Charts-2013 + Daily Stocks + Symbol
+ Operations + Restore Simple Bar CHart +
Signals
(2) + Stochastic + 8 (for example)
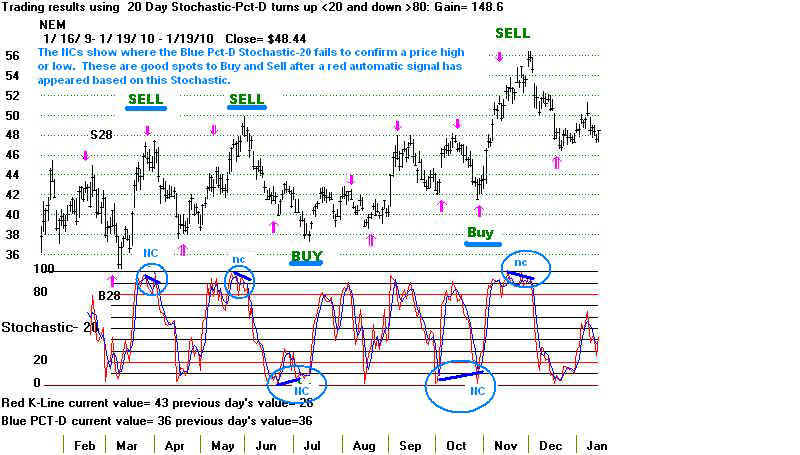
You
can improve your trading's results by waiting for the Stochastic to fail to confirm
a
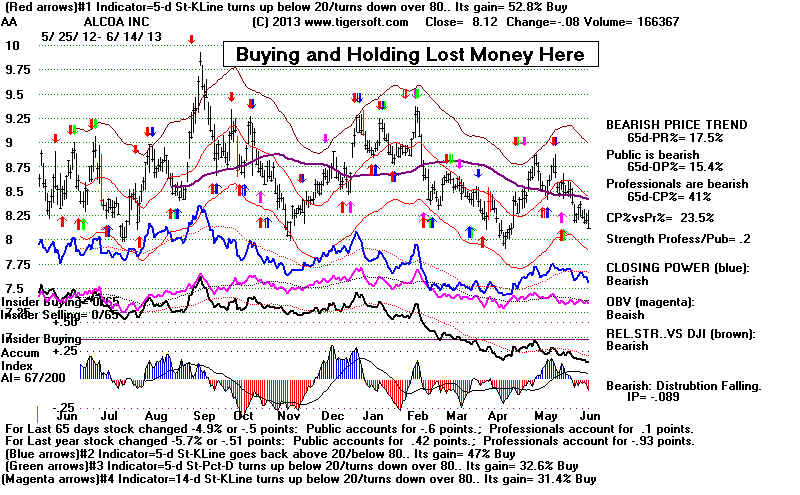
price high or low. In the chart below, we see that the blue Stochastic is the best
trading system. Instead of taking all the automatic red signals, one might want to
be more
selective and buy or sell short when the blue Stochastic fails to make a confirming
price
high or low.
Stochastic Buys and Sells only work periodically. We can study the
Stochastic-5's
success over time and see this. Thus, only in 6 of the 20 years since 1993 was the
Stochastic-5-K-line the best of the 50-60 different trading systems that TigerSoft
automatically searches through as it puts a graph on your computer.
See http://www.tigersoft.com/Automatic-Signals/SPY-1993-2013/Index.html
As we have seen in the discussion of Overbought and OverSold conditions, a number
of factors help us know when a Stochastic buy signal will likely work and when it is
more likely to succeed. Stochastic's should not be used to fight strong
momentum,
fresh price breakouts/breakdowns, head/shoulders patterns, price gaps on high
volume.
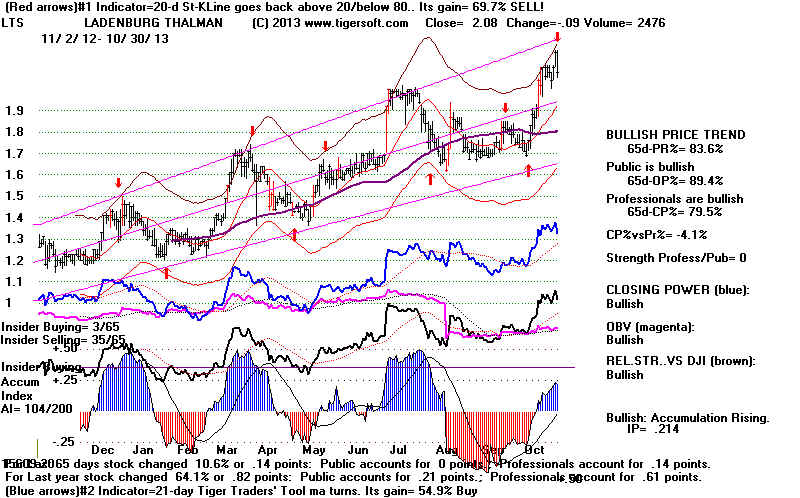
Consider the case of LTS below. Shorting it because of the new red Stochastic Sell
signal
is not consistent with what is recommended here. The momentum is too strong.
The Accumulation Index is positive, rising and shows previous bulges at 3-4 months
intervals. Someone thinks enough of this stock to buy it regularly. They
probably
intend to push it higher because they know a bullish story is going to be released
at higher prices. It is just below the top of its price channel, but breakouts above
the top of a price channel are common late in a bull market. And the stock is
thinly traded. These are the type of stocks market makers love to push up if
you take short position that they can run in. Sure enough, on 11/6/2013 the stock
jumps up to 257 intra-day, making a short sale at 2.00 problematic.
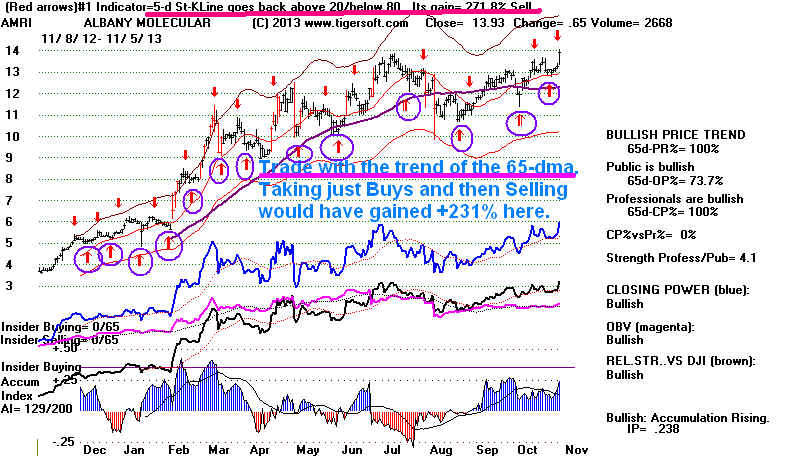
We can list factors that will help make a Stochastic work:
Use the Stochastic Buys when:
1) the stock is in an uptrend based on the direction of the 65-dma,
2) the stock is at support in a trading range,
3) the stock shows heavy blue Accumulation.
4) the stock's Closing Power is behaving more strongly than prices.
5) Peerless is on a general market Buy signal,
6) Seasonality is Bullish,
7) the Stochastic Indicator itself fails to confirm a price
low.
8) the Optimized Stochastic is a 5-day K-Line.
Use the Stochastic Sells when:
1) the stock is in a price downtrend based on the direction of the 65-dma,
2) the stock is at resistance in a trading range,
3) the stock shows heavy red Distribution.
4) the stock's Closing Power is behaving more weakly than prices.
5) Peerless is on a general market Sell signal,
6) Seasonality is Bearish,
7) the Stochastic Indicator itself fails to confirm a price
high,.
8) the Optimized Stochastic is a 5-day K-Line.
Traders, Use The 5-Day Stochastic
Our studies repeatedly show that the most commonly occurring best mechanical
Tiger system out of the 50-60 that TigerSoft automatically examines as you
place a chart on the screen, are the ones based on the red 5-day Stochastic,
especially the K-Line. We like the 5-day Stochastic so much that we build a
directory of stocks each night to download where the Stochastic-5 is the best
trading system. If you then run the Folder Optimization Program
Peercomm + Older Charting + Run/Setups + Run Best Indicators
All Stocks + Y
Then find the very best stocks traded with the 5-day stochastic by using:
Peercomm + Charts-2013 + Tiger Selection + #1 Indicators' Results/Status
A display appears which shows you the stocks most profitably traded with a
Stochastic-5. It looks like this:
Stock Best Performing Indicator
Gain Status Close Chnage AI/200 IP21
IPvsTISI
(yearly)
-----------------------------------------------------------------------------------------------------------------------------------
ACAT 5-day St.KLine turns up below 20/ 172.6% Sell
52.23 -1.49 154
,297 AR
turns down below 80
ACOR 5-day Pct-D turns up below 20/
172.6% Buy 32.6
.269 139
-.129 AF
turns down below 80
AMRI 5-day St.KLine turns up below 20/ 282.5% Sell
13.93 .65
129 ,239 AR
turns down below 80
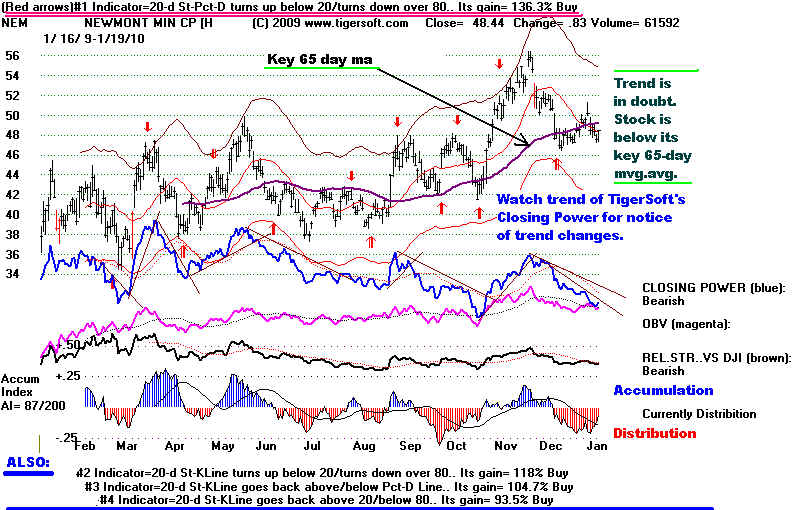
We often use a trendbreak in our Tiger Closing Power to "clinch" a Stochastic
Buy or Sell. In the chart below a red down arrow appears in November. Instead
of taking that as an immediate point to go short, especially with the 65-dma rising,
we suggest waiting for the blue TigerSoft Closing Power to break its uptrend.
Additional TigerSoft studies of Stochastics:
www.tigersoftware.com/TigerBlogs/1-20-2010/index.html
http://www.tigersoft.com/Automatic-Signals/IntroAS.htm