SPY: 1993-2013
You can see that the Stochastic-5-day K Line was only the basis of the best
or second best trading system in 6 of the 20 years studied:
1993, 1997, 1999, 2009, 2012 amd 2013.
Each was a rising market.
The Stochastic-14-day K Line was the basis of the best
or second best trading system in 1996, 2000 and 2011.
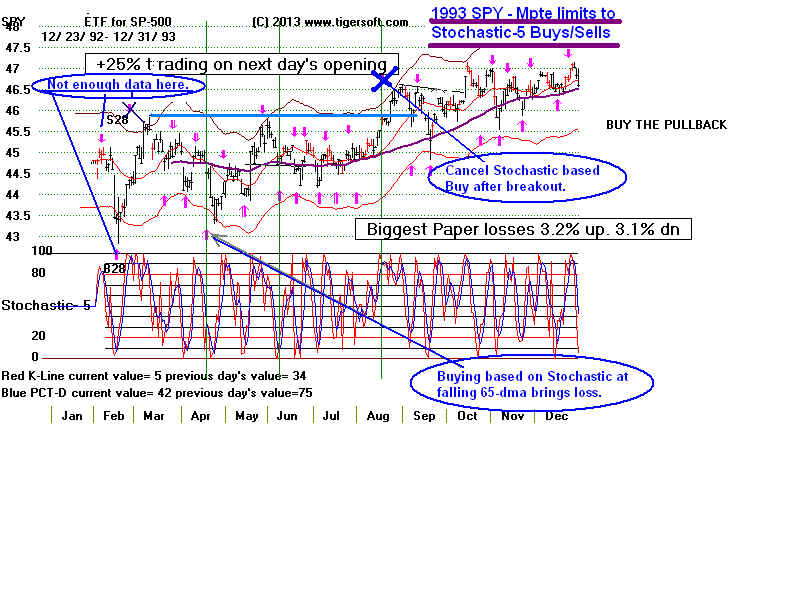
1993  #1 Stoch-5day KLine turns up/down
      $2 Stoch-5day KLine crosses Pct-D
      65-day IPA turns - Up whole year.  Very good.
---------------------------------------------------------------------------
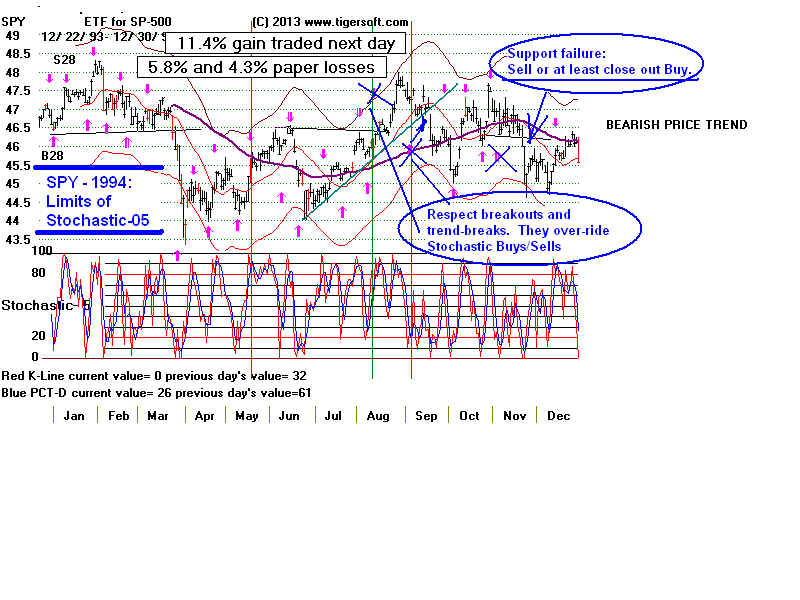
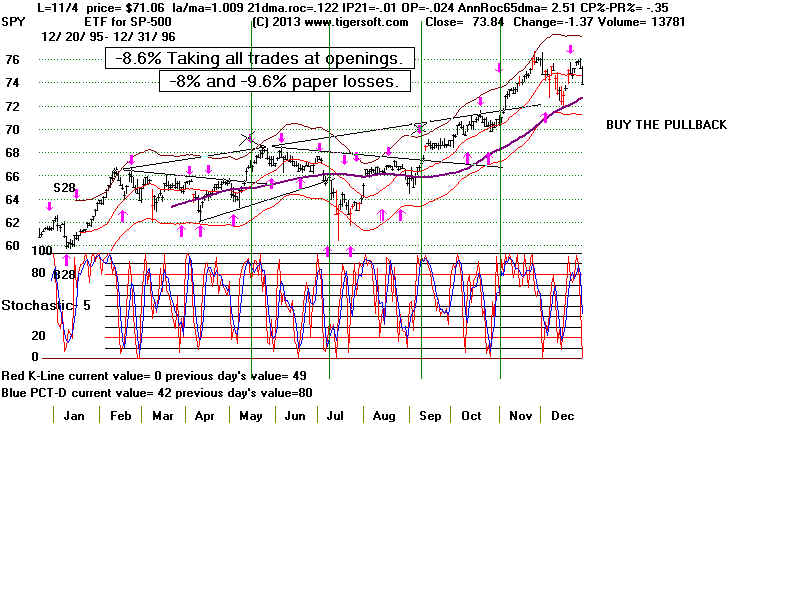
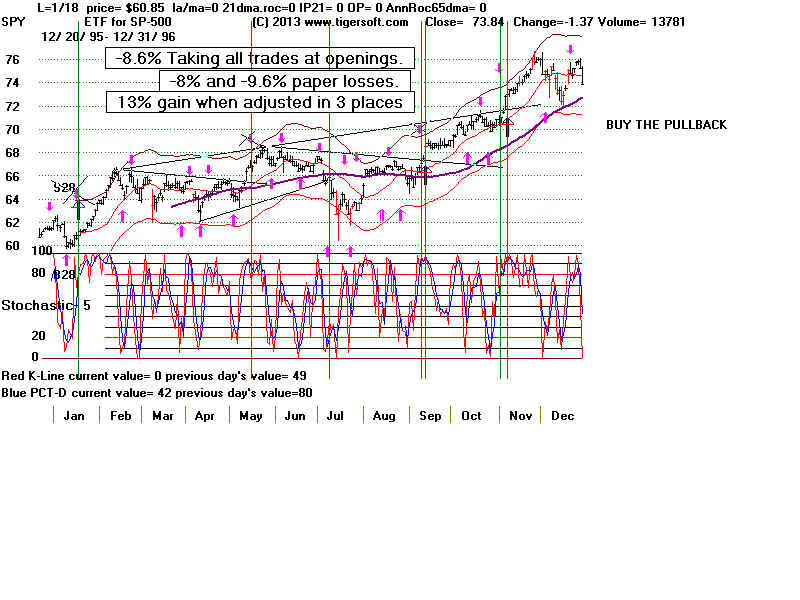
1994  #1 Stoch-5day Kline turns up/down
      #2 Stoch-50day-Kline crosses up past 20/down below 80
----------------------------------------------------------------------------
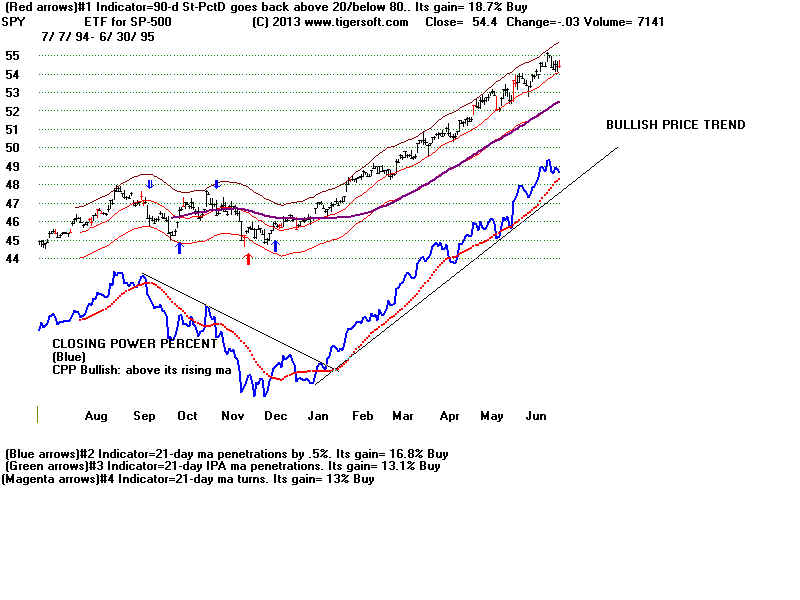
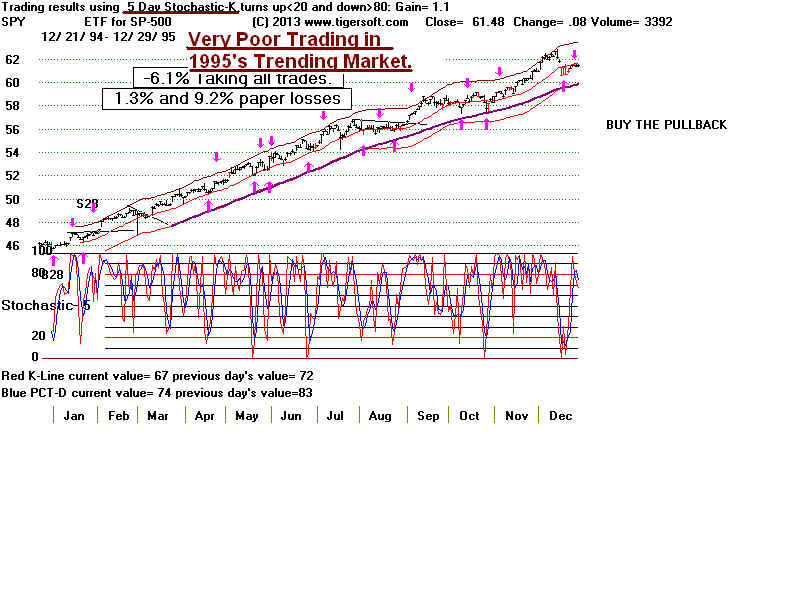
1995  #1        IPA -50-day ma turns        23.5%
      #2        IPA 21-day ma penetrations  12.4%
----------------------------------------------------------------------------
1996  #1        50-day OBV ma turns 26.7%
      #2 Stoch-14-KLine crosses Pct-D  21.1%
----------------------------------------------------------------------------
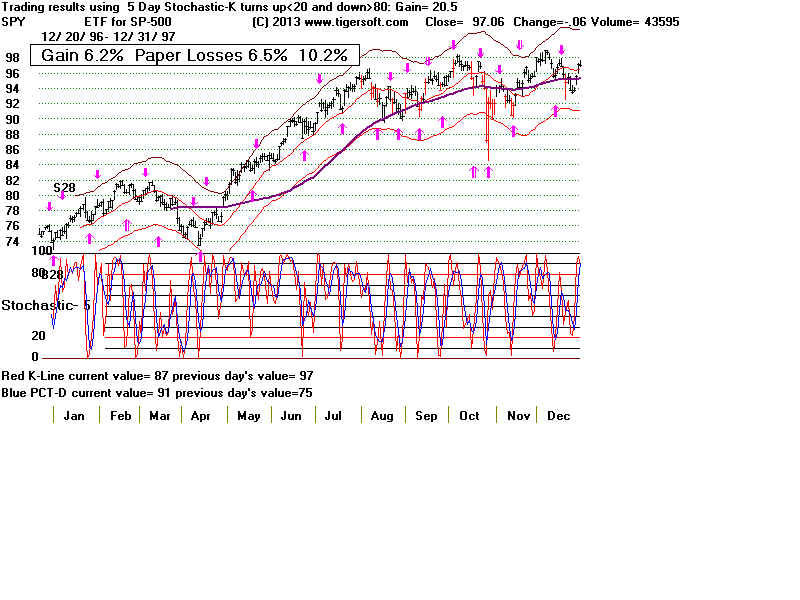
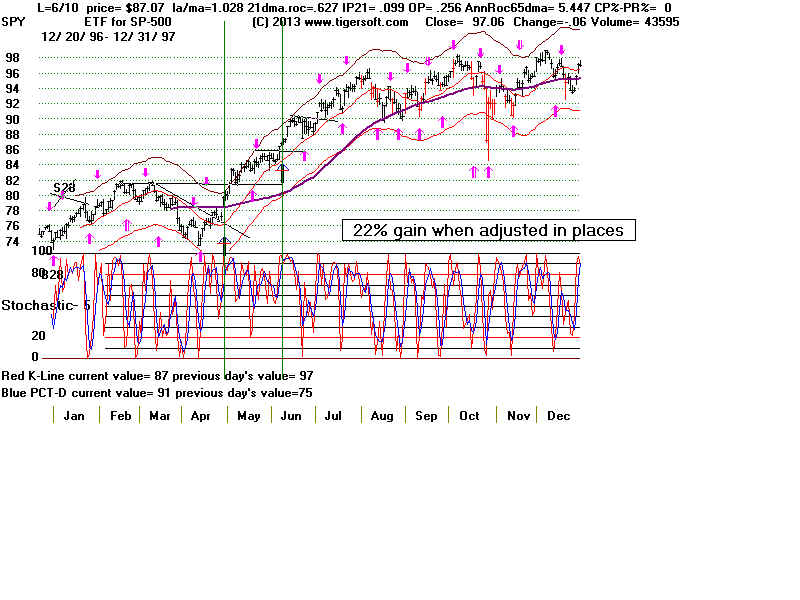
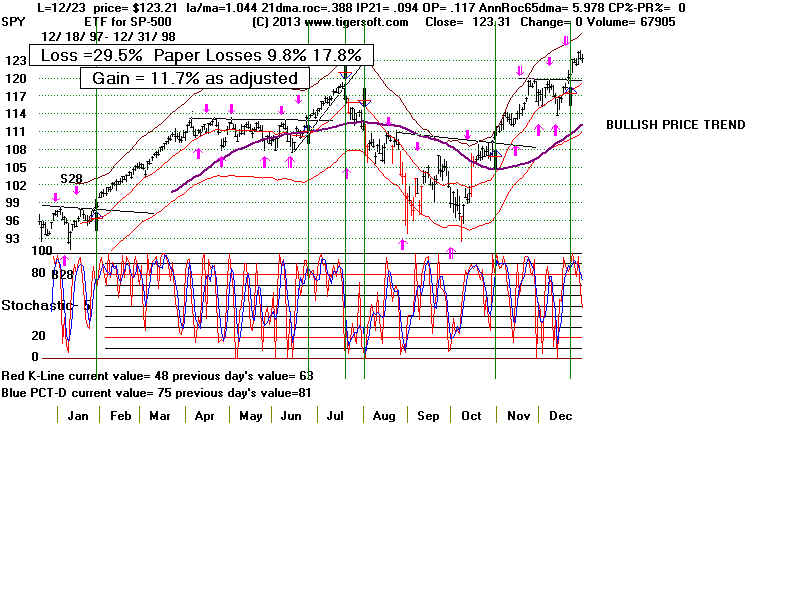
1997  #1 Stoch-50day-KLine up past 20/down below 80 19.7%
      #2 Stoch-5day-Kline up past 20/down below 80 19.7%
----------------------------------------------------------------------------
1998  #1 Stoch-20-day-KLine up past 20/ down below 80  23.5%
      #2           Closing Power - 50-day A turns  13.2%
---------------------------------------------------------------------------
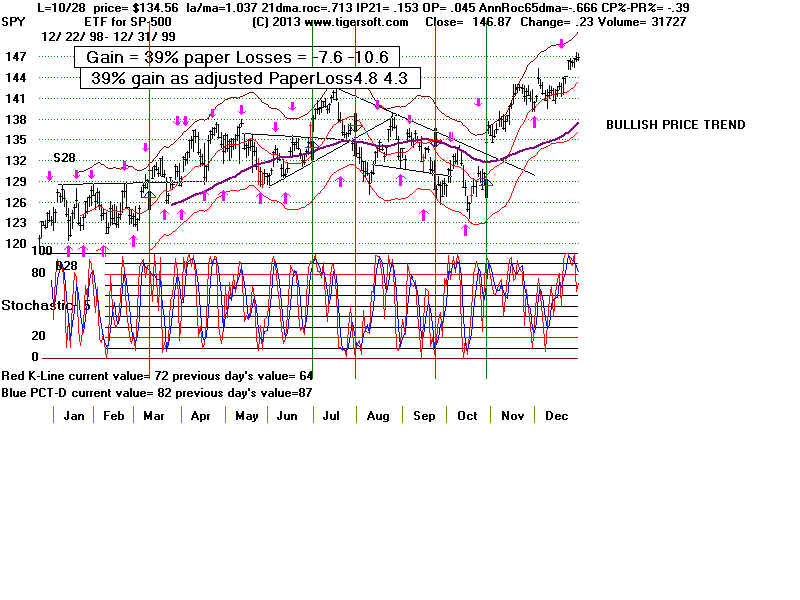
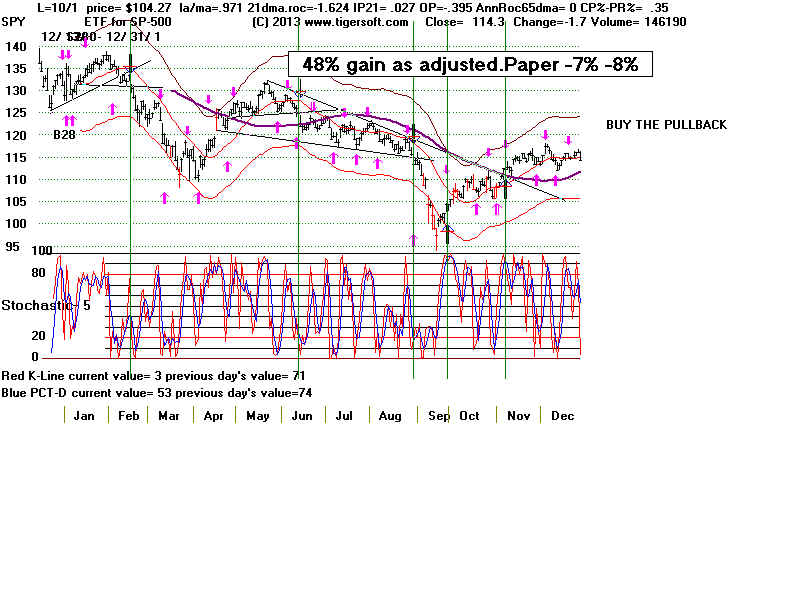
1999  #1 Stoch-5-day-KLine -turns up/down 35.1%
      #2 Stoch--20-day-KLine -turns up/down 28.6%
---------------------------------------------------------------------------
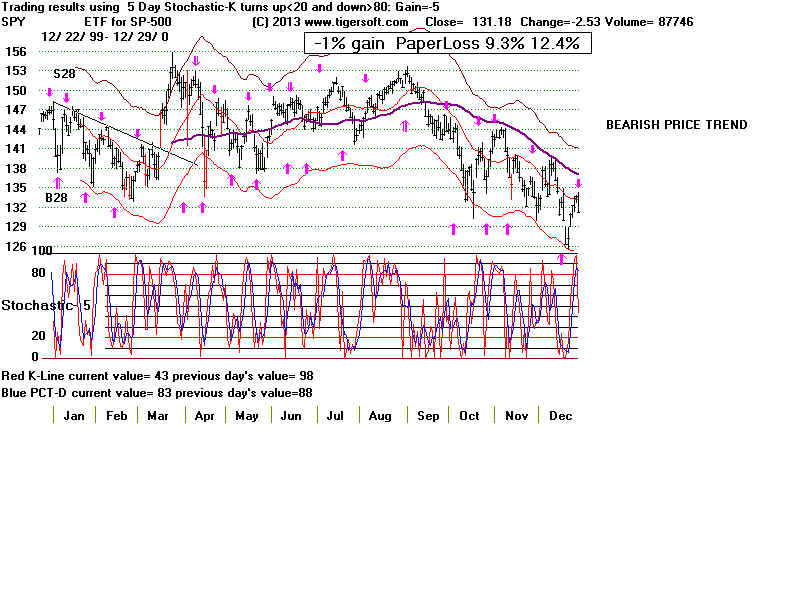
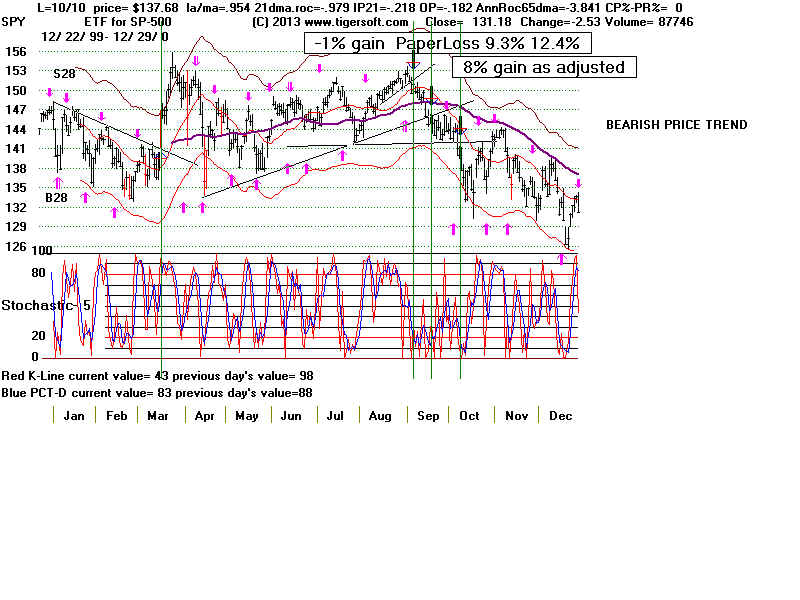
2000  #1 Stoch-20-day-KLine-turns up/down 32.6%
      #2 Stoch-14ay-Pct-D -up past 20/falls below 80 26.4%
---------------------------------------------------------------------------
2001           #1 Closing Power 21-day MA pentr.  27.2%
               #2 Price 21-dma penetr  20.9%
---------------------------------------------------------------------------
2002  #1 RSQ 50-day ma turns  29%
               #2 Price-21-day ma turns  11.6%
---------------------------------------------------------------------------
2003  #1 Price-50-day ma turns 22.5%
               #2 IPA 50-day ma turns 16.5%
---------------------------------------------------------------------------

2009  #1 Stoch-5 day-Pct-D goes back 20/below 80  20.0%
               #2 Tiger Trading Tool 21-day ma penetr  19.3%
---------------------------------------------------------------------------
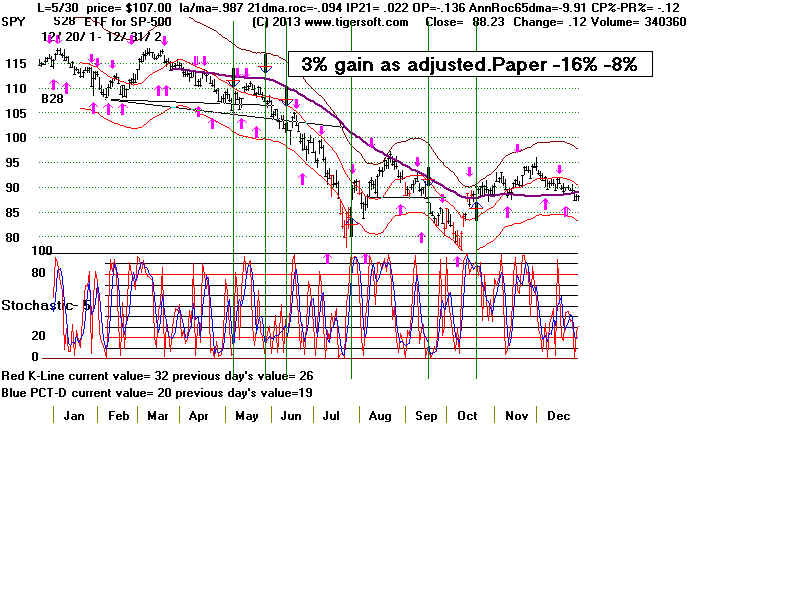
2010  #1 Stoch-20-day-Pct-D turns up/down 23.3%
      #2 Stoch-20-day-Pct-D crosses back avove 20/ falls below 80  20.8%
---------------------------------------------------------------------------
2011 #1 Stoch-14-day KLine crosses Pct-D Line 27.6%
#2 Stoch-90-day Pct-D-goes back above 20/falls below 80 26.1%
---------------------------------------------------------------------------
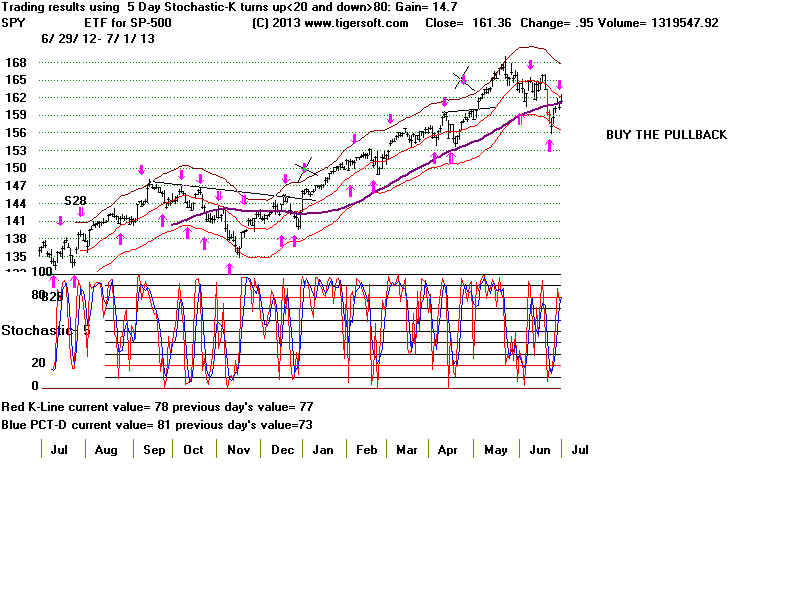
2012 #1 Stoch-90-day K-Line goes back above 20/falls below 80 26.1%
#2 Stoch-5-day K-Line goes back above Pct-D/falls below it 19.9%
------------------------------------------------------------------------------
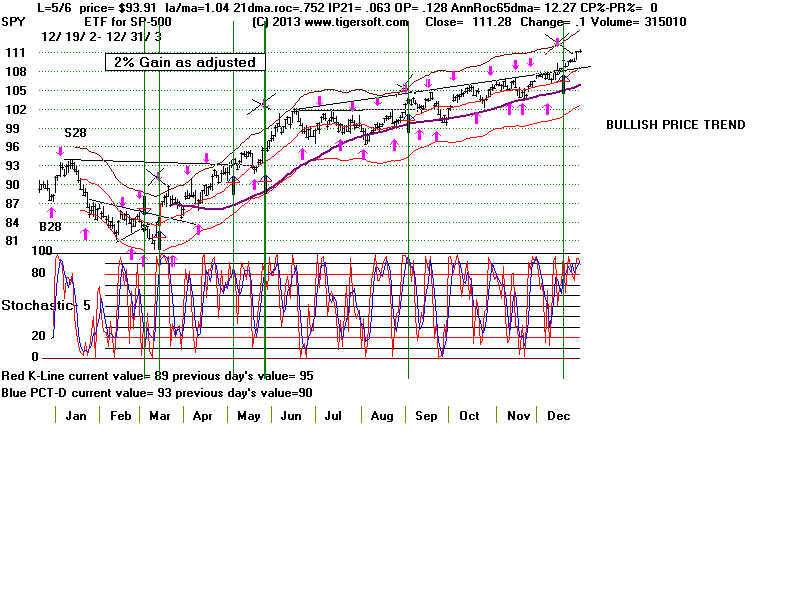
2013 #1 IPA MA turns 18.6%
#2 Stoch-5-day K-Line goes back above Pct-D/falls below it 17.2%
------------------------------------------------------------------------------
---------------------------------------------------------------------------