12/2/2007 Summary Peerless Buy B19.  Trading Range Dynamics Dominate.
                     
Rallies Show Trading Range Dynamics, And Is Similar to 1956 and 1986  

                     SAMPLE TIGERSOFT HOTLINE - TO SUBSCRIBE TO THIS HOTLINE FOR A YEAR,
                                                                      Click HERE. 
wpe25.jpg (58023 bytes)


   TigerSoft  & Peerless
        Nightly Hotline
        ===== 
SAMPLE =====
        (C) 2007 William Schmidt, Ph.D 

             Book-Mark This Address  
    
              12/2/2007

     Trading Guidance:      

      
Peerless Stock Market Timing: 1928-1966     
       Track Record of Major Peerless Signals
       Earlier Peerless-DJIA charts
       7 Paths To Making 25+%/Yr. Using TigerSoft 

       Index Options
       FOREX trading
       Investing Longer-Term
       Mutual Funds
       Speculative Stocks
       Swing Trading

    
  Day Trading.
       Stock Options
       Commodity Trading


   Daily Tiger-Blog: Stocks, Humor and Political Economy Insights that you will not get from the mainstream Media / These are designed to let you see the "Larger Picture."  
        ====== 12/2/2007 - TigerSoft and Peerless Daily Hotline. ============

               This shows the approach our Hotline takes and we suggest for traders and investors

            First, we look at the Peerless DJI chart with signals and key indicators.  We take into account the
            price patterns and try to anticipate future support and resistannce.  Historic parallels are considered.
            We always watch key commodities and leading indicators for the technology sector.  Lastly,
            my background is in political ecoomy, so I try to incorporate macro-economic trends that also
            appear in the Tiger Blog.

            The last Peerless signals are buys  preparatory to the usually bullish December seasonality. 
            However, the DJI's price pattern suggests lots of selling awaits any move to 13800-14000, because
            of the potential head and shoulders pattern a top there would mean if we take 12700 as the
            neckline-support in such a pattern.  The Peerless Indicator is still quite negative.  A rally to the
            upper band with it negative will likely bring a major Sell, even though December is normally bearish.
            The first 3-6 months of a Presidential Election year (2008) often bring substantial declines
            (1916, 1920, 1924, 1932, 1940, 1948, 1952, 1960, 1968, 1980, 1984, 2000 and 2004).  There were
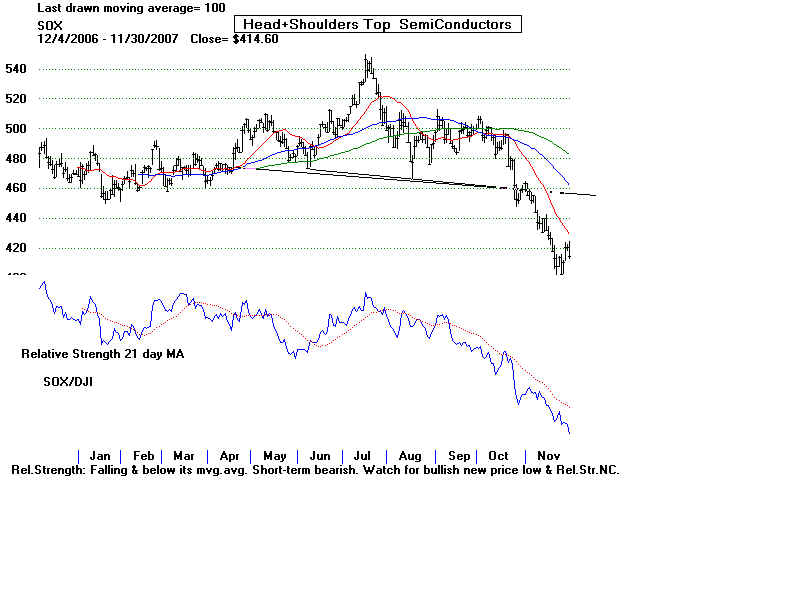
            13 such cases and 11 exceptions.since 1916. Financial stocks and semi-conductor stocks have turned
            very weak.  Oil stocks and Gold are strong.  The consumer is will be pressed hard if oil prices keep rising.
            And the Semi-Conductor Index's weakness is telegraphing a warning for the NASDAQ and QQQQ. 
            The maldistribution of wealth in the US now resembles 1928.  The first few months of next year
            are apt to be difficult because of the bearish seasonality for the first 3-6 months of a Presidential
            Election year...

           
               ------------------------------------- DJI-30 ------------------------------------------------------------
DATA0712.BMP (1440054 bytes)


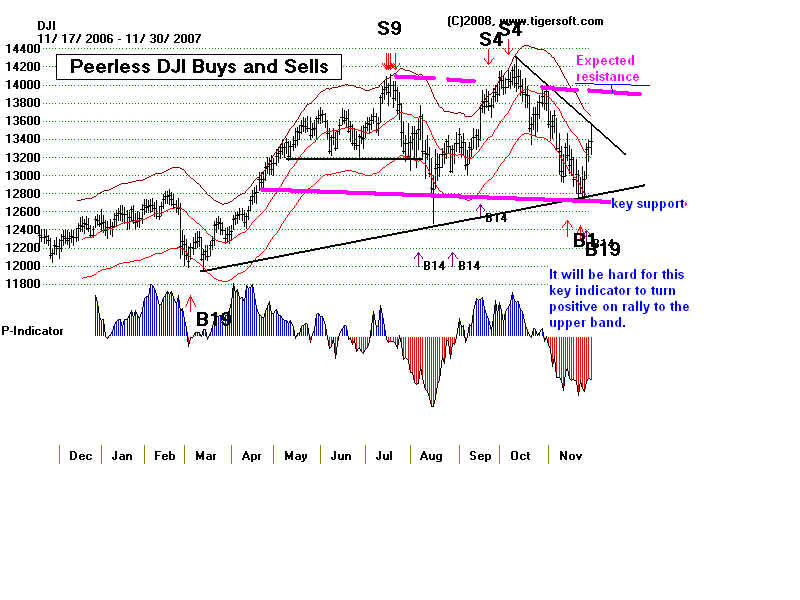
               12/1/07 - The DJI appears to have tested the 12700-12800 level successfully.
           The A/D Line did confirm the new low of 11/15 but (red) NYSE Down Volume did not by
           a wide margin.  Now breadth is improving.  The NYSE A/D Line downtrend has been broken.
           So the Buy B19 looks good and Buy B19s have a great track record.  They work 95%
           of the time.  For these signals, the average gain is 9.4% on the DJI at the time of the next
           major Peerless Sell Signal from 1965 and 2005.   There have been two additional B19s since. 
           They were both profitable.    The reversing Buy B19 on 3/6/2007 gained 14.4%. 

                         I have emphasized the importance of seeing the market now as being
           dominated by (1) trading range dynamics, (2) the Fed's desire to prop up the market
           until after the next election with interest rate cuts, (3) the foreign markets' strength
           as being the locomotives for this very long bull market.  The longer term problem and
           and counter force posed by the Dollar's weakness, (4) Decembers are usually
           bullish, especially after the middle of the month.

                        1) Trading Range Dynamics

                       
Having successfully tested the lows of a wide trading range, prices usually move back
           up very easily to the top of the trading range.   In our case, that means a move back up to
           13,900-14,000, perhaps after some chewing up of the resistance at 13600.  The DJI is now just
           below 13,400.  I suggest looking at the charts for 1956 and 1986 to see fine examples of trading ranges
           that the DJI has entered every 30 years since 1956.  See website's blog for 10/21/07.

                          http://www.tigersoft.com/Tiger-Blogs/10-20-2007/index.htm

                     
2) The Fed's Propping Up the Market until after the next Presidential Election.
           It is extremely difficult to be too cynical regarding the Fed when you see how much
           pressure is put on them by politicians and how their actions tend to favor the
           political party that appointed the Fed Chairman.  My website's blog for 8/19/2007

                          http://www.tigersoft.com/Tiger-Blogs/8-18-2003/index.htm     
          
shows these.  If I am right, the Fed will lower rates until perhaps the middle of next year.
           In this way they can show homeowners and the housing industry they care.  And they
           will avoid being controversial.  In doing this, they risk weakening the dollar much more.
           Hot international money goes where the interest rates are highest.  So we have to watch
           the US Dollar closely.    The US Government routinely understates the level of inflation.

                       See http://www.tigersoft.com/Tiger-Blogs/11-19--2007/index.html
          
So, they must believe that whatever are the inflationary consequences of a lower dollar,
           these can be hidden.    That remains to be seen, because OPEC has its own point of view and
           has tended to raise Oil Prices as the Dollar goes down.  These pressures have become a vicious
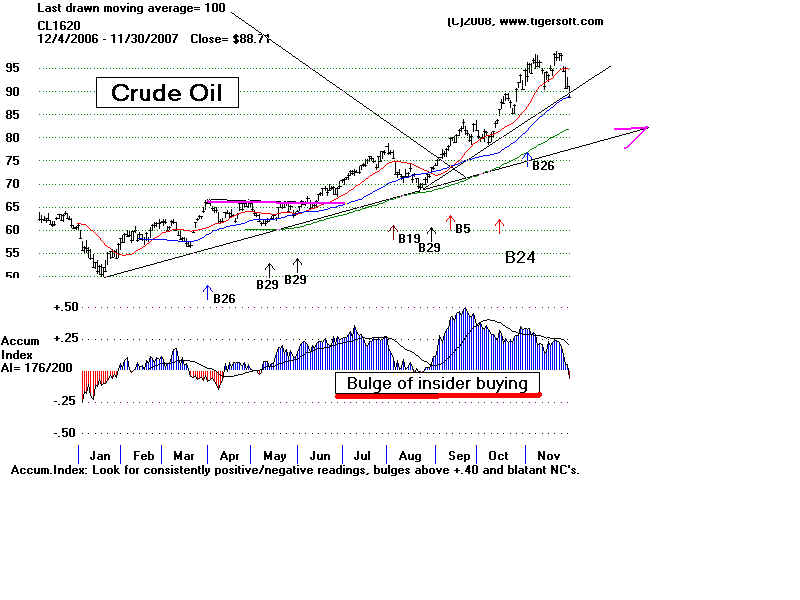
           circle.  So we will watch the Dollar and Oil prices.  Presently, there is the beginnings of a rally in the
           Dollar because Crude Oil is falling back from the $100 bar. resistance.  That is favorable for
           a continuation of the present genral market rally for now.  See the charts of the US Dollar,
           Oil and Gold below.


3)   We must recognize that the US stock market is now dependent upon the world
           bull market, because overseas' sources supply the profits of the many US multinationals
           that populate the indexes we watch, the the DJI-30 or the SP-500.  We must watch the overseas
           market because if these bull market end, the Chinese and others will be much less able to
           keep buying US treasury bills.  That would probably put much more pressure on the US Treasury
           to raise interest rates exactly at a time the US economy is turning down sharply.  The last few days
           have seen strong recoveries in most overseas ETFs.  The biggest gains were in China (PGJ),
           Chile (CH), IFN (India).    These are each  up more than 10% since our Buy signal a week ago.
           The gains in Brazil and Mexico were a more modest 4%.  The UK, France, Spain and Europe, in general
           were the weakest. 

                       What the US will have to do to keep propping up the US markets and the dollar,
           in the absence of any radical change in the lopsided ratio of the imports to exports, is to borrow
           more money and sell off its assets.  This will end badly when the US has no more valuable
           assets to sell off or when foreigners stop making loans to the US.  In Argentina, this condition
           lasted for mosth of the 1990s before its economy turned down and went into a four year
           recession before its Peso had to be dramatically revalued, causing 40% unemployment and
           a fire-sale in its very depressed equities' market.   The Chinese are learning to playing the role that
           the IMF has been playing with countries like Argentina for years.  This is the role of the casino
           that keeps providing chips to a losing player until finally they get all his money.  See my blog about

          
the Argentine financial collapse of 2002 and what we in the US can learn from it:
                   http://www.tigersoft.com/Tiger-Blogs/11-29-2007/index.html     

                  
Though the Chinese market is over-extended by most reckoning and shows dangerously
          heavy red distribution for most of the last year's trading, it is destroying the recent bearish-looking
          head and shoulders pattern.    And that buys time.  As long as the pattern's neckline (shown below)
          is not violated, all is probably well, at least until the Chinese summer olympics are over and the Chinese
          government may no longer trying to be putting up such a good face.  See my blog about China
          on November 27.
   http://www.tigersoft.com/Tiger-Blogs/11-27-2007/index.html

                  
Watch for the Tiger Index of Chinese stocks to make another new high.    I would then expect
         resistance and the selling there to overcome the rally.  That is usually what happens after a rally
         takes place above the apex in a head and shoulders pattern,  Note that at the last top in the Chinese
         market, the Cumulative Advance-Decline Line for these 63 Chinese stocks failed to confirm a new
         price high by the index.  Such A.D Line non-confirmations are valuable market timing tools.  You
         can see this in the DJI-30 in July and the London FTSE recently.

                   The All-Foreign ETFs chart, as produced by TigerSift, shows an excellent advance since the
          Peerless DJI major Buy B19, but it is not yet above the apex of its right shoulder.  It still cannot
          be classified as a bullish looking chart pattern.  Weakness in European stocks seems to be the
          problem.  And that is directly related to a widespread lack of confidence in bank and home loans.
    
         
          =============================== DOLLAR =====================================
                        
After falling 19% for the past year, the Dollar has moved above its 21 day mvg,
            avg.  Looking back this past year, we see that these rallies have tended to be brief.  In fact.
            selling the dollar short each time it goes back below the black 21-day ma by, say .5%,
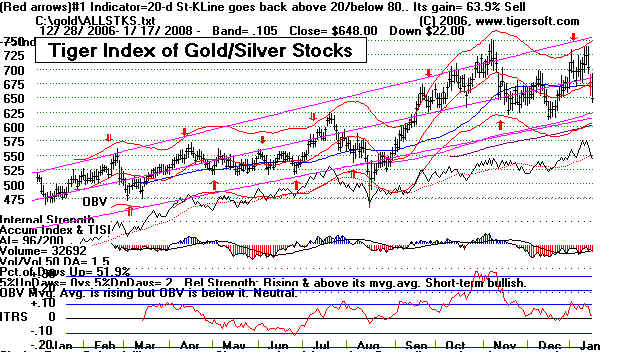
            would have been an excellent way to make FOREX trades or just Buy Gold or Gold Stocks.
            See the blog I have written about this:
  http://www.tigersoft.com/Tiger-Blogs/11-28-2007/index.htm             =
           
.         
            ========================== SILVER ===============================

                               
Silver failed to make a breakout run upon moving over 147 a month ago.    That
              was a surprise.  But realities are what we must face.  It had made nice runs in the past, as you
              can see in the Blog for 11/2, soon after earlier breakouts.

                               http://www.tigersoft.com/Tiger-Blogs/11-2-2007/index.html
             
But not all breakouts work and we have to decide if we want to stay in a stock, commodity
              or currency that makes a "fakse breakout."  False breakouts are often dangerous.

                               http://www.tigersoft.com/Tiger-Blogs/11-15-2007/index.html   
             
Traders are well advised to respect them, even when it produces a small loss,  and get out
              of whatever it is that fails the breakout.  Failed breakouts too often bring beg drops.
              In this case, the dollar's long-term trend still looks very bearish.  And I keep remembering
              how silver rose from $15/ounce to $40/ounce in weeks.  So, I am inclined to hold all the
              precious metals' positions we have.  
                             There is another force operating many of the Peruvian and Bolivian silver miners
              are demanding much better pay and  work conditions.  The re-election for life of Chavez
              is going to create more labor pressures on mining companies, even those that are Canadian
              and not US owned.
  Silver production may be restricted in the future.  That would be bullish
              for the metals.

               
           --------------------------------------------- NASDAQ -----------------------------------------------------------------------

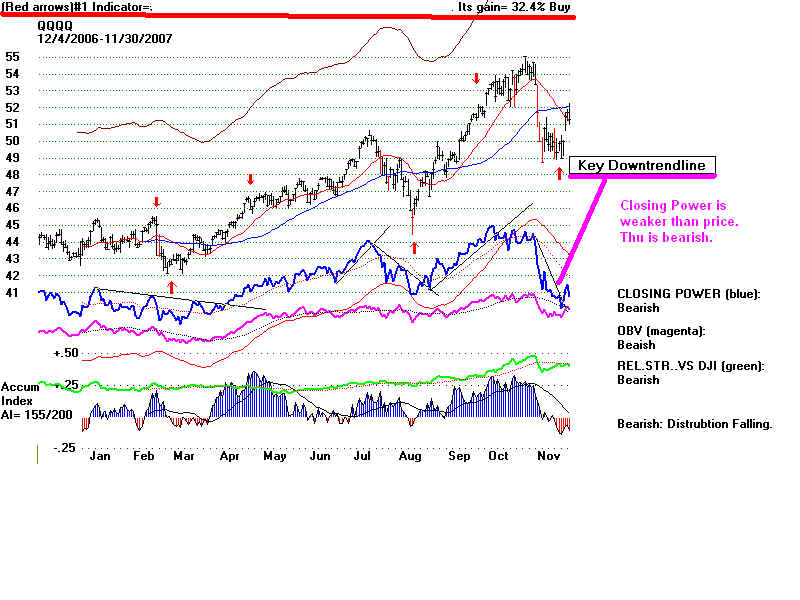
                                   The NASDAQ has almost reached the resistance of its 50-day ma.  It is on its own
              Buy B8.    The NASDJI (relative strength) Indicator is weakening.  The Accumulation Index
              is negative still.  Tech stocks usually do well from Novermber to April.  So, perhaps, any
              retreat may be simply a staging for an advance later.  I find the weakness after the opening
              in the chart of the QQQQ (Nasdaq-100) to be a warning, at least, for the present.  Many
              of the hottest NASDAQ-100 stocks like AAPL, GOOG and RIMM, have run up too fast
              and may retreat next week..    See how the QQQQ's Closing Power is bearishly lagging
              price.   And below that, note the profound weakness of the SOX - Semi-Conductor Index.               
         QQQQ.BMP (1440054 bytes) 
           ----------------------------------- Semi-Conductor Index (SOX) -------------------------------------
SOX.BMP (960054 bytes)
           
         =======================
CONCLUSIONS ================================     
           
                            There were 1350 more up than down on the NYSE.  In fact, for 4 of the last
           six days there have been more than 2200 daily NYSE advancers.  While this seems impressive.
           for the first time since 10/31/07, the number of NYSE new yearly highs exceeded new
           yearly lows.  For now , we will consider this a reflection of the pressures of tax selling,
           but it bears watching.   New lows should not exceed new highs so soon after the the DJI has made
           a new high, as happened this July.  That was definitely a warning.
                           
                           The market's rally will probably continue.  But I suspect it will be narrow.   Defensive
           and Biotech stocks will be favored. Tax loss selling will depress the weak stocks.  I doubt if
           the malaise in housing and home finance stocks will soon end.  Look at the steadily negative
           RED distribution in the Housing stocks.   The strongest stocks will probably stall out at their
           old highs.  That may change.  But that is the sense I get now.      

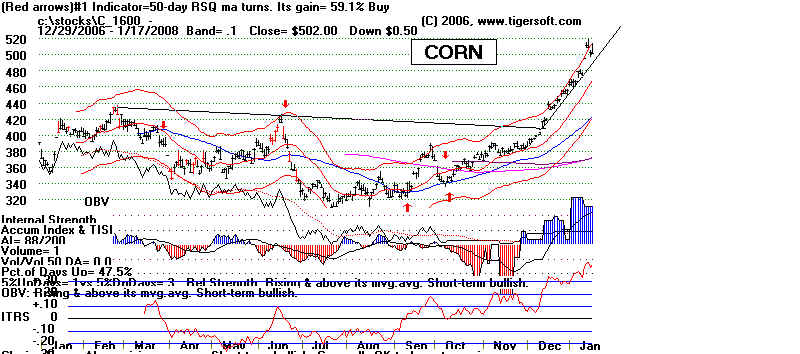
------------- Oil and Commodities are showing unusual Accumulation and Strength ----------------------

CL1620.BMP (1440054 bytes)
                               
wpe39.jpg (64674 bytes)  


                       Biotechs are stronger than the general market now.  That is partly a defensive play.
                   But is also may mean that they are coming out of the locust like 7 year phase
                   of quiescence and could start to become much stronger.  Our Stocks' Hotline
                   will look at these stocks closely this coming week.    


                         XBI below is making its own all-time (albeit only two year) new high.           
TOP 10 HOLDINGS ( 33.77% OF TOTAL ASSETS)
Company Symbol % Assets
ALEXION PHARM INC ALXN 3.27
ALKERMES INC ALKS 3.45
AMGEN AMGN 3.25
BIOMARIN PHARMACEU BMRN 3.45
CEPHEID INC CPHD 3.44
GILEAD SCIENCES GILD 3.24
MYRIAD GENETICS MYGN 3.58
ONYX PHARM INC ONXX 3.35
PDL BIOPHARMA INC PDLI 3.38
PHARMION CORP PHRM 3.3


            -------------------------- TigerSoft Oil/Gas Stocks ---------------------------------------------------
            wpe3B.jpg (61664 bytes)


        -----------------------------------------
FIDELITY SECTOR FUNDS --------------------------------------
                              Use this study to monitor ever-changing sector strength.
        
               21-Day   GAIN - 12/3/07

     Strongest                      Pct Change
       FDFAX Food                                           +1%
       FSHCX Medical                                      +1%
       FPHAX Pharmaceuticals                          0%
       FSMEX  Medical Equipment                  -1%
       FSPHX   Health Care                              -2%
          
     Weakest                      Pct Change    
      FSVLX  Home Finance                           -15%  
      FNINX  Networking/Infrastructure       -14%
      FSAVX Automotive                                -13%
      FSPTX Technology                                -11%
      FWRLX  Wireless                                  -9%
      FSHOX   Housing                                   -9%
      FSLEX    Electronics                              -9%
      FSAGX   Gold                                        -9%
      FDCPX   Computer                               -9%


-----------------------------------------------------------------------------------------------------------------------------------   
             
                                    FALLS IN YEARS ENDING IN "7"

                             1837             Panic
                             ......
                             1887             September 19 (-2.24%) & October 12 (-2.29%) 
                             1897             September 21 (-3.95%) & October 12 (-3.90%) 
                             1907             Declined whole year from 90 to 55  in November           37% decline.
                                               
Major banking panic October 22.

                               ---------------------- My own study starts in 1915 -----------------------------------
                             1917             Early June peak at 99.... Bottom in December at 66  ... 33% decline.
                                                     Tip-off was well-tested support failure at 88 in August
                             ...........................................................................................................................................
                             1927             Peak on 10/4 at 200... Fell to 181 on 10/24... 9.5% decline
                                                     Tip-off was OBV NC at upper band.
                                                     Tip off was Accum.Index was negative at upper band
                             .....................................................................................................................................................
                             1937             Peak was at 190 on 8/16 ...  Fell to 113.6 on 11/24 October 18  ...40% decline
                                                      Tip-off was OBV NC at upper 3% band..
                                                      Tip off was Accum.Index was <+.05 at upper 3% band. 
                             .....................................................................................................................................................
                             1947             Peak was at 184 on 2/11...  Fell to 163.60 on May 20.   ...10.9% decline
                                                      Tip-off was small head and shoulders top with neckline break at 181 on 2/20
                                                      DJI made a 3-month high which was not confirmed by A/D Line
                             ......................................................................................................................................................
                             1957             Peak was at 521 on 7/12...  Fell to 419.80 on October 22.     ...19.4% decline
                                                      Classic "Sell S9" at upper 3.0% band.
                                                      "Sell 12": Tip off was Accum.Index was <+.05 at upper 3% band. 
                                                      Credit crunch. Sputnik
                             .....................................................................................................................................................
                             1967               Peak was at 943 on 9/25...  Fell to 826 on March 22.   ...12.4% decline
                                                      "Sell 12": Tip off was Accum.Index was <+.03 at upper 2.8% band. 
                                                       Tip-off was head and shoulders top with neckline break at 918 on 10/13
                              .....................................................................................................................................................
                              1977              On-going bear market which did not bottom until March 1978...
                                                   In 6/22 DJI reached 2.5% upper band at 926.  ...19.0% decline
                             ......................................................................................................................................................
                             1987              Peak was at 2702 on 8/26...  Fell to 1739  on October 19.   ...35.6% decline
                                                  10/1 at 2639 "Sell 12": Tip off was Accum.Index was <0 at upper 2.8% band.
                                                  10/2 at 2640 Classic "Sell S9" at upper 2.6% band. Hit 1739 on 10.19 34.1% decline
                             ......................................................................................................................................................
                             1997              Peak was at 8015.5 on 10/1... Fell to7498 on 10/28  6.5% decline
                                                 "Sell 12": Tip off was Accum.Index was <0 at upper 2.5% band.
                             ......................................................................................................................................................
                             2007              10% So far, the DJI has fallen to a low 10% below its year's high.

=============================================================================                                                       

                                                                NYSE New Highs (note link)
                                                                                                                                    NYSE NHs      New Lows
                                                                                                                                     --------------       -------------
                                                                                  11/30                                                        36          35
                                                                                  11/29                                                        36         
60
                                                                                  11/28                                                        34         
73
                                                                                  11/27                                                        19       
176
                                                                                  11/26                                                      18         
230
                                                                                  11/23                                                       12          
99
                                                                                  11/21                                                       14        
444
                                                                                  11/20                                                       22        
499
                                                                                  11/19                                                       20        
415
                                                                                  11/16-                                                    20         
234
                                                                                  11/15                                                        8         
189
                                                                                  11/14                                                        9         
121
                                                                                  11/13                                                      15        
126
                                                                                  11/12                                                     11          
287
                                                                                  11/9                                                       18          
360
                                                                                  11/8                                                       41          
388
                                                                                  11/7                                                       60          
364
                                                                                  11/6                                                     129          
146
                                                                                  11/5                                                       51          
230
                                                                                  11/2                                                      62           
186
                                                                                  11/1                                                      46           
130
                                                                                  10/31                                                   196            40
                                                                                  10/30                                                   112            47
                                                                                  10/29                                                  237             37
                                                                                  10/26                                                 184              43
                                                                                  10/25                                                 103              82
                                                                                  10/24                                                   56             
60
                                                                                  10/23                                                   52             50
                                                                                  10/22                                                  22             
92
                                                                                  10/19                                                  15           
187
                                                                                  10/18                                                108              83
                                                                                  10/17                                                  73            72
                                                                                  10/16                                                  44           
100
                                                                                  10/15                                                  54             
78
                                                                                  10/12                                                161              21
                                                                                  10/11                                                 98               20
                                                                                  10/9                                                 173              14
                                                                                  10/8                                                   57              14           
                                                                                  10/5                                                131                6
                                                                                  10/4                                                 51               11
                                                                                  10/3                                                 21                 9
                                                                                  10/2                                                 82               16
                                                                                  10/1                                                146                5
                                                                                 9/28                                                43               18
                                                                                 9/27                                                97               18
                                                                                 9/26                                                81               27
                                                                                 9/25                                               39               27
                                                                                 9/24                                                49               20
                                                                                 9/21                                                71               70
                                                                                 9/20                                                40               13
                                                                                 9/19                                                89                 5
                                                                                 9/18                                                89               11
                                                                                 9/17                                                22              
31                                    
                                                                                 9/14                                                26              
27
                                                                                 9/13                                                31              
32
                                                                                 9/12                                                30              
49
                                                                                 9/11                                                23               18 
                                                                                 9/10                                                15              
47
                                                                                 9/7                                                   6               
30
                                                                                 9/6                                                 24                15
                                                                                 9/5                                                14               
18
                                                                                 9/4                                                 37                12                                                
                                                                                 8/31                                               26                 9
                                                                                 8/30                                              16               
22
                                                                                 8/29                                               21              19
                                                                                 8/28                                                3               
27                        
                                                                                 8/27                                              13               
15
                                                                                 8/24                                              19                 7
                                                                                 8/23                                              11                10
                                                                                 8/22                                               9                
10
                                                                                 8/21                                               7                
21
                                                                                 8/20                                               8            
    24
                                                                                 8/17                                             10              
  34  Quite a recovery
                                                                                 8/16                                               4               
634  Extreme!                                                                                    8/15                                               1                 549
                                                                                 8/14                                               2               
332
                                                                                 8/13                                                8               
125
                                                                                 8/10                                                3               
174
                                                                                 8/9                                                22              
146
                                                                                 8/8                                                70                 63
                                                                                 8/7                                                28              
141
                                                                                 8/6                                                21              
261
                                                                                 8/3                                                13              
279
                                                                                 8/2                                                29             
  66
                             
                                                                                7/31                                               11            
160
                                                                                7/30                                               14            
176
                                                                                7/27                                            8                
221
                                                                                 7/26                                          11               
503 (correct?)
                                                                                 7/25                                         18                
215
                                                                                 7/24                                         12                
232
                                                                                 7/23                                         81                 78
                                                                                 7/20                                         34                
74
                                                                                 7/19                                       112                 65
                                                                                 7/18                                         45 NC!       
80
                                                                                ------------------------------S9/S12----------------------------------------------------
                                                                              
                                                (
Source:http://dynamic.nasdaq.com/asp/52weekshilow.asp?exchange=NYSE&status=HI)                


============= After 12/2  seasonally ==================

             Since 1965, the DJI has risen 
                
 67% after the next 3 trading days.   
                 
56% after the next 5 trading days.   
                 
46% after the next 10 trading days.  
Avg. decline =      +0.0%
                  
80% after the next  21-trading. 
         Avg. decline =   +2.1%    
                 
69% after the next two months. 
         Avg. decline =   +3.1%
                  69% after the next three months        Avg., gain =    +4.3%

===============================================================


STOCKS  
                        
Please consider getting Tiger Soft and Power-Ranker to Find these stocks
      each night or subscribe to the Full Hotline including Stock Recommendations
      for Tiger Software. 
Subscribe to the Tiger ESP Stocks' Hotline service to get current stock picks
      and follow-ups 3 times a week.
Order for $595/year.
--

Hit Counter