FALSE BREAKOUTS:
How To Predict and Spot Them.
How To Profit from Them.
Traders will inevitably find themselves
owning a stock that
makes a false breakout like the ones show below. The hardest part
will not be in spotting the falseness of the breakout, but in getting
yourself to take a small loss. This is essential money management.
Take the loss. You can always buy the stock back if it makes
a subsequent high. The danger of a 33% loss or more is quite high.
Savvy traders look for these patterns to short. They know the
breakout has already forced the more nervous short sellers to
cover. Without short sellers to cushion the decline, prices
can fall a long way.
False Breakouts above Flat Tops Are Obvious and Often Very
Bearish.
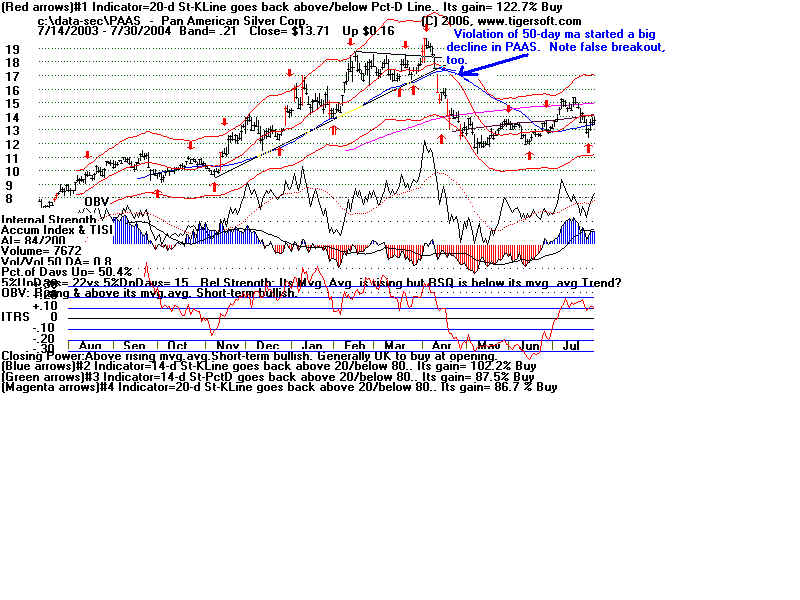
PAAS had already doubled in 7
months. That made the March breakout late. 20 is often
a significant psychological
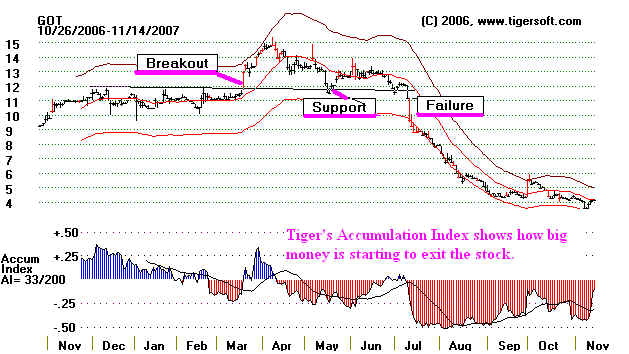
price barrier. The negative (red) Tiger Accumulation Index showed that
insiders were heavy sellers
before, during and after the brief breakout in March. The plunge
on heavy volume below the
50-day ma proved the stock was in trouble. It subsequently lost
50% of its entire advance
from 8 in July. This chart shows that OBV did confirm the breakout.
It was the Tiger Accumulation
Index which gave you the best clue that the breakout was false.
BASIC TECHNICAL ANALYSIS
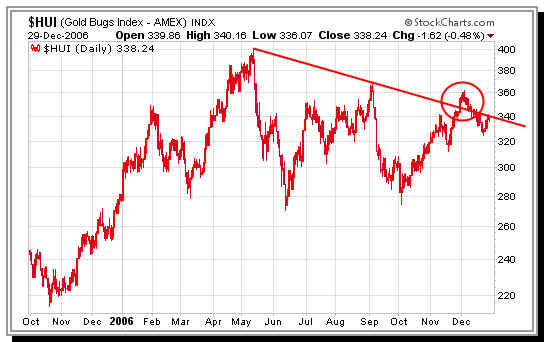
Good technical analysis requires a mastery of the concepts of support and resistance.
Inspecting charts, you will often see very traceable
lines of support that go through a
series of lows made by the stock, index or commodity.
Oppositely, a resistance line goes
through a series of highs. Some people use closing
highs and lows to develop these
important lines. I have found intra-day highs and
lows often make better lines, but it's the
closings that must move past the line for a breakout or
breakdown. The support level may
have to be tested many times before a rally ensues. But
once the support is seen as reliable,
prices typically get bid up to the overhead resistance line, if
present. Similarly we see prices
sag once it becomes clear that a stock, index or commodity cannot
get past a resistance
point. In this case, prices usually fall back to the most
reliable line, or, sometimes, zone of
support. The DJI chart of 1986 shows the importance of
recognizing support and resistance.
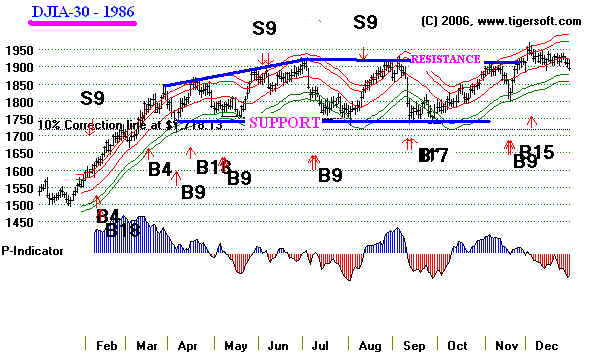
BREAKOUTS
At some point the support or resistance level is overcome. The
company's earnings picture
changes, new players come onto the scene, the Fed
takes a different tact: all these and many
other pieces of news or developing stories can cause
price breakouts or breakdowns. Prices
breakouts or price breakdowns usually bring a speedy
move away from the previous trading
range or price hesitation pattern. After the
breakout, prices are expected to move up or down,
at a minimum, the height of the previous trading
range. Many times they move up much
further. And the breakout run are often very
fast. This is why breakout playing is so popular.
Investors Daily has devoted whole segments of its
newspaper to this concept. Breakout buying
has a long history of successes, but no where more so
than in long bull markets. Read what

Jesse Livermore and Nicholas
Darvas wrote about this exciting way of trading.
"Jesse Livermore noticed several
things about stock market leaders in an up trending market. Their price
kept going up. That’s how you make money. He would look for industry groups that were
leading the market
and trade only the leaders of that group. This made perfect sense. A leading industry
group means only one
thing: there are more stocks going up than other groups. Not rocket science, but when
you're risking your
own money, you don't want it to be. By trading only stocks in a leading industry group you
can focus on that
small subset of stocks actually rising. He avoided weak stocks and their industry groups.
The probabilities
were too great of losing money...
"If Jesse found a stock he liked, he would decide in advance how many shares
he’d buy. If he decided
to
buy 400 shares of AAPL, he’d first purchase 100. If the price increased, he’d
buy another 100; then finish with
a
purchase of 200 shares if it kept rising. He needed confirmation that a stock would make
him money. What
better way to confirm a stock price is going up…than if it’s going up."
(Source: http://www.learnstockmarketlegends.com/jesse-livermore.html
)

Read
the reviews of the books by Darvas on Amazon.
http://www.amazon.com/o/ASIN/0818403969/105-0932341-4166013?SubscriptionId=19BAZMZQFZJ6G2QYGCG2
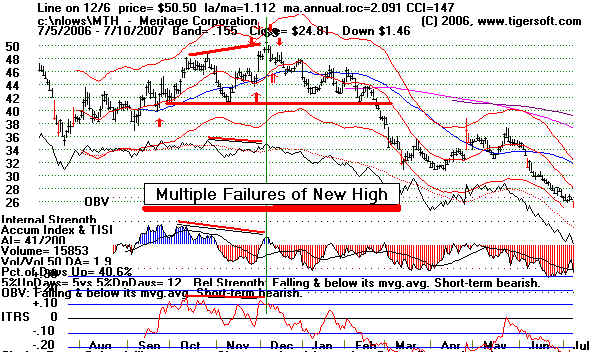
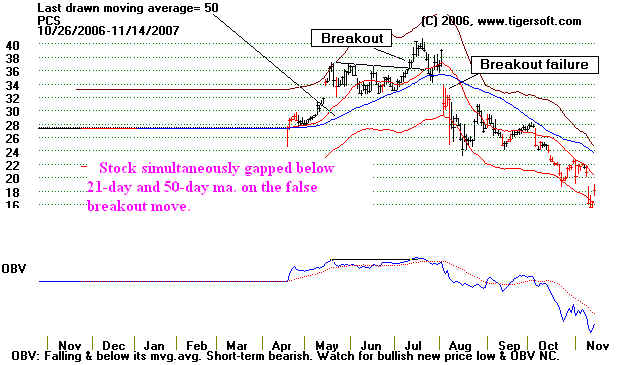
All New Highs Are Not Breakouts
New highs do not
necessarily entail a Breakout past well-tested resistance. There are
many more new highs that there are breakouts
past a horizontal line drawn through at least
3 previous highs. It is breakouts that we
are most interested in. But Tiger's internal strength
indicators validate new highs generally.
MTH below made a new high, but had no flat well-
tested resistance that it moved above.
So, it was not a "breakout" on 12/6 as we use that term.
Nevertheless, the falseness of its rally can be
seen in:
1) OBV did not make a corresponding new high.
2) The Tiger Accumulation Index was less than half of what it was 2 months' earlier.
3). The ITRS (Relative Strength) did not confirm the new high and was an insipid
.-3
Authenticating
Breakouts
Please see the discussion of this topic I began here on October
28, 2007.
TigerSoft and Peerless make much of breakouts and how to authenticate them, so that
we can buy the strongest of them and avoid the ones
that fail. Breakouts and breakdowns
are most reliable when the stock moves in the
direction of the overall market. Thus, a young
bull market with growing numbers of daily New Highs
is very beneficial to the breakout Buyer.
An aging bull market, or one that is ending, shows
many more false breakouts. In fact,
when you spot a number of false breakouts, you should
immediately consider the likelihood
that a severe correction or a bear market may be
beginning.
The best
price breakouts are also usually confirmed by a surge of volume. Our Tiger
Charts show increases of volume by making the price
bar red for that trading day. Price gaps
also make a breakout or breakdown more reliable.
The Tiger Charts let you authenticate breakouts by
showing a variety of internal strength
indicators, the majority of which should be making a
new high when prices breakout to new
highs. The same thing is true in reverse.
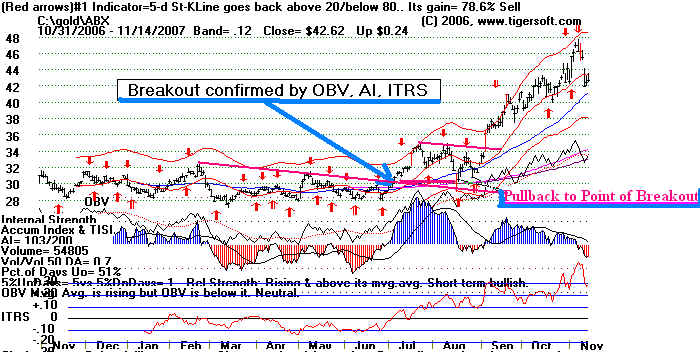
On Balance Volume should confirm a new high. This
measures aggressive buying. When it does not, a
pullback is often seen. See
the chart of SSRI
below. The Black OBV Line failed to confirm the
stock's recent price breakout over 40. The
Accumulation Index was positive and did reach the
levels of the old highs. The ITRS (Relative
Strength) definitely confirmed the breakout.
----------------------- SSRI: Example of Breakout and Pullback
------------------------------------------------------------
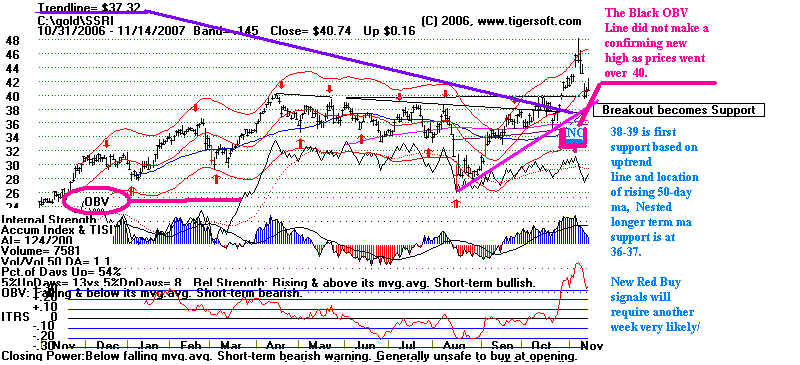
A true price breakout may still retreat without
achieving its price objective. But the
best breakouts advance 10% to 30% very quickly and
fulfill their minimum price objective,
sometimes in only a few days. In the chart
above, I would take the previous trading range
to be 14 point high, 40-26. If we consider the
price breakout to be 39, then the height
of the earlier pattern sets up a price objective of
39 + 14, or 53. SSRI still has more upside price
action ahead.
Broken
Resistance Becomes Support. Note the breakout at 31 in July was confirmed by
all our key indicators. In August prices did
pullback to the point of breakout. The retreat
quickly found support. The ITRS stayed very
positive. The Accum. Index turned only
slightly negative. Soon prices burst upwards to
a new high on (red) high) volume and moved
much higher. Any inspection of charts in a
rising general market environment will produce
hundreds of examples of pullbacks to the support of
earlier breakouts, just like this.
========= ABX Breaks our, Tests Point of Breakout and Rises
Sharply. ===============
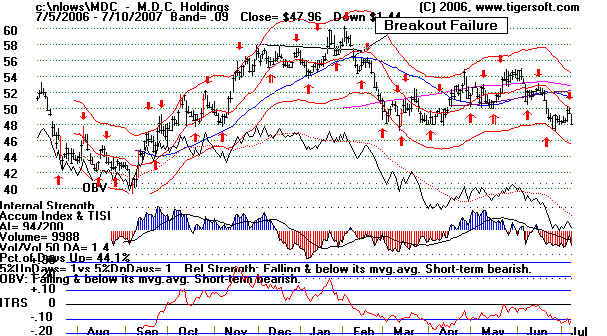
BREAKOUT FAILURES
Breakouts do sometimes fail. In these cases. prices move up a little and then
within a month or
two, fall back below the point of breakout. This usually occurs
because the general
market has faltered, because bad news has broadsided this
particular stock market or the
stock has been manipulated to force a short covering rally.
In all three cases, the
stock's initial move up has caught unsuspecting bulls. And
as the stock declines, they
will dump the stock if they are traders, rather than let losses
run or they will wait and wait
to get out even, thereby constituting resistance for
next rally up to the point of
breakout. When we look through old charts, we see
very few cases like the ones
below, where there is a truly false breakout above a
well-defined, well-tested
horizontal resistance. They are rare. But here some
cases to study.
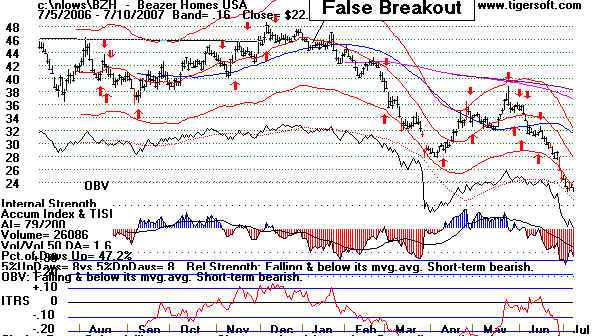
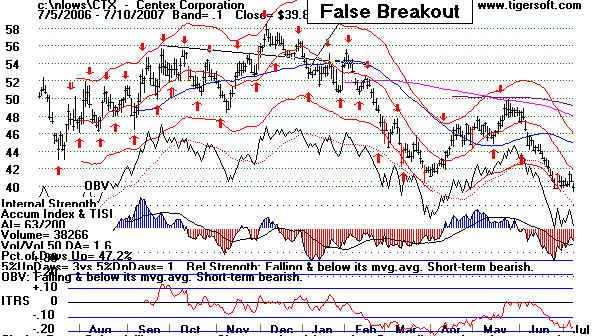
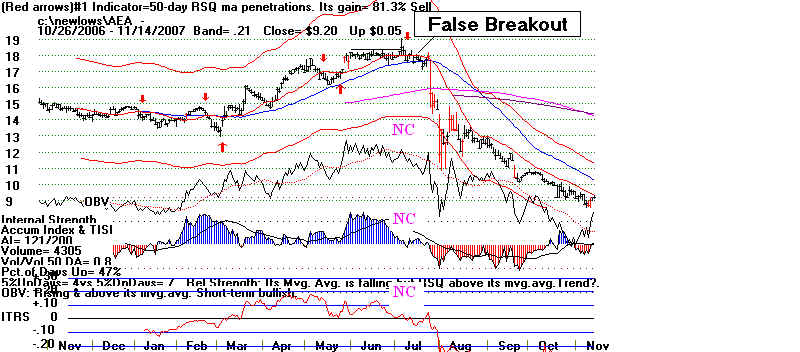
Traders Must Sell on A Clear Breakout Failure.
Very Aggressive Traders Should Even Sell Short.
The
examples above show holding a stock that breaks out and then
quickly retreats back below the
point of breakout on a closing basis by
a few percent is a lot better
tactic than hoping somehow the breakout
failure is an illusion. It
will help you to see that most false breakouts
have internal strength indicators
which did not confirm the breakout.
Consider the possibility that the
stock broke out on a day when
the biggest players were absent,
that the breakout was artificial in the sense
that it was chiefly the result of
buying from people reading charts (!?)
and that it may signify an
important turn downwards by the market,
or, at least, the industry that the
stock was in.
|