TigerSoft and Peerless Daily
Hotline
www.tigersoft.com/HL888
(C) 1985-2015 William Schmidt,
Ph.D. www.tigersoft.com
All rights
strictly reserved.
Tiger Software
858-273-5900 PO Box 22784 San Diego, CA 92192 Email
william_schmidt@hotmail.com
------------------------------------------------------------------------------------------------------------------
Announcements
-
Tiger/Peerless UPDATE. A new TigerSoft/Peerless update
has been released today.
The new Tiger's update has the new Sell S12. It has the
new QuickSilver table which is produced for any directory's stocks.
It should work well with the stocks in FASTUP, FASTDOWN, LEVERAGE, HIGHIP21,
MAXCP, MINCP, REDSELL and NEAR65. With this QuickSilver
table displayed, you point the mouse at the symbol and click Graph.
The Peercomm will also allow you to get stock data again from Dial Data.

8/20/2015
70+ TigerSoft Charts -
Go to www.tigersoft.com/HH/Index.html
8/20/2015
New Highs: NASD 4
NYSE 4
New Lows: NASD
177 NYSE 281
8/20/2015 Bullish MAXCP Stocks
22 ---->
www.tigersoft.com/MAXMIN/8-20/MAXCP.htm
Still being worked on
Bearish MINCP Stocks
289 -->
www.tigersoft.com/MAXMIN/8-20/MINCP.htm
Still being worked on
------------------------------------------------------------------------------------------------------------------
8/20/2015 It's
Friday, so we could get a rally up from 17000
simply based on short-covering before a weekend.
But down-day volume has been quite heavy today
and yesterday. Coupled with the weak OBV Lines
for the SP-500 and OEX, I doubt if any rally will
get past 17500.
DJI-17000 is a round-number support level. And it might hold
up.
More testing is usually needed after such a sharp decline.
If there is a reversal, watch the breadth. It will need to be very good,
better than 3.5 advances to declines on NYSE to give a
Buy B19.
. I worry that the next rally will not be strong enough to produce a
Peerless Sell. The DJI has had a very hard time getting above
the 2% upper band. I can't forget how the markets sold off in
Sept-October 1978, 1979 and 1987 when the Fed disappointed investors.
(That could certainly happen again. I won't repeat here my concerns
that the FED is not properly concerned about world-wide Deflation's
dangers to the US or how weak the World's markets look now.)
Sadly,
even assuming, the bank stocks are holding up now
because, insiders in them are privy to a new-found Fed
"dovishness", it is not clear the FED can do much to
fight off World-Wide Deflation.

No Buy B17
For lots of reasons, I think the Peerless Buy B17 rules
should be changed so that the current B17 is voided and
does not appear.
            Buy B17s After a 2% Decline
         Are not Safe if 65-dma is falling
         except after a bear market decline.
   At today's close, Peerless gave a new Buy B17.
   I would not trust it.  The reasons are pretty basic.

   They demonstrate the need to look at the key values
   and compare them with past cases.  The DJI's current
   key values differ considerably from their range in
   the few cases where a Buy B17 did take place on the
   same day the DJI fell 2% or more.

   In looking at the past for parallels, we want to
   to distinguish where in the markets bear-market ...
   bull-market... bear market cycle a Peerless signal occurs.
   Peerless Buys late in a long bull market at different
   from those occurring at a bear market bottom.

   The number of prior cases is also important. To be
   trustworthy a Peerless Buy signal should
   have a good number of past cases with similar key
   internals in comparable market environments.

   On all three grounds our Buy B17 is problematic.

   The easiest way to do this is to add B17 rules which
   disallow the signal after a long bull market when the
   the day's decline is over 2% and when the DJI is below
   a falling 65-dma. Note that in our case, the 65-dma has not
   only been penetrated, its rate of decline is rapidly
   increasing.  In the past, none of the Buy B17s with declines
   of more than 2% from the previous day's close occurred
   in an on-going bull market when the DJI was below a
   falling 65-day ma.
   Note also there have only been 6 prior cases of B17s with a daily
   decline of 2% or more since 1928. Only  3 cases have been
   seen since 1939. When a new Buy (or Sell) occurs with so few cases,
   we want to be very careful and we want to use the new case to
   better define the acceptable parameters of the signal.
   See all their cases below.
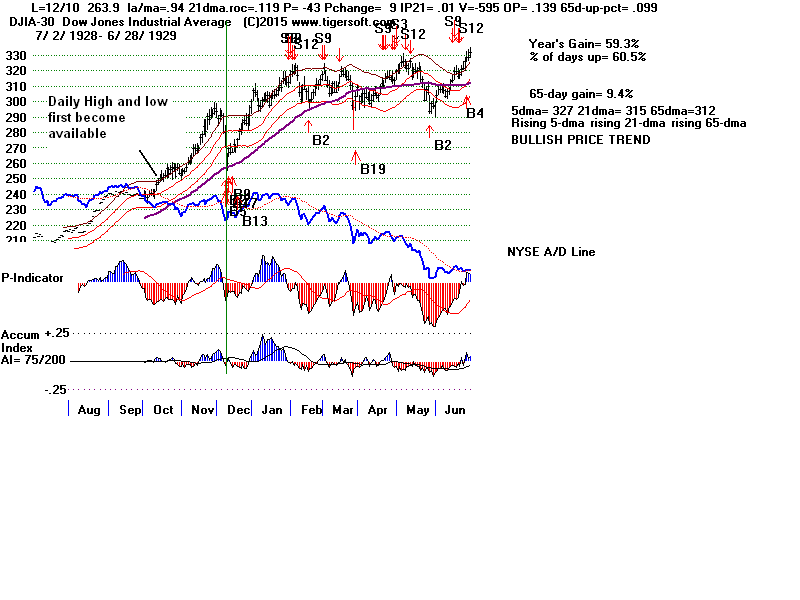
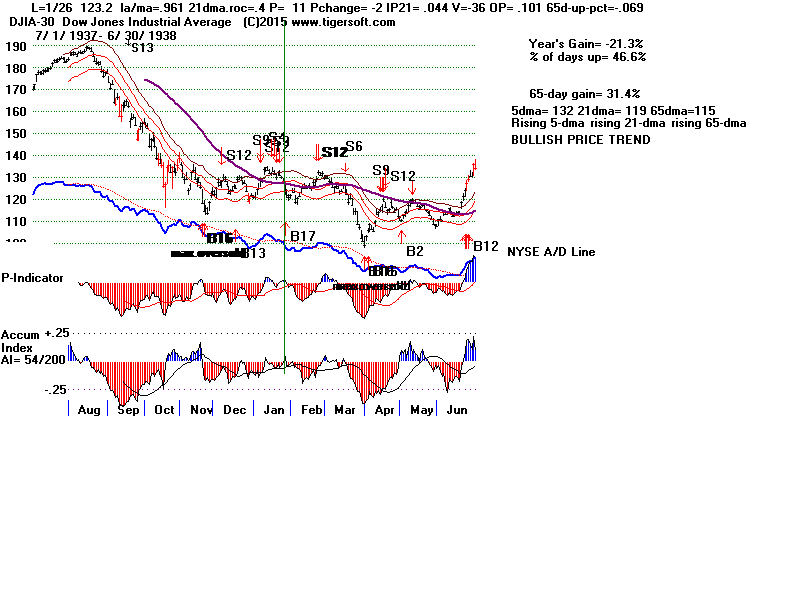
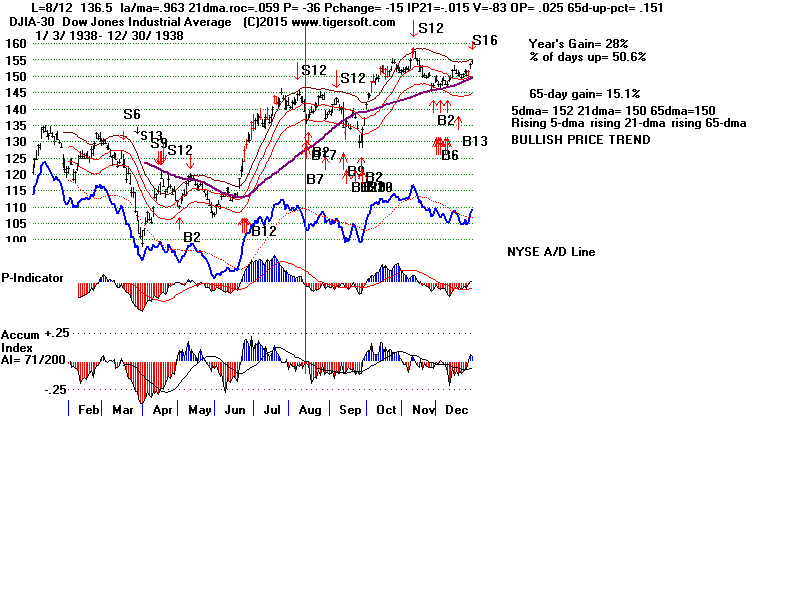
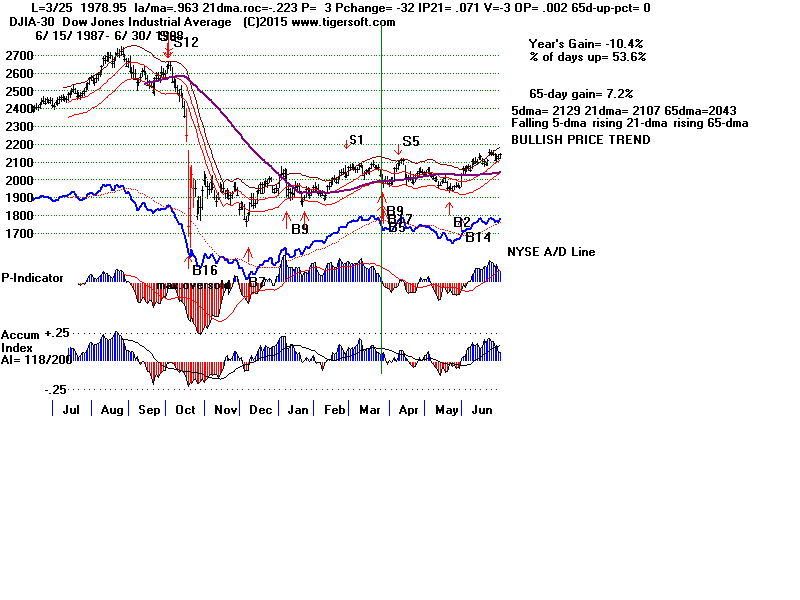
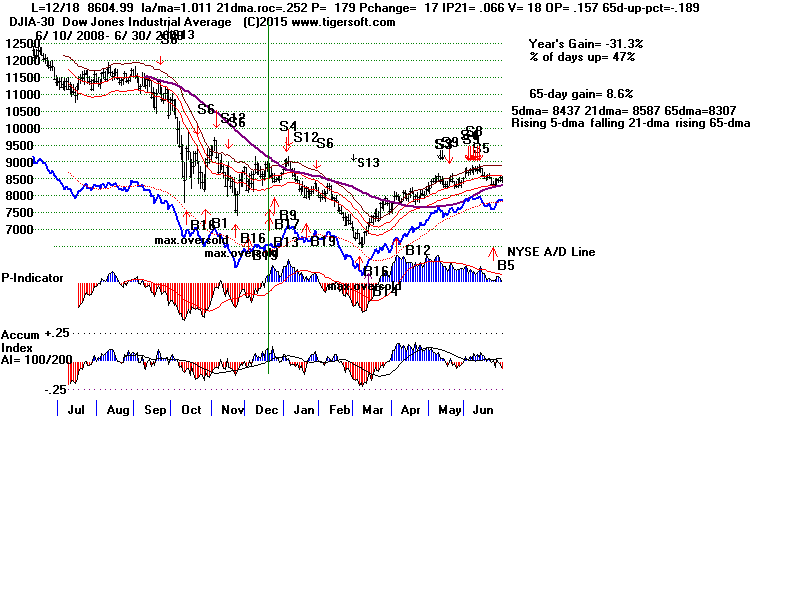
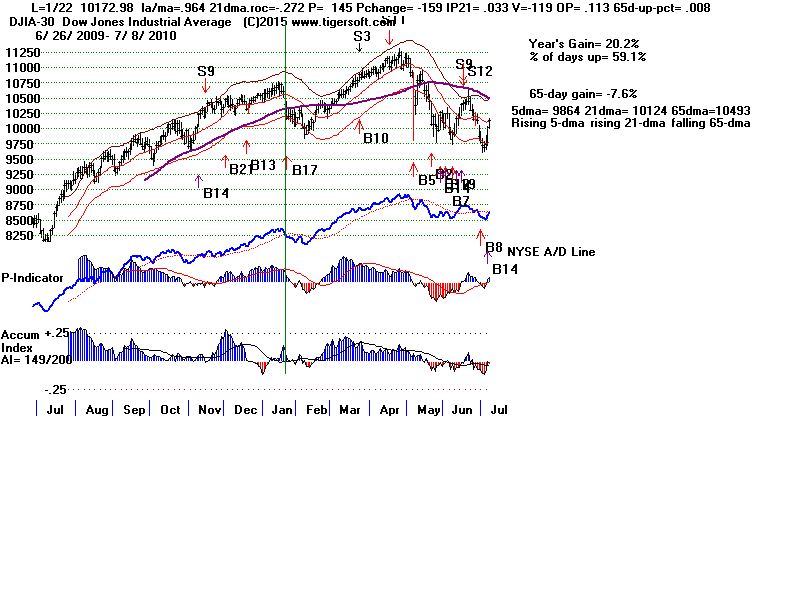
                    B17s on Cases Where
                   DJI Fell More than 2%
                   on Day of Buy Signal.
   Date        Pct       65-dma status     LA/MA   P-I  IP21   V-I   OBV-Pvt
               Decline
   -------------------------------------------------------------------------------------
   8/20/2015   2%      Below Falling       .970    -238 -.05    -149  -.462
   Bull market is 5 1/2 years old.
   ------------------------------------------------------------------------------------
   12/10/1928         Above Rising 65 dma   .94     -43  +.01    +9   +.139
   Many other Buy signals on this date.
   --------------------------------------------------------------------------------------
   1/26/1938          Below Falling.        .961     -2  +.044   -36  +.101
   This was a B17 during a bear market decline
   --------------------------------------------------------------------------------------
   8/8/1938           Above Rising          .963    -36  -.015   -83  +.025
   Bull market was less than 6 months' old.
   --------------------------------------------------------------------------------------
   3/25/1988          Above Rising          .963    -32  +.071   -3   +.002
   Building a bottom after a Bear Market...Also Buy B9/B5
   --------------------------------------------------------------------------------------
   11/11/1988         Just below Rising     .963    -133 +.075   -5   -.053
   Building a bottom after a Bear Market...Also Buy B2
   --------------------------------------------------------------------------------------
   1/22/2010          Just below rising      .964   145  +.033  -119  +.113
   Bull Market - no other Buy signal.  Bull market was less than a year old.
   --------------------------------------------------------------------------------------
|
Earlier Comments Here Still Apply.
"The signs of Deflation significantly worsened today as Crude Oil and
the Chinese YINN broke (further) below key support. Somehow, the Fed and
Janet Yellen have been maintaining the declines in Oil and Commodities
are "transitory". Will the action today change their opinions or on Open
Market Committee votes? It fact, it may be too late for them to make
much of a difference.
"The Fed could come out in light of the Chinese and World Market's drop
top to new lows along with Oil and Commodities and say that they are rethinking
|
their plan to raise rates in September. So far, they have not. This
is is downright
scary. I suspect Professionals may soon have no choice but to start
using
leveraged short ETFs en masse on the major market indexes. No one knows
how fast this could cause the DJI to decline.
"There is still some hope that the FED will change their collective
minds. The Hourly OBV-DISI Line is showing some strength.
But this comes after three months of severe bearish divergences
by it from the DJI. Another minor rally to the DJI's falling 21-day
(147-hour) ma.
is certainly a possibility. But the up-day Volume in the broader SP-500
|
remains too low to be expected to eat up much of its overhead resistance.
With the World's markets breaking down, look for more and more
lower openings. At some point, Professionals may no longer try to
support the market and instead seek to take advantage of how
steep the downtrend in a Deflationary spiral could become using
all the wonderful new derivatives and leveraged ETFs they have
created for this occasion."
Bearish Seasonality
Though the third year in the 4-year Presidential Cycle is normally quite
bullish, the median decline at some point from the DJI's peak to a
September or October bottom is 10% since 1945. So far,
the DJI has only fallen 4% from its July peak.
DJI's Declines in 3rd-4th Quarters of
Third Year of Pres. Election
1947 7/24//1947 6% decline to 7/1947
1951 9/13/1951 7% decline to 11/8/1951
1955 9/23/1955 10% decline to 10/10/1955
1959 8/3/1959 9% decline to 9/29/1959
1963 10/23/1963 10% decline to 11/22/1963
1967 9/25/1967 10% decline to 11/14/1967
1971 9/7/1971 13.5% decline to 11/23/1971
1975 9/8/1975 7% decline to 10/1/1975
1979 10/5/1979 11.5% decline to 11/7/1979
1983 7/26/1983 6% decline to 8/5/1983
1987 8/25/1987 36.5% decline to 10/19/1987
1991 8/7/1991 5% decline to 10/7/1991
1995 no declines
1999 8/25/1999 11% decline to 10/18/1999
2003 9/18/2003 4% decline to 9/28/2003
2007 7/19/2007 10% decline to 8/16/2007
10/19/2007 10% decline to 11/26/2007
2011 7/21/2011 16% decline to 10/3/2011
2015 7/16/2015 4% decline so far...
median decline = 10%
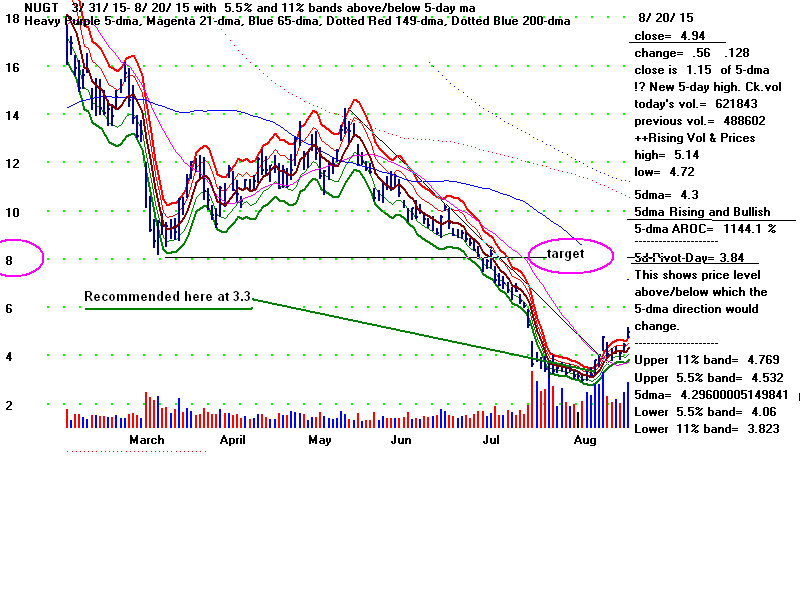
QuickSilver works. We are still holding NUGT long.
Watch for 5-day ma turns along with big (blue) up-day
volume. We need to write a program to flag these!
------------------------
Announcements
--------------------------------
E-Books
1
The On-Line Explosive Stocks
2
The On-Line Killer Short
Sales book
Purchase each all new book by CC for
$42.50 or send a check for $37.50 to me.
I call your
attention now to the many new concepts and
the considerable new research in them:
For example:
1) A very good New Tiger Buy B12 for Low
Priced Stocks
2) After Red high volume reversal days use CP
uptrend-breaks.
3) Buy the stocks the Federal Govt wants you
to buy.
4) 100-Day Power Rankings...
5) Using Closing Power Hooks after Buy B26s
and B20s.
6) How A Stock Reacts to Its Earnings Report
Is Very important.
7) TigerSoft Major Buy Signals' Combinations
Which are most Powerful? Reliable?
8) Augmented Buy B20s' Independent Success
Rate.
9) What factors warn a rising 65-dma will not
hold?
10) The classic cluster of technical
characteristics that commonly appear
in the 23 stocks falling 70% or more in
the deep pullback of 2011.
----------------------------------------------------------------------------------------------------------------------------------------------------------------------------
PEERLESS STOCK MARKET TIMING:
A Guide To
Profitably Using The Tiger Nightly HOTLINE
New Peerless Signals and DJI Charts - version 7/4/2013
1965
1965-6 1966
1966-7 1967
1967-8 1968
1968-9 1969
1969-70
1970
1970-1
1971
1971-2 1972
1972-3
1973 1973-4
1974
1974-5 1975
1975-6
1976 1976-7
1977
1977-1978
1978
1978-79
1979 1979-80
1980 1980-1
1981 1981-2
1982 1982-1983
1983 1983-1984
1984
1984-1985
1985
1985-1986
1986 1986-1987
1987 1987-8
1988
1988-9 1989
1989-90
1990
1990-1 1991
1991-2 1992
1992-3 1993
1993-4 1994
1994-5 1995
1995-1996
1996
1996-7 1997
1997-8 1998
1998-1999 1999
1999-2000 2000
2000-1
2001 2001-2
2002
2002-3 2003
2003-4 2004
2004-5
2005 2005-6
2006 2006-7
2007 2007-8
2008 2008-9
2009
2009-10
2010 2010-11
2011 2011-12
2012
2012-2013
2013 2013-4 2014
Introduction to Tiger/Peerless Buys and Sells.
Different Types
of TigerSoft/Peerless CHARTS, Signals and Indicators
How reliable support is the DJI's rising 200-day ma?
-------------------------------------------------------------------------------------------------------------------
TIGERSOFT SIGNALS AND INDICATORS:
Documentation for TigerSoft
Automatic and Optimized Signals.
SPY Charts since 1994: Advisory Closing Power S7s, Accum. Index, 65-dma,
Optimized Signals.
"The
Jig Is Up": Calling September and October Tops.
A Keynesian's Warning Signs.
NUGT since 2012: A study of Tiger Technicals
Tiger Day
Traders Tool and most active Triple Leveraged ETFs
Advisory Pink Closing Power S7s at ETF at top since 1994
1994
1996
1997
1998
1999
2000 QQQ
SPY
DIA
2002
2007
2008
SPY 2011
2013-2014
Tiger Buy and Sell
Signals: New 2014 Research:
These are randomly chosen
groups.
but clearly we need to back-test them in more years.
You can replicate or do similar studies yourself
for other signals and/or other years.
9/1/2014 -
2014 Tiger
B19s - Steady rallying and no pullbacks below the 21-day ma.
9/2/2014 -
2014 Tiger
B17s on 14As taken alphabetically
9/3/2014 -
2014 Tiger B17s on 60
Biotechs taken alphabetically
9/4/2014 -
2014 Tiger
B18s on all "R" stocks taken alphabetically
* 9/8/2014 -
2014 Tiger
B20s - Conclusion: Use Closing Power trendbreaks in aftermath.
9/8/2014 -
2014 Tiger
B16s - Conclusion: Use mostly when
LA/MA under 1.05.
9/11/2014 -
2014 Tiger
B15s - Conclusion: Certain conditions
improved the results dramatically.
9/12/2014 -
2014 Tiger
B25s - Conclusion: 87.5% success rate
when other internals are positive.
9/15/2014 -
2014 Tiger B25s -
Best conditions for using B25s with somewhat
higher RSX capitalization stocks.
9/16/2014 -
New Tiger
Closing Power Take-Off Buy Signal in 2014: 14s, QQQ, DJI-30 and ETFs
9/17/2014 -
New Tiger
Closing Power Take-Off Buy Signal: 2009A-s
9/18/2014 -
New Tiger
Closing Power Take-Off Buy Signal: 2010A-s
9/21/2014 -
New Tiger
Augmented Sell S8s: DJI-30 - 2014
Requiring S8s to show
Negative CP%-Pr and IP21<+.15 produced a 70% success rate
in a rising market for
DJI-30 stocks and big ETFs.
9/24/2014 -
Tiger Sell
S14s: They make price breakdowns very bearish.
1/15/2015
-
Tiger Day
Traders' Tool Explained.
http://www.tigersoft.com/day-traders/index.html
http://www.tigersoft.com/Indicators/index.htm
http://www.tigersoftware.com/TigerBlogs/Aug-31-2009/index.html
NEW
2/16/2015
1) New -
Tiger Charts showing UP%, Opening-Up%, Closing-Up%
Note differences between bullish
and bearish stocks...
2) New -
UP%,
Opening-Up%, Closing-Up% Rankings of any directory.
3) New -
Display of what happens to a stock after various size openings up or down.
4) New -
6-month charts to better
show volume changes and 5-day ma with bands.
More profitable trading schemes coming...
Targeted Trading Opportunities:The Profits Quickly Add Up,
3/29/2015
Tiger CandleSticks:
IBB: 2001-2015
and
Recent Others.
====================================================================================
Earlier Hotlines
2-7-2014 to 3/19/2014
11-22-2014 to 2-6-2014
http://tigersoftware.com/555HL555/index.htm
10/9/2014 - 11/21/2014
http://tigersoftware.com/9933Hot/
9/2/2014 - 10/8/2014-
http://tigersoftware.com/2233HL/index.html
6/25/2013-9/1/2014
http://tigersoftware.com/112211-H/index.htm
11/22/2013-3/20/2014
http://tigersoft.com/1111-HL/index.html
10/22/2013-11/21/2013
Past
Hotline Predictions
http://tigersoft.com/-HL42013/index.html
http://www.tigersoft.com/-2GBL13HL/index.htm
==============================================================================================================================