


TigerSoft and Peerless Daily
Hotline
www.tigersoft.com/-2GBL13HL/index.htm
 The
location of this Hotline will change tomorrow (Wednesday)
night.
The
location of this Hotline will change tomorrow (Wednesday)
night.
If you did not get the new email address, please email me.
william_schmidt@hotmail.com
(C) 1985-2013 William Schmidt, Ph.D. www.tigersoft.com All rights strictly reserved.
---> To renew this Hotline, order here $350 (check) - $360(Visa/MC)
=====================================================================================
 A Guide To Profitably Using The
Tiger Nightly HOTLINE
A Guide To Profitably Using The
Tiger Nightly HOTLINE
TigerSoft and Peerless Links, Older
Hotlines...
Most recently: http://tigersoft.com/-SBL13HL/index.htm
Please report broken links to william_schmidt@hotmail.com
=====================================================================================
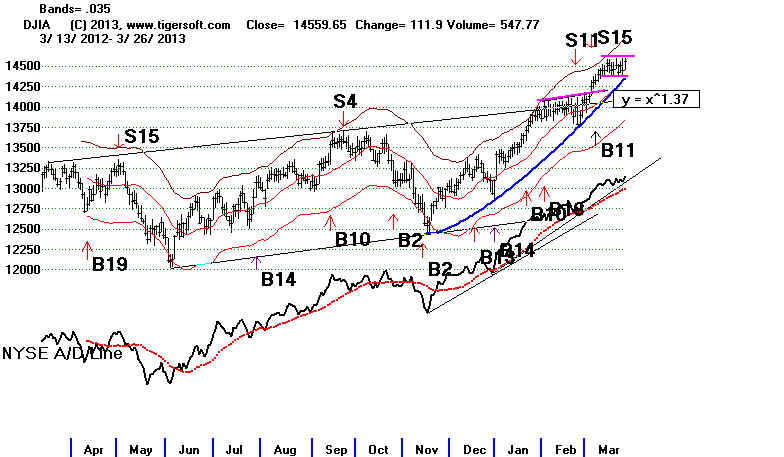
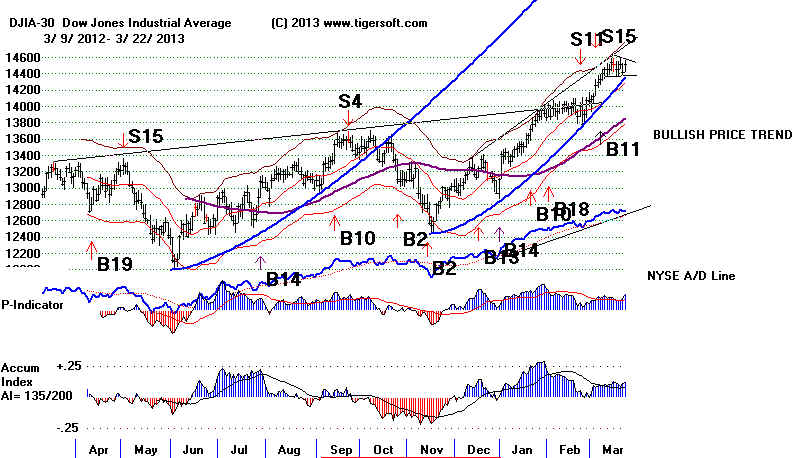
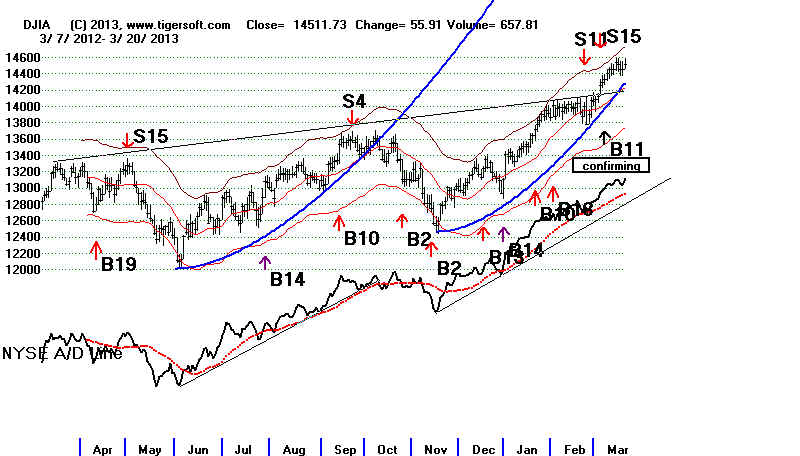
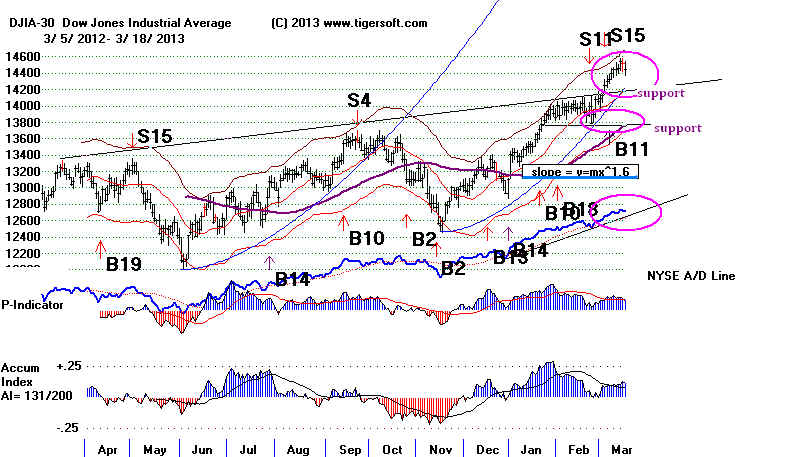
3/26/2013 The DJI's New High Closing did not get past 14600. We
still want a breakout which closes above the highest levels of the recent
trading range, a bullish flag pattern. The battle
between the profit-takers
and more aggressive public buyers is still in full swing.
Orthodox Peerless
followers of the Sell S9 should not give up hope. But they should keep
in mind that longer-term very low-cost Big Bank borrowing like Bernanke has
introduced is unprecedented. I would prefer not to sell
short DIA or
SPY until there is a Sell S9, a Sell S12, an A/D line trend-break or
the key Closing Powers for SPY and DIA drop below their 21-day ma.
3/26/2013 ---> To All Key Index
and Leading Stock Charts
---> 222 MAXCP stocks Bullish MAXCP
Stocks (3/26/2013) BULLish plurality
---> 65
MINCP stocks Bearish
MINCP Stocks (3/26/2013)
--->86 New Highs on NASDAQ 15 new lows. BULLish
plurality
--->174 New Highs on NYSE 5
new lows. BULLish
plurality
3/26/2013 Key Values: DJI 14560 +112 la/ma= 1.015 21dma-roc = 0.645 P= 405 Pch= +135
IP21 = +.156 (on 1/30/2013 IP21 was .293) V =
+37 Opct =
.379 65 day-pct-up = .09
(Note the big improvement in 21-day ma ROC and IP21 today from yesterday.)
It's important to note, too, that the DJI's new high today was not confirmed by other
indexes (SP-500, NASDAQ, Value Line, OEX, NYSE) or the Closing Power
and DailyVolume remained low. This is not immediately bearish. But it is
a warning for bulls not to celebrate yet.
Bullish are the DJI's parabolic uptrend, the all-time high and
relatively high level of Accumulation . They show that most big institutional
investors are holding their positions tightly after heavily buying in January. They
do not want to sell yet, for fear of missing higher prices. The many bulges of
very high Accumulation in January in many, many stocks was one of the
bullish factors we spotted back then to make us bullish.
Now with the Opening Power rising, we can see that the broad Public is buying
more and more aggressively. This is what we would expect in a more and
more specualtive market, driven by the Fed's repeated promises not to
raise interest rates until at least 2014.
Seasonally, as I showed last night, this would be a typical time for a
clearer and more powerful breakout. Perhaps, 15000 will be seen very
soon. A clear breakout above flat resistance, especially when the underlying
trend is rising faster and faster, can be very exciting. What headlines the
DJI at 15000 would make, especially if accompanied by on Employment data!
Gold stocks are still in the doldrums. This is usually bullish for the
stock market. Crude oil has turned up. This will help XOM and CVX,
two high priced DJI stocks.
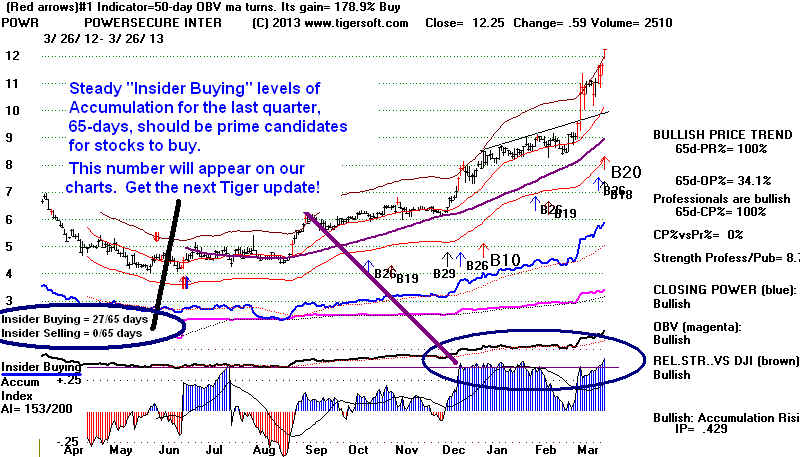
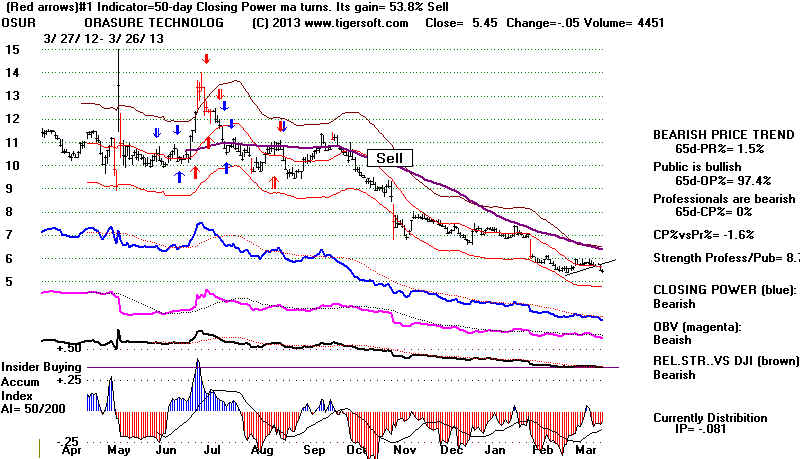
New Research and New Tiger Charting
I want to place more emphasis on steadily high
readings from the Accumulation
Index for the last 65 trading days and start counting the number of the
days when IP21 is above +.375 in this period and post that number on the
chart. Oppositely, I want to count the number of days here that show
an IP21 below -.25. Stocks with 65-day-IP21-counts above a certain
level will be flagged. Timing their purchases with Closing Power trend-breaks
should work out well. Contrast the extreme differences in levels of Accumulation
for the last 65 trading days in the charts below. The results here are typical.
====================================================================================
OLDER HOTLINES
====================================================================================
3/25/2013 Bullish and Bearish Forces Fight
For Control Now.
"Sorry, Bulls", and "Sorry, Bears", Hedging Still Seems
Advisable.
The DJI reversed downward today from the top of its minor
trading range. That lends hope to orthodox users of Peerless who
took the Peerless Sell as an automatic sign to sell short DIA or SPY.
But I have to say, all in all, there are more bullish forces at work
now
than bearish factors.
3/25/2013 ---> To All Key Index
and Lesding Stock Charts
---> 205
MAXCP stocks
Bullish
MAXCP Stocks (3/25/2013) BULLish plurality
---> 70
MINCP stocks Bearish
MINCP Stocks (3/25/2013)
--->89 New Highs on NASDAQ 10 new lows. BULLish
plurality
--->104 New Highs on NYSE
12 new lows. BULLish plurality
3/25/2013 Key Values: DJI 14448 -64
la/ma= 1.01 21dma-roc = 0.373 P= +269 Pch= -99
IP21 = +.088
(on 1/30/2013 IP21 was .293) V = -4 Opct = .269 65
day-pct-up = .075
Movements like this in such a trading range ARE important, but mostly
in that they confirm the exact bounderies of support (14380) and resistance (14600).
The more well-tested such resistance and support is, the more reliable
the eventual breakout. Movements up and down in such a trading range,
are not really reliable clues which way the market will ultimately break.
If there had not been a Sell S15, I would say that the odds were 2:1 or even 3:1
in favor of an upside breakout. This is because flag or rectangle price
patterns
are much more likely to be continuation patterns than reversal patterns. So
until we have a price breakout or breakdown above or below the trading range,
I think we just have to wait to be bullish or bearish enough to buy or sell short
SPY or DJI. I have said waiting for the A/D Line to break its uptrend
would probably be safest, too.
On the positive side, I mentioned the DJI's unusual upward parabolic
momentum, that it is up more than 7.5% above its level of 3 months ago,
that the P-Indicator is above +180, the IP21 is above +.10 ans the DJI
is at an-time high. None of the earlier Sell S15s had all these bullish
factors all at once. Since there are still many more MAXCP stocks
than MINCP stocks, too, we can easily find stocks to be long and
still hedge by shorting some of the bearish MINCP stocks. This has been
a profitable strategy and seems reasonable while we wait to see which way the
market breaks.
Seasonality is a bullish factor at work now, too: first because the 3 trading
days before and after Easter are generally up more than are typical days;
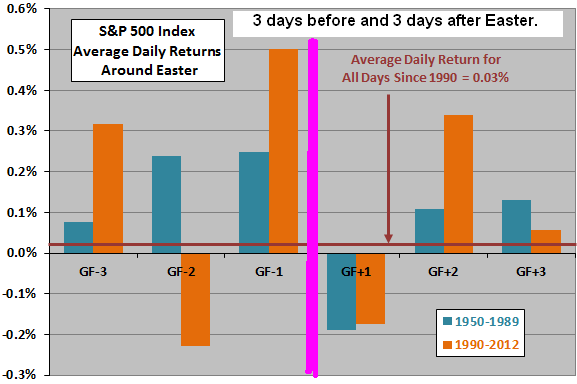
http://www.cxoadvisory.com/4525/calendar-effects/stock-returns-around-easter/
and second, because there are very few market tops since 1965 that
peak
in the last week of March. Peaks in the period March 21st-April 7th
are 50% less likely to occur than than those ealier in March and or later
in April. Only two such declines, 1949 and 1981, occurred in the year
after a Presidential Election between March 21st and April 31st.
March and April DJI Peaks
before Declines of More than 5%
March 1-21st
March 21st-April 7 April 8 -
April 31
--------------------
-------------------------
---------------------------
3/7/1945 6%
3/25/1949 9%
4/18/1960
5%
3/17/1953 12%
3/31/1952 5%
4/28/1971
12%
3/4/1955
6%
4/6/1956 10%
4/18/1972
5%
3/14/1962
26%
3/25/1970 20%
4/10/1979 6.5%
3/14/1974 35%
3/24/1976 4%
4/27/1981 20%
3/17/1975 5.5%
3/27/1986 5%
4/21/1986 5%
3/16/1977 17%
4/7/1987 8%
4/12/1988 8%
3/16/1984 5%
4/6/2004 6%
4/17/1991 5%
3/18/1988 5%
4/11/2000 9.5%
3/18/1996 5%
4/26/2010 13.5%
3/11/1997 10%
3/12/2002 31%
3/7/2005 8%
3/15/2012
9%
|
Bearish Aspects To The Market Now
apart from the Sell S15 and V-I Negative Non-Confirmations.
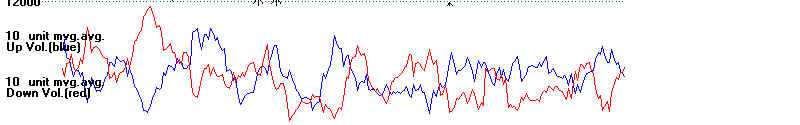
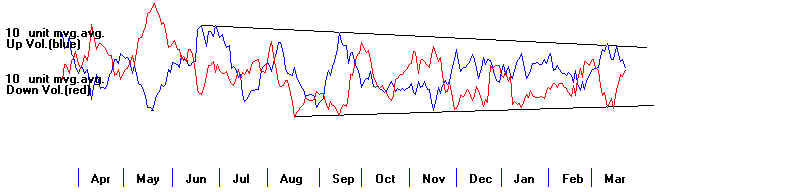
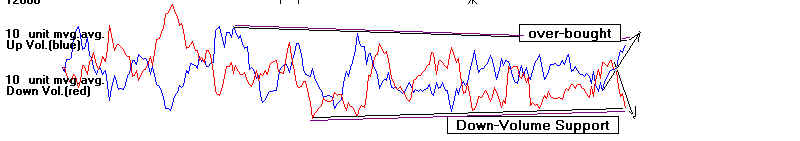
On the negative side, see below how the 10-day NYSE Down Volume has now
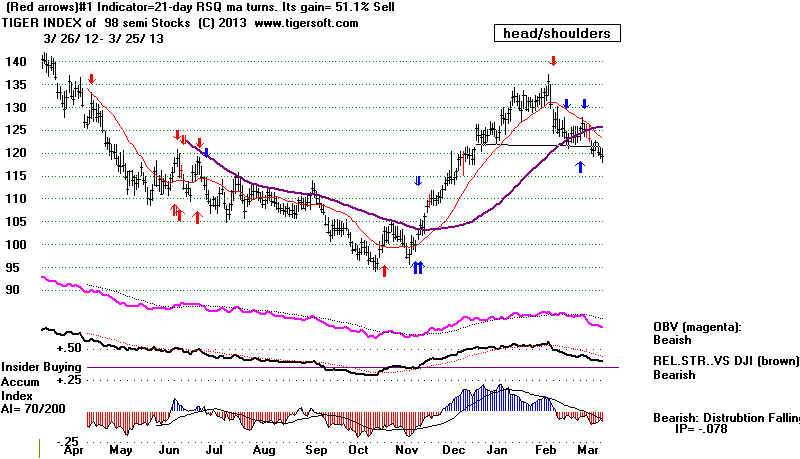
risen above the 10-day Up Volume. See also how the volatile Tiger Semi-Conductor
Stocks have a completed head/shoulders pattern. Being capital intensive,
semi-conductors often lead a valid recovery, but top out before the general
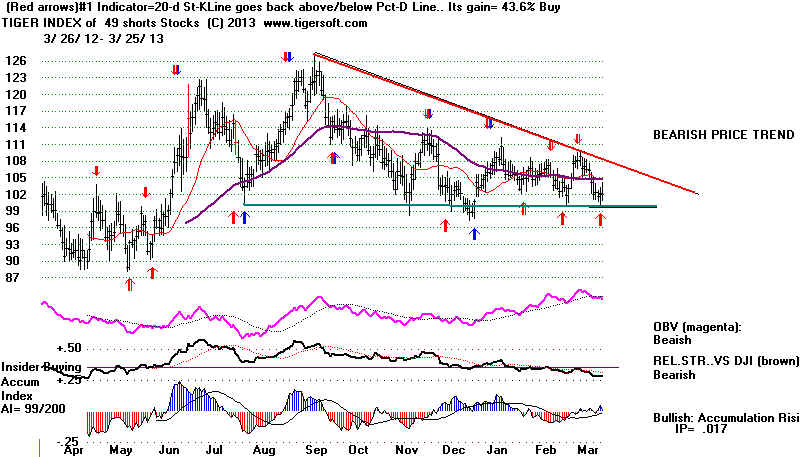
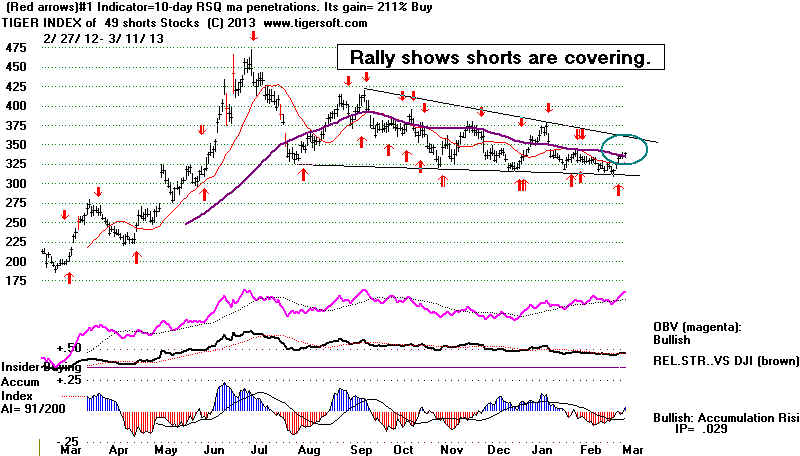
market does. And one more chart should caution us. Professional shorts
are not yet spooked by the market's apparent strength. I say this based on
the Tiger Index of the Most Heavily Shorted Stocks as of mid-February. That
index is at its support line and could easily breakdown.
10-day NYSE Down Volume is now above the 10-day NYSE Up Volume.
 |
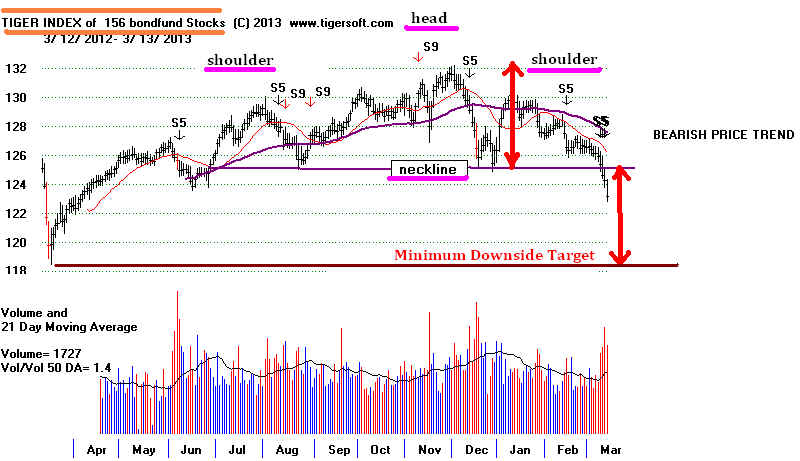
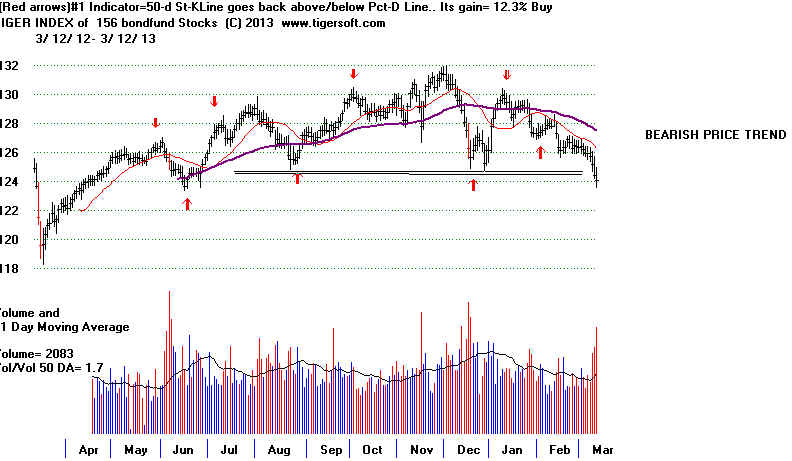
Tiger Semi-Conductor Stocks have a completed head/shoulders pattern
 |
Most Heavily Shorted Stocks
 |
j
===================================================================================
OLDER HOTLINES
===================================================================================
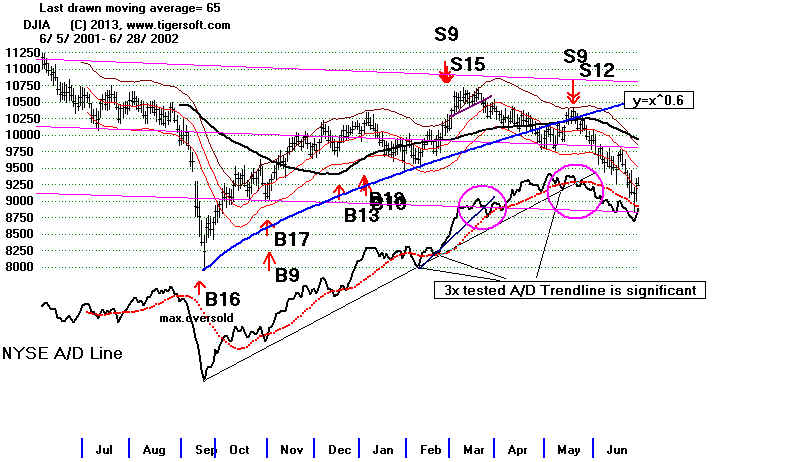
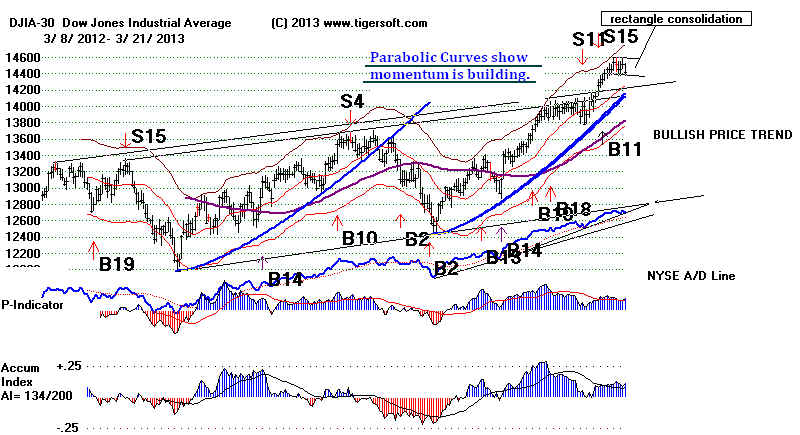
3/22/2013
Let's Not Fight The Fed here
until
the NYSE A/D Line Uptrend Is Broken?
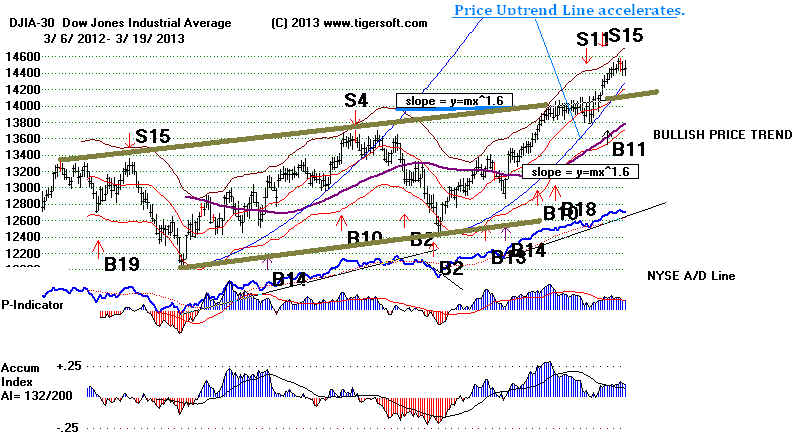
The DJI has not yet
broken out past 14600 to new highs. But it is important to
know that Breakouts in Accelerating Uptrends often bring exciting upswings.
I call these parabolic breakouts. See some examples.
http://www.tigersoft.com/-2GBL13HL/ParabolicAscents/index.html
They are rare with individual stocks and even rarer with the
DJI-30. They usually
show a speculative bubble is developing. Once started, the mass emotions
underlying the quickening trend, must play out, it seems, like an iron law..
But before the buying climax, which is often a vertical takeoff, very
profitable trading opportunities are presented if you buy the breakouts
and sell when the accelerating uptrend is finally broken. The DJI's price
upswing
is becoming parabolic. Accordingly, breakouts here have good trading potential
provided
one places stops beneath the uptrend.
A DJI close over 14600 into all-time high territory has that potential.
Friday we saw big jumps upward int he P-Indicator, Accumulation Index
and the V-Indicator turned positive by a wide margin. A big jump
upwards should be expected this coming week if there is a breakout.
It is also possible that 14580 will stop the rally again. As long as
the accelerating uptrend-line is not violated, the upside potential
of a parabolic breakout will still be present..
3/22/2013
---> To All Key Index and Lesding Stock
Charts
---> 281
MAXCP stocks
Bullish
MAXCP Stocks (3/22/2013) BULLish plurality
---> 42
MINCP stocks Bearish
MINCP Stocks (3/22/2013)
--->65 New Highs on NASDAQ 10 new lows. BULLish
plurality
--->101 New Highs on NYSE
9 new lows. BULLish
plurality
3/22/2013 Key Values: DJI 14512 +90 la/ma= 1.016 21dma-roc = 0.527
P= +367 Pch= +94
IP21 = +.126
(on 1/30/2013 IP21 was .293) V = +25 Opct = .369 65 day-pct-up = .088
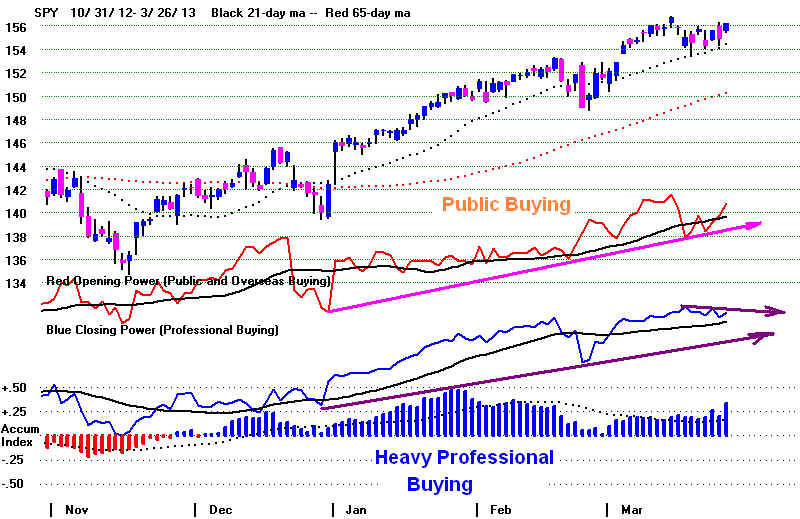
The A/D Lines, Closing Power and Accumulation Indexes
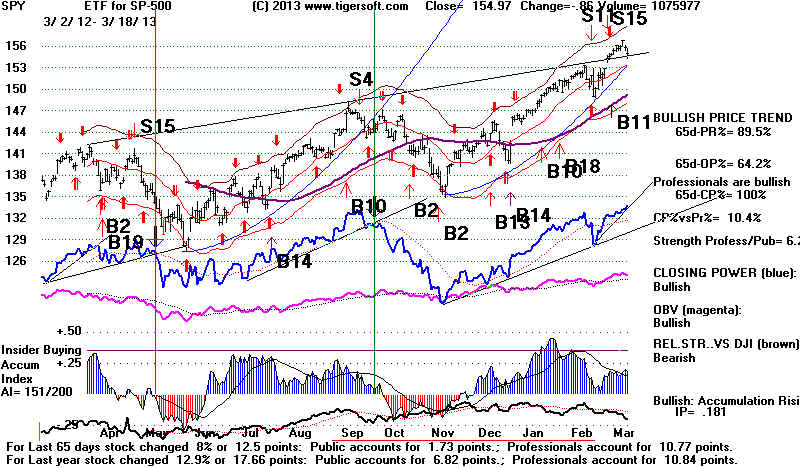
still look too good to
short DIA or SPY. It would be a good idea to buy back some of the stocks
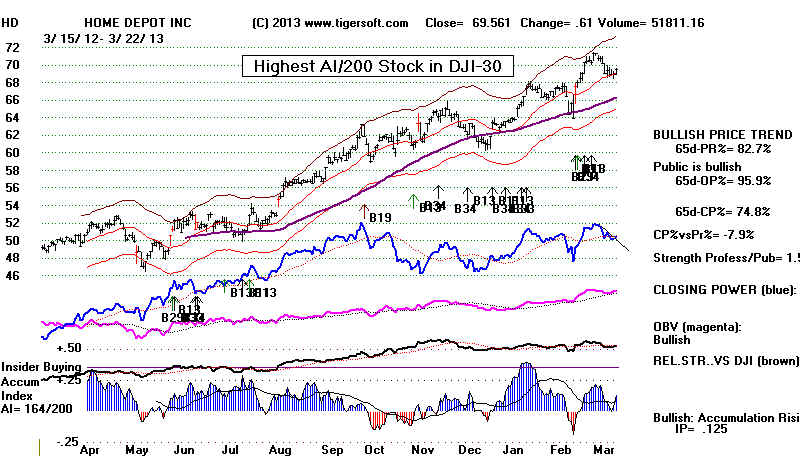
we sold higher on their pull-backs to near-term support now as their Closing Powers
hook back upwards. Our
Stocks' Hotline will buy back some of the high Accumulation stocks
we sold. Look at HD (below), SPNC, TRIB and SGMO.
Until the Closing Powers weaken much more, I would not sell short DIA or SPY,
despite the Sell S15.
Buy DIA or IWM on closing breakouts above 146 and 95. The Sell S15
signal
will be revised if it produces a paper loss of more than 3.% and the DJI closes
above 14800.
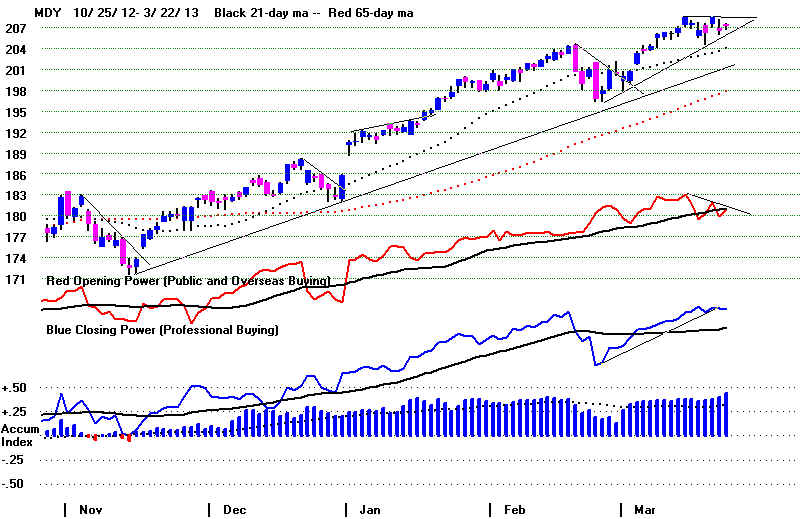
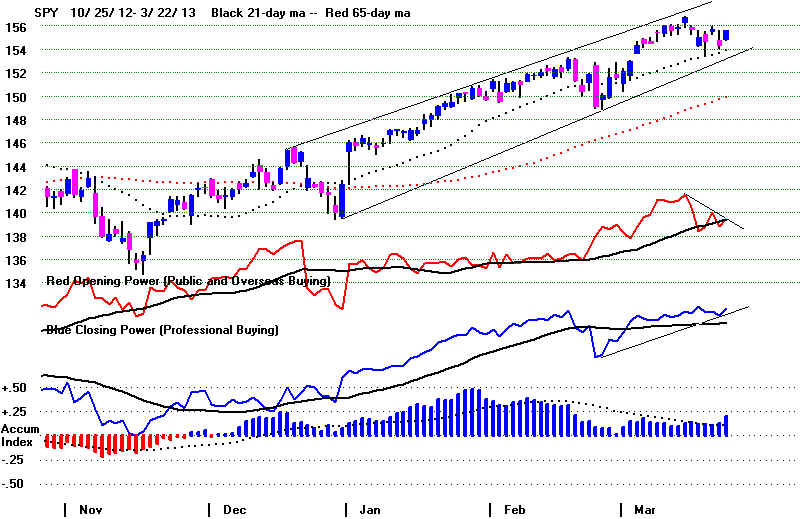
The Tiger CandleStick charts for DIA, SPY, IWM and
MDY show rising Accumulation
and rising Closing Powers. The volume weakness that the negative V-I Indicator picks
up on is not evident in these charts. There is ample precedent for the DJI and DIA
leadign prices higher.
A DIA close above 145.6 would be a bullish breakout into all-time
high terroritory. Short-term traders should play that. MDY, which represents
mid-caps,
would probably breakout, too. That makes it a buy candidate on a breakout. SPY and
IWM are lagging, probably because of big AAPL's weakness. SPY would need to surpass
158 to make an all-time high.
A DJI Move above 14800 Would Cancel The Sell S15
The existing Peerless Sell S15
(which is based mostly on negative V-I readings)
appears to be losing its battle with the Fed's very low interest rates, the confirming
A/D Line, the accelerating DJI price trend, the bullishness of the DJI's all-time high
and steadily positive IP21 readings above +.08. I mentioned that the Peerless
track record would have been improved before the current Sell S15 by disallowing
these signals when the IP21 is above +.08, the adjusted P-I is above +175 and the
65-day pct change is above 7.75%. See Sell S15.
But orthodox Peerless users
will not want to make this change too quickly. If this Sell S15 fails, and produces
a paper loss of more than 3.5%, the Sell S15 will have to be revised.
.
Certainly if the DJI were to close above 14800, being short the market based
on the Sell S15 would be ill-advised. But should we wait that long?
14800 on the DJI would mean a bullish breakout above the upper boundaries of
its rectangle price pattern. It would also mean a paper loss on the Sell S15
above 3.5%. Such a paper loss would not be consistent with previous Sell S15s
going back to 1965. So on a close by the DJI above 14800, I would cancel the
Sell
S15 and issue a "B15" like the "B11", which reversed the S11.
But should we wait so long? Consider the 2 biggest earler S15 paper losses,
These
were back in in February and March of 1936. This was when the V-Indicator could only
be
estimated using trading volume and the ratio of NYSE advances to declines. Look
at the 1935-1936 Peerless chart below. Its momentum in March was too strong
to be stopped by an S15. Only after the A/D Line started to fail to confirm new
highs did a top develop. And that final top had to bring both an S9 and an S12.
The DJI closed 2.6% over the 21-day ma and showed negative non-confirmations
by the P-Indicator, IP21 as well as V-Indicator.
Study Paper Losses of Sell
S15 in 1935
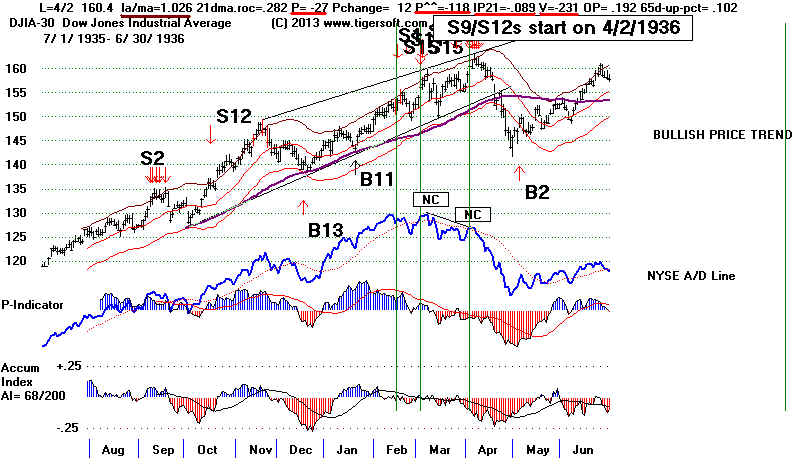
This may be what is in store for us now.
the DJI may keep rising until one of 3 things happen:
1) the A/D Line fails to confirm a new DJI closing high,
as in April 1935 (and before many other big DJI declines),
2) we see a Peerless Sell S9/S12, which we also see at the final
top in April 1935,
3) or the A/D Line breaks its uptrend. When interest rates
were very low in 2001 and 2002, Peerless Seels were followed and
confirmed by A/D Line trendbreaks.
 |
 |
=====================================================================================
OLDER HOTLINES
======================================================================================
3/21/2013
Sell
S15
versus Momentum, NY Professionals and The Fed
More hesitation is very probable for 2-3 weeks, based on the earlier Sell
S15s
taking
place with a confirming A/D Line and strong upward momentum. But see the
accelerating uptrend again that I have drawn on the DJI chart. If that uptrend-line
holds on
its next test, it is quite possible the DJI will advance very powerfully.
This is
what can happen when a accelerating parabolic curve takes control
and there
is a new breakout above resistance. More on this, if this scenario
develops.
I take the operative Peerless signal to be the Sell S15. The
B11 simply tells
us that the
S11's suggested stop loss point was reached. So, that cannot
over-rule
the Sell S15. And the Sell S15 did occur. We can't use incorrect
data
because we don't like the result. As for Sell S15s, I have suggested a
stop loss
of more than 3.3%. With the Sell S15 at 14253.77, a suggested stop
loss here
would occur on a DJI close above 14752. We will revisit this before we
actually employ
it.
Cyprus
Next week, we see
how bad the bank situation in Cyprus is and whether they
are driven out of
the Euro nations. The Europeon bankers' and finance ministers'
demands seem to
be impossibly high. But who knows if they are bluffing? Will depositors
in Greece, Spain,
Portugal and Italy take their money out of theiir banks for
for fear of EEC
bankers doing the same thing in their countries when their country
again needs more
money to keep using the Euro? Will Cypruss start
printing its old
Pound notes again? With what outcome? Having its own currency
would help
promote tourism and exports. But the government there seems to be
much more
concerned about protecting the many off-shore depositors who hold 37% of
all bank deposits
there. Will Russia insert itself as the white knight for orthodox
Cyprus and to
protect its own big depositors in Cyprus? Don't count on
the world's big
bankers wanting to raise the issue of money laudering, tax havens
and banking
secrecy any time soon. And therein lies a big part of why Cyprus is just
a tip of the
financial iceberg.
All these things
do matter here in the US because our big banks have lots of
Europeon
bonds. Given all these unknowns, taking some profits has been
recommended. Professionals got a little more nervous today, but not by much.
Long experience
tells them not to fight the Fed, especially when they often have
inside access to
any big changes.
3/21/2013 ---> To
All Key Index and Lesding Stock Charts
3/21/2013 ---> Tiger
Industry Index Charts
---> 296 -49 MAXCP stocks Bullish MAXCP Stocks (3/21/2013) BULLish plurality
---> 31 -6 MINCP stocks Bearish MINCP Stocks (3/21/2013)
--->35 -74 New Highs on NASDAQ 5 new lows.
BULLish plurality
--->71 New Highs on NYSE
7 new lows. BULLish
plurality
3/21/2013 Key Values: DJI 14421 -90 la/ma= 1.011 21dmaroc = +.413
P= +272 Pch= -4
IP21 = +.115 (on 1/30/2013 IP21 was .293)
V = -4 Opct = .088 65 day-pct-up = .088
Today we
saw more profit-taking in the leading stocks. The DJI is still 1.1% above
the support
of its 21-day ma. So far, the retreat looks minor but the number of advancing
stocks was
the lowest it's been since February 25th. The monthly cycle mwould seem to
explain
this. The 21 trading day monthly cycle puts downward pressure on the market until
a few
trading days before the new month. This down-ward pressure will come to an end
tomorrow or
next week. See the
work of Arthur Merrill. Our own statistics show that after
March 21st,
the DJI falls 60% of the time the next trading day, goes flat for a few days
and then
turns up, so that though the next two weeks are up slightly. April is usally a good
month.
Since 1965, the DJI is up 66% of the time over the next full month.
But 2:1
odds are not conclusive. A lop-sided, biased roulette wheel can still occasionally
hit numbers
it mostly misses. Our signals all have a historical probability of more
than 75%.
Let's study more closely the 3 cases of earlier Sell S15s when the A/D Line
was strong
and confirmed the last new high of the Sell S15.
It
took 3 weeks in the first case (2004) before the DJI broke decisively below the 21-day
ma.
This was after a yea rof rising DJI prices. Only when the P-Indicator turned
down,
did the DJI finally begin to fall. By then the IP21 had turned negative and the
momentum of the 21-day turned down. The DJI was still up 8.4% from 21- days
ago.
The
second case (2005) took place on a false breakout above a 3x test flat DJI top.
The
65-day momentum was much weaker than now. The DJI was up only 4.7% over
its
level 3 months earlier. The DJI now is still up more than 8.5% above what it
was
3
months ago. So this case, is probably not as close a parallel to the present.
The third case (2012) also fought the Fed's Quantitative Easing. And here, too
the DJI was up more than 8.5% above its level of 65 days before. As in the first
case, the DJI wemt sidewise more than 2 weeks before falling to the lower band
and a new Buy signal. Only when the P-Indicator turned negative did the DJI then
fall.
These cases suggest that the DJI will hesitate more than fall over the next 2-3 weeks.
A decline by the P-Indicator or the IP21 (Accum. Index) below 0 would tell us the
support of the 21-day ma is used up. This is interesting because I havce a"
rule of .07"
The odds of the rising 21- day ma being decisively penetrated are less than 50% as long
as the 21-day ma-roc is above +.07 and the IP21 is above +.07. Right now the rising
21-day
ma looks pretty strong. The current 21-day ma roc is +.413 and the IP21 is +.115.
Date DJI
%Gain %-Paper LA/MA A-ROC P-I
IP21
V-I Opct
65-day Pct Change
Loss
PI^^ (Adjusted P-I)
Pct Change
-----------------------------------------------------------------------------------------------------------------------------------------------------
2/11/2004 10737.70 +7.2
0 1.017
.285 +246
.093
-6 .136
.082
3/4/2005 10940.85 +6.6
0 1.017
.381
+251
.093
-15 .14
.047
highest P-I
3/14/2012 13194.10 +3.6 0.5
1.019 .295
+129 .069
-24
.231 .09
3/5/2013 14254.77
1.019 .208
+229
.083 -32
.116 .089
high
high
=====================================================================================
OLDER HOTLINES
=====================================================================================
3/20/2013
Sell
S15
versus Momentum, NY Professionals and The Fed
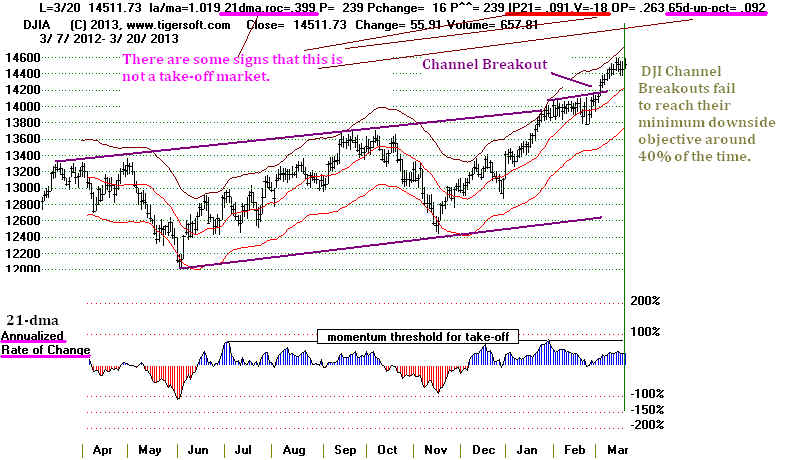
Tonight I want to note the signs that we have not achieved a market
take-off,
despite the low interest rates. In some respects, this is constructive, as it shows
that
an "asset bubble" is not a certainty. But it does show the market may have
a month or more of consolidation before it can go much higher. Sell S15s
can work out even when the A/D Line was confirming the last new closing DJI high.
3/20/2013 ---> To
All Key Index and Lesding Stock Charts
---> 347 +15 MAXCP stocks Bullish MAXCP Stocks (3/20/2013)
BULLish plurality
---> 37 -3 MINCP stocks Bearish MINCP Stocks (3/20/2013)
--->109 + 62 New Highs on NASDAQ 12 new lows. BULLish
plurality
--->213 +133 New Highs on NYSE
12 new lows. BULLish plurality
3/20/2013 Key Values: DJI 14512 +56 la/ma= 1.019 21dmaroc = +.3399
P= +229 Pch= +7
IP21 = +.091
(on 1/30/2013 IP21 was .293) V = -18 Opct = .263 65
day-pct-up = .092
Most Professionals are still playing the market on the upside. Many more
stocks still show high Accumulation and Closing Power strength than vice verse.
Though the red (see below) 10-day NYSE Down Volume is rising again, most Pros
are not yet selling. And sure enough, the market could only manage 3 down days,
before the FED stepped in and assured us that they would continue to keep rates low
for a long while.
Catching a falling knife upside is a good metaphor to describe the risks of
buying stocks when they are in a free fall. What's a good metaphor for
selling short a market whose momentum is getting stronger and stronger?
Actually, the momentum now is steadily up but not getting stronger and stronger.
Not, at least, if we measure it by the annualized rate of the DJI's 21-day ma, which
is under +.40. The .70 level that marked takeoffs in many, but not all, early DJI
take-offs.
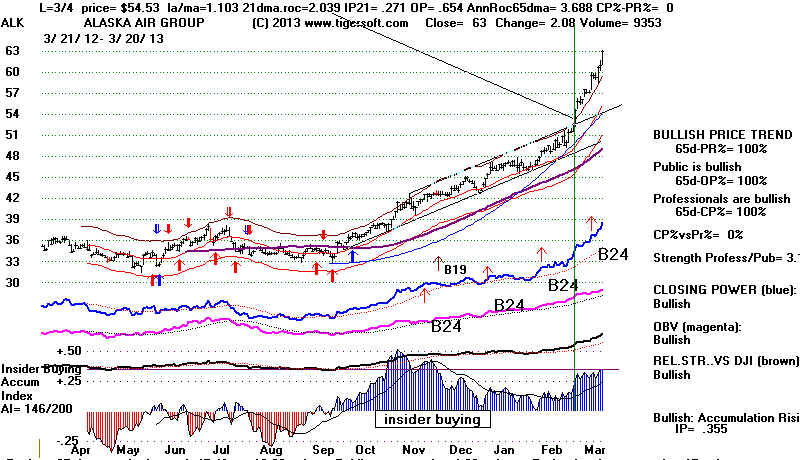
Look at Alaska Air to see how momentum combined with high Accumulation
has leads to much higher share prices. Its 21-day ma at the point of its price
channel breakout was rising at an annualied rate of 203.9%. Its 65-day ma annualized
rate
of change was 368.8%. This is momentum!. Also in contrast, the DJI's
Accumulation now has fallen way off and is now below +.10
Another way, we can spot take-off momentum is with flat topped breakouts into
all-time high. Two weeks ago we had a channel breakout but not a flat-topped
breakout.
The difference is important. The study I did a month ago here showed that the
failure rate
for DJI price channel breakouts was much higher than flat topped (judged B10) breakouts.
And another sign of great market strength is how much the DJI is up over the last
65 trading days. A week or more with the DJI up more than 10% over its level
3 months before would be a sign of great strength. We saw this, for example, in the
January 1987 take-off, in April 1995 and in January 1996, all very good times to
chase stocks. That we have not this year seen a week's
readings on this indicator
above +.10 suggests the DJI may not be able to escape the gravitational pull of
normal over-bought and over-sold status.
But the accelerating uptrendlines are in place and the A/D Line has so far confirmed
the DJI's advance this year. This is a broad market advance.
How important is good breadth? It is very important. But by itself, it
does not
guarantee the DJI will push higher. That, at least was the experience in early
1977 and in 2001 and 2002 when the NYSE A/D Linewas finally broken.
I went back over all the past S15s (There were more than 20.) to see if there were
many cases where the DJI did reverse downward from a new closing high even though
the A/D Line was confirming the advance up to that point. That is the case
now.
The A/D Line is very strong. That is a reflection of low interest rates and, more
and
more, an improving US economy. Actually, there were 3 Sell S15s when the
DJI reversed even though the A/D Line was confirm the DJI strength at the time
of the Sell S15s. See all the Sell S15s and the A/D Lines
here. Below are the
3 cases where the A/D Line did confirm the DJI high on earlier Sell S15s.
Interestingly,
two were in March: 2/11/2004, 3/3/2005 and
3/14/2012.
===================================================================================
OLDER HOTLINES
===================================================================================
3/19/2013
Sell
S15
versus Momentum, NY Professionals and The Fed
Foreign Markets Have Turned Down Much More Than The US Stock Market.
Using the corrected data for 3/4/2013, Peerless now has a Sell S15 signal
to caution us to do some profit-taking and hedging. I have not suggested
shorting SPY because the momentum is strong, the A/D Line is still
rising and the Closing Powers are still in uptrends. In the comments
here and at Sell S15, you can see that I have questioned this Sell
S15
because the P-Indicator is above +200 and the 65 day pct. change is above
7.75%. Usually, the A/D Line was lagging at the time of earler Sell S15s
Here it is not. That is the reason I suggested that some of you may want
to wait to sell and use an A/D Line trend-break for deciding when. to sell.
I have tried to avoid making more work for myself. So since paper losses
of 2% to 3% were not uncommon with Sell S15s, I have decided to stand by it.
See below that I like using accelerating price uptrendlines when there has
been a breakout, such as we saw at 14200, above the channel resistance.
(Tomorrow I will show more examples of this curved uptrendline. The programs
should also a slope where the curve decelerates. They do not now.)
NY Professionals remain quite bullish. The Closing Powers for the key ETFs
have hardly dropped in this 3-day decline. Each early sell-off is followed
by a good recovery. This is usually a reliable sign of strength. For SPY,
higher openings have accounted for only 1.98 of the 11.23 points SPY has gained,
while closes above the opening have caused 9.25 points' rise.
Now the green Opening Power for SPY is back to its rising 21-day ma. Watch to see
if the Opening Power turns up. This represents overseas net buying as much as it
represent Public buying. We have to wait another day or two to see what happens
in Cyprus when the banks re-open after depositors were suddenly told that the
north Europeon big banks would be taking a hefty percentage of depositors'
money for debts undertaken by their country.
Another few trading days down is what the DJI typically shows after March 19th.
However, over the next month is up 70.2% of the time. The average DJI gain is 1.5%
in this period. The most typical mmediate
aftermath of triple-witching Friday, March 15th
is a decline to the lower band.
Sell
S15s often come early. This could well be one of those cases. If the
DJI
does rally, we will need to see how broad the rally is. See below the biggest
paper
losses for Sell S15s after 1965 in the 2nd quarter. Right now the A/D Line
is
stronger than the DJI. That was not true in these two cases. This suggests
a
stronger market now than in either of these two cases.
4/6/72 1.0% maximum paper loss on Sell S15
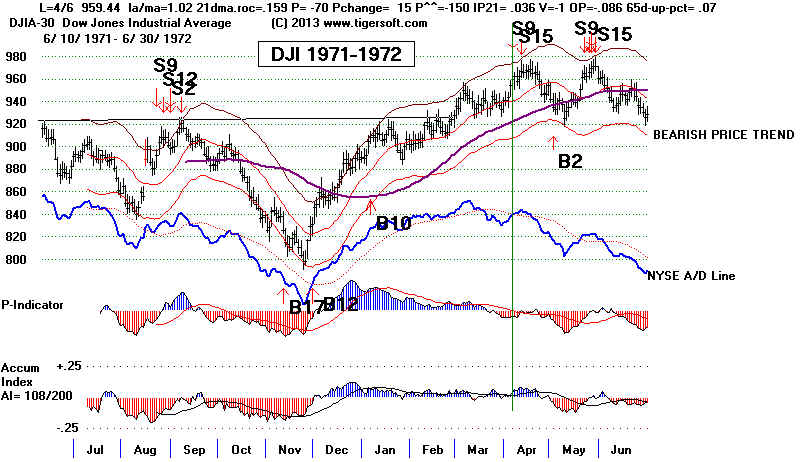 |
4/14/92 3.2% maximum paper loss on Sell S15 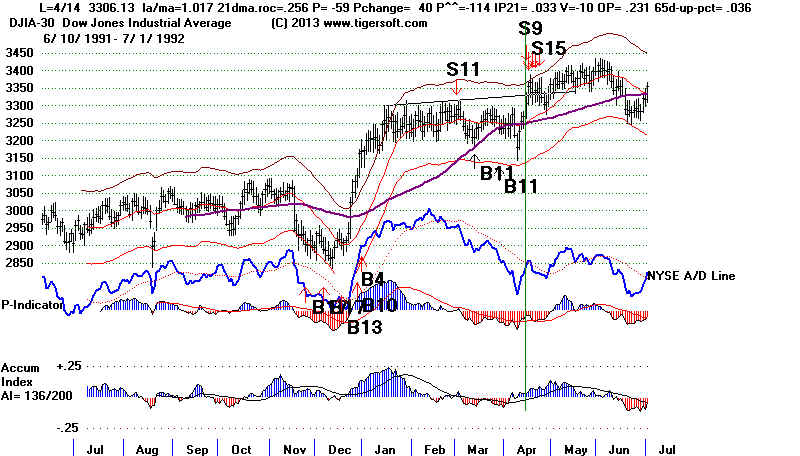 |
Europe's Crises Help The Dollar and That Helps The Fed Boost US
Stocks
So
far, each crisis of the EURO has given the US Dollar a boost. A lot of nervous hot
money
has
come here. The Feds have taken advantage of the Dollar's strength to continue
very
low interest rate policies. So, for now, the blunders of the Europeon bankers
have
served to boost the Dollar, US bonds and US stocks. But if the Depression in
parts
of Europe continues, the whole EEC experiment could come undone. Bond holders
in
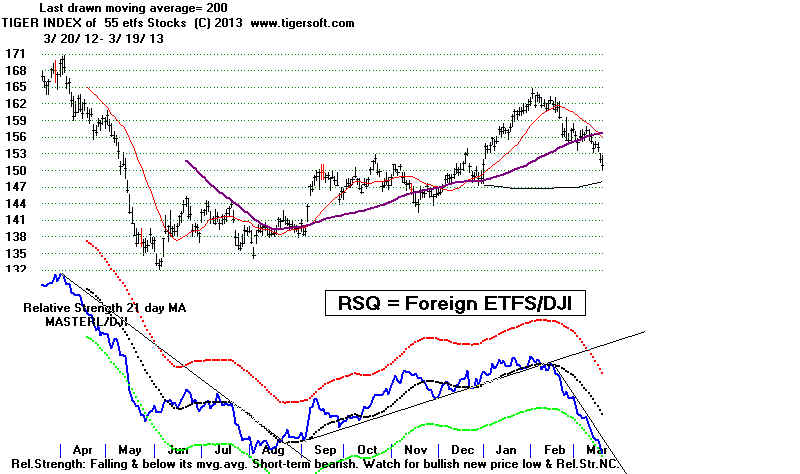
these countries will get more than a hair-cut. The Tiger Index of Non-US ETFs
now
shows a serious breakdown below support. Serious economic turmoil in Europe will
hurt
US stocks. But the waves take time to cross the Atlantic.
Non-US Stock Markets Have Been Hit Hard.
The
EURO and the EEC Central Bankers keep muddling through from one crisis to
another. The core problem of high regional unemployment is beyond them. Local
currencies are the only way out. But this is, of course, not acceptable to the
central
bank elites. It's very clear that these bankers are getting very nervous. They
have
their stock markets going up with talk of easing austerity and protecting big lenders
but the economic projections remain gloomy for Italy, Spain, Portugal and
Greece.
Actually "dismal" is probably more accurate. So how much longer will the
people in these
pooerer counies put up with their own governments failed efforts to protect the average
people from the demands of the central bankers as transmitted through their local
political minions? Sooner or later, one or more these countries will decide to break
free
and control their own monetary and fiscal policies.
3/19/2013 ---> To
All Key Index and Lesding Stock Charts
---> 332 -126 MAXCP stocks Bullish
MAXCP Stocks (3/19/2013) BULLish plurality
--->40 -9 MINCP stocks Bearish MINCP Stocks (3/19/2013)
--->47 New Highs on NASDAQ 10 new lows. BULLish
plurality
--->80 New Highs on NYSE 14
new lows. BULLish
plurality
3/19/2013 Key Values: DJI 14456 +4
la/ma= 1.017 21dmaroc = +.398 P= +222 Pch= -18
IP21 = +.108
(on 1/30/2013 IP21 was .293) V = -21 Opct = .266 65
day-pct-up = .083
=====================================================================================
OLDER HOTLINES
=====================================================================================
3/18/2013
Our Sell S15 Cannot Be Dismissed. A
Profit-Taking Retreat
to 14000 Is Probably Unavoidable while Europeon Central Bankers
and Finance Ministers Scramble To Undo The Damage
To Confidence They Themselves Have Caused.
NYSE Professionals Keep Buying. They expect the Fed
to offer assurances tomorrow that they stand ready to
bolster US banks and bonds. But the Cypress Crisis shows
just how bad the judgement of Euro Bankers is. Insead of
shoring up the the Cypriot Banks, their proposed confiscation
will surely cause a widespread "bank run" there.. And that
that could spread to Spain, Greece and Italy. Such a widening
contagion would surely negatively impact US banks, too.
On our Stocks' Hotline, I have decided to take some more profits and
sell
short more stocks, so that we are now weighted fairly heavily short.
The
rally that we have recently seen since the DJI got past 14200 would not be out of
the
ordinary for a Sell S15, as 20% of them initially produce paper losses of more
than
2.5%. The Sell S15 also gives us a way to lock in some nice profits.
So, I
have not rescinded the Sell S15. More selling and hedging seem reasonable.
While I would like to discount or
even dismiss the Peerless Sell S15 because
the P-Indictor remains very
positive and the DJI is up more than 7.8% in the last
65 days, the situation here
could get much worse very quickly if Cypriot banks
fail
and the country is forced to leave the Euro and print its own currency.
Because Cypress
is so
small and the stakes are so large, I would think the Europeon Central Bank
is
now rethinking its refusal to extend more credit to Cypress and its banks.
But
who knows? Professionals in the US think this will quickly all pass like a tropical
thunder squall. What I do know is that if the US Professionals do change their
minds and
begin
to sell in earnest, we better, too! So, watch the DJI 14200 support. It should
not
be
broken. Watch the NYSE A/D Line uptrend. A break in it would be bearish.
And
of course, watch the Closing Power for SPY. If it breaks its uptrend, the
rising 21-day ma will be tested and if that is broken, 14000 on the DJI and 148
on
SPY will come next.
3/18/2013 ---> To
All Key Index and Lesding Stock Charts
---> 458 MAXCP stocks Bullish
MAXCP Stocks (3/18/2013) BULLish plurality
--->49 -78 MINCP stocks Bearish MINCP Stocks (3/18/2013)
--->58 New Highs on NASDAQ 6 new lows. BULLish
plurality
--->68 New Highs on NYSE 9
new lows. BULLish
plurality
3/18/2013 Key Values: DJI 14452
-62 la/ma= 1.018 21dmaroc
= +.402 P= +240 Pch= -31
IP21 = +.119
(on 1/30/2013 IP21 was .293) V = -21 Opct = .275 65
day-pct-up = .082
The Fed To The Rescue Again
I expect that the FED will say tomorrow that it will always be ready to
ensure the safety of US banks and rescue of bond holders, if needed.
For a while, it will succeed. Bonds may go up a few days more,
as foreign hot money moves into US Dollars with the EURO's fate
in doubt because of threat of widespread bank runs later this week
that will probably push Cypress Banks into bankruptcy. My sense is
that the only way out if this happens will be for Cypress to print its
own currency. But this is heresy to the central bankers. It could set
the pattern for Greece, Portugal and Spain and end the EURO's
dominion in these countries.
All this was brought on because the bankers'
government in Cypress
and
the usual north Europeon Finance Ministers thought that Cypriots would just
stand
by while their money was stolen by bankers to pay for the
banks'
own missteps. Big surprise. They will not!

The dangers for the EURO have suddenly got worse. What if
people
in other countries start pulling their money out of banks because
they fear similar confiscations? The bungling finance minsiters have
made things much worse. Interest rates are so low, hiding the money
under a matress makes sense. How then banking system continue
when there are no deposits? These strains, stresses and contradictions
will get worse until full employment is restored. But short-sighted
orthodoxies and fears that governments might do a good job as the
employer of last resort prevent the ruling elites from seeing their
own long-term interests. Instead, in desperation, they clumsily try to
confiscate depositors' funds. The perception that central bankers are well-
dressed thieves will be a hard one to shake.
=====================================================================================
OLDER HOTLINES
=====================================================================================
3/15/2013 1/6
Chance for A Decline to The Lower Band. There
Was A Sell S15 on
March 5th with Corrected Data. We Have To Be
More Hedged and
Take Some Profits.
Usually good bread
and momentum win out over weak Volume.
But not always.
Will the very weak Bond Market spill over to the
stock market.
The steeper the
decline in Bonds, the more the risk to stocks because
of Margin Calls
and the higher risk of a jump in Interest Rates.
If we take the Sell S15 now as the active signal (and for reasons explained below, this
should be questioned, I think.) we see that paper losses of 2.0% or more occurred in
about
20% of the Sell S15s. This would be another case. The Sell S15 occurred
on
3/5/2013 with the DJI at 14253.77. It has since risen to a high closing
of 14539.14.
Had
we taken this signal at the time, it would have produced a 2.0% paper loss.
The
10-day winning streak of the DJI was broken Friday on unusually high volume.
After
a rally, this is bearish. See the red circles where volume was high.
The
DJI did reach a point 2.8% over the 21-day ma. the day before. The DJI has not
closed more than 3.5% over the 21-day ma since October 2011. So the upside would
seem
to be limited unless the high priced DJI stocks like IBM, MMM and CVX
attract very aggressive new buying. Watch them this coming week. They were
the
leaders.
A
decline back to the rising 21-day ma now at 14167 (and rising 25 points a day) would
seem
likely and might actually be healtier than a run straight up to 15000. I doubt if
such
a
decline would take the DJI below the point of breakout at 14200. Breadth and
the
A/D
Line have been too strong and, as we've seen time and again, Professionals keep
resuming their buy programs after mid-day.
If we look
at the market's key values for Thursday in the past, namely
V-I < 5
LA/MA >1.0285
IP21 > .10
P-I >100
65-day Pct Change > .09
we see a
serious decline is relatively unlikely in the next 6 weeks. There was one such
decline in
the 6 past parallels found. See below. An additional 4% to 9% DJI rally
occurred in
3 of the 6 cases. In 2 cases, the DJI went slighlty higher and then pulled
back
to just
below the 21-day ma. So, without a Sell S9, Sell S12 or a head/shoulders pattern
as in May
2010, it usually takes a while to reverse the momentum inherent in a market
that is up
more than 9% in 3 months. Here are the cases since 1980:
Past Cases with Key Values Similar to 3/14/2013 Date DJI LA/MA P-I IP21 65-ch Short-Term Result
--------------------------------------------------------------------------
8/7/1980 950.94 1.031 131.6 .154 .140 2% further rise
and then 4% fall.
10/7/1982 965.97 1.049 118.14 .104 .181 9% further rise
DJI was up 6% in two days after B9
1/31/1996 5395.3 1.042 100.19 .207 .116 4% rise in a week.
11/12/1996 6266.04 1.031 104.00 .128 .096 5% rise in 2 weeks
2/13/1997 7022.44 1.031 101.67 .125 .116 1% further rise
This was also a Sell S9 Then 10% decline. then 10% decline.
11/25/2009 10464.4 1.030 175.43 .168 .095 DJI went narrowly
sidewise for a month.
3/14/2013 14539.14 1.028 306.90 .110 .105 ???
|
I Would Discount The "New"Sell S15 of 3/5/2013
You will
note a new signal has appeared when the Peerless signals are super-imposed on
the DJI
chart. This is the S15
on 3/5/2013. It occurs if the data for 3/4/2013 is corrected.
Several
readers had called my attention to what they they thought was an error in the
data as I
got it from Dial Data and Yahoo. They were right. I had taken the
theortetical
high to be
14130 instead of 14160.19. Yahoo was wrong. I took the highs of the 30 DJI
stocks
and using
the divisor recalculated the theoretetical high. I did not trust Barrons. They have
made some
mistakes recently, switching the theoretical with the actual trading high.
But their
14160.19 number checks out. My thanks to those who noticed this.
I do think
that the "new" Sell S15 produced by the new data is questionable.
It is based
on the V-Indicator being negative. But here it occurs with the P-Indicator
above +175
when the DJI is up more than 7.5%. If you look at the history
of Sell S15s, you will see this
set of conditions has failed before.
Sell S15s, Gains, Paper Losses and Key Values
Date
DJI %Gain
%-Paper LA/MA A-ROC P-I
IP21 V-I
Opct 65-day Pct
Change
Loss
PI^^ (Adjusted P-I)
Pct Change
2/18/36 153.4 + 3.1 6.8 1.029
. 608 57
.016 -28 .18
.064
PI^^ = 255
--------------------------------------------------------------------------------------------------------------------------------------------
3/4/36 156.7 +5.2 4.6
1.028 .477
28 -.016 -139
.033 .092
---------------------------------------------------------------------------------------------------------------------------------------------
4/1/36 158.9 +6.5
1.4 1.018 .206
-40
-.097
-265 .207 .101
---------------------------------------------------------------------------------------------------------------------------------------------
2/10/37 189.4 +12.6
2.6
1.019 .391 -10
.034 -202
.055 .037
----------------------------------------------------------------------------------------------------------------------------------------------
3/5/37 194.1 +14.7 0.1
1.028 .373
-15
.037 -231
.092 .056
-------------------------------------------------------------------------------------------------------------------------------------------------
1/5/60 685.5 +9.8
0 1.018
.40
4
-.038
-170
.095 .079
-----------------------------------------------------------------------------------------------------------------------------------------------
3/26/70 791.05 +18.9
0
1.019
.35 -24 -.017
-1
.055 .006
--------------------------------------------------------------------------------------------------------------------------------------------------
4/6/72 959.44 +5.0
1
1.020
.159 -70 .036
-1
.086
.045
--------------------------------------------------------------------------------------------------------------------------
5/25/72 969.07 +5.9
2.2 1.025
.279
-10 .004 -1
.225 .059
--------------------------------------------------------------------------------------------------------------------------------------------------
1/5/1973 1047.49 +8.9
0.4 1.023
.238 -77
.039 -2 .053
.09
---------------------------------------------------------------------------------------------------------------------------------------------------
3/24/76 1009.21 +4.2
0
1.024 .192
-64
-.033 -1 .293
.165
----------------------------------------------------------------------------------------------------------------------------------------------------
4/21/76 1011.02 + 4.4
0
1.019 .345
-1
.038 -1
.07 .067
-----------------------------------------------------------------------------------------------------------------------------------------------------
2/13/80 903.84 +14.0 0
1.028 .478
-26
-.01
-1 .206 .108
-----------------------------------------------------------------------------------------------------------------------------------------------------
4/24/81 1020.35 +17.4 0
1.018 .061
1
-.012
-1
.11 .073
biggest
------------------------------------------------------------------------------------------------------------------------------------------------------
1/2/90
2810.15 +7.5
0 1.028 .453
36
.08 -4
.093 .04
-----------------------------------------------------------------------------------------------------------------------------------------------------
4/14/92 3306.13 +1.6
3.2 1.017
.256
-59 .033 -10 .231
.036
biggest
-------------------------------------------------------------------------------------------------------------------------------------------------------
4/21/98 9184.94 +16.9 1.7 1.024
.37
13
.045
-7 .056
.056
--------------------------------------------------------------------------------------------------------------------------------------------------------
1/7/2000 11522.56 +4.8 1.7
1.021 .48
-23
-.028 -59
.341
.083
highest AROC
highest OPct
--------------------------------------------------------------------------------------------------------------------------------------------------------
2/11/2004 10737.70 +7.2 0
1.017 .285
+246
.093
-6 .136
.082
---------------------------------------------------------------------------------------------------------------------------------------------------------
3/4/2005 10940.85 +6.6 0
1.017 .381
+251
.093
-15 .14
.047
highest P-I
-------------------------------------------------------------------------------------------------------------------------------------------------------
5/1/2008 13040
+12.7
0 1.029
.405 +178
.047 -28
.076 .043
--------------------------------------------------------------------------------------------------------------------------------------------------------
X Dubious because P-I
>+200 and 65 Pct change is over .085 (8.5%)
1/4/2012 12418.42 -1.3 1.3 1.025
.393
+211 -.045 -4
.10 .121
high
highest
----------------------------------------------------------------------------------------------------------------------------------------------------------
3/14/2012 13194.10 +3.6
0.5 1.019
.295
+129 .069
-24
.231 .09
---------------------------------------------------------------------------------------------------------------------------------------------------------
5/1/2012 13279.32
+2.9 0
1.018 .061
+78
-.003 -87
.036 .046
--------------------------------------------------------------------------------------------------------------------------------------------------------
X Dubious because
P-I > +200 and 65 Pct change is over .085 (8.5%)
3/5/2013 14254.77
1.019 .208
+229
.083 -32
.116 .089
high
high
=======================================================================================
N= 23 or 25 Avg Gain =
8.35%
Avg Paper Loss = 0.88% |
3/15/2013 ---> To
All Key Index and Lesding Stock Charts
---> 413 -1 MAXCP stocks Bullish
MAXCP Stocks (3/15/2013) BULLish
plurality
---> 122 +15
MINCP stocks Bearish MINCP Stocks (3/15/2013)
--->109 New Highs on NASDAQ 9 new lows. BULLish
plurality
--->184 New Highs on NYSE 15
new lows. BULLish
plurality
3/15/2013 Key Values: DJI 14514
=25 la/ma= 1.024 21dmaroc = +.447 P= +271 Pch= -35
IP21 = +.128
(on 1/30/2013 IP21 was .293) V = -6 Opct = .276 65 day-pct-up = .092
====================================================================================
OLDER HOTLINES
====================================================================================
3/14/2013 No Peerless
Sell.
DJI Is Now Running Easily in All-Time High Territory.
It is 2.8%
over its 21-day ma. Expect the upper 3.5% to act as resistance.
But with
the DJI up 9.5% over its level 65 trading days ago, there is probably
too much
momentum The upper 3% band is now at 14537 and rising 10 points
a day.
Led by IBM
(+3.74 ) and CVX (1.64) the DJI moved higher and higher all day,
NYSE
Breadth was a healthy 2:1 on the upside with NYSE Up Volume almost 3 times
its Down
Volume. We have no Peerless sell signal since the reversed Sell S11.
Professionals are much more heavily buying than selling short, except for
Bond Funds
and Gold Stocks, both of which often move down when the stock
market is
very strong. Note that both the Public and Professionals are net buyers.
The DJI is
now opening higher and going still higher at the close most days. We
see this in
the fact that both Opening and Closing Power are in uptrends. This is
very
bullish, at least until Closing Power finally breaks it uptrend.
Bond Bubble
There is
still no media discussion now that I can find of a bond bubble. That was
also true
of the housing bubble in 2005 and the Chinese stock bubble of 2007.
Some bond
fund investment advisors are dismiss the idea of a bubble, by maintaining
that the
steep decline in bonds now is mostly in Municipal Bonds, It is occurring, they say,
because the
tax exempt status of "MUNIS" may be changed in the budget negotiations
now said to
be going on. Maybe. But all the Bond Funds look terribly weak.
If I were
to design a perfect bearish chart, an ideal one, that all others might strive
to avoid,
I could not make an uglier chart now than those shown among the most
"bearish" Bond Funds in our MINCP charts. They have it all:
head/shoulders patterns,
increasing volume on the neckline breaks,
Closing Power falling at a 30-degree angle on a yearly chart,
many, many red Sell S7s,
Public Buying despite the decline and
massive amounts of Red Distribution signiying insider selling.
The Essence of Bearishness
The Fed May Lose Control of Interest Rates
I have to
stick with my view that the stock market's rally is showing us
that the
economic recovery is slowly accelerating. If so, stocks will draw more
and more
money out of bonds. Demand for loans will push up rates inevitably.
And the
up-trends could accelerate. Inflation is not a factor now. The Dollar
is strong.
But at some point, if inflation does return or the Dollar does turns
down that
will put added pressure on the Fed to protect the Dollar and raise rates.
In essence,
it seems unlikely that the Fed can keep 10-year rates at the levels they
were in the
1940s.
10-year Treasury Yields
-
3/14/2013
---> To All Key Index and Lesding Stock
Charts
---> 414 +98 MAXCP stocks Bullish MAXCP
Stocks (3/14/2013) BULLish
plurality
---> 107 +44
MINCP stocks Bearish MINCP Stocks (3/14/2013)
--->176 New Highs on NASDAQ 9 new lows. BULLish
plurality
--->293 New Highs on NYSE 17
new lows. BULLish
plurality
3/14/2013 Key Values: DJI 14539
+84 la/ma= 1.028 21dmaroc = +.439 P= +307 Pch=+7
IP21 = +.132
(on 1/30/2013 IP21 was .293) V = +4
Opct = .373
=================================================================================
OLDER HOTLINES
=================================================================================
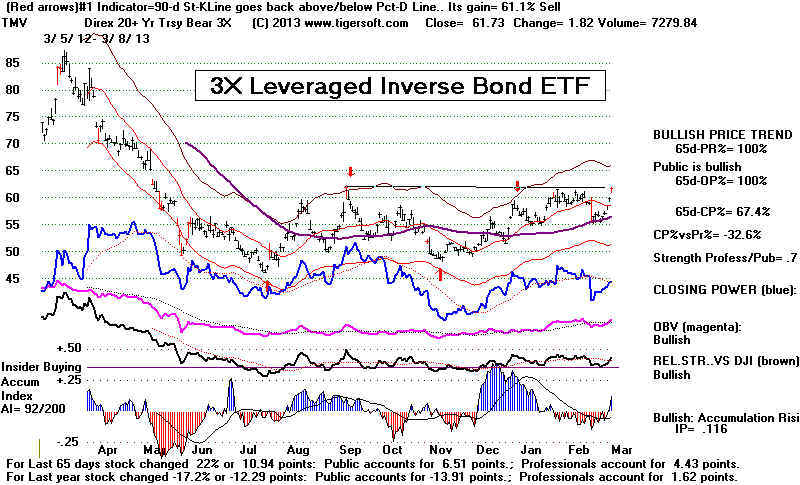
3/12/2013 Money Keeps Coming Out of Bond Funds and Is Moving into
The DJI.
There is a risk
that their cave-in could get much worse and that would bearishly
affect stocks.
But mostly, when bonds go down, confidence in stocks is swelling
and they rise.
I consider
Peerless to still be on a Buy because of breakout past 14200 into
all-time high
territory. If the breakout fails, and the DJI falls back below the
expected 14200
support, then we may have to reconsider things, but for now I
consider Peerless
to still be on a Buy.
-------------------------------------------------------------------------------------------------------------------------------------------------------
3/13/2013
---> To All Key Index and Lesding Stock
Charts
---> 316 +17 MAXCP stocks Bullish MAXCP
Stocks (3/13/2013) BULLish
plurality
---> 74 +2
MINCP stocks Bearish MINCP Stocks (3/13/2013)
---> 81 New Highs on NASDAQ 11 new lows. BULLish
plurality
--->155 New Highs on NYSE 8 new lows.
BULLish plurality
3/13/2013 Key Values: DJI 14455
+5 la/ma= 1.024 21dmaroc = +.409 P= +300 Pch=+33
IP21 = +.125
(on 1/30/2013 IP21 was .293) V = -1 Opct = .352
-------------------------------------------------------------------------------------------------------------------------------------------------------------------
Professionals Remain Bullish
Professionals are still aggressively buying many more stocks than they are
shorting.
The number of MAXCP stocks tonight is 316 while the number
MINCP
stocks is 74. Of the MINCP stocks, 47 are Bond Fund ETFs.
This should
alarm bond holders. Volume is rising, but it is not yet at the levels
seen at the
June and December lows. Prices have broken these lows' support.
Even a
short-term selling climax has not been reached. The Head/Shoulders
pattern in
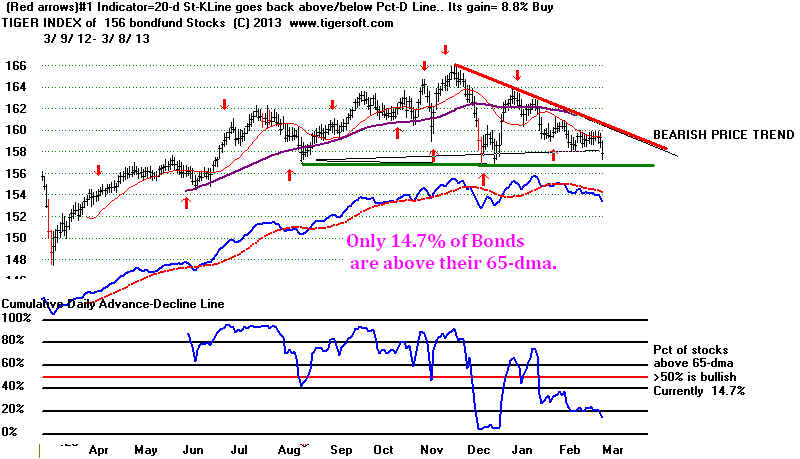
our TigerSoft Bond Fund Index is still more than 5% lower.
Bond Funds Continue To Fall
without Any Headlines or Public Fanfare.
What Groups Are Represented in
the MINCP Stocks Tonight
Gold Mining Stocks: ABX, ASA, EGO, GG, SID,
Bond ETFs: AFB,
BFK, BFZ, BKCC, BKK, BNA, BTA, CAF, CXE, DSM, FAX,
GGN, ITM, LEO, MCA, MIY, MNP, MQT, MSD, MT, MVF, MYD, MYJ, MYM,
MYN, NAC, NAD, NCP, NIF, NIO, NMA, NMD, NMO, NMZ, NNC, NPT, NRK,
NUC, NHO, NVC, NEV, OZM, PML, PMM, VKI, VMO, VR,
Biotechs: ARNA, EBS, VPHM
Short ETFs: DOG, DXD, SHM,
Others: CLF, COH, EPU, EXAS, FNSR, IMO, LF, NOV, ROST, TAC, TAN, TCK,
TDS, VICR, VOCS, WTR,
Remeber
that the DJI is at an all-time high and broke above well-tested rising
resistance
at 14200. I would judge there is 250 points downside potential
and nearly 500
points upside potential in the DJI. Until we get a new Peerless
Sell Signal, a
head/shoulders top or the Closing Powers break below their
21-day ma, I
would play the long side and give the market more chance to advance,
with a few
exceptions, the most notable being taking short positions in bond funds
and a few of the
other Bearish MINCP stocks.
As I've shown,
significant tops do sometimes occur in March, but usually later
than that.
The DJI's Day Up-Streak Is Proably Bullish
The DJI has now
risen 9 days in a row. The longest streak, 13 days in a row, since 1945
was in early 1987
right beforea 20% advance in 4 months.
See Table 2
below. In 6 cases the DJI rose 1% to 3% more before a top. In 9
cases
it rose 5% or,
at least, a month more. In 7 cases it was
at or within a week of a
sell-off. This roughly gives us a 2:1 probability of a move still
higher.
Where the DJI was
up 9% to 11% from 65-day ago, as now, we see the 5 cases
shown in
tonight's Table-1. In 4 of them the DJI moved significantly higher.
In one case, the
P-Indicator finally turned negative and an obvious head and
shoulders top
appeared.
Streak Up Pct
Result
ended 65-days
at X
days up:
-----------------------------------------------------------------------------------------------------------------------------
TABLE 1 What Happens When DJI Is Up 9
Straight Days and Up 9%-11% over
the last 65 trading days?
1) 9/2/55 10
9.9%
2.9%
Peerless gain follows. Top is a week
later.
-------------------------------------------------------------------------------------------------
2) 1/13/67 9
9.7%
6.3%
Peerless gain and 14 week advance.
--------------------------------------------------------------------------------------------------
3) 4/16/71 10
10.5%
one week away from important
top.
--------------------------------------------------------------------------------------------------
4) 7/14/89 9
+9.2%
8.5% Peerless gain and Sell 10 weeks later.
---------------------------------------------------------------------------------------------------
5) 11/14/96 10
+10.2%
10.3% Peerless gain over next 3 momths
----------------------------------------------------------------------------------------------------
TABLE2
What Happens When DJI Is Up 9 Straight
Days?
Streak Up Pct
Result
ended 65-days
--------------------------------------------------------------------------------------------------------------------------5/17/48 10 13.0% +1.5% gain 3 weeks later.
---------------------------------------------------------------------
10/20/48 9 2.8% +1.8% Peerless gain at
top only a week away from a significant top.
----------------------------------------------------------------------
2/6/50 9 7.3% Big Peerless gain follows
Advanced for 4 more months
----------------------------------------------------------------------
9/14/54 9 8.4% Much higher prices follow.
-----------------------------------------------------------------------
1/28/55 11 12.0% up another month before quick decline to LB
-------------------------------------------------------------------------
4/18/55 9 7.0% Decline to rising 65-dma followed.
-----------------------------------------------------------------------
6/27/55 9 7.8% 2.3% Peerless gain follows. Top is a week later.
-----------------------------------------------------------------------
9/2/55 10 9.9% 2.9% Peerless gain follows. Top is a week later.
-----------------------------------------------------------------------
7/7/59 10 7.8% 2.9% Peerless gain follows. Top a month later.
-----------------------------------------------------------------------
11/30/59 10 7.4% 1.8% Peerless gain follows. Top is a week later.
-----------------------------------------------------------------------
3/18/64 9 7.2% DJI went sidewise.
-----------------------------------------------------------------------
2/3/65 9 3.6% DJI pulled back to 65-dma immediately.
----------------------------------------------------------------------
1/13/67 9 9.7% 6.3% Peerless gain and 14 week advance.
-----------------------------------------------------------------------
4/25/67 9 4.9% One week before decline to LB.
-----------------------------------------------------------------------
5/3/68 9 6.0% DJI turned down and fell to LB.
------------------------------------------------------------------------
12/2/70 12 4.7% 16.8% Peerless gain and 6 month rally.
------------------------------------------------------------------------
1/26/71 9 10.1% 8.1% Peerless gain and 4 month rally.
---------------------------------------------------------------------------
4/16/71 10 10.5% one week away from important top.
---------------------------------------------------------------------------
7/26/73 10 -0.7% Major TOP
---------------------------------------------------------------------------
1/14/87 13 +12.0% 18.2% Peerless gain and Sell 4 months later.
---------------------------------------------------------------------------
7/14/89 9 +9.2% 8.5% Peerless gain and Sell 10 weeks later.
----------------------------------------------------------------------------
12/31/91 11 +5.1% 3.6% Peerless gain and sell 2 months later.
----------------------------------------------------------------------------
5/20/96 9 +3.4% Top occurs one week later.
---------------------------------------------------------------------------
11/14/96 10 +10.2% 10.3% Peerless gain over next 3 momths
----------------------------------------------------------------------------
3/13/13 9 +9.5% ????
|
DJI HIGH FOR 3/4/2013 - DATA ERROR?
The DJI's high Data that we have used for 3/4/2013 should, perhaps,
be changed to
14160.19. The data we used was what was provided us from
Dial Data and was
the same that appeared in Yahoo that night. But Barrons'
and the Wall
Street Journal data is what we have tried to use everywhere.
However, if I put
the 14160.19 number in place of our number (14128.21) it would
have given us a
Sell S15 a week ago. Making a change now makes too much
work at this
stage. More important, it is not clear that March S15s are reliable.
And most
important, I have spotted recent errors in Barron's theoretical
and trading
highs, where they have reversed the numbers. So, for all these reasons,
I'm going to keep
on using the 14128.21 number.
===================================================================================
OLDER HOTLINE
===================================================================================
3/12/2013
Hedge by Shorting The Lowest Power Ranked
Bond Funds.
Only A Shallow Retreat Seems Likely,
I Consider The Peerless Sell Signal Cancelled.
Today's DJI marginal new high was accomplished mainly because of unusual strength
in MRK and in two of the highest priced DJI stocks, BA (+1.22), IBM (+.47).
The DJI advanced alone. The Blue Chips are haven for those selling bonds, just
as biotechs are often bought by speculators when other tech stocks appear
over-bought.
The NYSE A/D Line failed to confirm today's rally. The NASDAQ losr 10.55,
the NYSE fell 22, the SP-500 dropped back 3.72, the OEX dipped 2.44 and
the Value Line shed 5.73. This is a divergence, but I doubt if it is bearish
enough to bring much of a decline. For that we will need to see a new Peerless
Sell Signal and/or a head/shoulders top.
The only scenario I can see which would bring about a serious DJI decline now
would be if bonds fall apart and investors and big banks rush to sell them
to them in a panic and margin calls ensue. That is a possibility. See the
now completed Head/Shoulders in the Tiger Index of Bond Funds and rise
of red high volume.
Expect the Fed to try to prevent this. Expect to see one of Bernanke's
cohorts on the FED say that that they will keep rates very low in order
to prevent undue strains on the market (and big banks). But that could
be a losing battle if unemployment falls to 6.5% later this year or
early next year.
The DJI Momentum Is Very Bullish
The DJI is now 2.5% over its 21-day ma. It has been 18 months since
the DJI was able to rise past the resistance of the 3.5% upper band, now
at 14600. So, its immediate upside appears limited, barring unexpectedly
bullish news. That does not mean there will be much of a decline in the
next month. 14100-14200 was the point of recent breakout. It will
likely act as support if there is a decline.
History suggests that the DJI is likely not to decline by much. When we look
back at the past since 1965, we see the DJI continues to rally even though the
V-Indicator is negative at the 2.5% upper band when:
1) the DJI is more than 10% above its level 3 months ago,
2) the P-Indicator is very positive and
3) the IP21 is above +.10.
The Sell S11 did not allow for this factor, the percentage up from 65-days
ago. The DJI was up 10 9%
from 65 days before on the day of the Sell S11
on 2/22/2013. That seems to be an important consideration. I want to
add a new band line that lets users display this 10% up line for all charts.
I want to see if this should be considered in other Peerless signals.
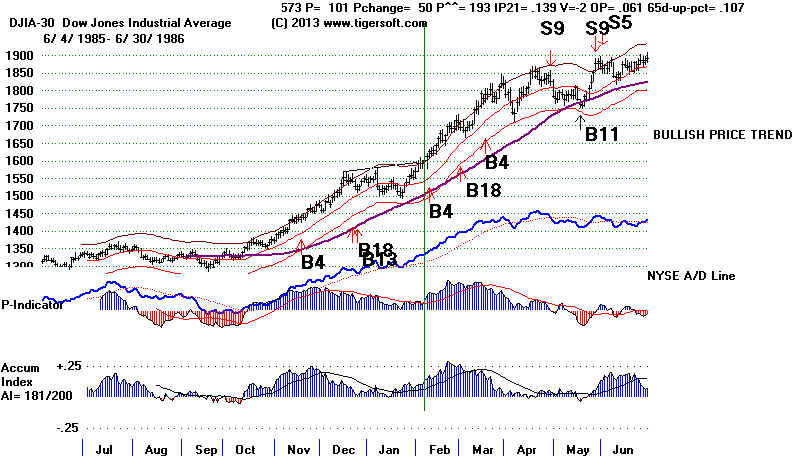
Below is our current DJI chart and the only two other past cases when
conditions #1, #2 and #3, above, were present between 1965 and 2013.
la/ma
P-I IP21
V-I Pct up from 65 days ago.
Outcome
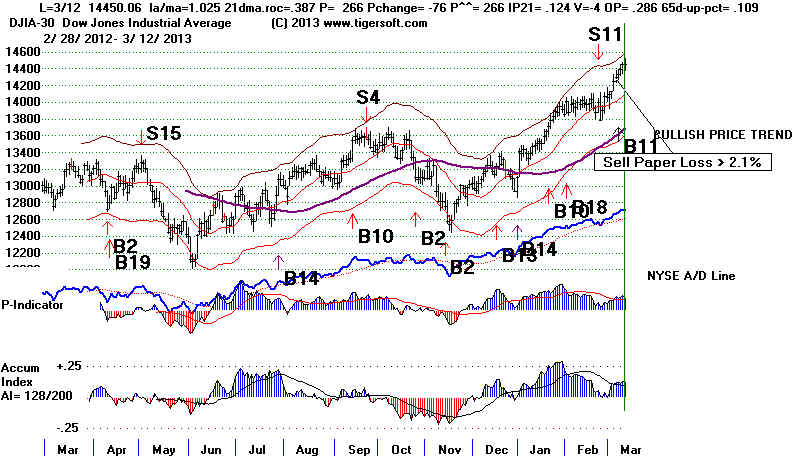
3/12/2013 14450.06
1.025 266 .124
-4
.109
?????
 la/ma
P-I IP21
V-I Pct up from 65 days ago. Outcome
la/ma
P-I IP21
V-I Pct up from 65 days ago. Outcome
2/6/1986 1600.69
1.037 101 .139
-2
.107
Up for 3 more months
la/ma
P-I IP21
V-I Pct up from 65 days ago. Outcome
1/31/1996 5395.3
1.042 100 .207
-1 .111
Up for 5 more weeks.
3/12/2013 ---> To All Key Index
and Lesding Stock Charts
---> 299 -58 MAXCP stocks Bullish MAXCP
Stocks (3/12/2013) BULLish
plurality
---> 72 +2
MINCP stocks Bearish MINCP Stocks (3/12/2013)
---> 124 New Highs on NASDAQ 6 new lows. BULLish
plurality
--->204 New Highs on NYSE 6 new lows.
BULLish plurality
3/12/2013 Key Values: DJI 14450 +3 la/ma= 1.025 21dmaroc = +.387 P=
+266 Pch= -76
IP21 = +.124
(on 1/30/2013 IP21 was .293) V = -4 Opct = .302
====================================================================================
OLDER HOTLINES
====================================================================================
3/11/2013
Sorry, But Bond Funds Do Look Dangerous.
Hedge by Shorting The Lowest Power Ranked Bond Funds.
I was warned that Unemployment will probably not fall to 6.5% this year and so
should not count on the FED's ending their promotion of very low interest rates.
Perhaps, but there's no denying that some big professionals are selling some
of their biggest municpal bond holdings. now. They do not want to get trapped in
them when everyone starts to sell them.. By our standards, their charts look
particularly vulnerable. They look even more vulberable
than housing stocks looked
at their tops in 2005 and 2007.
See also June 28, 2007
"Housing Shows No Bottom in Sight."
http://www.tigersoft.com/Tiger-Blogs/6-19-2007/index.htm
LEN's Top in 2005 looked less bearish than some big bond
funds Do NOW.
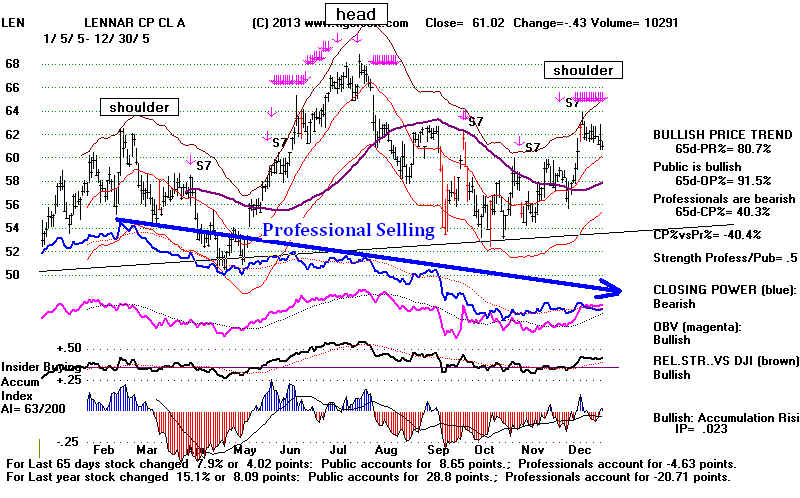
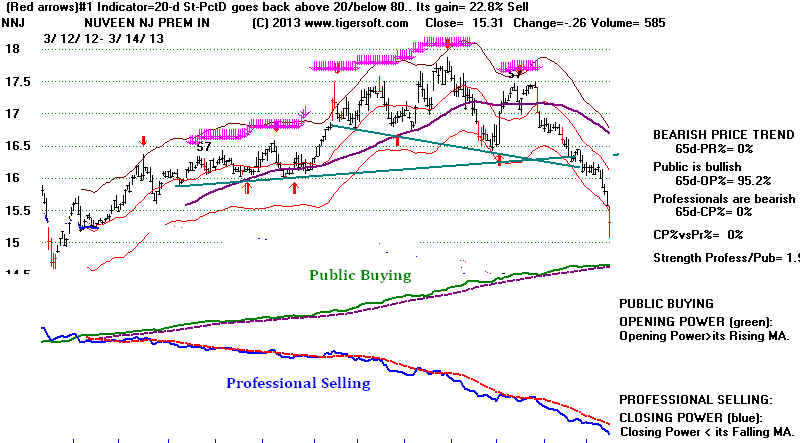
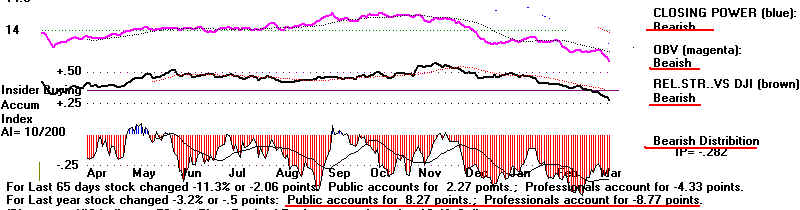
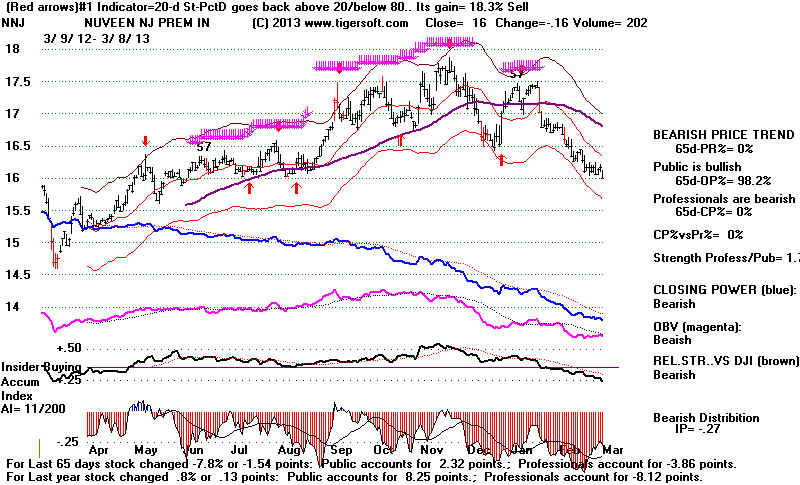
The Closing Powers of NNJ,
MYJ, NVN, BSE, AYN, BKK, PCW, NNP, BBF
and NNY are all making new lows ahead of prices, just
as the Accumulation shows
heavy red institutional selling and the 65-dma and
earlier lows are being broken.
DJI Retreat Seem Likely
Today, a weak openking could not prevent the DJI' from rallying again. But,
a breather and a little profit-taking seems likely. The DJI has reached an
over-bought position. It is 2.7% over the 21-day ma. It has not been able to
close above its 3.5% upper band since October 2011.
See below how the 10-Day NYSE Down Volume has fallen to its support line, just as
has the 10-day Up Volume risen to its resistance line. We'll see tomorrow if they
start converging bearishly.
Because the DJI is up more than 10% over the past 65 days and has a rising
A/D line and no sell signals other than the weak Sell S11 at this time of the
year, the odds are against much of a retreta.
Professional Shorts are still covering. We judge this from the our Tiger Index
of the 47 most heavily shorted stocks as of mid February. See how the Index
has risen today back above its 65-dma.
3/11/2013 ---> To All Key Index
and Lesding Stock Charts
---> 357 +76 MAXCP stocks Bullish MAXCP Stocks (3/11/2013) BULLish plurality
---> 70 +27
MINCP stocks Bearish MINCP Stocks (3/11/2013)
---> 124 New Highs on NASDAQ 6 new lows. BULLish
plurality
--->204 New Highs on NYSE 6 new lows.
BULLish plurality
3/6/2013 -> Special:
Very
High Power-Ranked Dividend Stocks
3/11/2013 Key Values: DJI 14447 +50 la/ma= 1.027 21dmaroc = +.467 P= +342 Pch= +32
IP21 = +.128
(on 1/30/2013 IP21 was .293) V = +8 Opct = .284
====================================================================================
OLDER HOTLINES
====================================================================================
3/8/2013
The Turn-Down in Bond Funds Is Bullish for The Stock Market.
However, Democrats in the White House in years after the Presidential Election
have brought more declines over the next 6 weeks than rallies, by 5 to 3 since 1945.
But longer term, the rally is likely to continue. If we look out 3 months, having
a Democrat in the White House the year after a Presidential Election has achieved
DJI gains in 9 of these 12 cases since 1917.
A re-test of 14200 is a possibility. But momentum like this usually brings still
higher prices. So, until we have a new Peerless Sell
Signal, a Head/Shoulders top
or the SPY CLosing Power goes below its 21-day ma, I would expect the DJI to
work
higher.
Since 2010, many have predicted the bond bubble will burst. That may be what
is now happening. If bonds do drop, some of that money will surely go into
Blue Chip Stocks.
Is the stock market rally telling us that official unemployment will drop to 6.5% in a few
months? Would that bring an end to low interest rates and cause a rush to selling
in low interest bonds. I think so. Bubbles are probably unavoidable.
Cancel the Sell S11
My judgement is that we have to cancel the Sell S11. The Paper Loss, now 2.8%,
is not in keeping with past Sell S11s since 1965. Bullishly the DJI has broken out
into all-time
high territory and above the top of its price channel. The A/D Line and CLosing
Powers
are rising. And seasonality is bullish. Since 1965 the DJI has risen 61.7% of the
time over the next week and 61.7% of the time over the next month.
A Democrat in the White House
When a Democat sits in the White House in
the year after the Election, the odds since
1917 have been 7:4 that the DJI would be lower on May 1st than it was on
March 10th of that year. But the losses are all small since 1945. And
bullishly,
over the next 3 months, the odds of a rally based on all the data below are 75%
and except for 1937, none brought declines of more than 5%.
March 10 May 1
July 10 Pct Change
March 10-July 10
---------------------------------------------------------------------------------------------------
Wilson 1917 91.10
93.40 93.10
+2.2%
FDR 1933 53.80
77.80
104.10
+95.4%
FDR 1937 194.40
174.30
177.40
-8.7%
FDR 1941 123.60
115.30 127.80
+3.4%
----------------------------------------------------------------------------------------
Truman 1945 175.60
173.90 167.10
-4.8%
Truman 1949 175.60
174.10 179.90
+2.4%
JFK 1961 663.60
677.10
693.10 +4.4%
LBJ 1965 892.39
922.31 879.49 -1.4%
Carter 1977 946.73
926.90 907.99
+6.5%
Clinton 1993 3478.34
3427.55 3521.06 +1.2%
Clinton 1997 7079.39 6976.48 7886.76 +11.4%
Obama 2009 6926.49 8212.41
8146.52 +17.6%
Can the DJI keep rising here? A lot delends on the action of its highest priced
components:
IBM 210.38 212 is needed for a new all-time
high and 12-mo high.
CVX 118.57 119 is needed for a new all-time
high and 12-mo high.
MMM 105.71 all-time high
MCD 98.71 101 would be a 12-month high.
UTX 92.07 12 month high.
CAT 90.51 below 65-dma
XOM 88.97 at
65-dma
TRV 81.65 12-month high
BA 81.23 12 month
high
JNJ 78.19 12 month high
The DJIA is weighted by price only. This means that the 10 highest price DJI stocks
cause nearly 60% of the DJI's movement and the top five account for 33,3% of
the DJI movement. As you can see above, five of the highest priced DJI stocks
are running in, i.e. they are at 12 mont highs, but 3 of the top 4 are at or just below
resistance, namely IBM, CVX and MCD. We must watch them closely now.
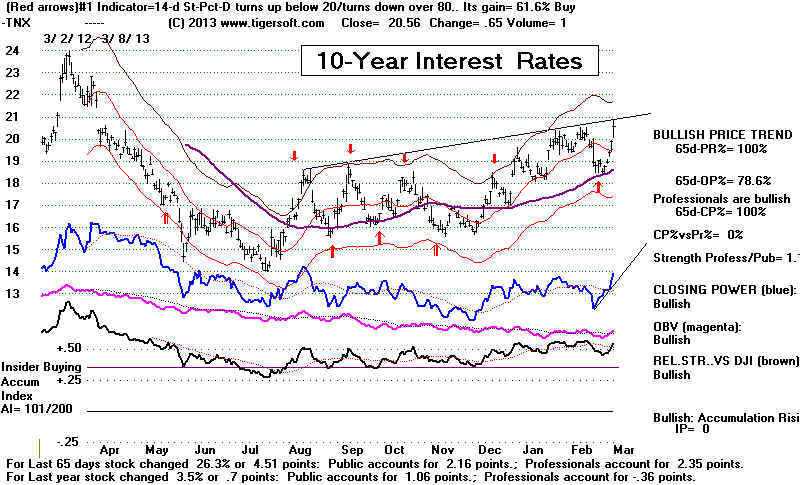
BONDS ARE ANTICIPATING 6.5% UNEMPLOYMENT
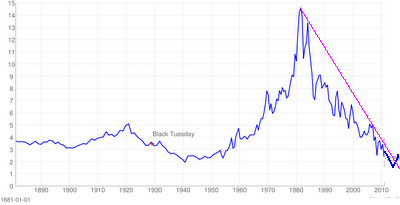
10-year interest rates are creeping up.
They now stand at 2.1%. Let's watch to
see if they breakout above this level.
Our Bearish MINCP Stocks includesome municipal
bond funds now.
If rates short-term rates rise even to 3%, there is apt to be considerable
"adjustment" (aka "drop") in bond prices.
The Fed has said they would keep rates "low" until Unemployment
officially
drops to 6.5%, another 0.6% below the levels now. But "low" compared to
what? Historically, 3% or 3.5% is low.
The economy is now improving steadily if not strongly. So, it's likely that 6.5%
will be reached later this year. I think that this makes many big bond holders
nervous,
because if rates go back up, bonds will surely go down. And they could lose
33%
of their value very quickly if 10-year rates were to go back up to 4%.
It fair to guess that these concerns also help account for why stocks are rising
while bonds are falling. Blue chips are being bought with some of the money coming
out of the bond market. The gains there are just too big to be happy getting only
2.3%. That's why Professionals are selling some of the biggest bond funds.
We actually should probably consider shorting some of them. Their chart patterns
look very bearish: key price support being ruptured, Closing Power making new
lows ahead of price and lots of heavy red Distribution recently.
3/8/2013 ---> To All Key Index
and Lesding Stock Charts
---> 281 +37 MAXCP stocks Bullish MAXCP Stocks (3/8/2013) BULLish plurality
---> 43 +7
MINCP stocks Bearish MINCP Stocks (3/8/2013)
---> 153 New Highs on NASDAQ 6 new lows. BULLish
plurality
--->229 New Highs on NYSE 7 new lows.
BULLish plurality
3/6/2013 -> Special:
Very
High Power-Ranked Dividend Stocks
3/8/2013 Key Values: DJI 14397 +68 la/ma= 1.025 21dmaroc = +.348 P= +2095 Pch= +24
IP21 = +.111
(on 1/30/2013 IP21 was .293) V = -6 Opct = .215
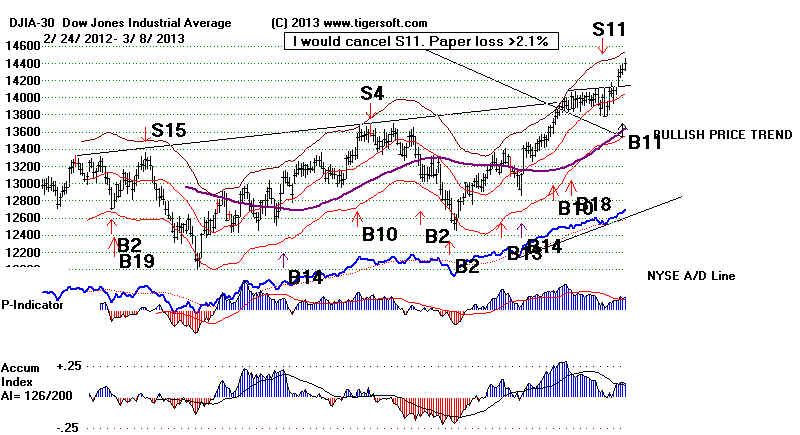
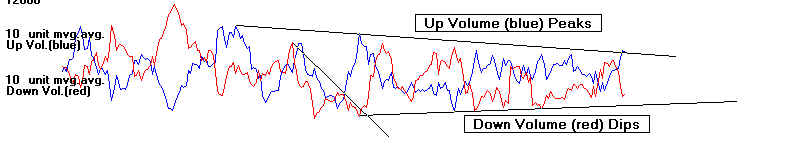
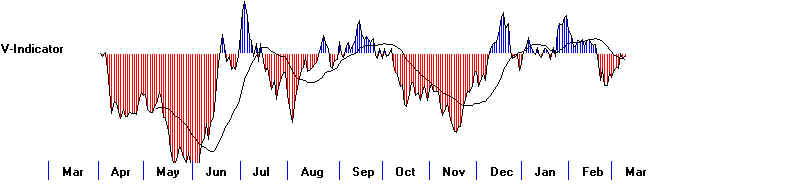
====================================================================================
OLDER HOTLINES
====================================================================================
3/7/2013
Aggressive Buying Now Will Probably Be Rewarded, as Market
Enters Bullish "Both-Up" Phase when both Professionals and the Public
Are Aggressive Buying. A Specualtive Bubble Often Occurs in the
later stages of a Bull Market. This Bull Market is 48 Months Old.
Until we get a new Peerless Sell or the Closing Power drops below its
21-day ma, SPY, DIA, MDY and IWM should keep advancing.
3/7/2013 ---> To All Key Index
and Lesding Stock Charts
---> 244 MAXCP
stocks Bullish MAXCP Stocks
(3/7/2013) BULLish plurality
---> 36
MINCP stocks Bearish MINCP Stocks
(3/7/2013)
---> 90 New Highs on NASDAQ 21 new lows. BULLish
plurality
--->108 New Highs on NYSE 4 new lows.
BULLish plurality
3/6/2013 -> Special:
Very
High Power-Ranked Dividend Stocks
3/7/2013 Key Values: DJI 14329 +33 la/ma= 1.021 21dmaroc = +.298 P= +285 Pch= -44
IP21 = +.122
(on 1/30/2013 IP21 was .293) V =
-9 Opct = .215
3/7/2013 ---> To
All Key Index and Leading Stock Charts
Momentum and channel breakout are now too much for the Sell S11, which
was probably too early in the year to be trusted. The DJI
is now
up more than 2.2% above the level of the Sell S11.
There are no cases
of a paper loss this big with an Sell S11. That makes this signal different
than those in the past and calls it into question at this time, I believe.
futures versions of Peerless should not give an Sell S11 so early in the year.
The February and March S11s all had much lower paper losses.
.
Heavily shorted stocks are being coveredaggressively. Shorts are
mostly taken by professionals. When these hedge fund folks start to cover,
it is most often because they expect the market and these stocks to move higher.
They would rather play the long side now and so, I think, should we.
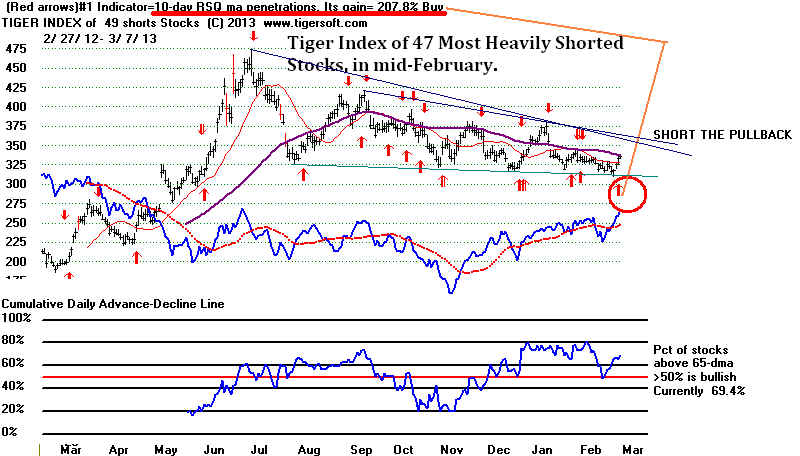
Many big-bulge/high Accumulation stocks are still being bid up by Professionals
in expectation that still higher prices will be reached when the economic news
gets better. That is the reason that the MAXCP STOCKS tonight outnumber
the MINCP stocks by more than 6:1, despite the DJI's now being 14%
above its November bottom.
The Public are now net buyers of stocks now. So are Professionals. Both the
Opening
and Closing Power are above their rising 21-day mvg.avgs. This is our
very bullish BOTH-UP condition. Openings are higher than the previous
days' closes and closes are then above the days' openings. Prices can be
marked up very rapidly, especially in all-time high territory. So, it is a mistake,
I think, to heed Stochastic or Trading Range signals now, including the Sell S11.
As long as the Closing Power for the SPY stays above its
21-day ma and
there is no new Peerless Sell, I think we have to play the long side very
aggressively. See how nicely this worked six
months ago.
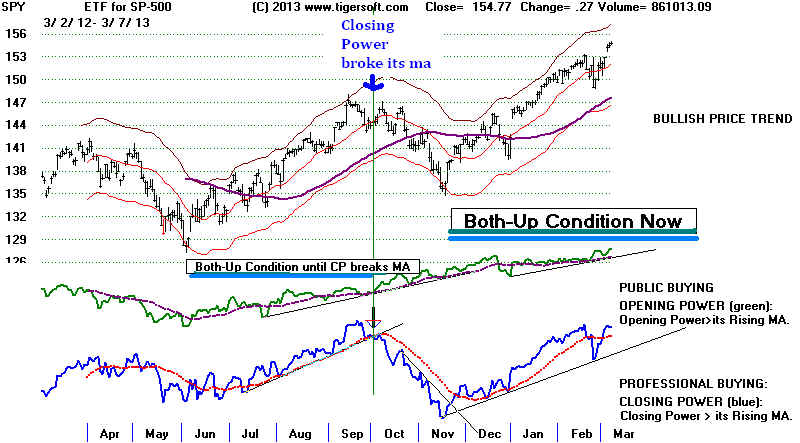
So, respecting all these bullish factors, the power of the Fed and the bullishness of new
all-time highs, I want to cancel the Sell S11 and reinstate the earlier Buy signals.
Our Stock's Hotline is short only a few stocks and these will probably be covered
in a day or two. We are long many more of the bullish MAXCP stocks.
Traders should at this point be long, not short SPY.
The SP-500 A/D Line is
making new highs to confirm its price action.
Below are the 5-year weekly charts of DIA, SPY and MDY (Midcaps).
Their upward momentum is very obvious. Rising prices are the stock
market's best advertisement.
====================================================================================
OLDER HOTLINES
3/6/2013
SHORTS ARE STARTING TO COVER WEAKEST STOCKS,
INCLUDING BEATEN DOWN MININ STOCKS. THEY ARE
OFTEN VERY SENSITIVE TO WHEN A FURTHER RALLY
IS GOING TO COME.
The DJI is 2% above the 21-day ma. Normally, this would limit the
upside potential. But keep in mind these facts: 1) that the DJI has now
entered all-time high territory, where the path of least resistance is
up; 2) that the FED majority is determined to keep the bull market
moving higher; 3) the price channel resistance would normally
have stopped a rally, if the market wanted to behave as in a trading
range and 4) All the bulges of earlier Accumulation mean lots of stocks are
now tightly held in the expectation there will be still higher stock prices,
presemably on better earnings news coming later this year.
Cancel this
Sell S11 if The DJI
Closes above 14308.
3/6/2013 Key Values: DJI 14296 +42 la/ma= 1.02 21dmaroc = +.354 P= +328 Pch= +99
IP21 = +.125 (on 1/30/2013 IP21 was .293) V = -1 Opct = .214
3/6/2013 ---> To
All Key Index and Lesding Stock Charts
3/6/2013 -> Special: Very High Power-Ranked
Dividend Stocks
---> 417+1 MAXCP
stocks Bullish
MAXCP Stocks (3/6/2013) BULLish
plurality
---> 68 +3 MINCP stocks Bearish MINCP Stocks (3/6/2013)
---> 90 New Highs on NASDAQ 21 new lows. BULLish
plurality
--->108 New Highs on NYSE 4 new lows.
BULLish plurality
Bullish Signs
The Closing Power trends are still rising for the key ETFs. The A/D Line for the
NYSE and
SP-500 again made a new high. Shorts are starting to cover even the weakest
stocks.
We see this and in the rises today among our own bearish
MINCP stocks, especially
the beaten-down gold stocks. Notice how the 10-day ma of NYSE Down volume has turned
down today and the V-Indicator has impproved to +1.
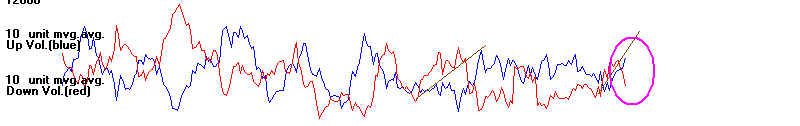
Moreover, if we produce a Tiger Index of the 48 most heavily
shorted stocks.
we see its index(below) has tuned up for a second day. This Tiger Index of Heavily
Shorted
Stocks has given an optimized Relative Strength Buy. Its stocks have started to
outperform the DJI. This is a reliable and powerful short-term Buy. Such a
system
would have been very profitable used against these heavily shorted stocks for the
last year. I take all these as signs that we should now cover
most of own shorts and
expect higher general market prices.
I will post this chart here regularly, so that we can see if
the
short-covering pushes these stocks above their 65-dma and
above their 7-month downtrend.
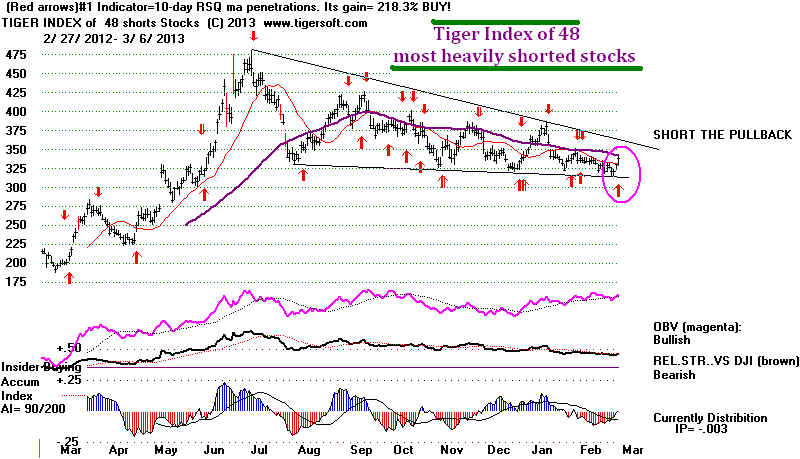
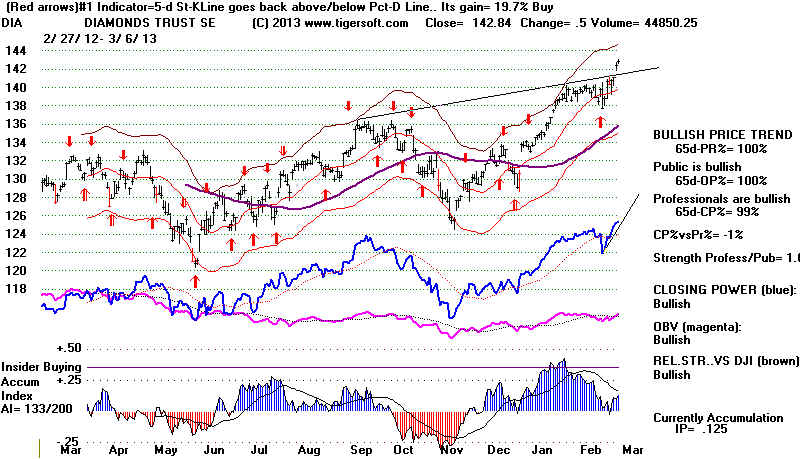
To be consistent with earlier Sell S11s, we should simply cancel the Sell S11
if the paper loss from its surpasses the highest earlier Sell S11 paper loss.
My own sense is that Sell S11s like S9Vs probably should not to be trusted
until later until April. The pattern of January take-offs lasting is quite strong
from 1945-2000. But because earlier tops have been the pattern more recently,
we shoukd still remain vigilant now and respect the bearishness from the appearance
of a different Peerless Sell and/or a head/shoulders.
DJI Peaks Signals Result
------------------------------------------------------
2/20/2007 Sell S9
DJI declined to lower band.
4/23/2010 Sell S11 13.5%
decline.
2/18/2011 no signal DJI declined to
lower band.
5/2/2011 S9V
DJI declined below
first tagging of lower band.
3/16/2012 S11/S15 DJI
declined to lower band.
------------------------------------------------------------------------------------------------------------------------------------------------------
OLDER HOTLINES
------------------------------------------------------------------------------------------------------------------------------------------------------
3/5/2013
The Fed Seems To Be Inviting A Bubble.
Cancel the Sell S11 if The DJI Closes above 14308.
3/5/2013 Key Values: DJI 14254 +126 la/ma= 1.019 21dmaroc = +.208 P= +229 Pch= -9
IP21 = +.123 (on 1/30/2013 IP21 was .293) V = -32 Opct = .123
3/5/2013 ---> To
All Key Index and Lesding Stock Charts
---> 416+58 MAXCP stocks Bullish MAXCP Stocks (3/5/2013)
BULLish plurality
---> 68 +3 MINCP stocks Bearish MINCP Stocks (3/5/2013)
--->111 +39 New Highs on NASDAQ 22 new lows. BULLish
plurality
--->183 +83 New Highs on NYSE 33
+10 new lows. BULLish plurality
Without a new Peerless Sell, when
the DJI was up 9.7% from 65
trading
days ago.. 1/7% over the 21-dma, with the V-Indicator negative, as now,
the bull
market continued in 8 of 9 cases since 1990. Only in one instance did it fall
back to the
lower band before resuming the bull market.
Has The
Overhead Resistance Been Overcome?
Is The DJI
Cleared Now for a Take-Off to 15000?
The Fed
wants a bull market. That's clear. Why else would the Fed's
second-in-command go to the trouble of
saying interest rates may stay low even
after the official US Unemployment
hits 6.5%. Bullishly, the NYSE and SP-500
A/D Lines
have confirmed the new highs. And the Closing Powers are all back
above their
21-day ma. And, as we keep saying, there were an abundant number
of
new price and Closing Power new highs. So, very short-term traders can simply
hold long
positions while the underlying stocks' or ETFs' Closign Powers are rising.
But what
about those who want a position they can expect to hold for a month
or longer?
In this, we have a number of concerns, each arguing against buying SPY
or DIA now.
1)There is a chance the new all-time high today will be a "one-day wonder"
and prove a false trap for bulls. Waiting another day is only prudent.
2) Breakouts above rising channel resistance lines are not as reliable as
a flat topped breakouts. So, while a "judged Buy B10", most often works
out well well when the DJI breaks out above nearly flat resistance, it
(a judegd B10) is probably not a good reason or the right term for buying
major market funds or ETFs now.
3) The V-Indicator is still negative. (But if the DJI is above major resistance,
it will not take unusual volume to lift prices. And the study further down suggests
this by itself is not sufficient reason to expect a reversal once momentum
becomes very strong, at least, not until late May.)
4) Sell S11 signals have always worked out profitably 8 straight times in the past.
(But nearly all Peerless Sell signals occasionally fail.)
At some point, if the market keeps rising I would want to close out short positions and
go long. I would even buy DIA or SPY. To some extent, this is a matter of
personal
tolerance for pain. It's also a matter of how patient one is.
Here is what I propose regarding Peerless, which has a history of
always being long
or short, but never being out of the market.
===> Use a reversing stop loss if the DJI closes 2.2% or more above the
14000.57 point
where the S11's signal appeared. This means, in effect, canceling the S11
if the DJI closes above 14309. As you can see below, none of the earlier Sell S11s
produced a paper loss of more than 2.1%. A paper loss of more than 2.2% would
suggest
this occurrence is qualitatively different than earlier Sell S11s..
Sell S11s: 1965-2013
S11
Other Gain When
Biggest Paper
Signals Reversed
Loss
------------------------------------------------------------------------------------
1 2/26/1992
2.3%
none
2
3/25/1996
2.8% 0.8%
3
4/23/1998
also S15
16.5%
2.1%
4 7/7/1999
also S9 5.6%
1.2%
5
2/17/2004
also S9
5.6%
1.2%
6
7/13/2007
also S9
4.4%
0.7%
7 5/1/2008
also S9 12.7%
none
8
4/16/2010
4.5%
1.7%
9
3/14/2012
also S15
3.6%
0.3%
2/22/2013
?
?
---------------------------------------------------------------------
Without A New Peerless Sell, A Continued Rally Is Heavily Favored.
The DJI is now up 9.77% above is close 65-trading days
ago. What happened in
the past when it was up 1.8%, say, over its 21-dma, 9.7% above its level 65
trading days ago and the V-Indicator was still negative, as now. There were 9 cases
since 1990 when these conditions prevailed and there was no other Peerless Sell.
In 8 of the 9 cases, the DJI kept rallying, at least 5% more. In only one instance
did
it drop to the lower band before resuming its advance.
1990-2013 DJI Up 9.7% over 65-trading days earlier,
1.8% over its 21-day ma with the V-Indicator Negative.
7/12/1990 Also Sell S9
Bear market immediately followed.
1 ===> 5/1/1995
Bull market Continueeds.
2 ===> 1/29/1996
Another month's rally.
3/5/1996 earlier Sell S11 DJI
declined to lower band.
3 ====> 12/30/1996 no Sell.
Bull market Continuees.
2/12/1997 Sell S9
DJI declined to lower band.
4/16/1998 Sell S11/S15 DJI declined to lower band.
4 ===>12/30/1998
5% rally and then DJI declined to
lower band.
5 =====>March-April 1999
DJI rallied until May.
7/6/1999 Sell 9/Sell S11 DJI
declined to lower band.
12/30/1999 Sell S9
DJI declined to lower band.
1/13/2000 Sell
(/S11 DJI declined below lower band.
6 =====> 1/7/2002
DJI declined to lower band.
1/6/2003 Sell S12
DJI declined below lower band.
7 =====>8/21/2003
Bull Market continued.
6/3/2009 Sell S8
DJI declined to lower band.
8 =====> 9/28/2009
Bull Market continued.
9 =====> 10/14/2009
Bull Market continued.
11/11/2009 Sell S9
DJI
went sidewise.
1/4/2012 Sell S12
Bull Market
continued.
3/19/2012
S9/S11/S15 DJI
declined below lower band.
3/5/2013
?
====================================================================================
OLDER HOTLINES
====================================================================================
3/4/2013
Sell S11 and Overhead
Resistance Still. Stay Hedged
with some Bearish MINCP Short Sales.
78% of the SP-500 stocks are above their 65-dma and the Advance/Decline Line for these
stocks has just made a new high ahead of the index itself. This is usually
bullish for the general market. So, is the continuing weakness among mining stocks,
whose rallies normally portend panics and inflation fears. Weakness in the Euro,
the
Pound, the Yen, Gold, overseas
markets and now China,
inevitably bring more
foreign money into US stocks, which is fast becoming a haven
for wealth. All these
forces have been lifting US stocks this year. What will change the picture? As
I argued
here last night, the Sequester will hurt Wall Street as a whole only if it lasts more than
3 months or brings much bigger cuts in spending. Meanwhile, the FED is doing
all it can to make speculation cheaper and seem less risky.
Gold's
Plunge Has Legs To Run Lower - Forbes 2/15/2013
Why
the Pound Is Getting Pounded. 2/22/2013
G20
Clears Way for Further Yen Weakness; 2/16/2013
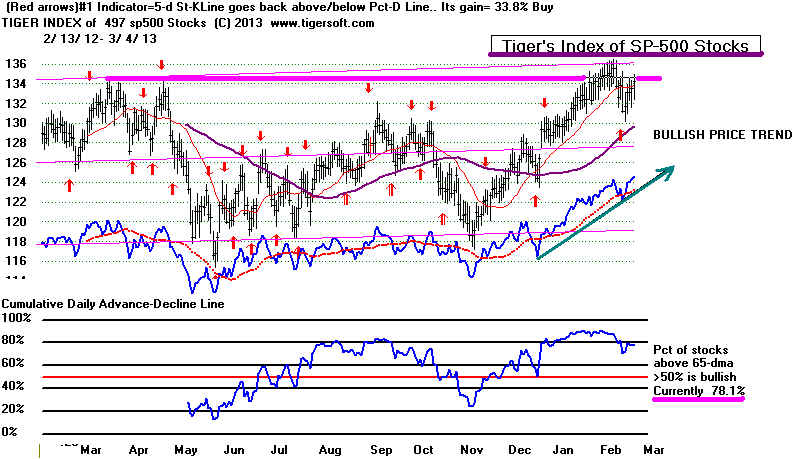
Despite the Sell signal, I believe a DJI close above 14200 should be be
treated
as a
channel breakout which could well set up a DJI target above 15000. In this,
I
would want the DJI to close above it for two days above 14165. The first day could
be a
fake-out, a false new high whose only significance would be the headlines it gets
for
the market for a single day to draw in the more hesistant buyers of stocks.
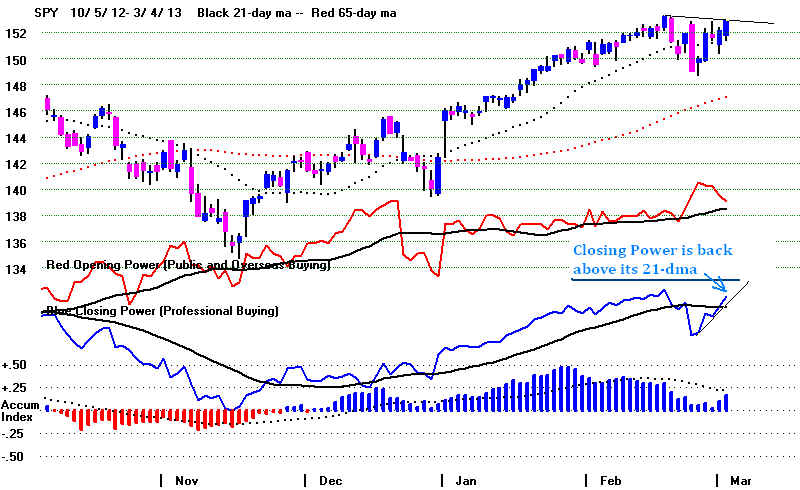
Today, instead of bringing a DJI decline, the Closing Powers jumped up and above
their
21-day ma on news that the Fed may
well keep interest rates low even after
the official unemployment falls to
6.5%. Aggressive Professionals took this a signal
to
jump back aboard many of the high Accumulation/Closing Power new high stocks
we
have become familiar with among our Bullish MAXCP
stocks. The expectation is
that
aggressive performance-mnded fund amangers will keep buying them if there
is
another leg upwards that is started when the DJI gets past 14200.
They
may be right. But another group of Professionals is still shorting the bearish
MINCP stocks, which cannot seem to rally when the
DJI does and drop appreciably
on
days the DJI goes down. Below, see how the NYSE Volume Indicator is still
negative after today's mid-day turn-around and how the 10-Day Down Volume Indicator
is
still below the 10-Day Up Volume.
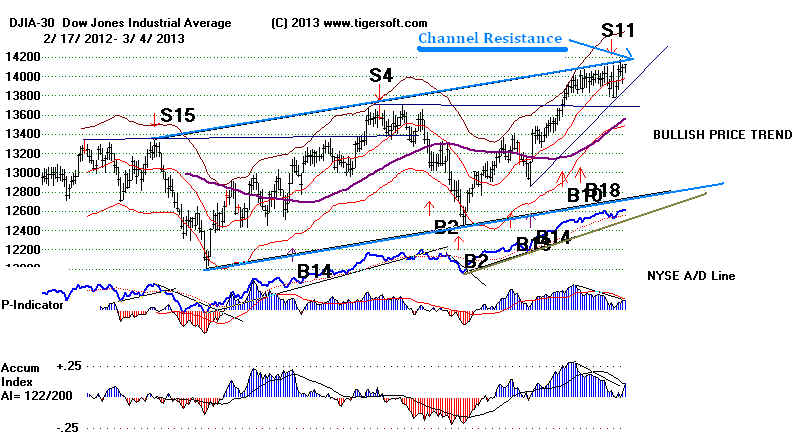
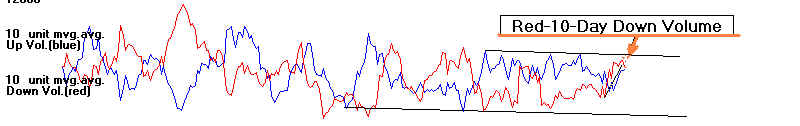
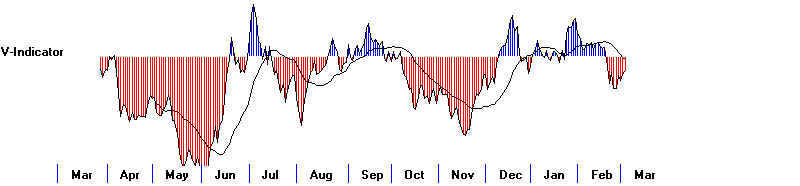
3/4/2013 Key Values: DJI 14090 +35 la/ma= 1.009 21dmaroc = +.153 P= +226
Pch= +64
IP21 = +.046 (on
1/30/2013 IP21 was .293) V = -38 Opct = .019
3/4/2013 ---> To
All Key Index and Lesding Stock Charts
---> 358+222 MAXCP stocks Bullish MAXCP Stocks (3/4/2013)
BULLish plurality
---> 65 +14 MINCP stocks Bearish MINCP Stocks (3/4/2013)
--->111 +39 New Highs on NASDAQ 22 new lows. BULLish
plurality
--->183 +83 New Highs on NYSE 33
+10 new lows. BULLish plurality
===================================================================================
OLDER HOTLINES
===================================================================================
3/1/2013
New Sell S11 and Overhead
Resistance Call for A Decline.
3/1/2013 Key Values: DJI 14090 +35 la/ma= 1.009 21dmaroc = +.153 P= +226
Pch= +64
IP21 = +.046 (on
1/30/2013 IP21 was .293) V = -38 Opct = .019
Peerless tells us the odds favor a decline
back at least to the rising 65-dma.
January Buy B10 take-offs before 2010 mostly
produced DJI advances where there
was no serious retreat to even the lower band until an April or later top, the last few
years,
But more recently, when the V-Indicator turned
negative after a 12% DJI rally, the
the DJI declined to the lower band or lower. QE-1 and QE-2 could not prevent such
declines. The V-Indicator is now negative and the 10-day ma of Down Volume is still
in an uptrend and above the 10-day ma of Up Volume.
3/1/2013 - Red 10-Day NYSE Down Volume
Last week some professionals jumped back in on the long-side, judging from
the recent up-swing in Tiger's Closing Powers (CP) for the key the DIA.
Its CP did rise back above its 21-day ma.
But bearishly, the Closing Powers for SPY, QQQ and MDY are still below
their falling CP 21-dma. So, a reversal downward is more likely, I think,
given the reliability of the new Sell S11, the failure of volatile groups like
Semi-Conductors and the Big Banks to rally much. Most important, NYSE Up
volume seems now to be inadequate for the task of eating up the overhead
supply of stock.
The top of the DJI price channel is just above Friday's close and DJI's 2007 peak at
13164.53 closing high are important barriers to the advance. Often before the DJI
can
reverse downward, it makes a nominal closing high abd then goes down. Presumably,
it wants to get a mass-media headline from a new all-time high to bring in
late-to-the-party
buyers. So, a new high may be a false. But at some point, if the DJI
moves up more than
one day into all-time high territory, we would have to consider the Sell S11 too risky to
use.
Prices do advance more easily when in all-time high territory. The DJI above 14200
would then be up more than 10% from its level 65-day agu. That itself shows momentum
is usually too strong to hold short index ETFs. But, let's see if the
DJI will keep rising.
Meanwhile, AAPL keeps falling and hedging by being
short a selection of our
BEARISH MINCP STOCKS has been quite
profitable, as these stocks keep falling.
Many are gold and silver stocks. But, at some
point the Closing Powers for Nevada miner
Allied Nevada will turn up, showing
Professionals have tired of running in the weak-holders
that shils like Glen Beck have fleeced and destroyed.
Now, his favorite gold and silver
stocks are down 75% or more from their highs of early 2011.
Interestingly, Mexican based Scorpion
Mining (SGN-V - $0.50) shows very high
Accumulation now, along with a rising Closing Power. Sooner or later, some of these
mining stocks will become buy-out candidates. Not every mining stock deserves this
decline.
I will start to include their charts in our Index and Leading
Charts Section starting tonight.
I figure that when ANV's CP breaks its downtrend, the best of these stocks will rise
33%-50% in a few weeks. That's what happened in the past for NEM in the late 90's.
Current DJI and V-I Chart
V-I is now negative after a 12% 3 month advance.
That is the basis of the Sell S11. Unless the V-Indicator
turns positive, it's most likely the DJI will have to fall
back to the lower band.
 |
April Top, 2010 - DJI and V-I Chart for 2009-2010
DJI declined to lower band.
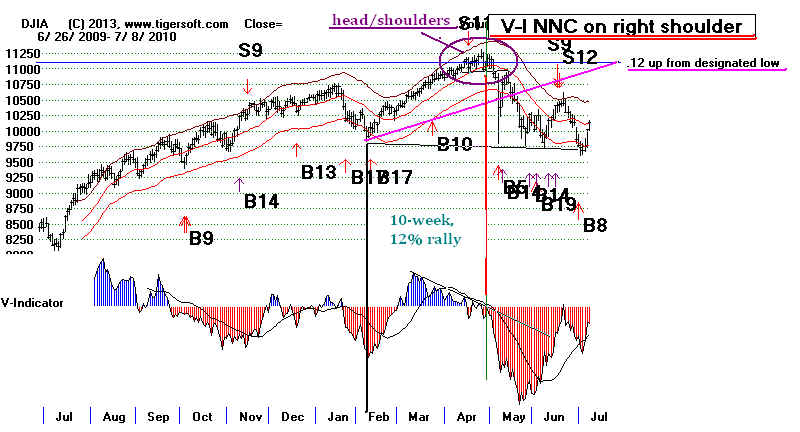 |
March Top, 2011 - DJI and V-I Chart for 2010-2011
DJI declined to lower band.
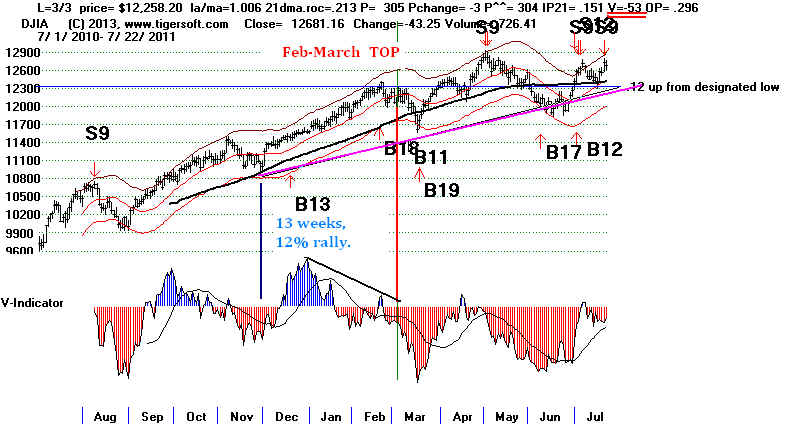 |
March Top, 2012 - DJI and V-I Chart for 2011-2012
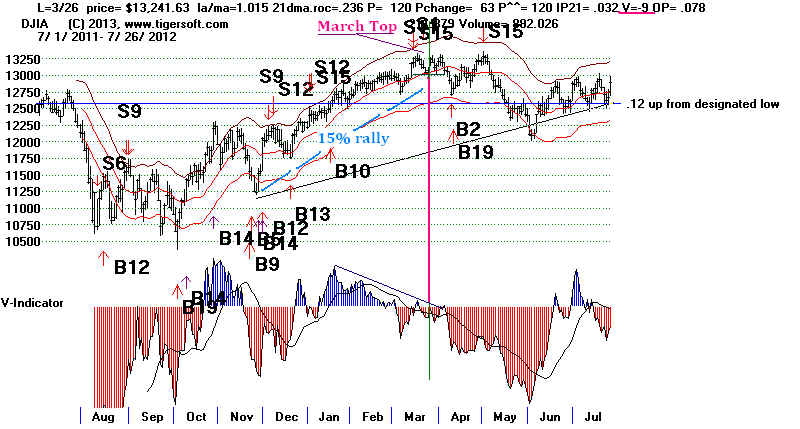 |
3/1/2013
---> To All Key Index and Lesding Stock
Charts
---> 237+98 MAXCP stocks Bullish MAXCP Stocks (3/1/2013)
BULLish plurality
---> 51 +1 MINCP stocks Bearish MINCP Stocks (3/1/2013)
--->72 +35 New Highs
on NASDAQ 17 new lows. BULLish
plurality
--->100 +9 New Highs on NYSE 23
+7 new lows.
Wall Street Is Not Much Concerned about The Sequester.
Unless it leads to long-lasting and much bigger spending cuts, I would
think the sequester
is probably not bearish for the stock market. It shows that
Republicans are in charge and that they consider their control of the House
of Representatives unassailable. Wall Street likes that, as long as the economy
does not suffer too much. They also understand that whatever risk the Sequester
brings to the economy, it also strengthens Bernanke's resolve about maintaining
QE-III, and Wall Street is direct beneficiary of that. Brief government
shut-downs
in November and December 1995 were followed by much high stock market prices.
So Sequester fear-mongering probably will have the effect of moving stocks into
stronger hands. The President will soon, I predict, make very big concessions
about Medicare and Social Security. This will make his populist supporters
very unhappy with him. But he does not want to risk a constitutional crisis.
Wall Street will like this, so most likely, the decline will be shallow..
The Sequester and this year's financial forces are hitting different industry
goups very differently. Here are the Tiger Index charts of different sectors.
http://tigersoft.com/Tiger-Blogs/Sequester/
-------------------------------------------------------------------------------------------------------------------------------------------------------
OLDER HOTLINES
------------------------------------------------------------------------------------------------------------------------------------------------------
2/28/2013 Sell S11 and Overhead
Resistance
vs
Upward Momentum, The Fed's Stock Rally and Positive P-Indicator
2/28/2013 Key Values: DJI
14051 -21 la/ma= 1.007 21dmaroc = +.085 P= +162
Pch= --21
IP21 = +.0 (on 1/30/2013 IP21 was
.293) V = -50 Opct = -.073
The V-Indicators weakened today while biotech strength helped
the
A/D Line rise a little. AAPL is flirting
with another price breakdown
and gold stocks made new lows, suggesting that inflation is not a
serious problem which will force a change in the Fed's low interest rates.
I still think the DJI is more likely to decline to the vicinity of 13600
than move past 14200. But a close above 14200 would take the DJI
into all-time high territory and past its upper channel. So that would
have to be treated as a Buy B10.
Today all the key Peerless Volume Indicators fell below
+.01. This is
a warning that the overhead resistance will probably not be overcome.
Research done tonight further suggests a decline to a
point 2% to 3.5% below
the 21-day ma, but also shows:
1) that the market's momentum would become much important
if the DJI were to advance more than 10% past its close 65-trading days ago
(It is now 8.0% above its level 65 trading days ago.)
and
2) a sell-off to or below the lower band would likely follow more price strength
with a P-Indicator that turns negative.
2/28/2013
---> To All Key Index and Lesding Stock
Charts
---> 139 +34 MAXCP stocks Bullish MAXCP Stocks (2/28/2013)
BULLish plurality
---> 50 +4 MINCP stocks Bearish MINCP Stocks (2/28/2013)
--->37 -17 New Highs
on NASDAQ 10 new lows. BULLish
plurality
--->91 +4 New Highs on NYSE 16
+6 new lows.
===================================================================================
OLDER HOTLINES
===================================================================================
2/27/2013
Sell S11 and Overhead
Resistance
vs The Fed's Stock Rally
Trust the Sell S11 unless the DJI Closes above 14200. That would probably
bring a Buy B10, whether automatic or judged.
They say "Don't fight the Fed". The Sell S11 is trying to do just that
now.
In effect, we are now putting NYSE Down Volume ahead of NYSE breadth. This is
because the Peerless V-Indicator weights NYSE DownVolume 17.6% more than
NYSE Up Volume. The P-Indicator stands now at +182. A good S11 has
occurred
with higher P-Indicator readings in 2010. On May 26th of that year, the P-Indicator
peaked at +431, a few days after the S11 and just before the DJI dropped 13.5%.
Though the DJI rose above the round-number 14000 resistance, it still has
not closed above the 2007 closing high of 14165. Many market top occur only
after a one-day nominal and marginal new closing high above some previous
high closing.
.
In addition, the dramtic recent weakness in the key ETFs' Closing
Powers
relative to their Opening Powers is usually a warning of coming weakness.
See SPY and DIA.
The rising of the red 10-day ma of Down volume above the blue 10-day
ma of Up Volume can bring a drop to the lower band, but not if it quickly turns down.
So, we will want to watch it. See its chart below.
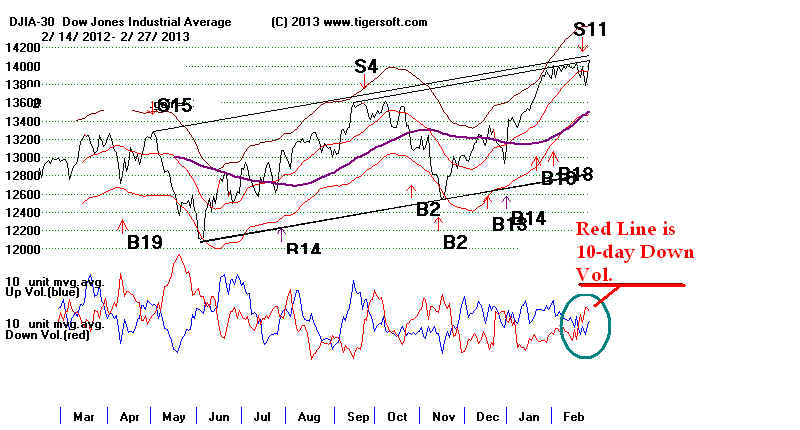
If the unusual Down Volume (institutional selling) comes to an end in the
next week or two, the V-Indicator will turn positive and the market should advance
more eaily again. It's a fair guess that much of the selling is pre-planned
selling at the resistance posed by 14000 and the rising upper-price channel
up to 14200. Above that, sell orders will be less
numerous and less concentrated,
because the DJI will then go into all-time high territory where theory holds
everyone long DIA has a profit and no one is selling simply to get out
even. So, a swifter advance then becomes more likely.
Accordingly, I would not stick stubbornly to the Sell S11 if the DJI closes
above 14000. In that case, I would consider the DJI to be giving a judged
Buy B10, even if none appear. Butressing my desire to
limit the Sell S11's
exposure to a rising market now are several other considerations:
1) The Last time the US Government began to halt some of its operations
because of Republican unwillingness to pass a budget acceptable to the
White House was in November and December 1995. This proved to be
an excellent time to buy stocks.
2) Most January market take-offs do not bring sell-offs to the lower 3.5%
band until a March sell signal.
3) Having a Democrat in the White House typically adds a lot to
the market's prospects in the stock market after a Presidential Election.
That, at least was true in 1945, 1949 (after mid-year), 1961, 1965, 1993, 1997
and 2009, but not true in 1977 when the very financially orthodox Carter was
President.
4) Theoretical V-Indicator S9Vs from before May were too unreliable
to allow.
---> To All Key Index and Lesding Stock Charts
Wednesday's +3 point jump in Home Depot should have been spotted as a sign
the market was ready to do more than rally to 14000. Watch the leaders for
clues like this.
---> 105 +65 MAXCP stocks Bullish MAXCP Stocks (2/27/2013)
BULLish plurality
---> 46 -77 MINCP stocks Bearish MINCP Stocks (2/27/2013)
--->54 New Highs
on NASDAQ 8 new lows. BULLish
plurality
--->87
New Highs on NYSE 10
new lows.
2/27//2013 Key Values: DJI
14075 +175 la/ma=
1.009 21dmaroc = +.165 P= +182
Pch= -+94
IP21 = +.043 (on 1/30/2013 IP21 was
.293) V = -40 Opct = +.039
====================================================================================
OLDER HOTLINES
====================================================================================
2/26/2013
New Sell S11
The
Signal is backed up by declining Closing Power trends
in key
ETFs and Big DJI Stocks. Much More Up Volume Is
Needed
to Take DJI Up Past Overhead Resistance.
Without another Peerless Sell signal, a mild retreat to the 65-day ma seems
most likely. Our Stocks' Hotline now has more stocks short than long.
A reversal down from the 13950-14000 resistance would seem to be a good place
to go short DIA or SPY.
Bernanke insisted that the Fed would continue to pursue an expansionary
policy. The benefits outweigh the risks. The Budget debt as a percentage
of GDP is expected to narrow from 7% to 2.5%. He quote the Congressional
Budget's estimate that the scheduled spending cuts of March 1st would constitute
a 0.6% fiscal drag in economic growth. "Besides having adverse effects on jobs
and , incomes" the March 1st
spending cuts would actually "lead to less actual
reduction."
I have yet to hear this statement mentioned on CNN. Why?
If the automatic spending cuts are avoided, it will be bullish. That would likely
cause a new surge upwards. Unfirtunately, market professionals are not anticipating
this, if are to judge by the steep Closing Power downtrends. Look at DIA's and
SPY's candle-stock charts. Closing Power is falling
sharply while Opening Power is
rising quickly. Something has to give in the "tug of war." Usually,
the Opening
Power is wrong. Meanwhile, the broad-based IWM shows a bearish head/shoulders
and a swiftly falling Closing Power.
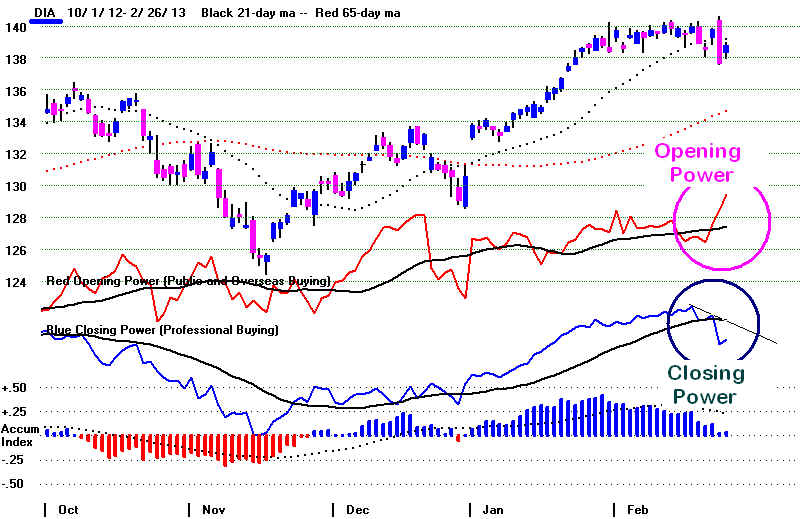
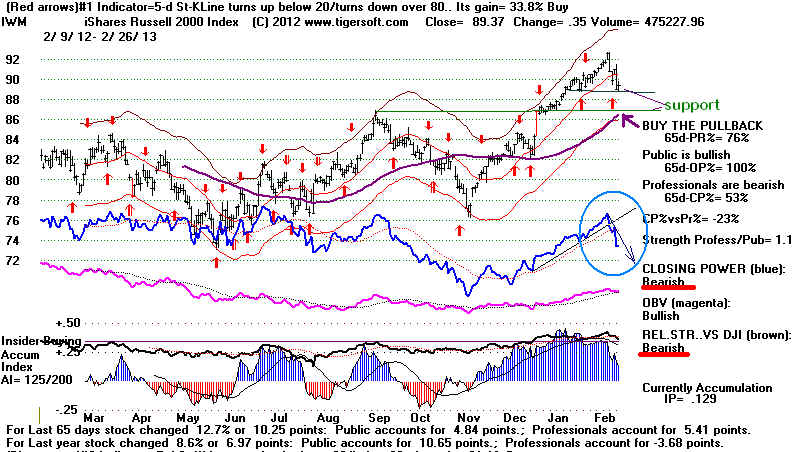
---> To
All Key Index and Stock Charts
---> 40 +5 MAXCP stocks Bullish MAXCP Stocks (2/26/2013)
---> 131 -7 MINCP stocks Bearish MINCP Stocks (2/26/2013) Bearish plurality
--->23 New Highs
on NASDAQ 16 new lows. BULLish
plurality
--->32
New Highs on NYSE 20
new lows.
2/26//2013 Key Values: DJI
13900 +116 la/ma= 0.997 21dmaroc = +.004 P= +87
Pch= -+14
IP21 = +.004 (on 1/30/2013 IP21 was
.293) V = -68 Opct = -.05
====================================================================================
OLDER HOTLINES
====================================================================================
2/25/2013
New Sell S11 Highlights The
Parallel
Now To May 2010 and
Other Market Tops.
This is not by itself a powerful signal, but it is reliable and produces
only small paper losses. It also gives Peerless a way to call tops
like the one in May 2010, when Peerless gave no other Sell signal.
The
typical gain is 6.7%. Its typical track record would be consistent
with a decline to the 65-dma with a rally possibly as high aso 14200.
S11
Other Gain When
Biggest Paper
Signals Reversed
Loss
------------------------------------------------------------------------------------
2/26/1992
2.3%
none
3/25/1996
2.8%
0.8%
4/23/1998
also S15
16.5%
2.1%
7/7/1999
also S9 5.6%
1.2%
4/25/2000
also S2
7.0%
none
Dubious because DJI was up 2% on day of
signal.
2/17/2004
5.6%
1.2%
5/1/2008
also S9 12.7%
none
4/16/2010
4.5%
1.7%
3/14/2012
also S15
3.6%
0.3%
2/22/2013
?
?
---------------------------------------------------------------------
Avg. 6.7% 0.8%
Look for an update tomorrow on the Tiger Elite Stock Professional Page. Others
who want this signal in their software and a number of other corrections and
modifications, should contact me: william_schmidt@hotmail.com
The charge is $75 for this update.
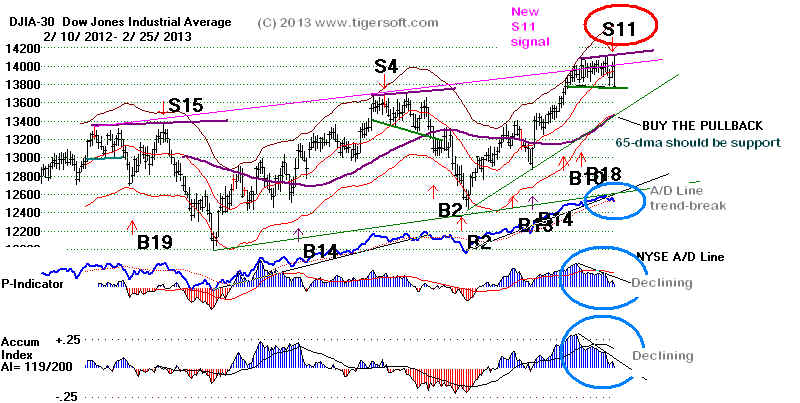
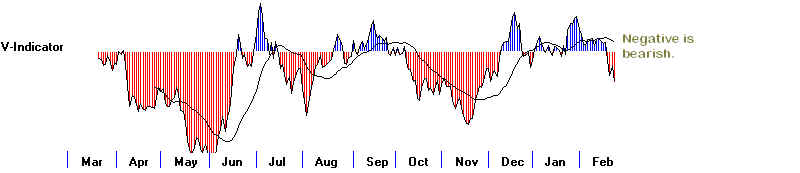
---> To All Key Index and Stock Charts
---> 35 -99 MAXCP stocks Bullish MAXCP Stocks (2/25/2013)
---> 138 +71 MINCP stocks Bearish MINCP Stocks (2/25/2013) Bearish plurality
--->27 New Highs
on NASDAQ 23 new lows. BULLish
plurality
--->25 New Highs
on NYSE 22 new lows.
2/25//2013 Key Values: DJI
13784 -216 la/ma= 0.988 21dmaroc = -.035 P= +73 Pch= -101
IP21 = +.009 (on 1/30/2013 IP21 was
.293) V = -68 Opct = -.055
The DJI Looks A Lot Like It Did in May 2010 right before the
13% Drop.
A more decisive break-down below 13800 will be needed to start a further
decline.
Use any rally to sell more stocks and to take more short positions. Bernanke's
Testimony tomorrow will be important. Continuing QE-III will help support the
market.
Any Hint of a reversal to his easy money policies will be bearish. Later in the week
the market will be forced to cope with the Republican insistence on Austerity
The sudden reversal today after a strong opening shows how much resistance still exists
for the DJI above 14000. NYSE Up volume has been weakening. That has caused
our
V-Indicator to become negative even as the DJI closed at 14000 yesterday above
the 21-day ma and up 12%-13% from its low of the last 3 months. As I warned last
night,
this combination (which I now call a Sell S11) has a reliably bearish track record
when the DJI is in a bull market and it does not occur in the first two quarters
of the year before a Presidential Election, a period that also neutralizes Sell S9s
and Sell S12s. Profit-taking will likely drive the DJI down to the rising 65-day ma
where we probably see a new Peerless Buy signal, barring more jolts from our
politicians.
The Key ETFs' Closing Powers dropped sharply today.
The CP's now are in distinct downtrends having formed their
own head/shoulders patterns.
See the CLosing Power reversals of DIA, SPY, QQQ, IWM and MDY. This is
short-term bearish. A test of the rising 65-dma seems needed now. After
the
recent high levels of Accumulation in the indexes, that level should make a
good place to buy when the Closing Power downtrends end.

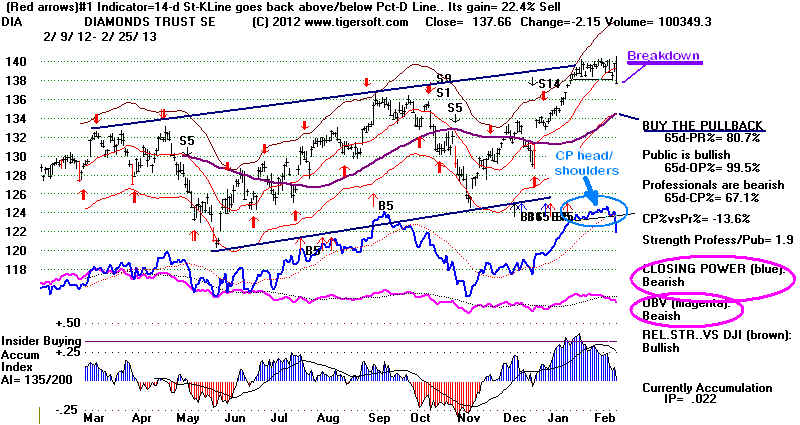
=====================================================================================
OLDER HOTLINES
=====================================================================================
2/22/2013 No
Peerless Sell Signal. The Peerless Buy B10
and Buy B18 still suggest
new highs and a run to 14200. The Closing Powers have
quickly jumped back above their rising 21-day ma. This is usually bullish. But
not
always. A little more rally with the V-Indicator still negative will make the
market
bear a striking resemblance to the May 2010 top just before its quick 13.5% decline.
And that case is not the only one with a bearish outcome given a negative V-Indicator
with the DJI up more than 11% in 3 months and 0.8% above its 21-day ma. A
little more rally and then a sell-off would also set up a head/shoulders pattern
that would look a lot like the pattern in May 2010. See below.
Cheap money has enabled the market to run upwards. Will Bernanke stick to his
plan to keep rates very low until official unemployment is back to 6.0%?
I have said
that I thought this was likely. Inflation now is lows.
But his every
word to the Senate Banking Committee
will be closely watched on Tuesday.
At least two Republican Senators, Corker and Vitter, insist his only concern should
be
"price stability". Unemployment should not be the FED's concern, they
maintain,
despite the Humphrey-Hawkins
Act of 1978.
Will the DJI do another May 2010?
The similarities to the market in early May 2010 cause
concern. See below.
Be as quick as Professionals were then to reverse positions if the DJI support at
13800 fails. Traders should wait to see if the Closing Power of SPY and DIA
quickly drop back below their 21-dma ma. as they did in 2010. That would,
in my mind, justify selling their long ETFs.
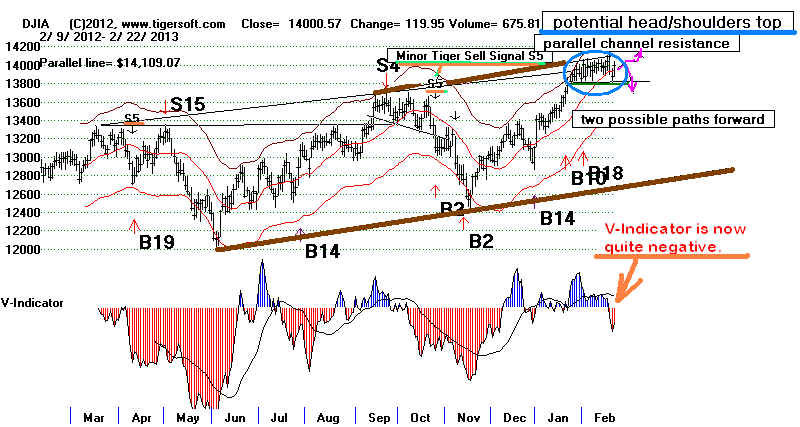
There is a looming danger now that politicians will "mess with" the bull market.
That is why, I think, the DJI now resembles the top in May 2010 just before
a Tiger Sell S5, a completed head/shoulders pattern and a 13.5%
decline. If the DJI closes below 13800, add more bearish MINCP stocks
and sell long positions in the major market ETFs. Let's wait to close
out these
long ETFs while as we wait and see what the next few days bring. I doubt if
Bernanke has gone this far just to reverse course before the 6% unemployment
goal has been achieved.
Selling now is not consistent with Peerless orthodoxy at present even though
the risks now of being out of the market now seem limited because of the overhead
resistance..
But, perhaps, Peerless should be amended even though I do not like to make additonal
work for myself. Note now that a Sell signal in the next day or two empasizing the
DJI being up 11% to 13% from the low of 65 days before with a clearly
negative V-Indicator
and the DJI being up 0.8% above the 21-day ma. back-tests
very well
Below are the occurrences of this prospective new Sell signal between February and
September. More on this tomorrow night.
Current 2/22/2013 14000.57
la/ma
ann.roc
P-I IP21
V-I Oct
1.004
.189 174 .061 -34 .043
2/26/1992 3283.32 DJI declined to 3208.63
on 3/12/1992 and Buy B11..
la/ma
ann.roc
P-I IP21
V-I Oct
1.009 .156 -16 .021 -12
. -.035
3/25/1996 5643.86 DJI declined to 5487.07 on
4/11/1996 and Buy B2/B9.
1.009 .028
4 .071
-31 -.064
4/23/1998 9143.23 DJI declined to 8665.29 on 6/16/1998
and B9 at 7632.53 on 10/1/98.
1.016
.316 -71
.037 -26 -.039
3/8/1999 9727.60. Big Loss. But this is fitst
half of year before a Pres. Election
and sell signals here are distrusted,
7/7/1999 11187.35 DJI declined to 10019.71 on
10/15/1999 and B1/B17.
1.037
.307 16
.05 -15 .178
4/25/2000 11124.82 DJI declined to 10376.12 on
6/22/2000 and B2..
1.015
.013 -25 -.034
-43 -.093
7/2/2003 9142.84 DJI went sidewise for a month and then broke out with B10
at 9428.90 on 8/19/93. As with S9s and S12s, Sell conditions have
be be made very difficult to meet in this period.
1.003
.288 +259
.067 -29 .259
2/12/2004 10712.88 DJI declined to 9968.51
on 5/18/2004 and B2..
1.012 .181 +212 .06
-15
.053
5/24/2007 13441.13 DJI declined to 13424.39 on
6/8/2007.
1.008
.341 -55
.043 -75
.221
7/16/2007 13950/98 DJI declined to 12845.78 on
8/16/2007.
1.008
.341 -55
.043 -75
.221
March-Jume Sells were premature. Do not use this when a new
bull
market appears to be starting based on numerous Peerless Buys.
4/16/2010 11018.66 DJI declined to
9686.48 on 7/2/2010.
1.009
.311 185 .061 -65 .289
3/14/2012 13194.10 DJI declined to 12101.46 on
6/4/2012.
1.019 .295
129 .069 -24 .231
At A Cross-Roads

Technically, the stock market is at a cross-roads. Professionals expect the uptrend
to
continue but there is a good chance that politicians will change the game and
"mess up" the bull market. That Professionals are bullish can be
seen how the
Closing Powers turned up for DIA, SPY and QQQ at their rising 21-day ma. They
dropped below it Thursday but bullishly hooked back up on Friday.
The
technical problem is that the DJI is at the top of its 10-month price channel
and
has reached the 14000 psychological resistance and the 14167 resistance of
the
historical old high in October 2007. This gives institutions and indivuduals
an
exact level to sell to get out even, to take profits and to satisfy ego needs, too.
So
their sell orders are concentrated and more effective.
There
are three big problems now. The second is the uncertainty about whether
Bernanke going further will risk a bigger bubble in the stock market by insisting on
providing
even
more liquidity to banks. And the third is whether the Republicans in the House
will
be about the last political elite on the planet to see that Austerity when there is high
national unemployment is a cruel failed experiment. Most Europeons recognized this
last
Summer. The Japanese now, too, have discarded Auserity.
Austerity's failure in the UK between 1919 and 1937 was the subject of my dissertation
at
Columbia in early 1970s. So, from my point of view, this debate had long been
ended.
The Keynesian Revolution worked
well until the 1970s, when the US War in Vietnam
and
leaping oil prices made government leaders much more fearful of inflation
than
high unemployment. Keynes was held such high esteem in the 1950s and
1960s
that Time Magazine put
him on their cover on December 31, 1965, right before,
incidentally, a major market top.
3 Big Problems Now for The Market
The
first is technical. The DJI's chart and the internal strength indicators now
look
a lot like they did in early May 2010 right before a sharp sell-off.
See below
how
Professionals very quickly reversed their SPY positions at the early May
2010
top. I think we have to be prepared to do the same.
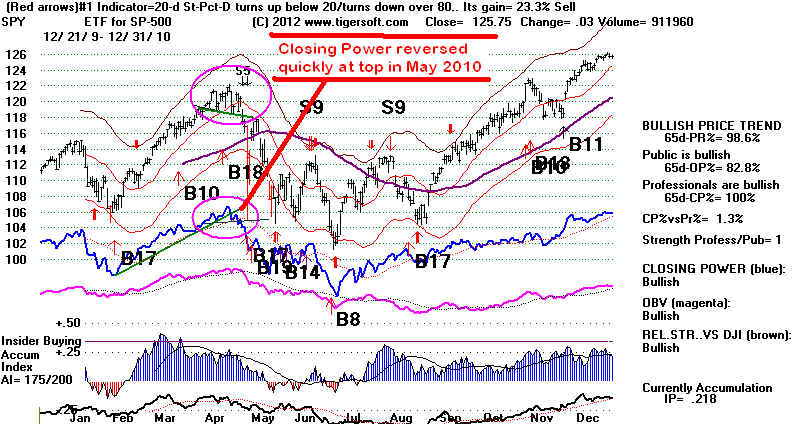
More
Up-volume will be needed to take away the over-head resistance. The
Peerless V-Indicator has slipped into negative territory. This sets up a dangerous
parallel with May 2010. Compare the chart of the DJI just before a 13.5% decline
that
began after May 3rd, 2010 with the DJI chart and the key values now.
The
V-Indicator is now clearly negative andthe OPct and P-I are much lower.
And
very important, the DJI was forming what might become a head/shoulders
pattern.
5/3/2010
2/22/2013
-----------
--------------
DJI
11151.83
14000.57
up from 65-d low 12.5%
12%
LA/MA
1.008
1.004
21-dma roc
.242
.189
P-I
323
174
IP21
-.095
.061
V-I
-52
-34
Opct
.428
.043
May 2010 Top Called by Completed Head/Shoulders.
V-Indicator like now was negative at the apex of a potential
head/shoulders. There was no Peerless Sell signal.
There was a Tiger Sell S5.
The second two problems are political. First, will the House Republicans insist on
Austerity in their efforts to limit government and reduce taxation.
Amd second, will Bernanke and the Fed keep the stock market rally going by
not changing the policies of QE-III. Bernanke will testify Monday and Tuesday
before Congress. Watch this closely. A reversal of course by the Fed
would
undoubedly bring a very sharp sell-off in stocks. I don't think this is
likely.
Bernanke's opponents may be a majority in the House of Representatives,
but they are a minority on the Federal Reserve Board. See the note below
I received and sent to a friend this afternoon.
Question to me about the Fed's QE-III policies....
What do you make of this? I find it hard to believe anyone from the Fed would
admit to something like this.
http://www.examiner.com/article/fed-admits-that-stock-market-gains-are-tied-to-central-bank-manipulation
My reply:
It's true. But the Dallas Fed Governor is in a minority now, though, so, low rates
and
Fed QE-3 may continue. Bernanke meets with Congress ...Tues...
.
In his mind, absent a massive govt. stimulus spending program, the best way to
prevent
a Depression was and still is to provide liquidity to banks and boost the spending of
those with an interest in the market.
Many writers and close observers feel that the Europeon and Japanese austerity
"experiments" have cruelly failed. Professional currency traders see
this now.
The Chart of BP1600 shows Professional Selling and Public Buying.
The Big Fail: UK Austerity Programme ...
See the Guardian-Observer
http://www.guardian.co.uk/commentisfree/2012/jun/02/austerity-failed-will-hutton
So, what is another path consistent with modern capitalism and given the concentration
of wealth and political power? Bernanke studied the Fed policies of the early 1930s
as closely as any scholar...
Bill |
---> To All Key Index and Stock Charts
---> 134 +42 MAXCP stocks Bullish MAXCP Stocks (2/22/2013) BULLish plurality
---> 67 -33 MINCP stocks Bearish MINCP Stocks
(2/22/2013)
--->59 New Highs
on NASDAQ 17 new lows. BULLish
plurality
--->75 New Highs
on NYSE 10 new lows. Bearish
plurality
2/22//2013 Key Values: DJI
13880 -47 la/ma= 0.966 21dmaroc = .144 P= +96 Pch= -113
IP21 = +.041 (on 1/30/2013 IP21 was
.293) V = -56 Opct = +.042
------------------------------------------------------------------------------------------------------------------------------------------------------
OLDER HOTLINES
-----------------------------------------------------------------------------------------------------------------------------------------------------
2/21//2013 No Peerless
Sell Signal. The Peerless Buy B10
and Buy B18 still suggest
new highs and a run to 14200. But the selling at
14000 has been very heavy. That is why the current value of the Accumulation
Index has fallen back to almost 0 on the DJI chart. Bearishly, the number
of stocks making Closing Power new lows has not risen above the number
of stocks making Closing Power new highs.
I expect the
DJI in the next week to trace out a potential head and shoulders pattern,
with a neckline at 13800 and a right
shoulder a little above 14000. If an H/S pattern
does develop, a close below 13800 would
likely produce a Sell S10. On such a break-down
below 13800, I would probably judge an
S10 and look for a quick decline to the lower band.
The DJI fell down
to the 13800 support and then rebounded. A small rally from here
in the DJI is to be expected as the
markets wait to see if there will be any compromise
between the expansionist
Democratic President and the austerity-focused Republican
majority in Congress. Probably,
there will be no compromise, even though both sides
are responsible for the silly deadline
they have set for themselves. Maybe not for a month
or two. Each side has more to gain
politically in the short run by standing firm. But the
consequences of $500 billion in automatic
spending cuts will surely cause an uproar
among the different constituencies
affected, so I doubt if the deadlock will last 3 months.
. But that is all a guess. Watching SPY's
Closing Power now should serve us well, just as it did at
the end of 2012.
I would expect Professionals to know in advance of the media if there is a
break-through
and a compromise over the Federal Budget.
So, we should probably watch and rely most
on the the direction now of the key ETFs'
Closing Powers. Each has broken its steep
CP uptrend-line and is testing the
CP 21-day ma. See SPY below.
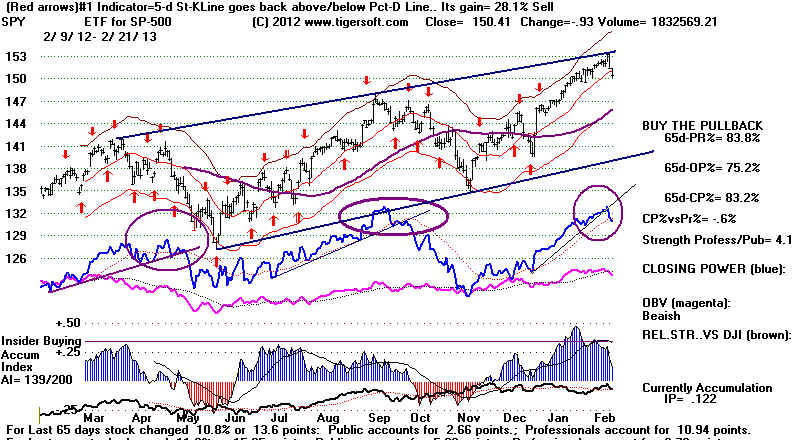
Until these
Closing Powers hook back upwards above their 21-day ma, I would
sit on the sidelines except to go short
some of the Bearish MINCP stocks. I would
also take profits in some of the years'
big gainers if they have broken their CP uptrendlines,
This should apply mostly to stocks having
an AI/200 score below, say, 150. The higher
Accumulation stocks will very likely
rebound. If they makes new prices highs without
corresponding Closing Power or
Accumulation Index strength, I would sell them. That
is the course I will take in our Stocks'
Hotline.
---> To All Key
Index and Stock Charts
---> 92 MAXCP stocks Bullish MAXCP Stocks (2/21/2013)
---> 102
MINCP stocks Bearish MINCP
Stocks (2/21/2013) Bearish plurality
--->24 New Highs
on NASDAQ 22 new lows. BULLish
plurality
--->20 New Highs
on NYSE 22 new lows. Bearish
plurality
2/21//2013 Key Values: DJI
13880 -47 la/ma= 0.966 21dmaroc = .144 P= +96 Pch= -113
IP21 = +.041 (on 1/30/2013 IP21 was .293) V = -56 Opct = +.042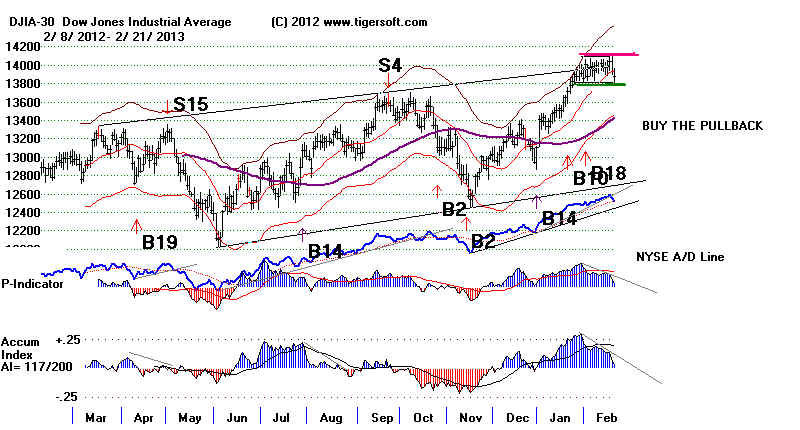
=====================================================================================
OLDER HOTLINES
====================================================================================
2/20//2013 More Weakness
Seems Likely. But the Peerless Buy B10
and Buy B18 still suggest
new highs and a run to 14200, at least. Our Bearish
MINCP
stocks are starting to show very considerable weakness now that the new-year
short-covering has ended. So, hedgers are invited to use some of these stocks as
short-sales. Having not been able to overcome the resistance at 14050, the
DJI must now test the 13800 support. A break in that would then call for a decline
to
the lower 3% band. Once again Washington will determine where the "free
market"
will go.
The
real problem for the market now is the Budget, not the Fed's monetary
policies. Without compromise, the economy will be hit head-on by the
de-stabalizing
effect of austerity in an on-going recession. In 1937, this combination
brought on a
47% stock market decline in 5 months. Unlike now, the NYSE A/D Line and Peerless
P-Indicator then were already very weak. A Peerless Sell S9 would have called the
August top.
No Sell S9 is likely now. But we will have to watch the rapidly falling Accumulation
Index. A 2%-3% DJI rally from here could bring a Sell S12.
See Roubini - "Don't
Underestimate The Effects of the Sequester".
See my Blog,
"Austeritry and 1937 Crash"
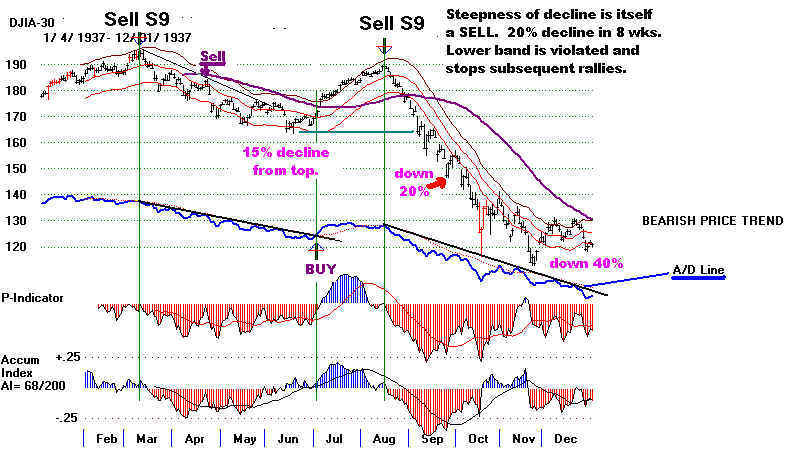
Peerless remains on a Buy but the steep Closing Powers were violated today. The
DJI is now testing its rising 21-day ma. That moving average is still rising at an
annualized
rate of +23.8%. This is normally strong enough to predict a recovery from the rising
21-day ma provided the current Accumulation Index (IP21) is above +.07. But the
TigerSoft IP21 is now only +.06, having fallen all the way down from the +.293
reading
less than a month ago. So, support cannot be assumed now at the 21-day ma.
Rather,
a test of the DJI recent support at 13800 will most probably be needed.
Without a Peerless Sell signal or a DJI head/shoulders' top pattern, I would think
the DJI will recover and surpass 14167. This view is supported
1) by the strong tendency of January take-offs to rally, at least until March;
2) by the presence of so many high Accumulation breakouts (which puts these
stocks's shares in strong hands);
3) by the continued strength in the big banks and brokerage stocks;
4) by the sell-off in Gold
5) and by the absence of a crisis which would suddenly evaporate investor
confidence.
Of course, if the FED were suddenly to raise rates and declare it will no longer pump
in money to big banks by buying mortgages, all bets would be off. But the Fed's
Minutes today, which is what is said to have sparked today's sell-off, only stated
that
there were "some" among the Fed Governors who wanted to end "QE-III",
Bernanke's
quantitative easing. As far as we can tell, this is the same minority who have had
this position for some time. There is nothing yet that indicates that the Fed will
change its monetary course.
Bernanke has his critics. But many others credit the Fed's easy money policy with
success in boosting business and Wall Street confidence at a critical time. So,
his position is still not easily challenged. Among academics, many blame tight
money
and fiscal austerity in 1930 and 1931 with bringing on the long Depression.
I would agree that the "trickle-down" to Main Street from QE-III is limited so
far.
But what other choice do we have, given the political grid-lock in Washington?
. If Gold
was now rising, there would be much more pressure on Bernanke to
change course to prevent the Dollar from collapsing, But the Dollar is not
weakening. It is the Yen which is collapsing. The Euro
looks like it is forming a top.
Gold and Silver's weakness today
was very notable. Crude Oil remains below $100/b.
Food prices are falling. So, I can't believe
Bernanke will so easily back down and
reverse course.
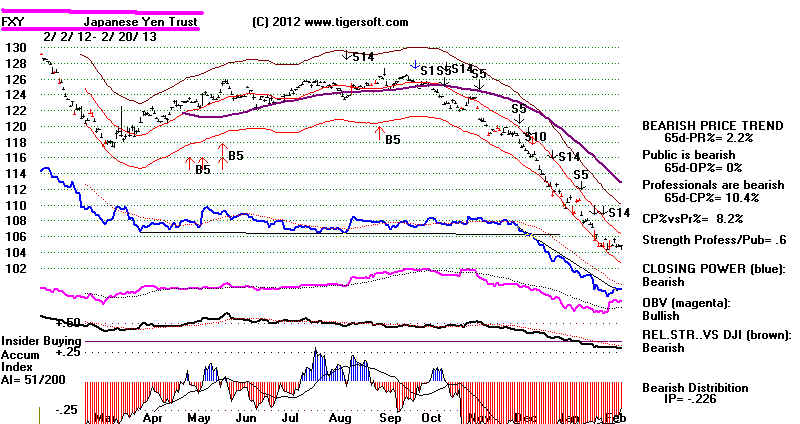
I mentioned yesterday that the DJI has formed an unusally tight and flat trading range
much like was seen in October 1928, just before the DJI ran up 60%. The Fed
in the second half of 1928 did not change their monetary policy. They sat on their
hands. The Fed probably will not do this for six more months, for fear of creating
a stock market bubble, but I doubt if they will say anything now, if only because
they must wait and see what the Republican Congress and the White House come
up with for a Budget.
NY Times articles tonight:
G.O.P. Resists Obama's Push for Tax Rise to
Head Off Cuts
By JONATHAN WEISMAN
Budget Cuts Seen as Risk to Growth of U.S.
Economy
By BINYAMIN APPELBAUM and ANNIE LOWREY
---> To All Key Index and Stock Charts
---> 179 MAXCP stocks Bullish MAXCP Stocks (2/20/2013) BULLish plurality
---> 96 +16
MINCP stocks Bearish MINCP Stocks (2/20/2013)
Chart of MINCP Stocks as an Index show serious breakdown and steady red
Distribution..
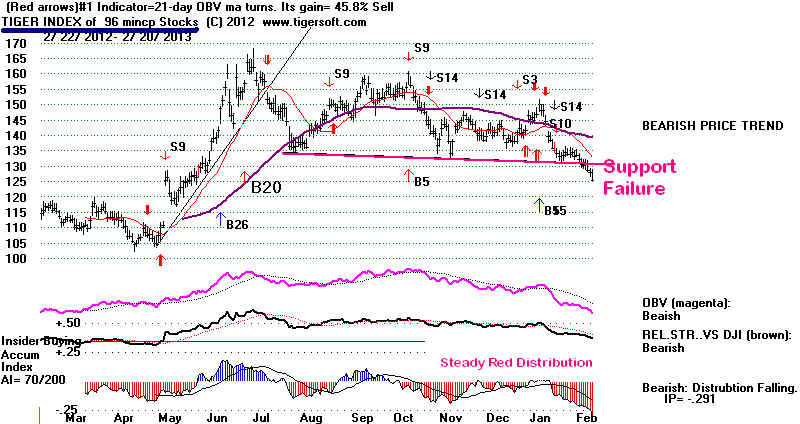
--->43 New Highs on NASDAQ
13 new lows. BULLish
plurality
--->46
New Highs on NYSE 36
new lows. BULLish plurality
2/20//2013 Key Values: DJI
13928 -108 la/ma=1.00 21dmaroc = .238 P= +208 Pch= -122
IP21 = +.06 (on 1/30/2013 IP21 was .293) V = -22 Opct = +.146
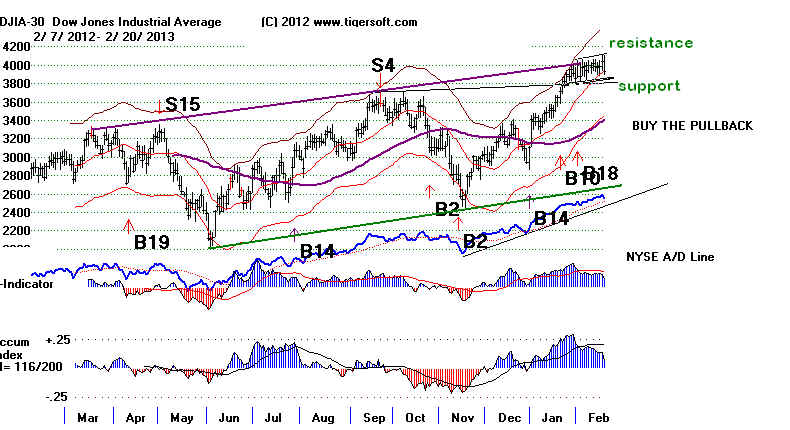
=====================================================================================
OLDER HOTLINES
====================================================================================
2/19/2013
Without a Peerless Sell Signal, we should respect the
bullishness
of the many stocks making new highs with very high Accumulation. Goldman Sachs'
bullishness in this respect augurs well. That the best earlier example of low DJI
volatility on strength for a month occurred in 1928 right before the DJI rose 60%
is another bullish sign. But will the House Republicans cooperate and help
pass a budget without very severe cuts? I think so. At least, that is what
Professionals
with very good access to them are now thinking, judging by the rising TigerSoft
Closing Power.
---> To All Key Index and Stock Charts
---> 496 +115 MAXCP stocks Bullish MAXCP Stocks (2/19/2013) BULLish plurality
---> 80 +6
MINCP stocks Bearish
MINCP Stocks (2/19/2013)
--->172 New Highs on NASDAQ
3 new lows. BULLish
plurality
--->262 New Highs on NYSE 12
new lows. BULLish plurality
2/19//2013 Key Values: DJI
14036 +54 la/ma=1.009 21dmaroc = .377 P= +329 Pch= -20
IP21 = +.143 (on 1/30/2013 IP21 was .293) V = +19 Opct = +.269
The Buy B10 and last Friday's Buy B18 still suggest new highs
and a run to 14200, at least. The A/D Line and Closing Power
uptrends are intact.
This a rally that is benefitting high Accumulation Closing Power-confirmed breakouts.
The big banks stocks are very happy with it, too. However, the DJI is up to the top
of its price channel. So, one might think that a 2%-3% decline could easily follow
as the over-extended Closing Powers retreat back to the support of their own 21-day ma.
DIA's Closing Power Bullishly Keeps Rising.
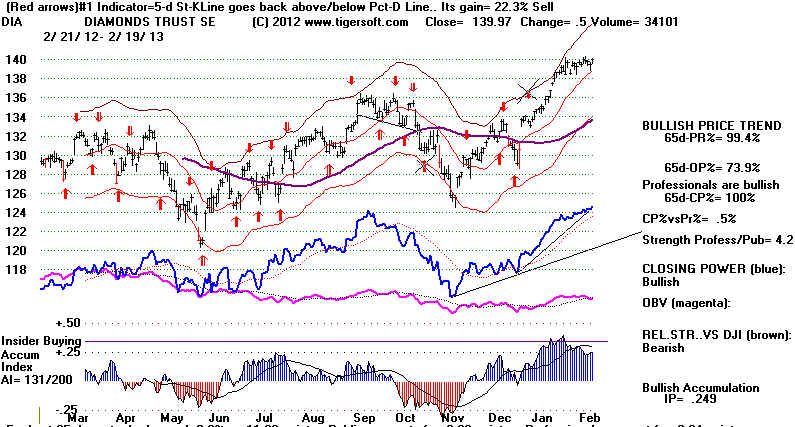
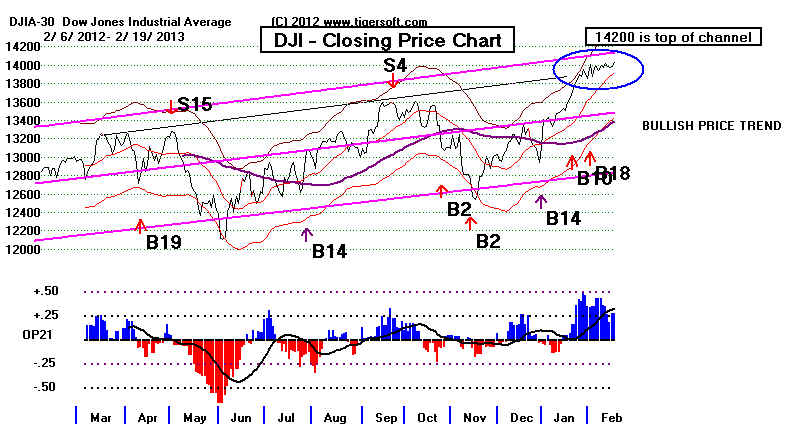
The narrow, low volatility, trading range the DJI is now in is mostly closely associated
with a breakout rather than a retreat. In fact, when I look back and trying to find
earlier examples of two weeks of nearly flat, low volatility trading after a rally to new
highs, the very bullish example of 1928 seems to be the closest parallel to now in the
90+ years since 1915.
Notice how bullish the breakout was
past the one-month long, flat tropped trading range in 1928..
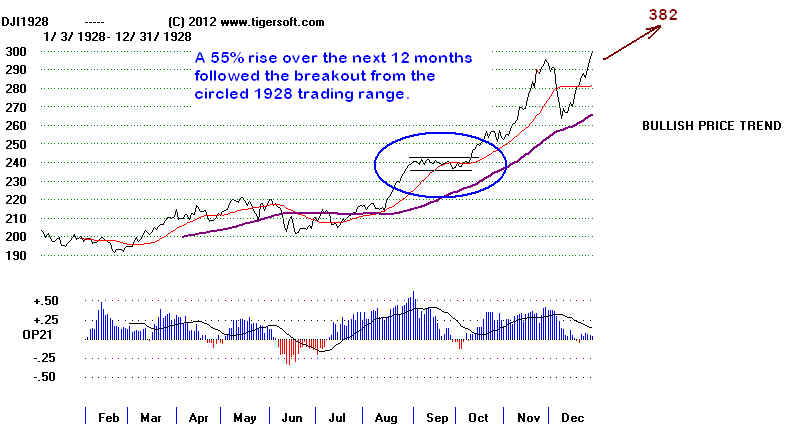
Goldman Sachs and The Bull Market
Goldman Sachs is soaring now and shows very high Accumulation. It now shows
higher Accumulation than it did in October 2006 below 140 on the way to 230 in
April-May 2007. We might want to ask how well GS called earlier declines.
Should we be as bullish as GS is? The answer seems to be "Yes". If
history
repeats, the DJI will only decline when Goldman, itself, shows much lower
Accumulation Index readings and forms a head/shoulders top pattern. See below
how closely GS tracked the SPY from 2006 to 2008.
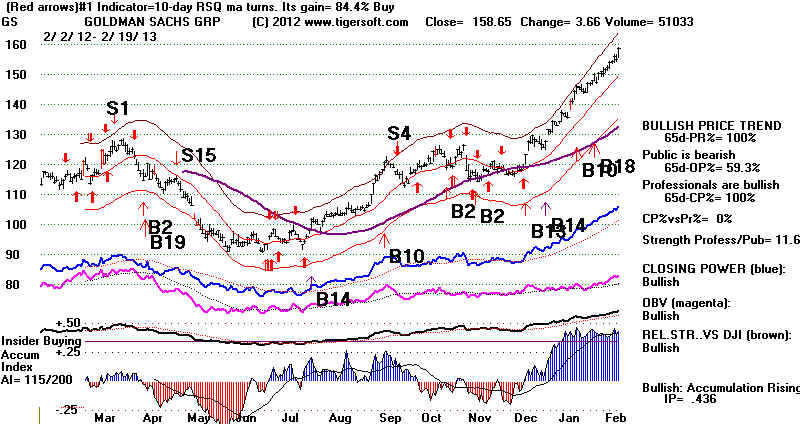
2006
GS shows superimposed Peerless Buys and Sells
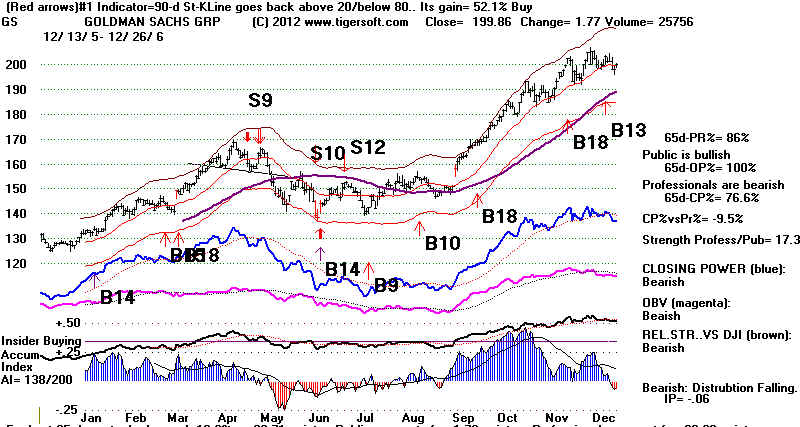
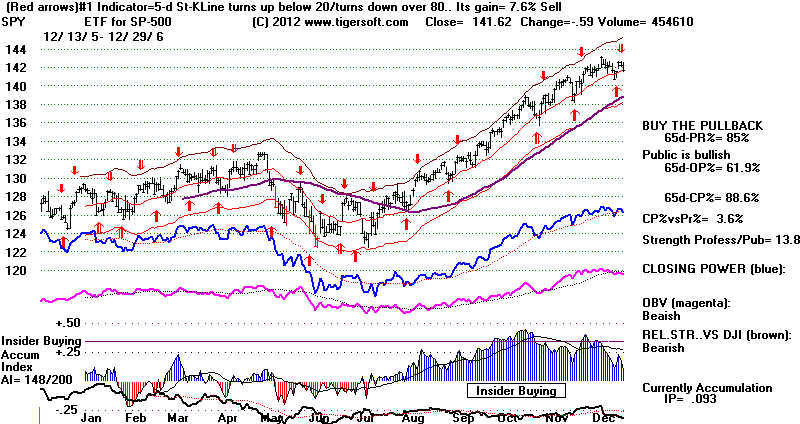 |
2007
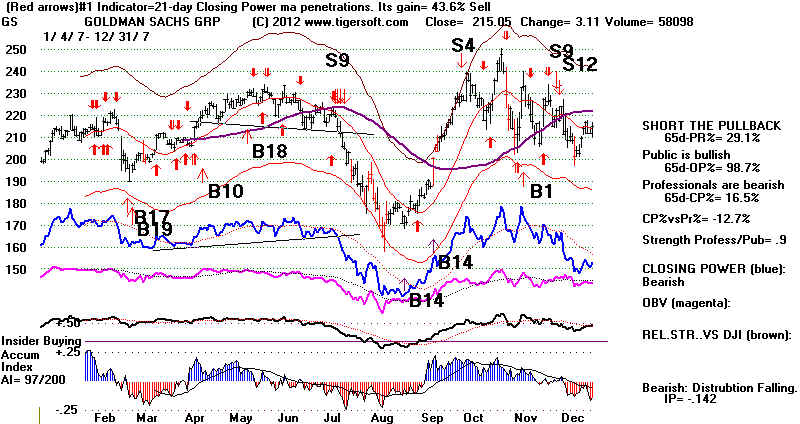
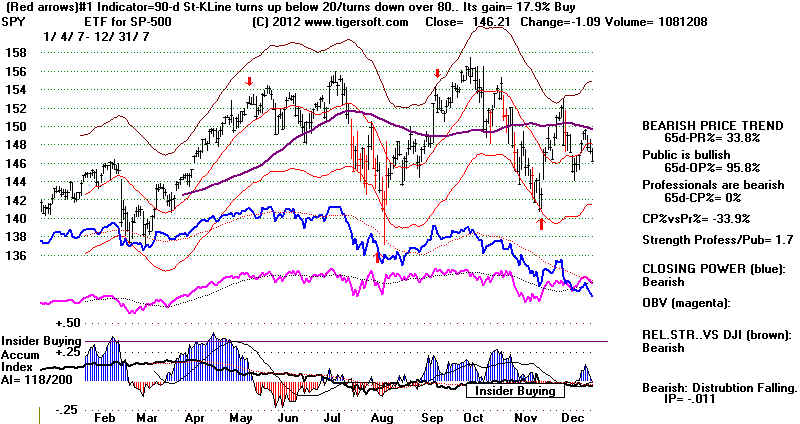 |
2008

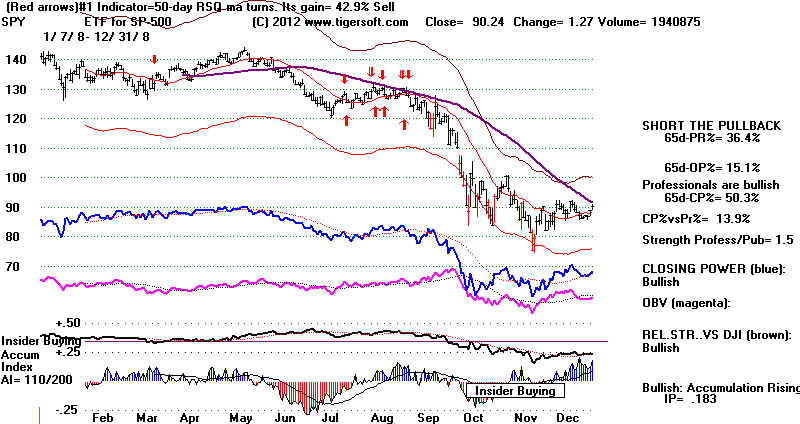
|
=====================================================================================
OLDER HOTLINES
=====================================================================================
2/15/2013
The
Buy
B10 and last Friday's Buy B18 still suggest new highs
and a run to 14200, at least. Friday's drop in Gold
must be taken as a sign
of confidence in the Dollar and the Federal Reserve's low interest rate policies.
Technically, the Closing Powers are still rising for the key ETFs and the
NYSE A/D Line remains in an uptrend. However, let's see if the steep uptrendlines
are violated this coming week. This would suggest a minor decline of a percent or
two, rather than a move much higher above 14000.
SPY is so heavily traded, we must keep watching it, even though MSY and IWM
have been acting more strongly. The top of SPY's price channel is 2 points higher.
Let's see if we can't get there this week, assuming that Peerless remains on a Buy,
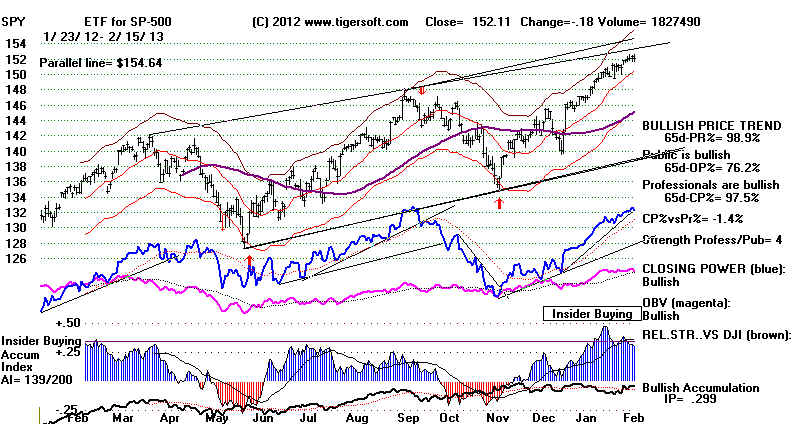
The internals of the DJI-30 right now are strong enough to suggest more of an advance,
even though 14000-14200 offer ample resistance. I looked back at past cases since
1965
when the key Peerless indicators' values were similar to what they are now.
These internals are most associated with rising markets which will rise 3% to 10% more
over the next one to two months and where good support is at the rising 21-day ma.
There
were 8 cases with key valuies within the ranges shown below.
Variable
Range
2/15/2013 Key Values
------------------------------------------------------------------
LA/MA 1.006 to
1.007 1.006
IP21
above +,12
.349
V-Indicator above 0
+17
P-indicator above 100
+349
Past Cases with
Key Values Similar To Now.
#1 2/6/1976 954.90 -
DJI retreated 1% to 21-dma and then rose 4%, past 1000 in a month.
#2 7/1/1987 2409.76 - DJI retreated 1% to 21-dma and then rallied 8.7% to 2722.42 on 8/25/87.
#3 5/29/1995 -
4412.23 - DJI retreated 1% to 21-dm
and rallied 7.3% to 4736.29 on 7/17/1995
#4 7/31/1995 4708.47 -
DJI fell 2.7% and then rallied very
strongly..
#5 8/26/1996 5693.89-DJI
fell 1.5% to 5606.96 and then rallied very
strongly.
#6 1/13/2004 10427.17 -DJI
rose 3.0% to 10737.70 and then began 8 month
10 percent decline.
#7 4/29/2009 7957.06 -
DJI rose 13,1% before falling back to
lower band
#8 12/4/2010 10366.15 - DJI fell 1%
and then rose 4% to 10710.55 before falling back 7%
DJI CHANNEL BREAKOUTS
NEED TO BE CONFIRMED BY PEERLESS
The DJI faces resistance now at the top of its price channel using
the slope of
the May and November bottoms applied to the peak in September to crearte a rising
resistance line. Classic technical analysis (such as Murphy / Edwards and Magee)
would suggest that a clear breakout above the top of the channel, say 14200, would
set up 15300 as the upside target. The height of the channel is added to the
point of breakout. That may be so for
stocks, but it is not true for the DJI going
back to 1915.
When I go back and look at how the DJI behaved on price channel breakouts,
I find only 7 cases (25%) where the DJI reached such an objective without a
decline deeper than to the point of breakout. There were almost as many false
breakouts, 6 instances were found, where the DJI quickly fell more than 8%.
In one more case, it immediately fell 5%. You
can see all the DJI charts
I could find of channel breakouts since 1915 here.
So, I suggest that we not consider the trendlines and boundaries of these price
channels
as very sacroscanct, though a Peerless Sell signal at the top of a channel is clearly
significant and more reliable because of the added resistance.
Instead, it may be sufficient to know:
1) that an upside breakout produces positive intermediate-term outcomes
in more than 60% of the case;
2) that the 21-day ma and the point of breakout do offer some support; and
3) most important, that Peerless nearly always gives a major Sell when there
is going to be a significant, more than 5% decline ona false breakout.
I counted 15 clearly bullish outcomes after a channel breakout. There were 7
rallies of 5%
or more in the DJI without a pullback below point of breakout:
Oct 1915, July 1927, August 1928, May 1954, Nov 1985, Jan
1987, Apr 1995
There were 4 more DJI rallies of 3%-4% without a pullback to point of breakout:
Oct 1925, Feb 1964, Jan 1989, May 2007
And there were 4 small declines, each under under 3% and followed by a much bigger
rally.
May 1945, March 1986, Aug 1989, March 1998
But there were also 6 false breakouts and declines of more than 8%:
Oct 1963, May 1965, May 1967, Aug 1987, Feb 1994,
And in 4 more cases there was a 3%-5% DJI decline before bigger rally.
May 1935 , July 1955, Jan 1959, Jan 1989,
---> To All Key Index and Stock Charts
---> 381 -79 MAXCP stocks Bullish MAXCP Stocks (2/15/2013) BULLish plurality
---> 74 -16
MINCP stocks Bearish
MINCP Stocks (2/15/2013)
--->90 New Highs on NASDAQ
8 new lows. BULLish
plurality
--->145 New Highs on NYSE 16
new lows. BULLish plurality
2/15//2013 Key Values: DJI
13982 +8 la/ma=1.006 21dmaroc = .404 P= +349 Pch= +8
IP21 = +.139 (on 1/30/2013 IP21 was .293) V = +17 Opct = +.254
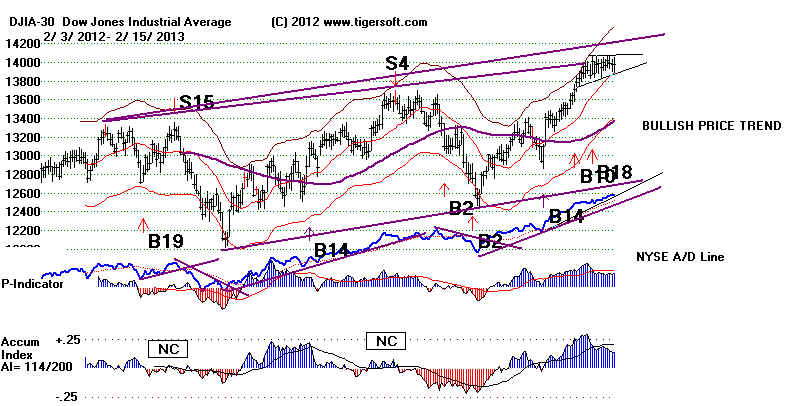
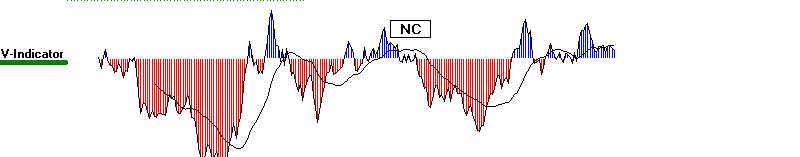
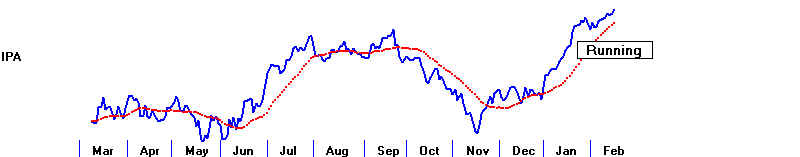
-
-----------------------------------------------------------------------------------------------------------------------------------------------------
OLDER HOTLINES
------------------------------------------------------------------------------------------------------------------------------------------------------
2/14//2013
---> To All Key Index and Stock Charts
---> 460 +68 MAXCP stocks Bullish MAXCP Stocks (2/14/2013) BULLish
plurality
---> 58 +18
MINCP stocks Bearish MINCP
Stocks (2/14/2013)
---> 108 New Highs on NASDAQ
12 new lows. BULLish
plurality
--->186 New Highs
on NYSE 12 new lows. BULLish plurality
2/14//2013 Key Values: DJI 13973 -10 la/ma=1.007 21dmaroc = .377
P= +341 Pch= -9
IP21 = +.142 (on 1/30/2013 IP21 was .293) V = +22 Opct = +.168
The Buy B10 and last Friday's Buy B18 still suggest new highs
and a
run to 14200, at least. Classic chart theory would hold that a breakout past
14200
would set up a target of 15000+. 1976's Chart Suggests Patience
Now.
It
took 7 failures over many months at the 1000-1020 flat resistance before the
DJI
pulled back more than 5%.
Resistance at 14000
As for the DJI,
what we have is a repeated failure to get past the round number 14000.
This is bound to discourage traders in DIA. And it will hurt SPY. But not IWM and MDY.
In this, we can look back at 1976 when it took no fewer than 8 failed efforts to
get past 1000 before the DJI fell more than 5% back from its highs. By then,
Peerless had given some sells and the key Peerless internal strenght indicators
had turned negative. None of these considtions is true now.
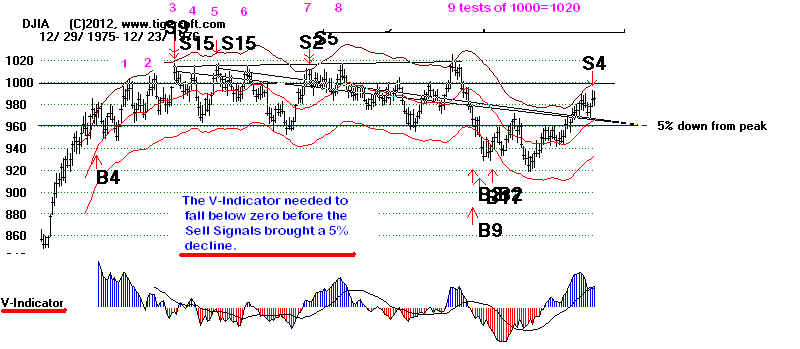
The
"Merger Mania" is building to a buying climax, but the theories of Peerless and
TigerSoft still require Peerless Sell Signals, NYSE and Closing Power uptrend-breaks,
head
and shoulders patterns and more weakening by the Tiger IP21 (Current AI)
to
turn us bearish. A negative Peerless V-Indicator would also be bearish. We
have
none of these indicator readings yet.
Merger Mania - My sense is we haven't seen anything yet.
With interest rates low, no anti-trust enforcement by the Justice
Department, billions in corporate coffers, a dispirited consumer
and hundreds of CEOs who are used to running their companies
like they were personal fiefdoms, what's to stop it?
Many investors recall the junk bond craze of 1989 and the Dot-Com bubble
of 1999. I
remember the conglomerate
craze of 1967 and 1968. We've arrived there again.
Clearly, the hoards of corporate cash are burning a hole in some CEO's
pockets. The SP-500 are estimated to be sitting on an estimated trillion
dollars. With the Obama's
Attorney General mum about the dangers of monoplies, with the lone exception being
the beer industry,
many
CEOs see it easier to buy out the competition than compete in a world where the smaller
consumer
has
limited buying power. Imperialism and meglomania are also corporate phenomenon.,
Once these
big
deals start to happen, egos, competition and the pyschology of the copy-cat take over. Now
borrowing costs are very low. The reputation of big banks seems restored. So,
merger specialists
can
make a much stronger case to CEOs eager for such advise. Expect trraders to bid up shares in the
hot
industries even more. This increases the pressure pnt
on the CEOs to "do the deal". It
is
also part of how stock market bubbles develop.
See the NY Times
article tonight "With Confidence on an Upswing, Mergers Make a
Comeback"
and
The
War for Corporate Cash Hoards Has Begun
Heinz (HNZ) $23 billion
Below are some stocks that have been suggested for study by one of my readers..
I do
not see in any of them the signs I have elsewhere identified of a potential take-over.
But,
this time may be different, of course.
APD, ATI, MWV, SPW, TYC, ATK, SWY,
NAV, NWL, WHR, CAH, HSP, BSX,
GCI, AMAT, EXPE, FLEX, JBL, AMD - See their charts here....
Compare them with those in the Blog I wrote on the subect in 2010
Tiger Blog Sept. 20, 2010
How
To Spot A Stock That Is about To Get A Takeover Bid ... - TigerSoft
But look at IEP, Icahn Enterprises, which was mentioned here last Fall.
It has built
up a 13% stake in weak Herbalife.
Study below IEP's tell-tale, high levels of Professional buying,
the steady Public Selling during the Accumulation phase, the bulges of Accumulatin, the
ITRS move above +.30, the red high volume gap and the clear price breakout as the
big advance started.
One way to pick
good takeover candidates is to find stocks showing a recent Closing Power
new highs while Opening Power is lagging, bulges of intense Accumulation
and a flat top, often caused by an attempt by the big buyer to keep the
stock from starting to run prematurely. But this market has been pushing prices
up. But now most have already broken above their 3-6 month flat resistance.
So,
we want now to look for a 12 month high spike in volume and a new 12 month
high. Run the Power Ranker against the Newhighs and MAXCP stocks. Many
good candidates appear in the Bullish MAXCP stocks
publiched here.
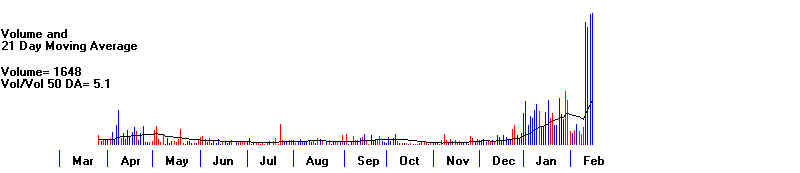
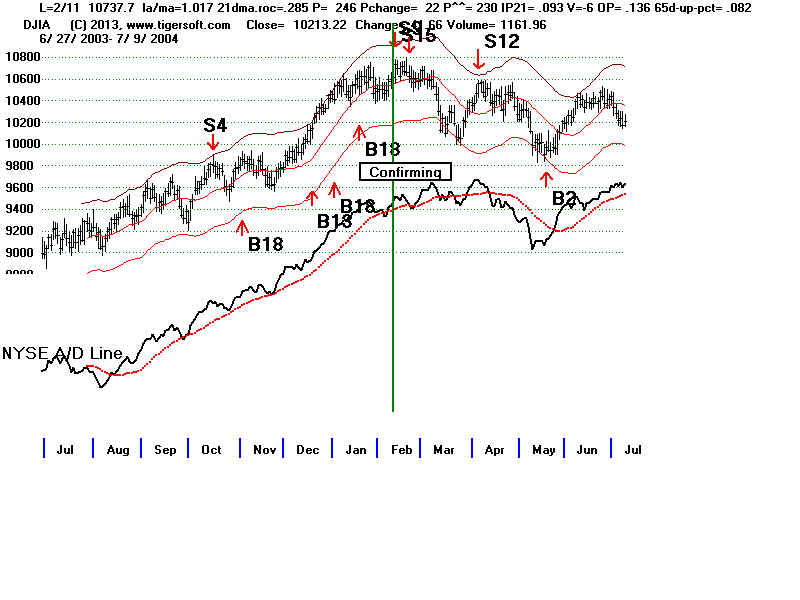
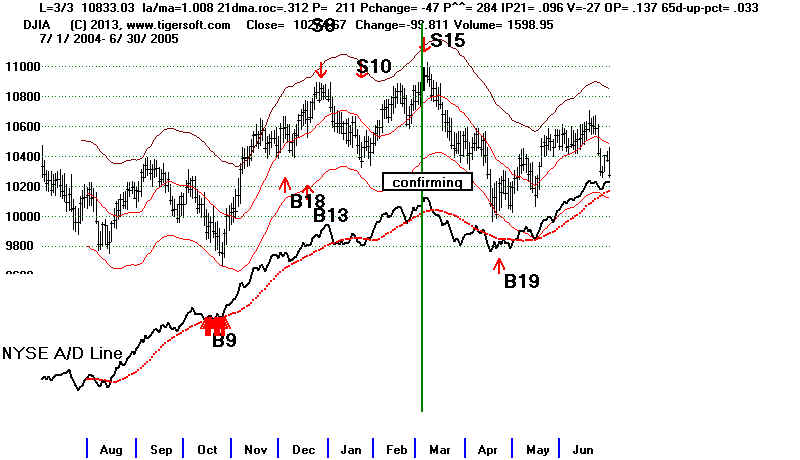
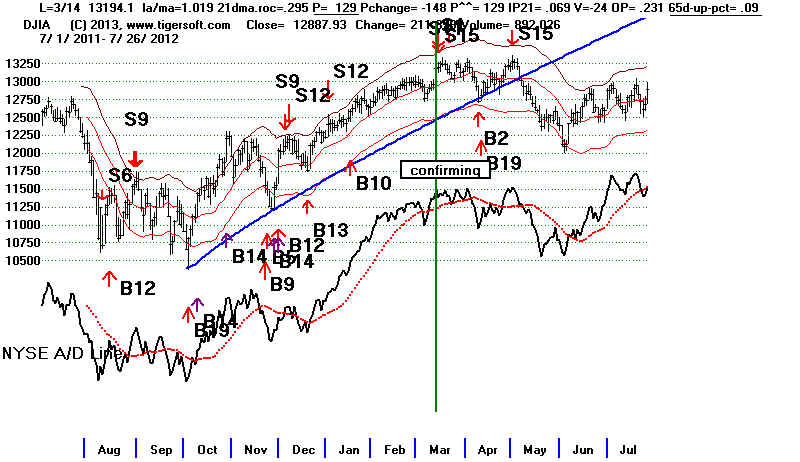
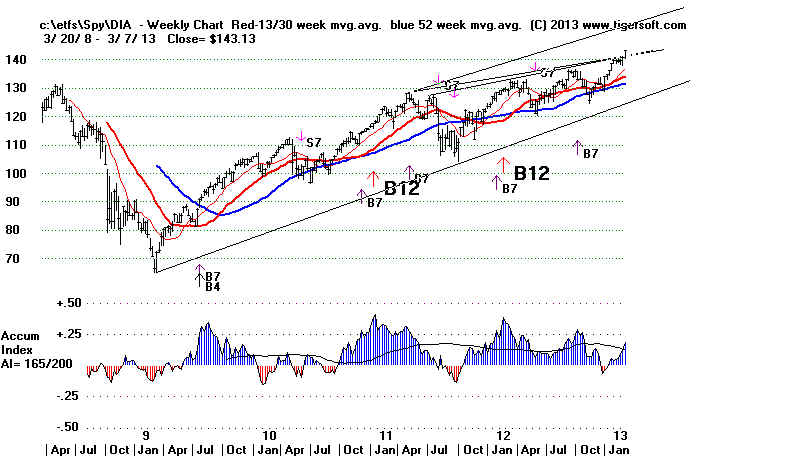
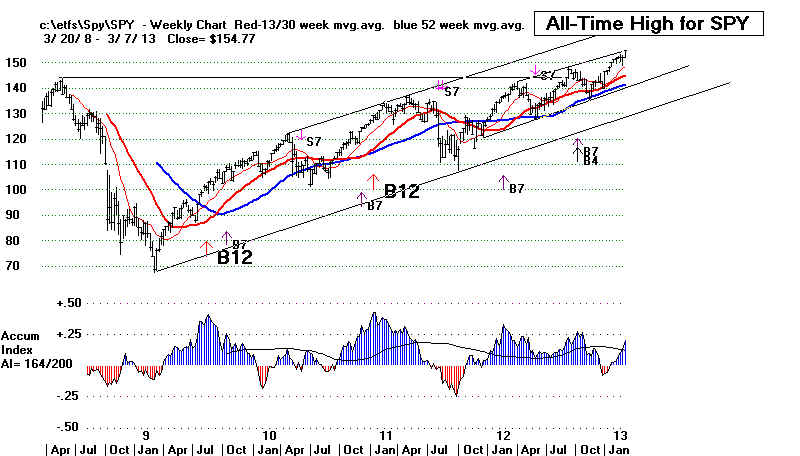
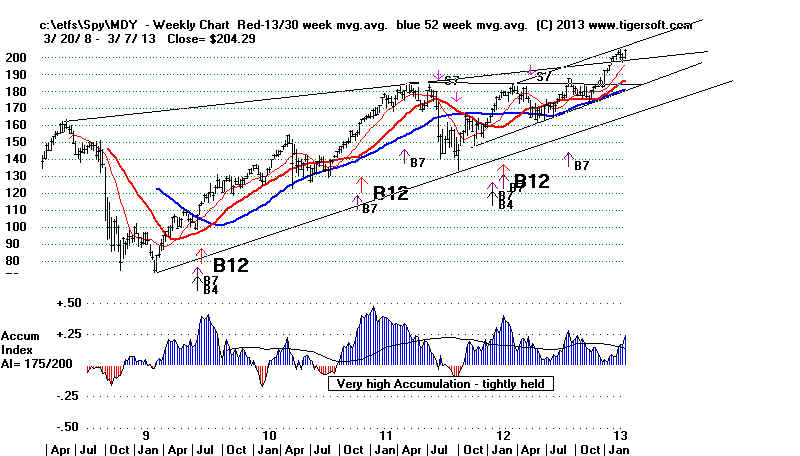
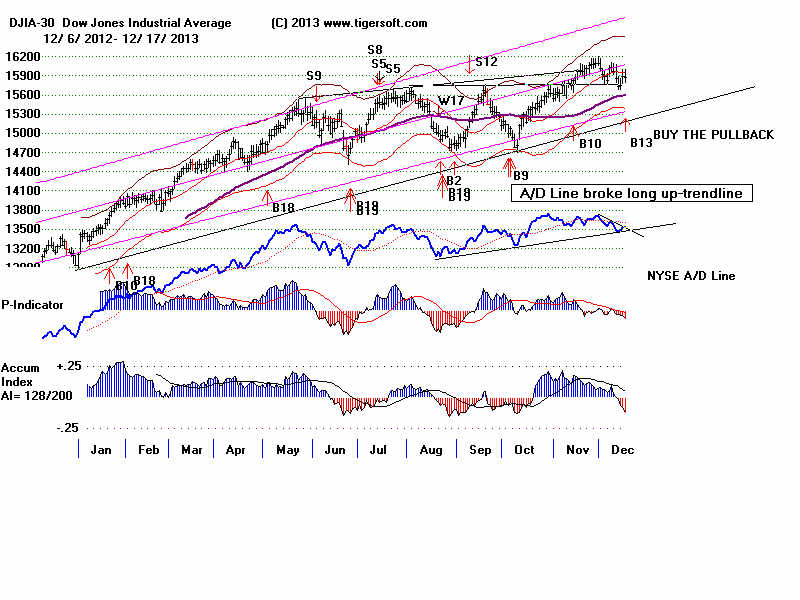
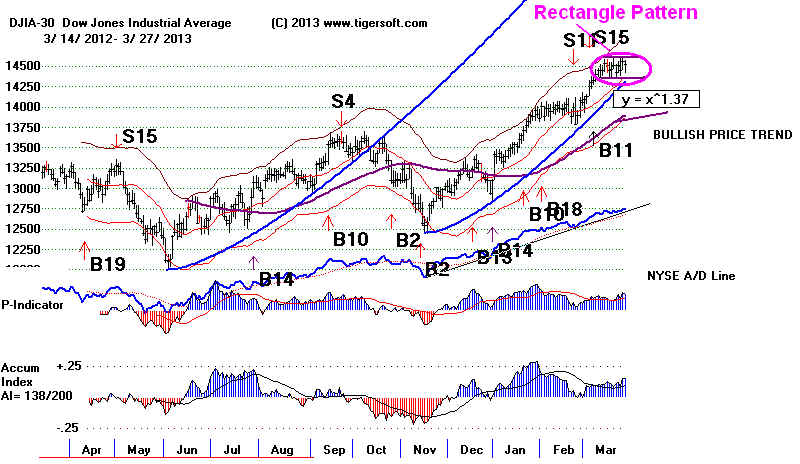
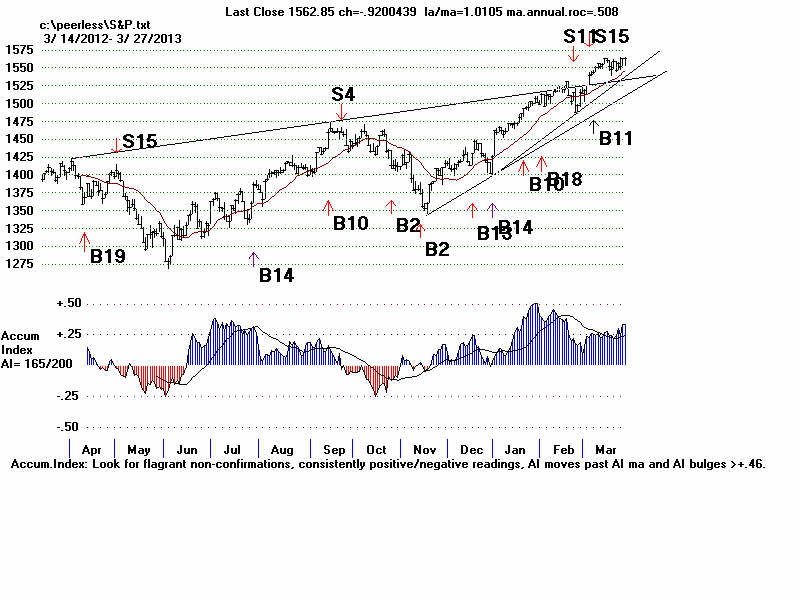
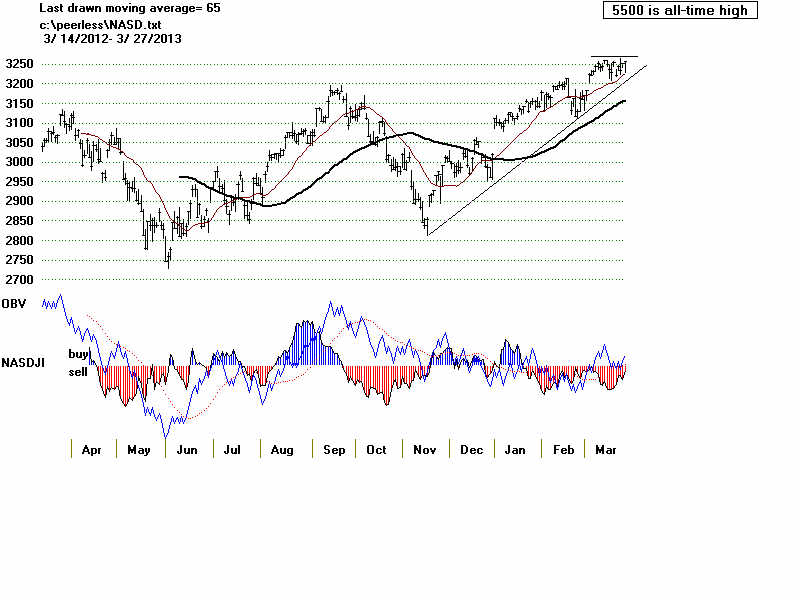
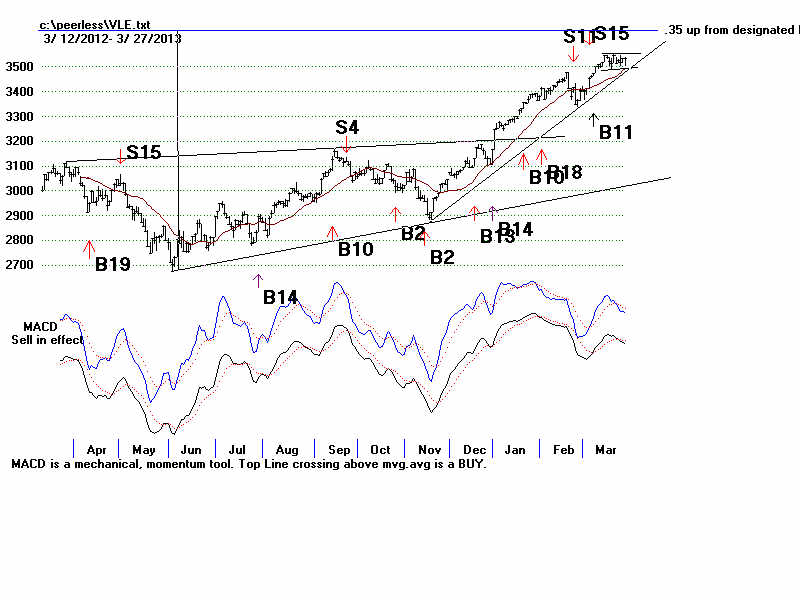
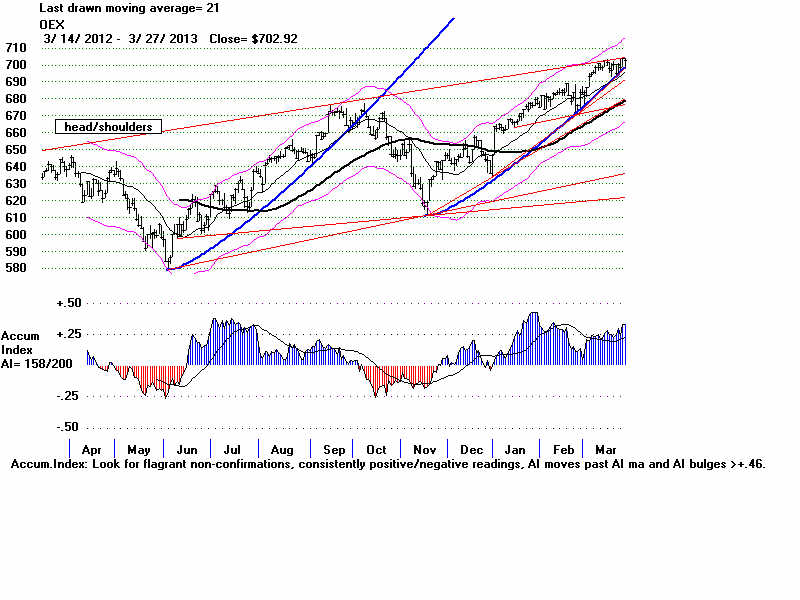
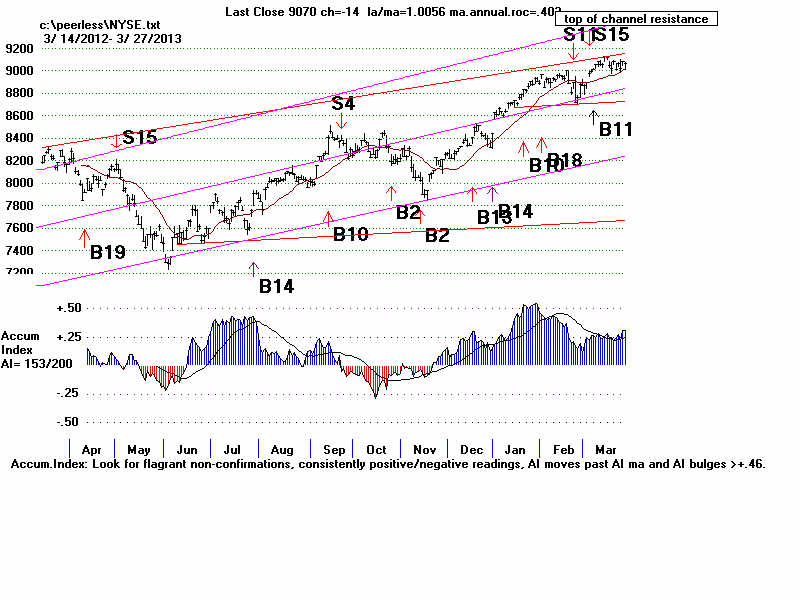
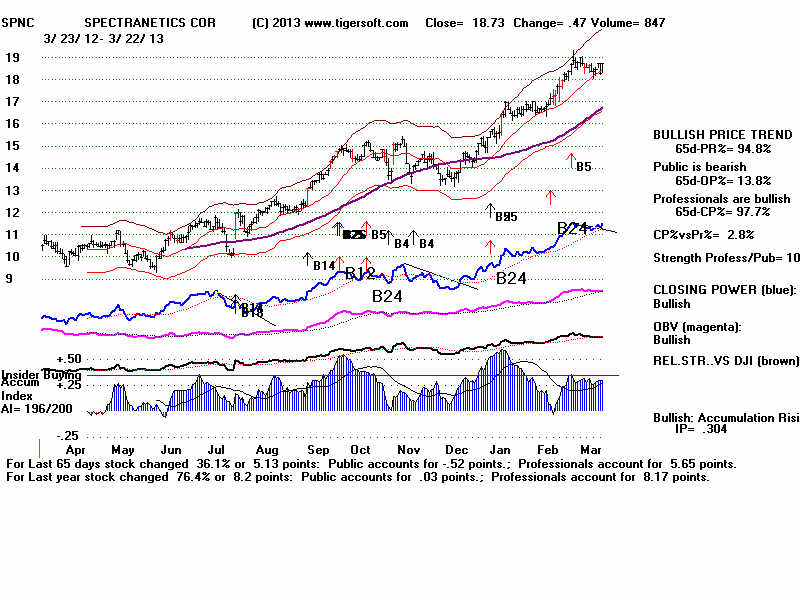
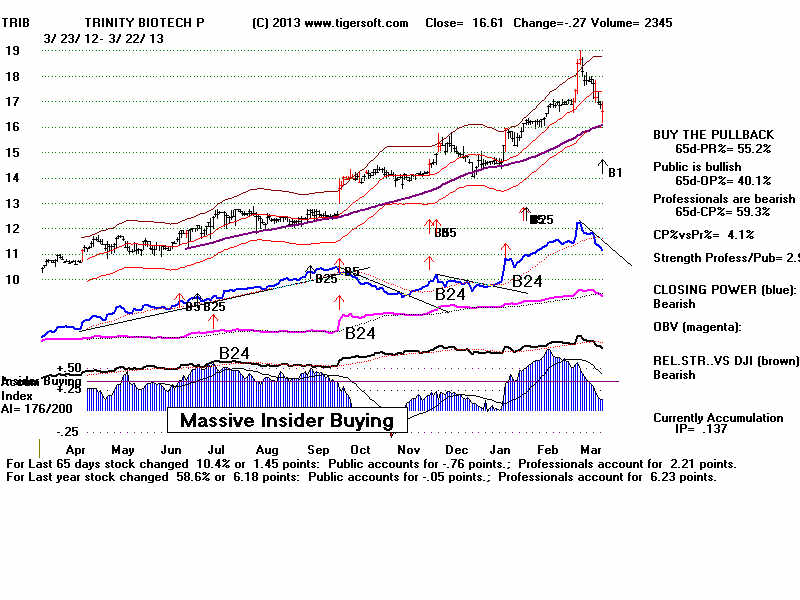
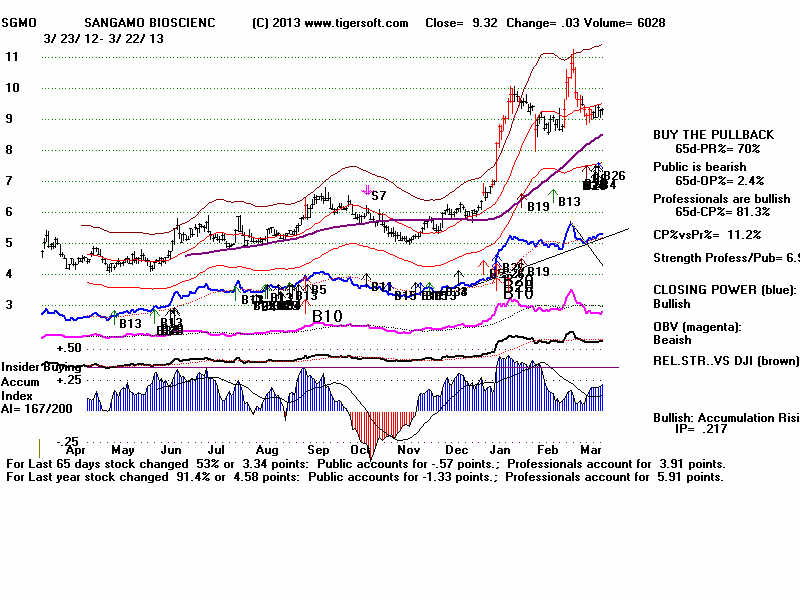
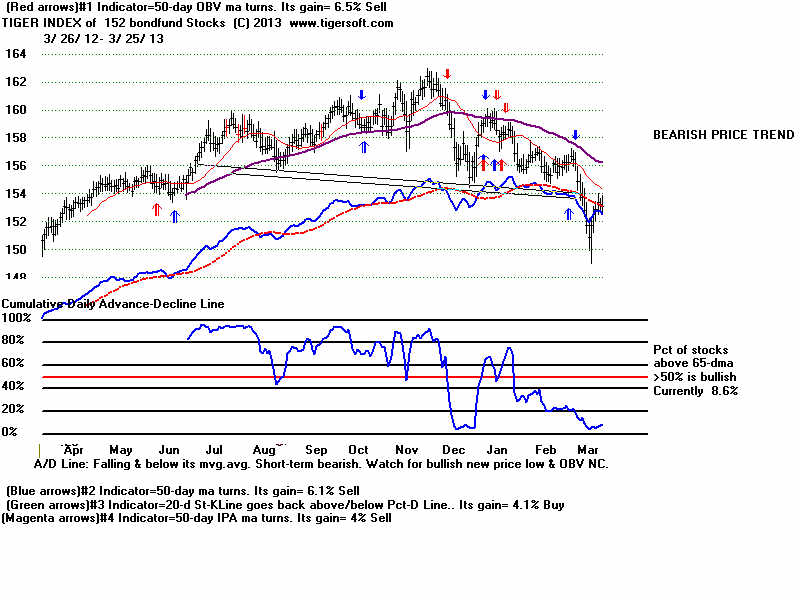
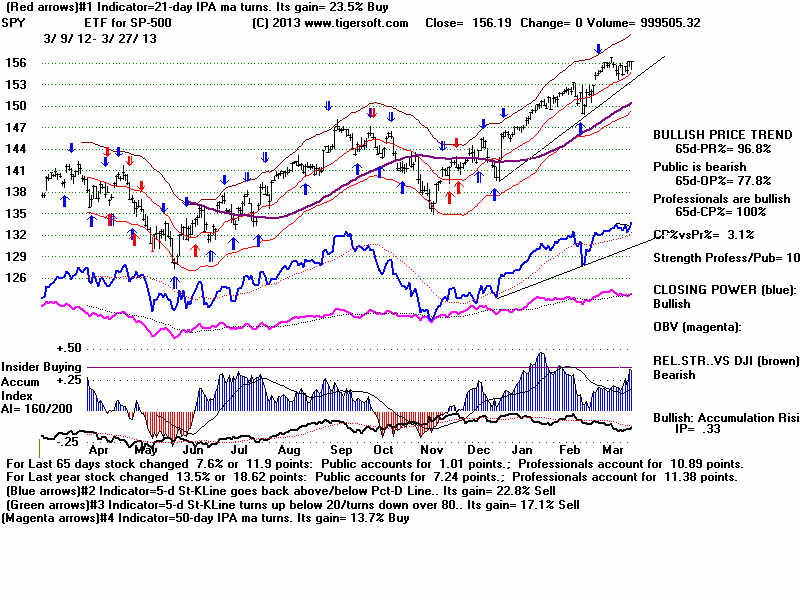
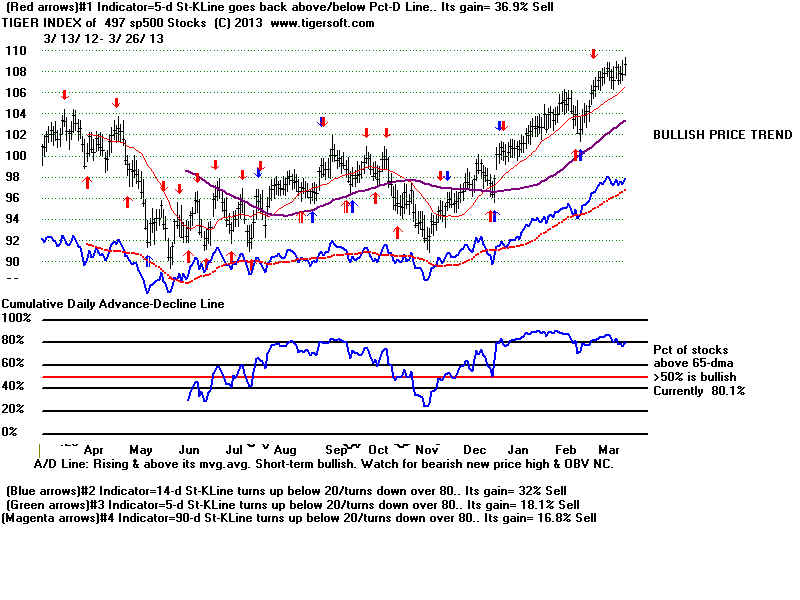
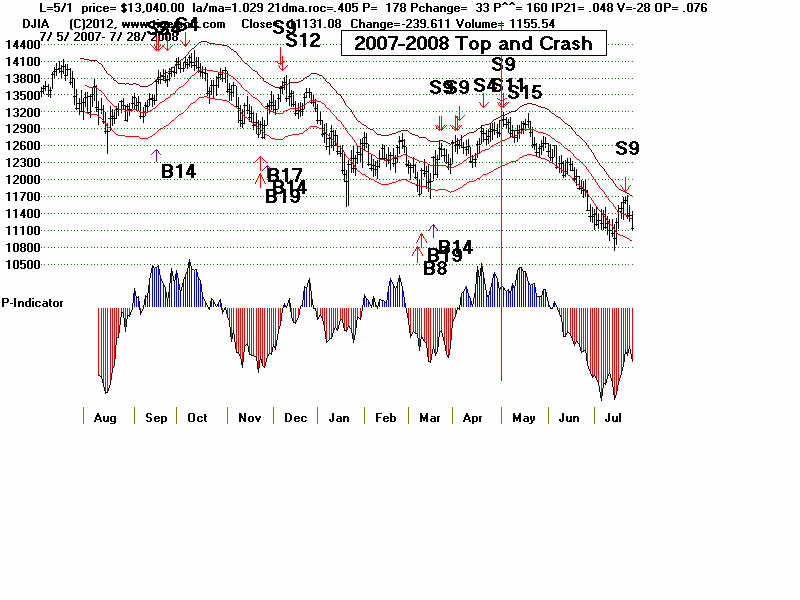
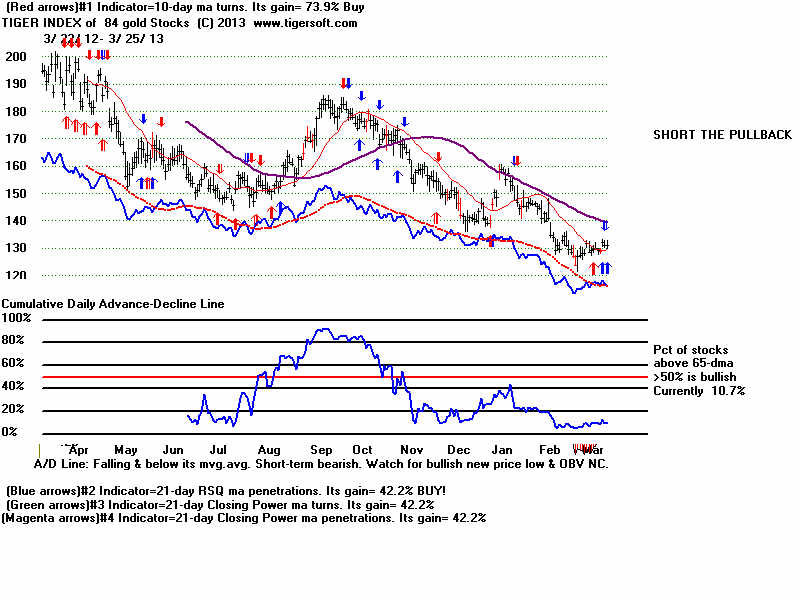
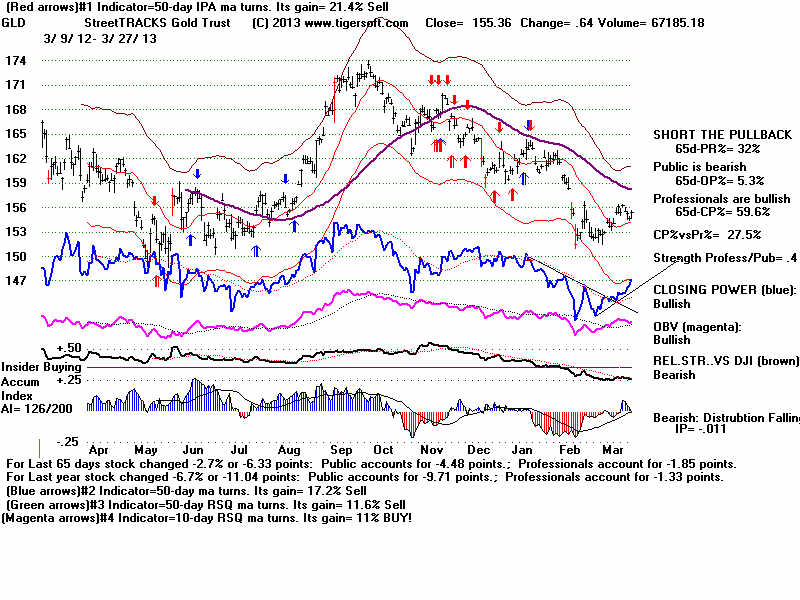
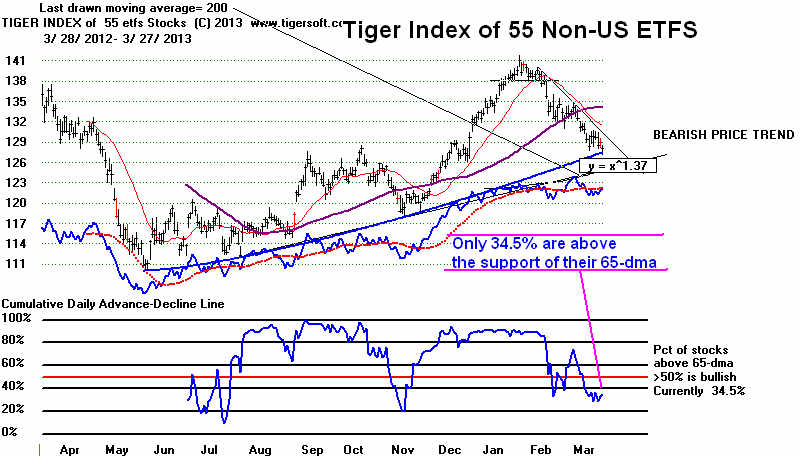
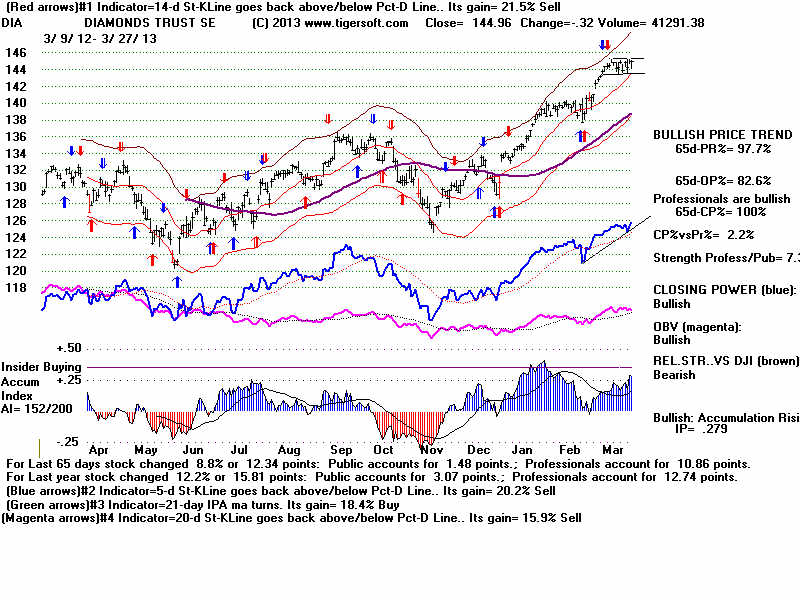
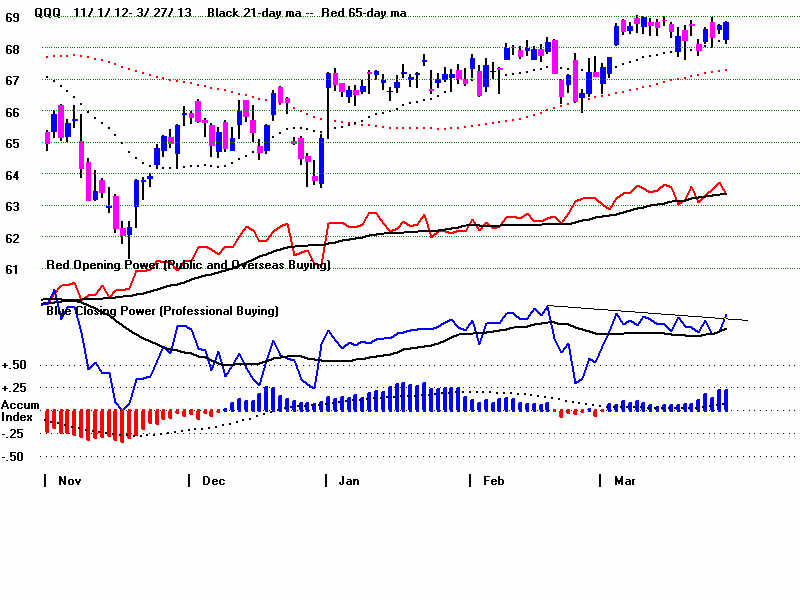
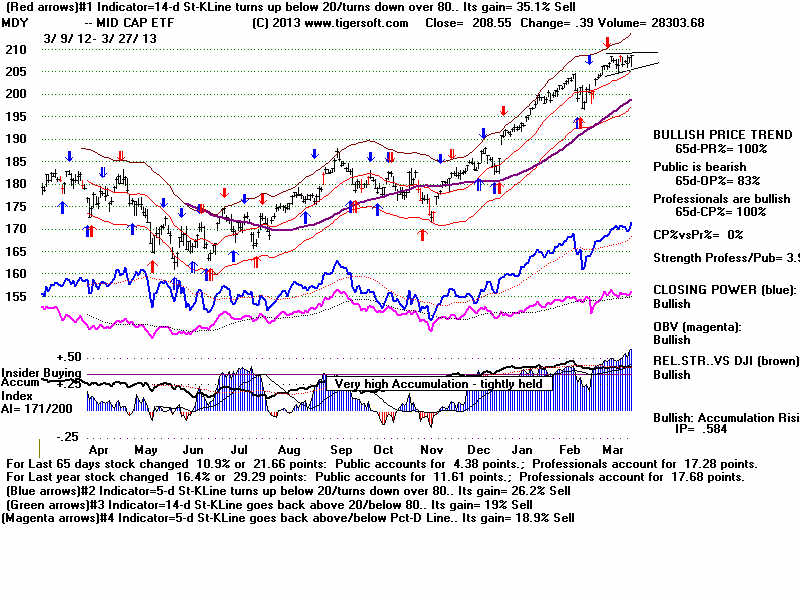
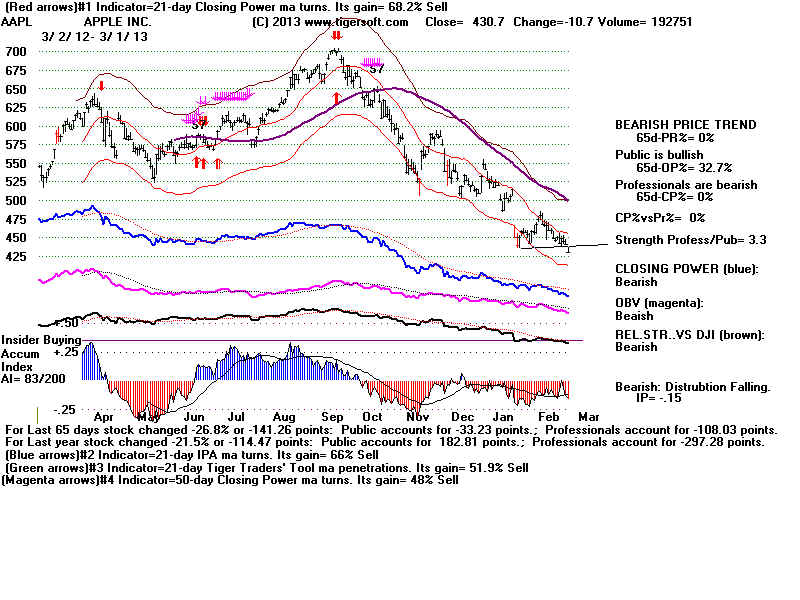
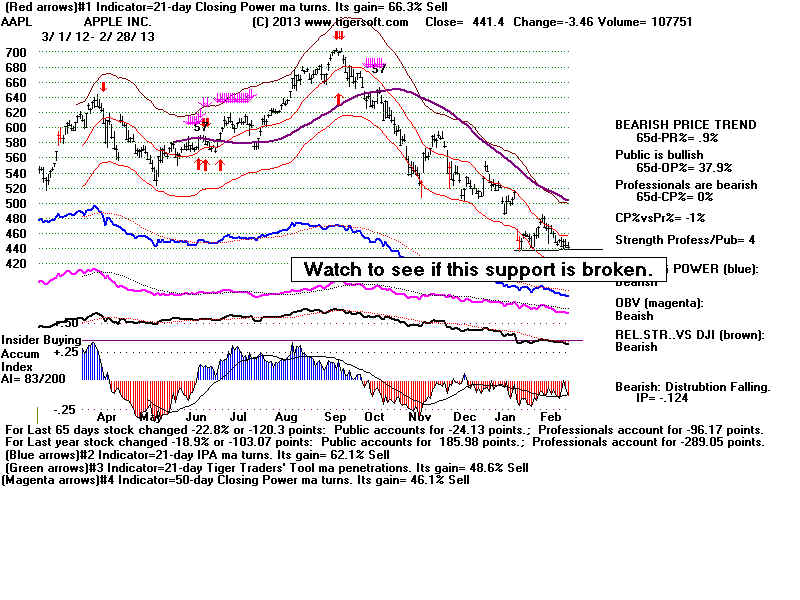
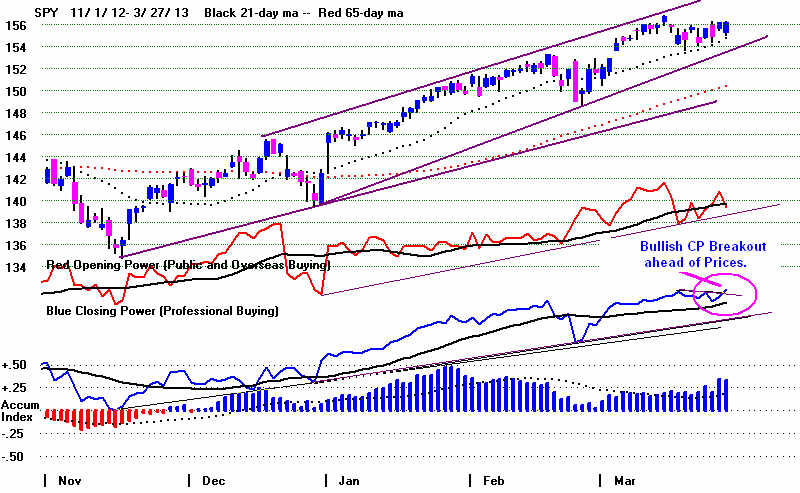
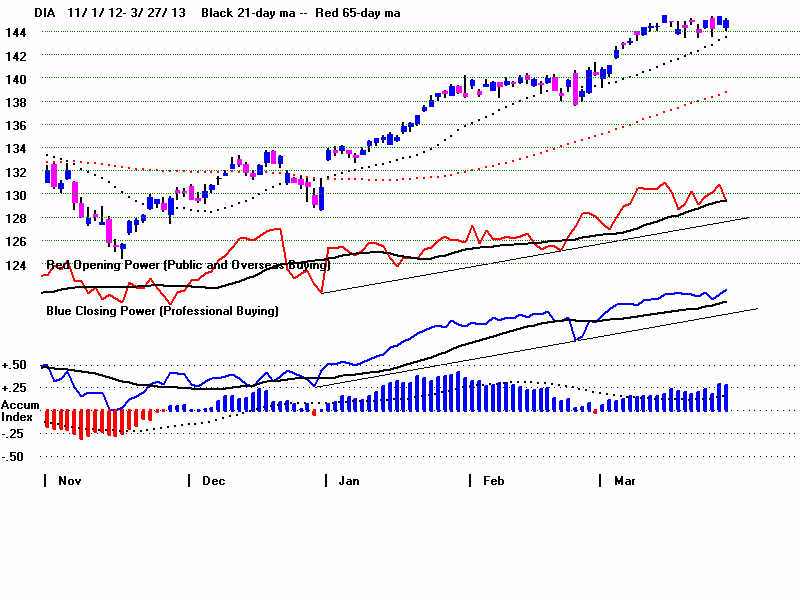
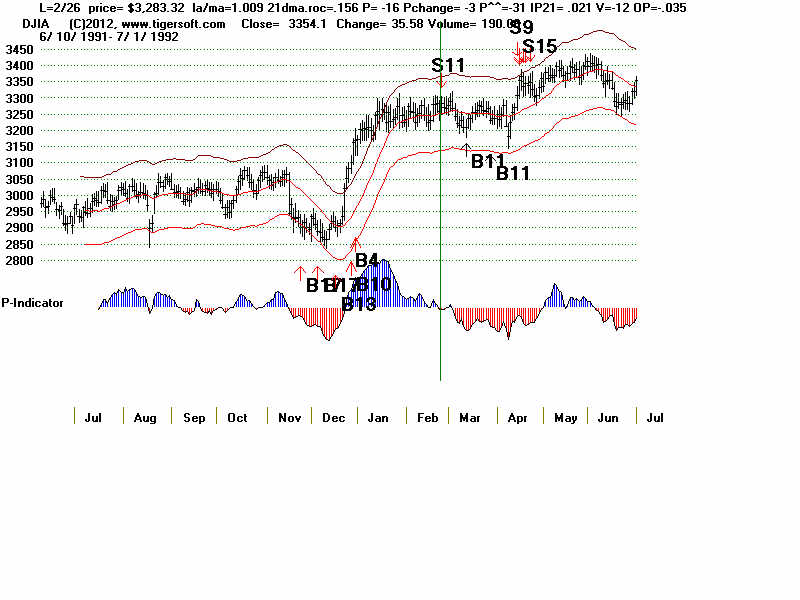
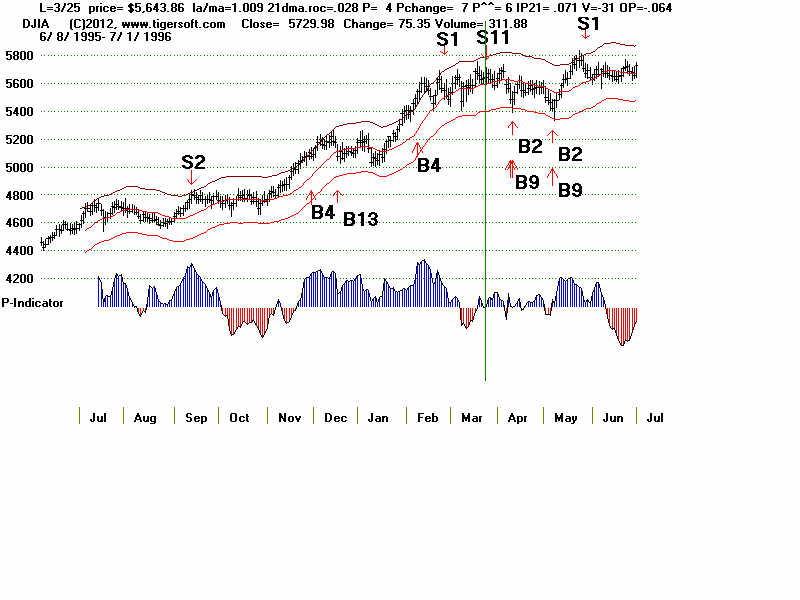
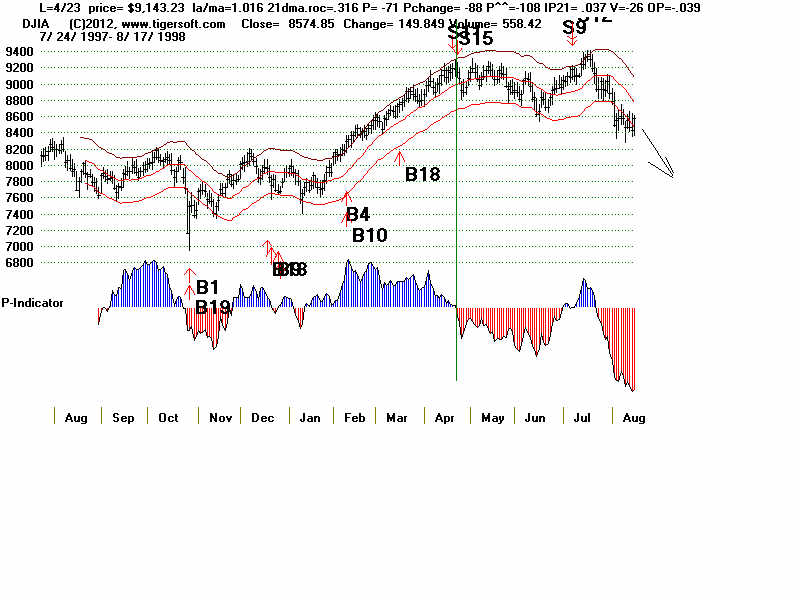
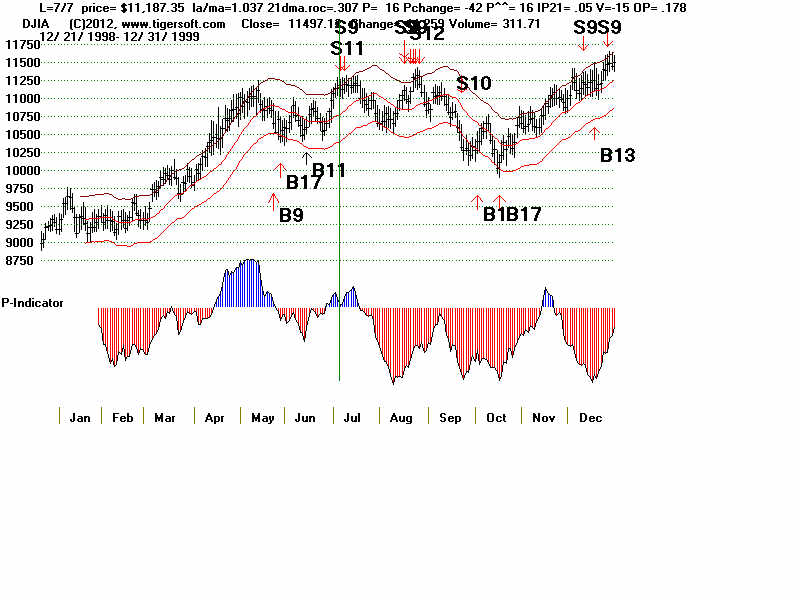
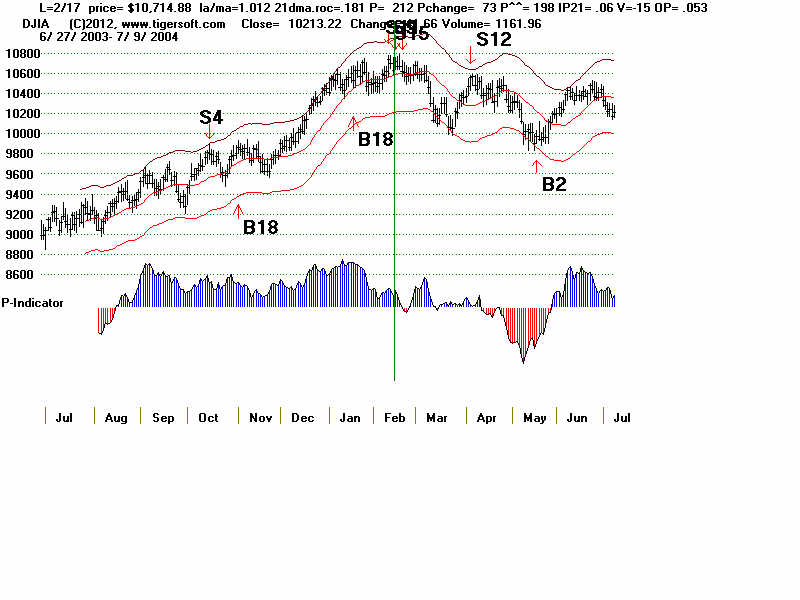
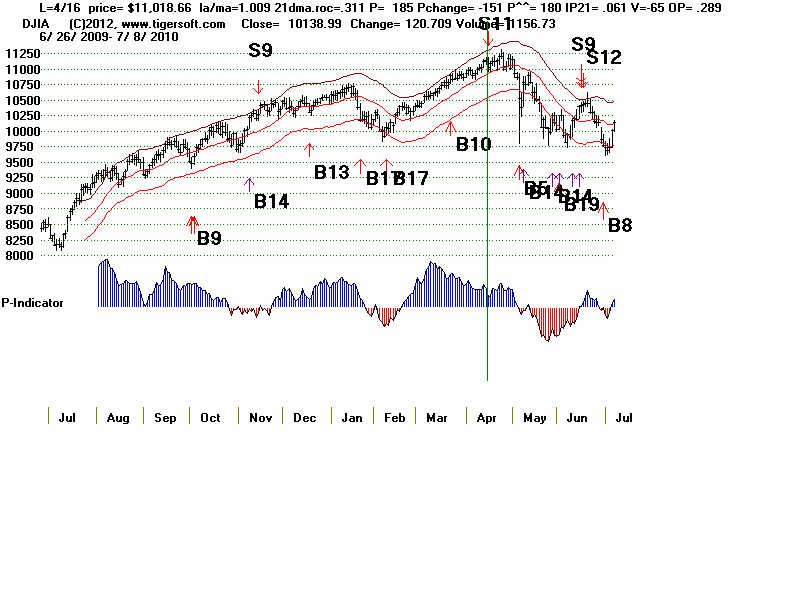
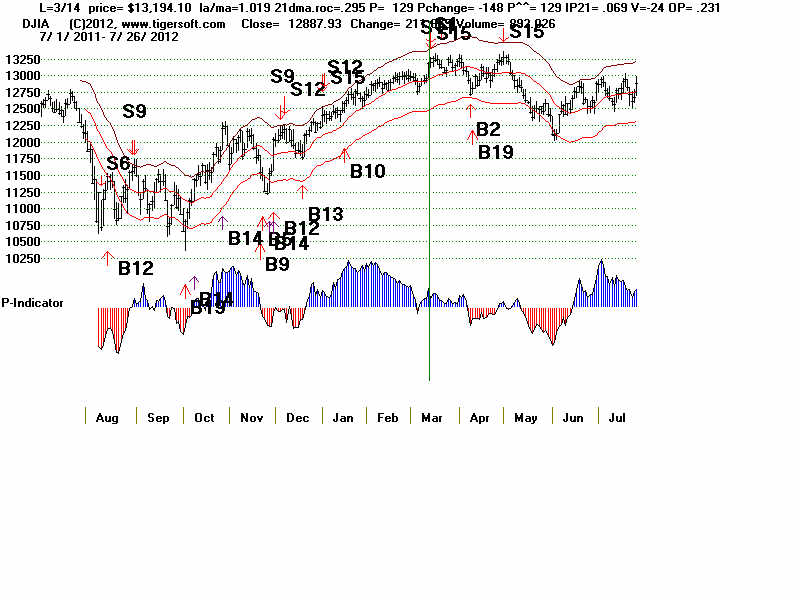
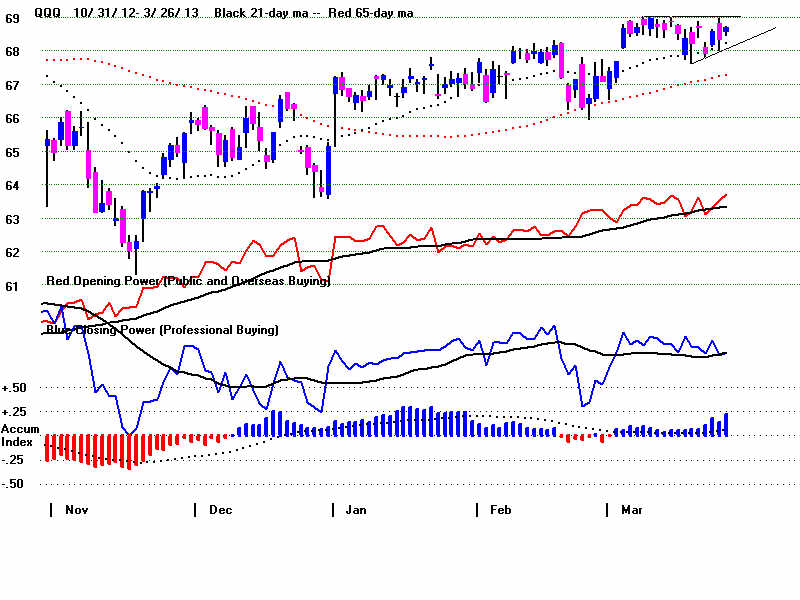
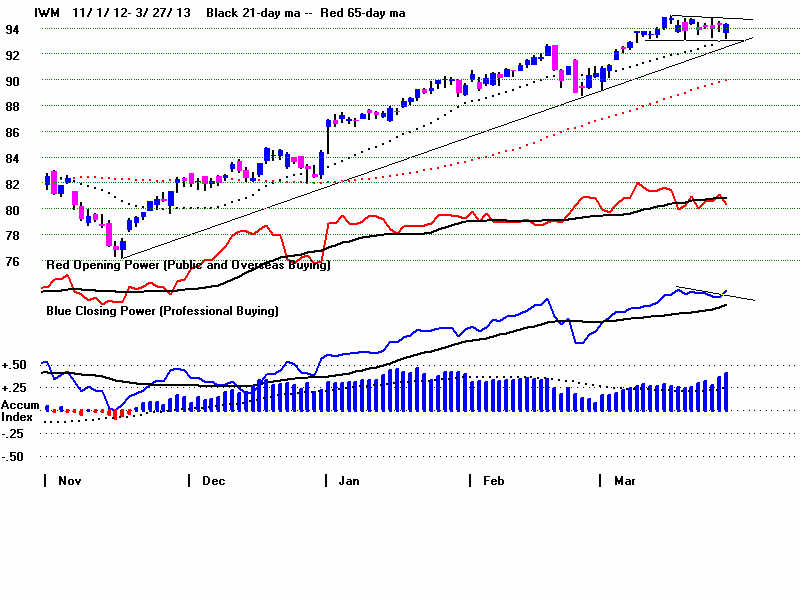
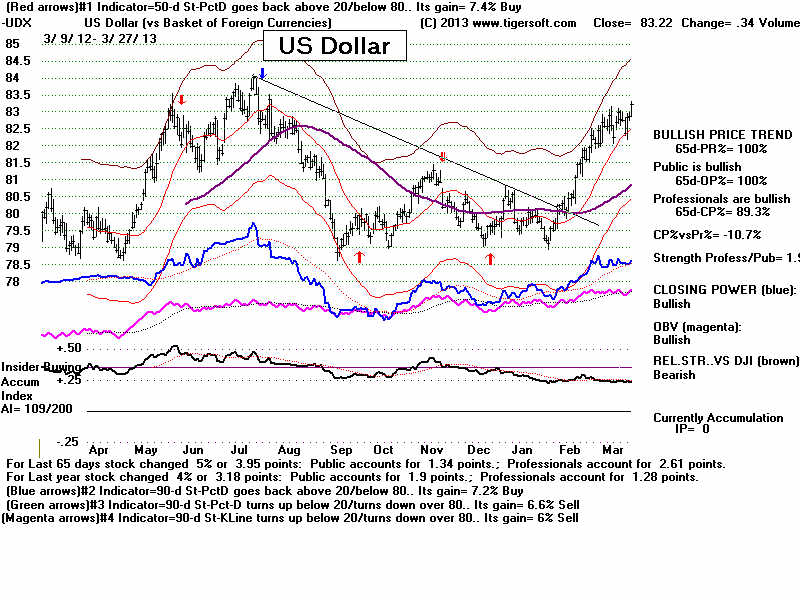
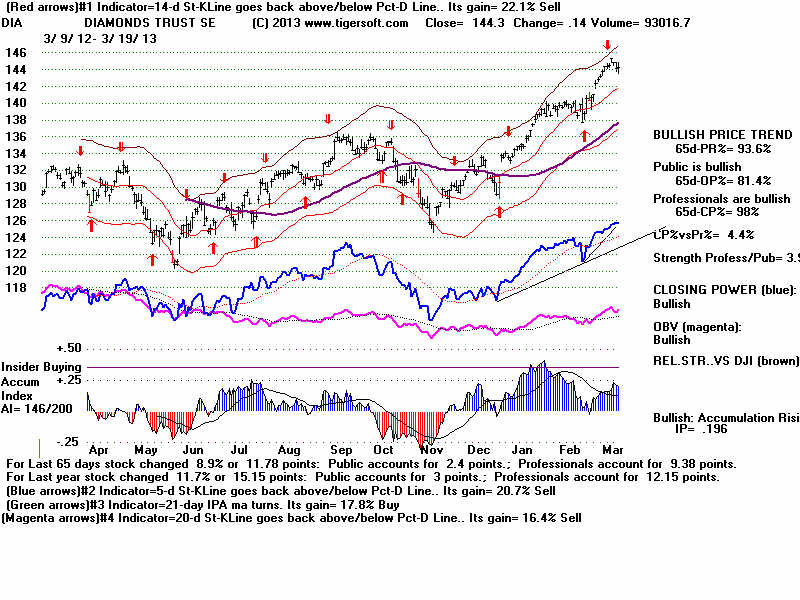
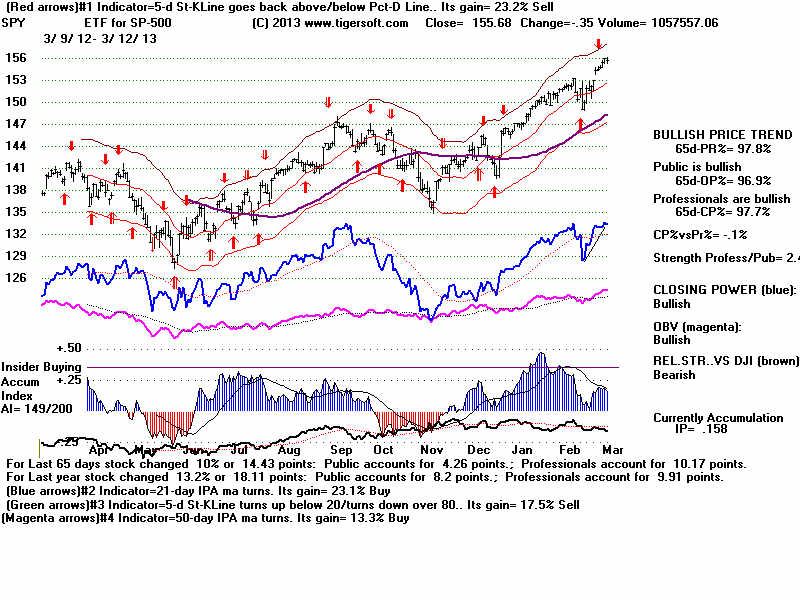
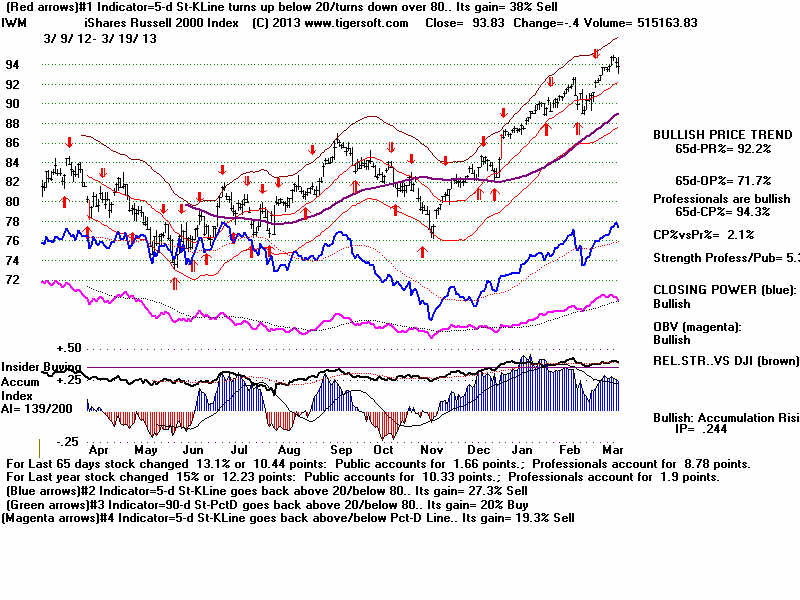