Tiger Software (C) 2010 www.tigersoft.com Call 858-273-5900.
Email us: william_schmidt@hotmail.com
Sample Peerless
and TigerSoft Charts
with Automatic Buys and Sells
(1) SAMPLE TIGERSOFT STOCK CHART Newmont Mining (NEM) - An average-looking stock at this point in time. 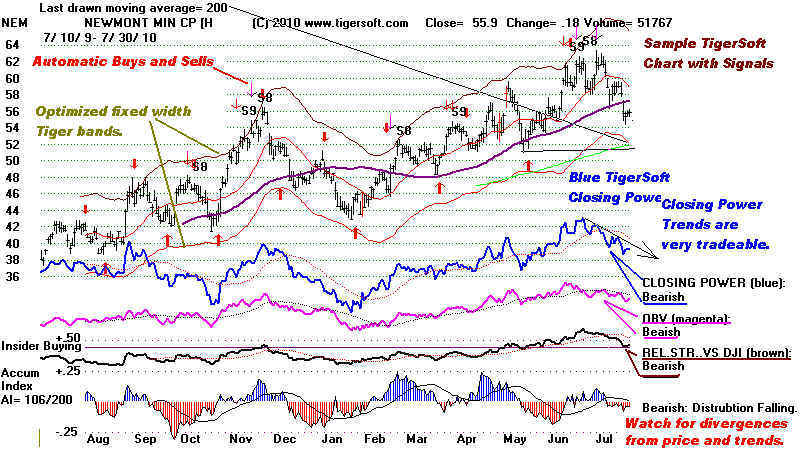 > 1 year bar charts at top. > Red moving avg and Tiger Price Bands. > Purple longer-term moving average > Automatic Buy and Sell Signals. > TigerSoft Blue TigerSoft Professional-Closing Power It usually leads prices. It confirms signals and reversals. When it rises and prices fall, it is a very BULLISH sign.. > Granville's OBV (Magenta) - A crude measure of aggressive trading. > Tiger's Relative Strength Quotient (Brown) - Buy the leaders. > TigerSoft Blue/Red Accumulation Index at bottom Spikes show insider buying. Steadily Blue - Institutional Bullish Interest is high. Deep dips show insider selling. Steadily Red - Institutional Distribution. Deep dips show insider selling. > Other Tiger Indicators not shown here: Tiger Public Buying Power TigerSoft Day Traders' Tool (See here for examples.) This shows what professional day traders are thinking: Rising is Bullish. Falling is Bearish. TigerSoft Asynchronicity (See here for examples)
|
(2) PEERLESS STOCK MARKET TIMING
BUYS AND SELLS
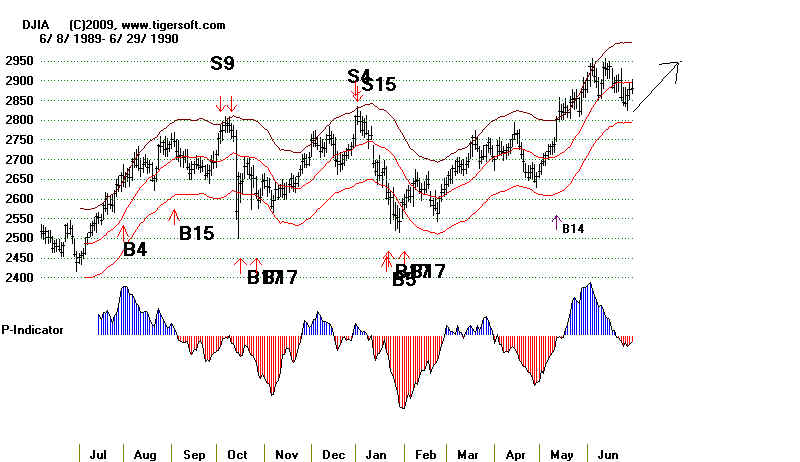
The automatic Peerless Buys and Sells are produced initially on the charts of the DJI-30.
These signals have been carefully nack-tested on DJIA data back to 1915, but most completetely
on the data from 1928-2009, Below is the chart with Buys and Sells for the first half of 1989
and second half of 1990/ Note that it takes about 50 days of data for the computer to calculate
all the signals.
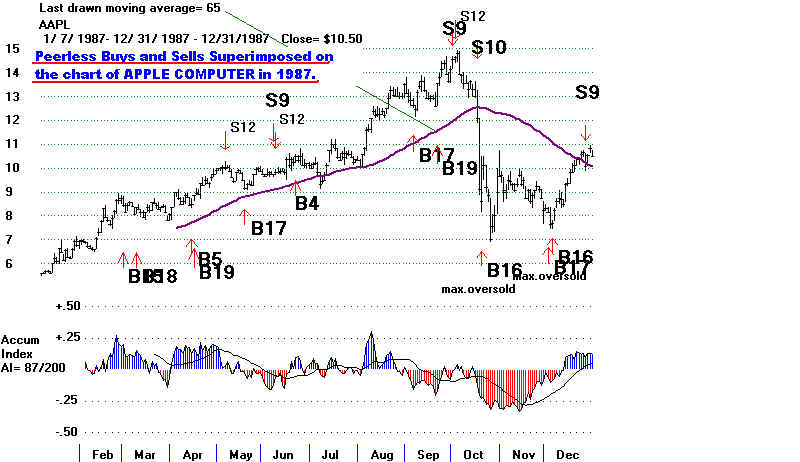
SUPER-IMPOSE THE PEERLESS SIGNALS ON ANYTHING "THAT MOVES"!
The automatic Peerless Buys and Sells dervided from the DJI-30 can and should be posted on
the charts of other stocks' and indexes. Most stocks move and down with the general market.
So, the Peerless Buys and Sells work very well on other investment vehicles. Below is the
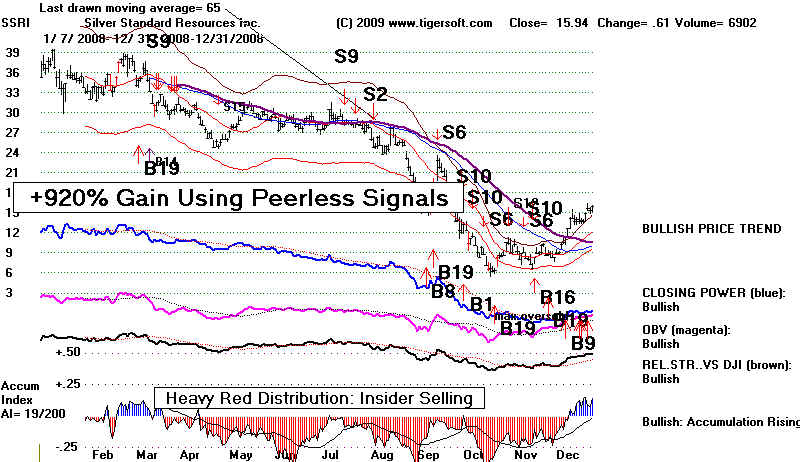
chart of APPLE in 1987 with the famous Peerless Sell S9 of early October 1987. Below that
is the chart of SSRI, a volatile silver stock, in 2008.
PEERLESS SIGNALS' GAINS ARE ALSO CALCULATED AUTOMATICALLY
Our software calculates the gains of these signals realistically using the next day's opening prices
and allowing $20 for commission and slippage per trade after starting with $10,000. Using both
long and short positions, the gains on APPLE trades in 1987 would have been 166%, with 7 winning
trades and 1 losing trade. For SSRI in 2008, $10,000 grew to $102,004, a gain of 920%. There were
7 winning trades and 2 losing trades.
The TIGERSOFT programs generate their own automatic Buys and Sells. Two separate
concepts of signals are employed:
(1) optimized signals for a year and
(2) fixed rule numbered Buys and Sells.
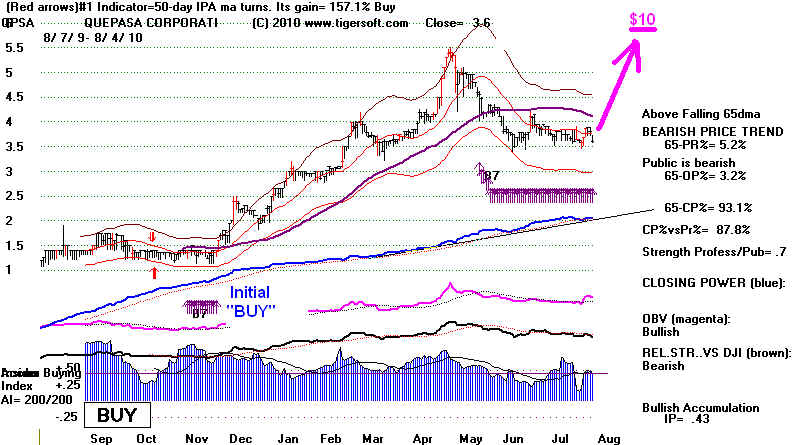
Buy and Sell Signals from Best Trading System for The Last Year
Our software quickly calculated the best trading system from 60 good systems and places the
Buys and Sells of that system on the screen. Of course, conditons change. So we need
to watch for sins that the older best system is giving way to a new best system. Our manual
shows how to do this. What is important to realize that often a particular system works
very well for a long period of time and our software readily identifies the best, the second
best, third best and fourth best. Often the gains from the optimum system are stunningly
good. When this is so, use the signals, so long as internal strength indicators confirm
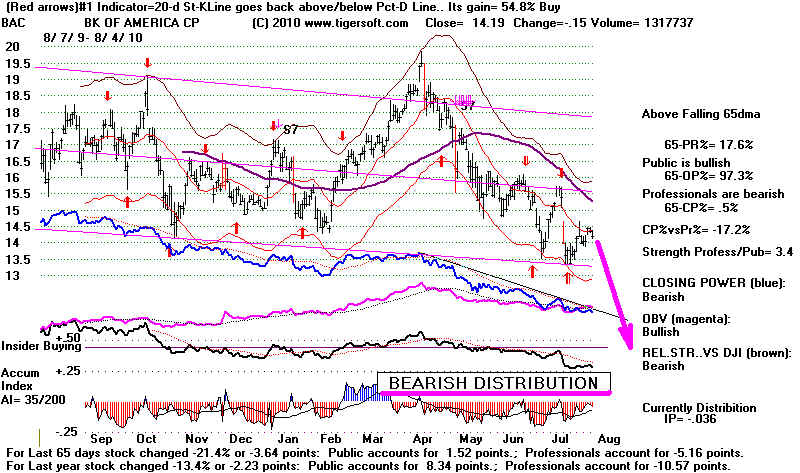
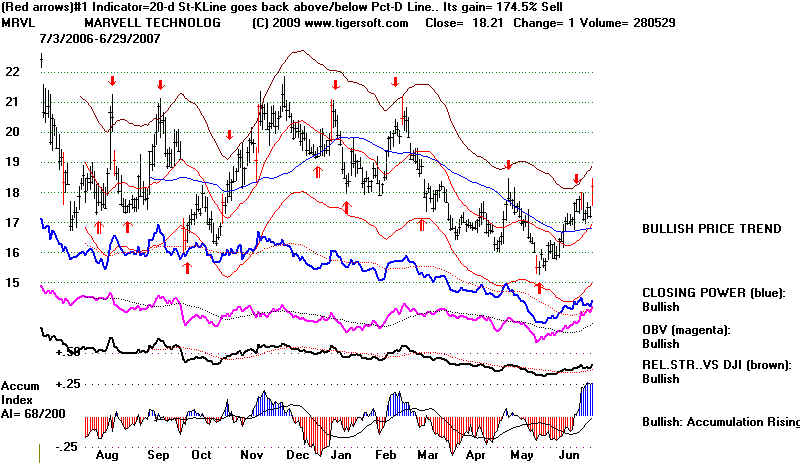
the direction of the signal. In the chart below, the best system was a 20 day Stochastic
and the gain was 174.5%. About 15% of the stock get gains like this with the optimum trading
system.
Optimized TIGERSOFT Buy and Sell Signals
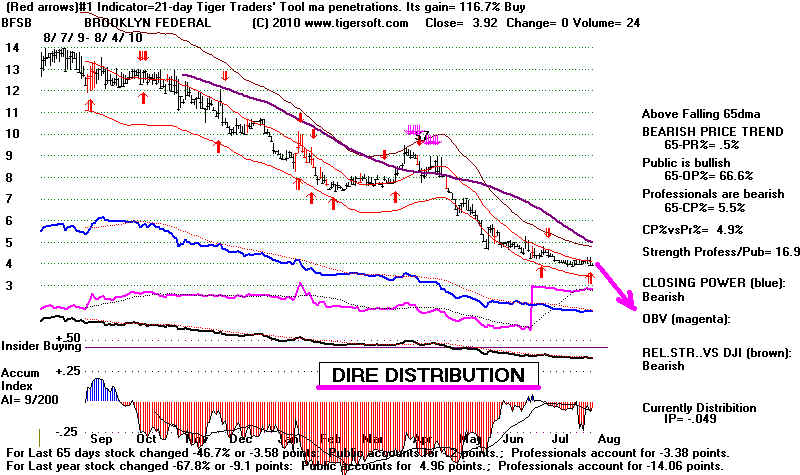
(4) FIXED RULE TIGERSOFT BUYS AND SELLS
WITH INTERNAL STRENGTH INDICATORS SHOWING
INSIDER BUYING AND INTERNAL SELLING
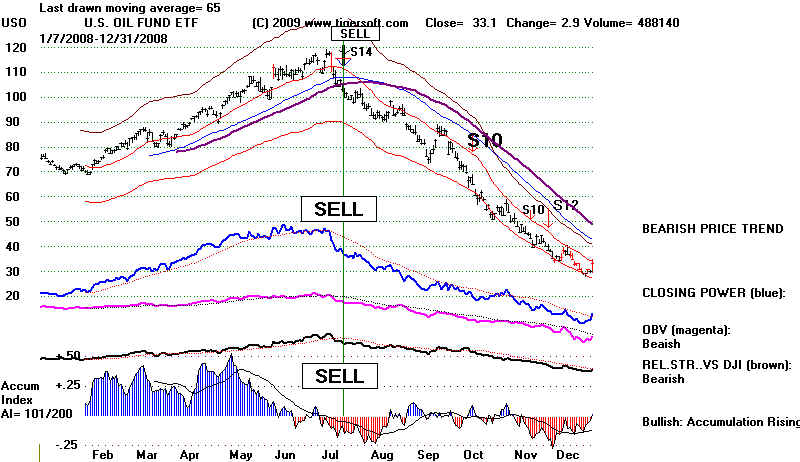
Buy and Sell Signals Based on Internal Strenth Rradings and The Direction
of The Trend, as Measured by thr 50-day and 65-day moving average. We pay close
attention to crossovers of the 65-day ma when they are confirmed by weak and declining
readings from out Tiger Closing Power (Blue) above, the OBV Line (magenta), the TIger
Relative Strength Line (brown) and TigerSOft Accumulation Index Oscillator (red and blue)
The chart of USO - Crude Oil - gave a clear Sell S14 signal using this approach in
July 2008. Prices then collapsed.
Mostly, we prefer to trade the trend of these moving averages. But we have
a big advantage. Not only does Peerless tell us when to Buy and Sell, we also have
very reliable measures of Insider Buying and Selling. Thus, AMGEN's chart in 1990
trended up despite a bear market, all the while showing unusually positive
Blue Accumulation. We made a lot of money in this because of the steady insider buying
occasioned by how well the clinical trials were going for two block-buster drugs AMGEN
would get FDA approval for at the end of 1990.
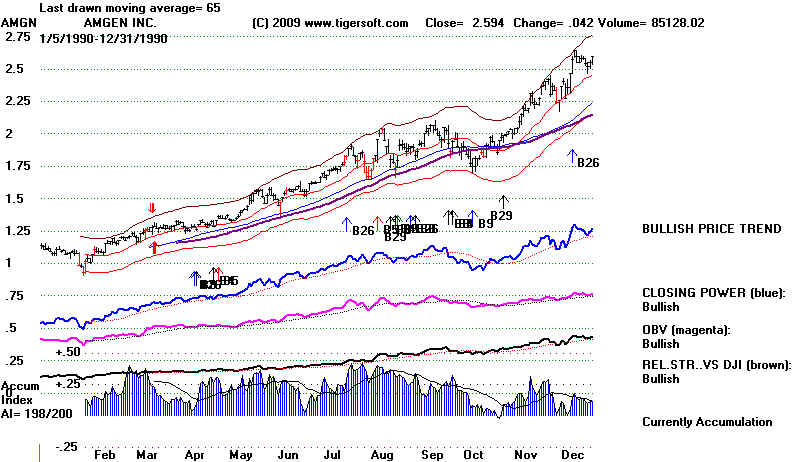
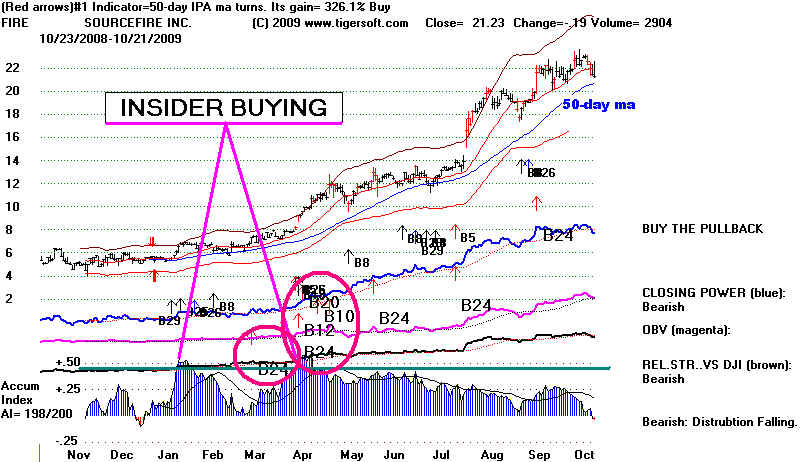
Insider Buying - which we measure by noting the Tiger Accumulation Index
readings above a key threshold coupled with subsequent major fixed rule Buys
is our key to buying speculative low-priced stocks. Riding it upward so long as
it does not violate its 65-day ma while also getting a TigerSoft fixed rule Sell is
how we trade the explosive super stocks we find early on.
Insider Selling. Often we find a declining stock with terrible internals while Peerless is
on a Sell. We would Sell Short on each automatic Sell and cover on the optimized
Red Buys, with a some exceptions you can read about elsewhere.