TigerSoft and Peerless Daily
Hotline
(C) 1985-2015 William Schmidt,
Ph.D. www.tigersoft.com
All rights
strictly reserved.
Tiger Software
858-273-5900 PO Box 22784 San Diego, CA 92192 Email
william_schmidt@hotmail.com
------------------------------------------------------------------------------------------------------------------
Announcements
-
Tiger/Peerless UPDATE. A new TigerSoft/Peerless update
has been released today.
The new Tiger's update has the new Sell S12. It has the
new QuickSilver table which is produced for any directory's stocks.
It should work well with the stocks in FASTUP, FASTDOWN, LEVERAGE, HIGHIP21,
MAXCP, MINCP, REDSELL and NEAR65. With this QuickSilver
table displayed, you point the mouse at the symbol and click Graph.
The Peercomm will also allow you to get stock data again from Dial Data.

8/26/2015
70+ TigerSoft Charts -
Go to www.tigersoft.com/HH/Index.html
===>
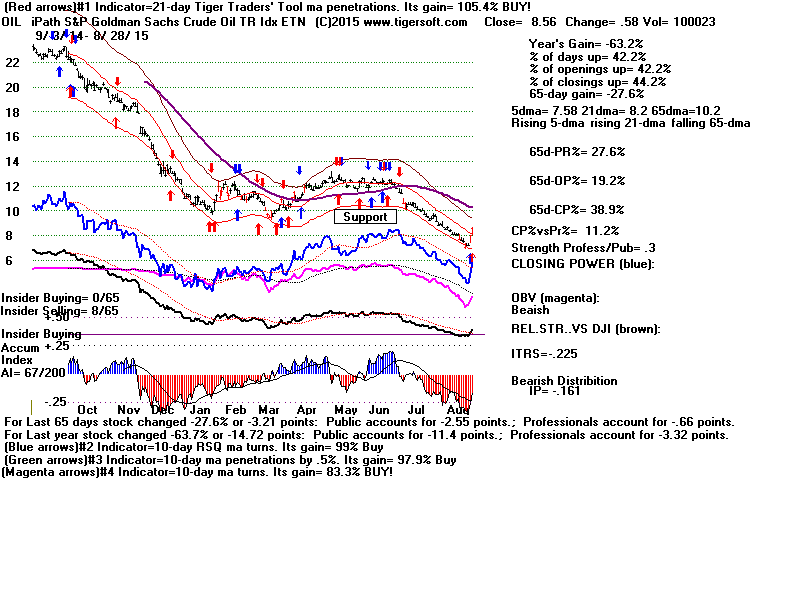
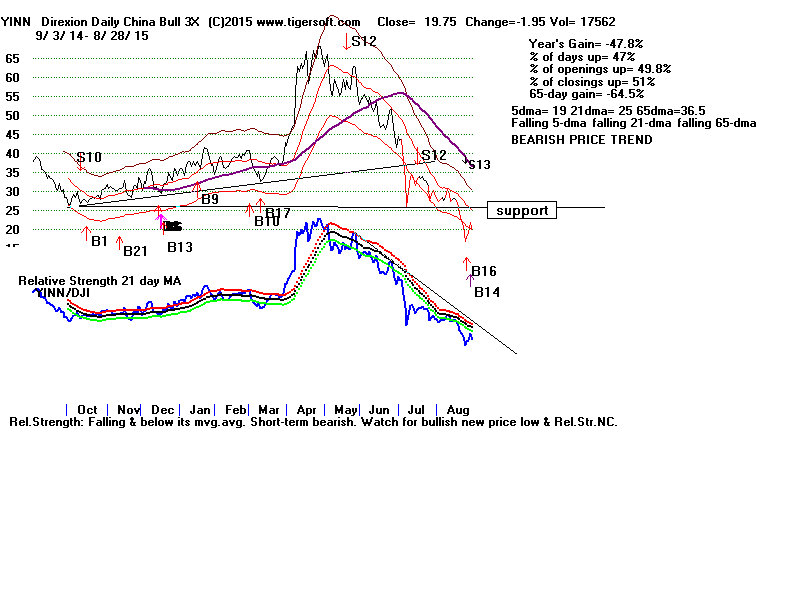
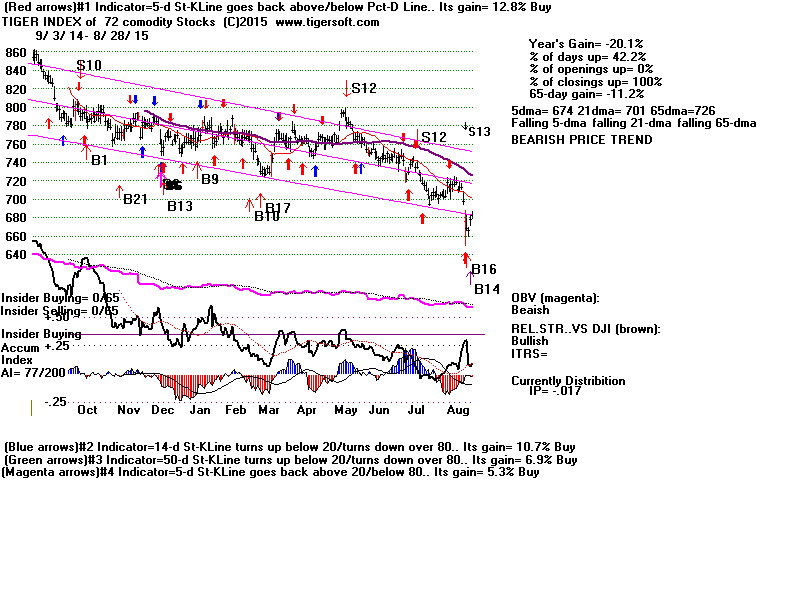
4 Horsemen of Deflation
OIL
YINN
COMMODITIES FOREIGN ETFS
8/26/2015
New Highs: NASD 2
NYSE 2
New Lows: NASD
51 NYSE 43
8/26/2015 Bullish MAXCP Stocks over
$5
142 ---->
www.tigersoft.com/MAXMIN/8-26/MAXCP.html
Bearish MINCP Stocks
over $5
690 -->
www.tigersoft.com/MAXMIN/8-25/MINCP.html
------------------------------------------------------------------------------------------------------------------
8/26/2015 Yesterday's reversing Peerless Buy B16
brought a record 619
point reversal back upwards by the DJI today. This ended 6 straight
down-days. We are reasonably safe with long positions, provided
the DJI does not make any more new lows until we get a Peerless
Sell. The upside target is 17000 on the DJI, I reckon.
Rumor has it that the FED led by the NY FED Governor
will now delay any rate hike. That this would boost the market so
much today would seem to show that the Fed is the problem (not China)
and the Fed has the short-term solution, more very cheap money for
the big banks. But, Heaven help the market if the Fed does raise
rates. Even when expected, this is bearish.
Click on tonight's NY Times article here.
Market Turmoil Prompts New Speculation on the Fed's Timetable
 Fed
Chairwoman Yellen has been loudly quiet recently...
Fed
Chairwoman Yellen has been loudly quiet recently...
Janus-like, Janet may have switched camps in here and now be a "hawk".
The market will be looking for words from her about the recent
market debacles.
Based on the Buy B16, I have suggested covering all our short sales
for the time being and buying some of the most Bullish stocks/
There are a number of criteria we can use to pick the stocks to buy
for what we hope will be a good recovery for the next week or two.
See
www.tigersoft.com/MAXMIN/8-26/MAXCP.html
Retail stocks are appealing. Their imports keep getting cheaper
and US consumers have more money because of lower gas prices.
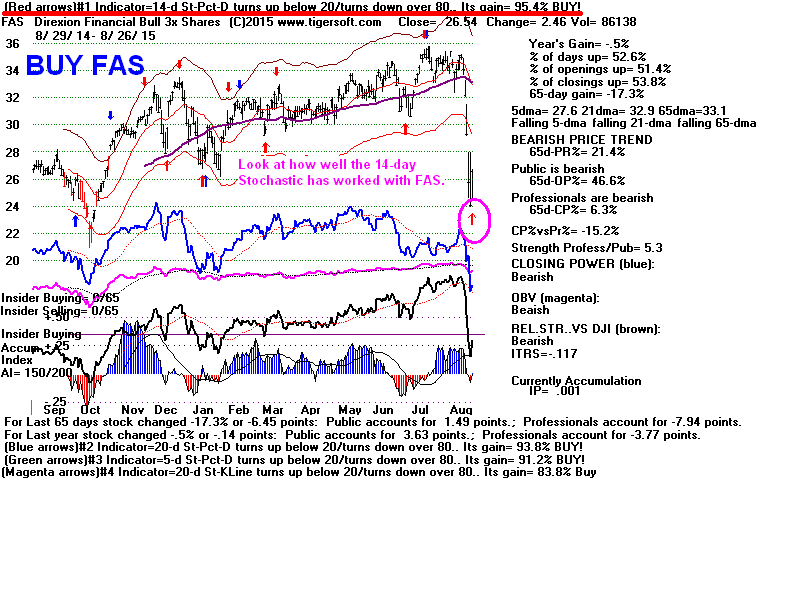
Below see how well the Tiger automatic Buys have worked with
FAS. It should be bought here, too.
Today's huge rally took the DJI back above its falling 5-day ma.
I think it should now try to make it back to the resistance of its
falling 21-day ma. That is the typical immediate target after big
sell-offs.
In that respect, compare the DJI's chart now with the one in the Fall
of 1997.
1997 Parallel
DJI's 6-month chart

HOURLY DJIA
Other Sharp DJI Declines to The 13.5%-Down Level
When one studies other DJI recoveries in the past after sharp declines
to the 13.5%-14% support- level below the bull market peak, we see that
the falling 21-day ma does act as resistance for a week before prices
penetrate it and resume their rally. See the study here.
../../MAXMIN/8-26-2015/big_declines_and_the_importance.htm
Look especially at the charts of 1941 (months before Pearl Harbor),
1950 (a month after North Korea invaded South Korea) and
in 1997. Especially note the 1997 Panic. It occurred because of a
panic
in Asia with the DJI up very considerably over the prior 6 years.
Computerized trading then also drove the decline down excessively.
Wikopedia writes:
"The October 27, 1997, mini-crash is the name of a global
stock market crash
that was caused by an
economic crisis in Asia. The point loss that the
Dow Jones Industrial Average suffered on this day still ranks as the eighth
biggest
point loss and 15th biggest percentage loss since its creation in 1896. This
crash is
considered a "mini-crash" because the percentage loss was relatively small
compared
to some other notable crashes. But after the crash, the markets still remained
positive
for 1997. " (See
October 27, 1997, mini-crash - Wikipedia)
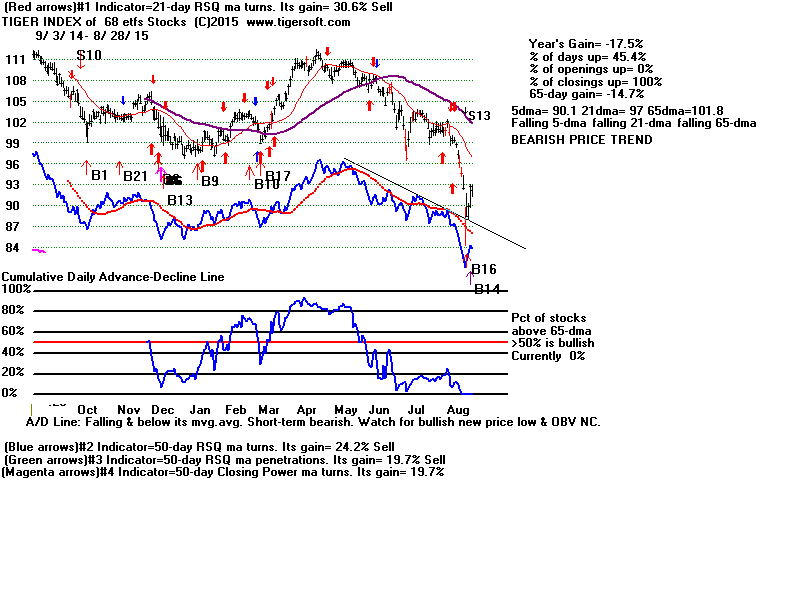
RETAIL STOCKS SHOULD DO WELL NOW.
Retail stocks like HD, SKX and ORLY shouold do well in the
expected
recovery. The devaluation of the Chinese Yuan will immediately lower the
cost
of their Chinese imports by 3%. Go to Home Depot and try to find something
other than wood that doesn't come from Cina. Our Tiger Index of Retail
stocks
shows that they are nicely poised technically to recover for a week or two.

FAS looks like a good ETF to buy
BUY B16s
B16
Trading Results by which Year in 4-Year Presidential Election Cycle
the Buy B16s occurred in.
Year
No. Avg.Gain
Presidential Election Year 5
.263
PE + 1
7 .281
PE + 2
8 .150
PE + 3
6 .115
B16 Trading Results by
which Month the Buy B16s occurred in.
Month
No. Avg.Gain
January
0 ---
February
1 .988
March
2 .220
April
2 .097
May
2 .135
June
2 .044
July
2 .047
August
2 .039 (lowest)
September
2 .153
October
3 .156
November
4 .172
December
4 .176
Previous August Buy
B16s
DJI
Gain
19660831 B16
788.51 .022 no paper
loss
la/ma AROC
PI PI-Ch IP21 V-I
OPct 65-dma Pct Change
.966 -.643
-257 41
-.189 -13 -.312
-.109
-------------------------------------------------------------------------------------------------------------
19710809 B16
842.65 .055
fell to 839.59 (0.4% paper loss)
la/ma AROC
PI PI-Ch IP21 V-I
OPct 65-dma Pct Change
.963 -.802
-277 -36 -.159 -4
-.404 -.102
-------------------------------------------------------------------------------------------------------------
20150825 B16 842.65
.055
la/ma AROC
PI PI-Ch IP21 V-I
OPct 65-dma Pct Change
.906 -1.216
-310 +50 -.084 -246
-.507 -.141 |
------------------------
Announcements
--------------------------------
E-Books
1
The On-Line Explosive Stocks
2
The On-Line Killer Short
Sales book
Purchase each all new book by CC for
$42.50 or send a check for $37.50 to me.
I call your
attention now to the many new concepts and
the considerable new research in them:
For example:
1) A very good New Tiger Buy B12 for Low
Priced Stocks
2) After Red high volume reversal days use CP
uptrend-breaks.
3) Buy the stocks the Federal Govt wants you
to buy.
4) 100-Day Power Rankings...
5) Using Closing Power Hooks after Buy B26s
and B20s.
6) How A Stock Reacts to Its Earnings Report
Is Very important.
7) TigerSoft Major Buy Signals' Combinations
Which are most Powerful? Reliable?
8) Augmented Buy B20s' Independent Success
Rate.
9) What factors warn a rising 65-dma will not
hold?
10) The classic cluster of technical
characteristics that commonly appear
in the 23 stocks falling 70% or more in
the deep pullback of 2011.
----------------------------------------------------------------------------------------------------------------------------------------------------------------------------
PEERLESS STOCK MARKET TIMING:
A Guide To
Profitably Using The Tiger Nightly HOTLINE
New Peerless Signals and DJI Charts - version 7/4/2013
1965
1965-6 1966
1966-7 1967
1967-8 1968
1968-9 1969
1969-70
1970
1970-1
1971
1971-2 1972
1972-3
1973 1973-4
1974
1974-5 1975
1975-6
1976 1976-7
1977
1977-1978
1978
1978-79
1979 1979-80
1980 1980-1
1981 1981-2
1982 1982-1983
1983 1983-1984
1984
1984-1985
1985
1985-1986
1986 1986-1987
1987 1987-8
1988
1988-9 1989
1989-90
1990
1990-1 1991
1991-2 1992
1992-3 1993
1993-4 1994
1994-5 1995
1995-1996
1996
1996-7 1997
1997-8 1998
1998-1999 1999
1999-2000 2000
2000-1
2001 2001-2
2002
2002-3 2003
2003-4 2004
2004-5
2005 2005-6
2006 2006-7
2007 2007-8
2008 2008-9
2009
2009-10
2010 2010-11
2011 2011-12
2012
2012-2013
2013 2013-4 2014
Introduction to Tiger/Peerless Buys and Sells.
Different Types
of TigerSoft/Peerless CHARTS, Signals and Indicators
How reliable support is the DJI's rising 200-day ma?
-------------------------------------------------------------------------------------------------------------------
TIGERSOFT SIGNALS AND INDICATORS:
Documentation for TigerSoft
Automatic and Optimized Signals.
SPY Charts since 1994: Advisory Closing Power S7s, Accum. Index, 65-dma,
Optimized Signals.
"The
Jig Is Up": Calling September and October Tops.
A Keynesian's Warning Signs.
NUGT since 2012: A study of Tiger Technicals
Tiger Day
Traders Tool and most active Triple Leveraged ETFs
Advisory Pink Closing Power S7s at ETF at top since 1994
1994
1996
1997
1998
1999
2000 QQQ
SPY
DIA
2002
2007
2008
SPY 2011
2013-2014
Tiger Buy and Sell
Signals: New 2014 Research:
These are randomly chosen
groups.
but clearly we need to back-test them in more years.
You can replicate or do similar studies yourself
for other signals and/or other years.
9/1/2014 -
2014 Tiger
B19s - Steady rallying and no pullbacks below the 21-day ma.
9/2/2014 -
2014 Tiger
B17s on 14As taken alphabetically
9/3/2014 -
2014 Tiger B17s on 60
Biotechs taken alphabetically
9/4/2014 -
2014 Tiger
B18s on all "R" stocks taken alphabetically
* 9/8/2014 -
2014 Tiger
B20s - Conclusion: Use Closing Power trendbreaks in aftermath.
9/8/2014 -
2014 Tiger
B16s - Conclusion: Use mostly when
LA/MA under 1.05.
9/11/2014 -
2014 Tiger
B15s - Conclusion: Certain conditions
improved the results dramatically.
9/12/2014 -
2014 Tiger
B25s - Conclusion: 87.5% success rate
when other internals are positive.
9/15/2014 -
2014 Tiger B25s -
Best conditions for using B25s with somewhat
higher RSX capitalization stocks.
9/16/2014 -
New Tiger
Closing Power Take-Off Buy Signal in 2014: 14s, QQQ, DJI-30 and ETFs
9/17/2014 -
New Tiger
Closing Power Take-Off Buy Signal: 2009A-s
9/18/2014 -
New Tiger
Closing Power Take-Off Buy Signal: 2010A-s
9/21/2014 -
New Tiger
Augmented Sell S8s: DJI-30 - 2014
Requiring S8s to show
Negative CP%-Pr and IP21<+.15 produced a 70% success rate
in a rising market for
DJI-30 stocks and big ETFs.
9/24/2014 -
Tiger Sell
S14s: They make price breakdowns very bearish.
1/15/2015
-
Tiger Day
Traders' Tool Explained.
http://www.tigersoft.com/day-traders/index.html
http://www.tigersoft.com/Indicators/index.htm
http://www.tigersoftware.com/TigerBlogs/Aug-31-2009/index.html
NEW
2/16/2015
1) New -
Tiger Charts showing UP%, Opening-Up%, Closing-Up%
Note differences between bullish
and bearish stocks...
2) New -
UP%,
Opening-Up%, Closing-Up% Rankings of any directory.
3) New -
Display of what happens to a stock after various size openings up or down.
4) New -
6-month charts to better
show volume changes and 5-day ma with bands.
More profitable trading schemes coming...
Targeted Trading Opportunities:The Profits Quickly Add Up,
3/29/2015
Tiger CandleSticks:
IBB: 2001-2015
and
Recent Others.
====================================================================================
Earlier Hotlines
2-7-2014 to 3/19/2014
11-22-2014 to 2-6-2014
http://tigersoftware.com/555HL555/index.htm
10/9/2014 - 11/21/2014
http://tigersoftware.com/9933Hot/
9/2/2014 - 10/8/2014-
http://tigersoftware.com/2233HL/index.html
6/25/2013-9/1/2014
http://tigersoftware.com/112211-H/index.htm
11/22/2013-3/20/2014
http://tigersoft.com/1111-HL/index.html
10/22/2013-11/21/2013
Past
Hotline Predictions
http://tigersoft.com/-HL42013/index.html
http://www.tigersoft.com/-2GBL13HL/index.htm
==============================================================================================================================