TigerSoft and Peerless Daily
Hotline
(C) 1985-2015 William Schmidt,
Ph.D. www.tigersoft.com
All rights
strictly reserved.
Tiger Software
858-273-5900 PO Box 22784 San Diego, CA 92192 Email
william_schmidt@hotmail.com
------------------------------------------------------------------------------------------------------------------

10/1/2015
125+ TigerSoft Charts -
Go to
www.tigersoftware.com/HH/index.html
10/1/2015
New Highs: NASD 8
NYSE 97 +34
New Lows: NASD
7 NYSE 91 +32
10/1/2015
Bullish MAXCP Stocks over
$5
28 ---->
www.tigersoft.com/MAXMIN/10-1-2015/MAXCP.html
Bearish MINCP Stocks
over $5
319 -->
http://www.tigersoft.com/MAXMIN/10-1-2015/Bearish.html
Professionals used today's rally to short more
stocks.
------------------------------------------------------------------------------------------------------------------
10/1/2015
The Sell S14 has not been reversed and the DJI has not yet tested
its closing low of August at 15666. I think the bears are still in
control; the number of new lows and MINCP stocks are 11 times
the number of new highs and MAXCP stocks. Today, the DJI could
not manage a follow-through rally. Still, the short-term trend must be considered
UP. But, if the DJI fails to get past 16500 and then breaks down
below 16000, it will be completing a bearish Continuation Head and
Shoulders pattern. That would almost certainly lead to new closing
lows. While Fridays in bear markets often bring rallies, Mondays
often bring renewed steep declines.
DJI Is Locked in Narrow Trading Range: 16000-16600
I think we should be watching BA and AAPL now. Both may be forming
their own Continuation Head and Shoulders patterns. If they break their
price necklines shown below, I would think the DJI will be in serious
trouble. They do show rising levels of institutional Accumulation, but
Professionals remain net sellers to them and the Public who are also
buying these stocks now. I would trust the Professionals more. (If you
are using Tiger, also look at the Tiger Day Traders' Tool under Indic-3
with these stocks. It is making new lows. This shows that Day
Traders
are aggressively shorting the stocks at their Openings because they
consider the subsequent declines to be much greater than any rally's potential.)
BA - Boeing
 |
AAPL - Apple
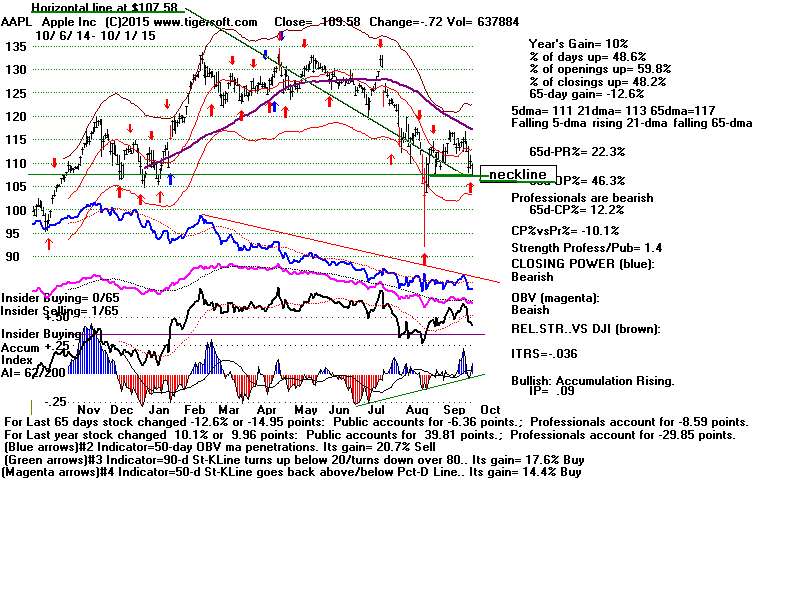 |
Still, there was no sell-off today and the Hourly DJI chart shows the minor
uptrend that the DJI is still alive. A rally back up to the 2.3% upper band
above the 21-day ma (147-hour) would take the DJI back up to 16600,
where I would expect lots of resistance.
A number of our charts show Red Buy signals now based on Stochastics.
Most of these have had very good track records for this past year. So,
I would think Friday will be an up-day, but Monday could well bring a sell-off,
as investors take the weekend to mull over the risks of owning stocks now
that the averages have broken key support and are below their falling 65-day
and 200-day ma.
People will
be surely remembering the nu,merous big
declines in early
and mid October.
Since 1966: 1967, 1971, 1976, 1977,
1978, 1979,
1980, 1984, 1987, 1989, 1990, 1997, 1998, 1999, 2000, 2002, 2004,
2005, 2007, 2008, 2013 and 2014. Six of these October
sell-offs
took place in the year before the Presidential Election. Are we about to
see the seventh? The risks of this are too great now to buy, I would
judge,
unless you are a very short-term trader and faithfully use the 5-day Stochastics,
5-day ma and Closing Power trends.
Look at how weak the Tiger Day Traders' Tool is in the ETFS you
follow. This shows whether there is more upside or downside
potential after the Opening. It shows whether Day Traders are
bearish or bullish, along with whether market makers may be rigging
higher openings so that they can go short on what they expect to be
temporary strength.
Tiger Day Traders' Tool Is bearish on IWM and DIA.
=====================================================================================
The Bearish MINCP Just Stocks Keep
Falling.
A Study of Our Recent Bearish MINCPs as Short Sales.
(Work in Progress... 9/30/2015)
Here I show the 10 top-listed Bearish MINCPs each night since
August 19th, which is just a convienient starting point since
all the charts are in tigersoft.com/MAXMIN and easily accessed.
The best short sales are often repeated night after night.
More results will be posted as soon as time permits.
One of the things to do here is study those stocks that went down the
most and see what distinguished the early in their moves. The biggest
decliners are shown in red.
8/19
FUEL 6.5
(also 8/20 5.71) ....
(9/30 4.67 )
SBR 28.04
(9/30 30.56
)
XONE 6.83 (also 8/20 6.19)
(9/30 6,71
)
ICON 13.06
(9/30 13.52
)
IDX 18.06 (also 8/21 16.88)
(9/30 16.04 )
EMES 16.61
(also 8/21 13.55, 8/25 12.27
(9/30 6.77 )
WYNN 90.25 (also 8/20
85.58, 8/21 81.77, 8/24 81.77, 8/25 75.71)
(9/30 53.12 )
FSTR 19.22 (also
8/20 18.75, 8/25 16.65)
(9/30 12.28 )
YNDX 11.91 (also 8/21 11.01. 8/24 11.01, 8/25/ 10.56)
(9/30 10.73 )
BPT 42.38 (also 8/20 41.83, 8/21 39.82, 8/24 39.82)
(9/30 41.09 )
8/20
TIVO 9.14 (also 8/25 8.64)
(9/30 8.66 )
KERX 5.54 (also
8/25 5.61)
(9/30 3.52 )
TWTR 26.0 (also 8/25 24.38)
(9/30 26.94 )
8/21
TTM 24.46 (also 8/24 24.46, 8/25 23.5)
(9/30 22.50 )
GCC 19.59 (also 8/24 19.59)
(9/30 19.47 )
YHOO 32.93
(9/30 28.91 )
POT 25.02
(also 25.02 on 8/24, 8/25 24.0)
(9/30 20.55 )
PKX 36.89
(9/30 35.02 )
8/24
MTR 8.65
(9/30 9.86 )
SCTY 40.99
(9/30 42.71 )
TFM 19.69
(9/30 22.59 )
JGW 5.3
(9/30 4.93 )
8/25
GLRE 23.77
(9/30 22.28 )
------------------------------------
From Last Night -------------------------------------------
The Bearish MINCP Stocks Keep
Falling.
Why Cover Our Short Sales in Them?
Peerless history shows that the DJI-30 can be held up for
months even while most stocks languish. Expect the FED
to find ways to help these stocks, just as they have gone
out of their ways since 2008 to boost the entire stock market.
Their main mission is preventing a big stock market decline.
Helping the DJI stocks now is probably the best they
can do.
This theorem has a corollary. It means that most of our Bearish
MINCP stocks are likely to continue to fall even if the DJI rallies 5%.
So, hold the MINCP stocks short so long as their Closing
Powers are falling.
IWM Slumps
Should we also continue to hold IWM short?
While IWM is very oversold
and should rise tomorrow, its history since 2001 shows it could
fall another 20% even though it has now declined 8 straight days.
In 2001, IWM did not bottom until it fell 10 straight days. In 2002
and 2009, IWM had to fall 11 of 12 days before bottoming. Admittedly,
in these three cases the DJI was in a bear market. In the :DJI
"corrections" of 2010 and 2011, an IWM bottom was not reached until
it fell 10 of 11 days and 11 of 12 days, respectively. Given this
statistic and the "Both Down" situation for IWM, I would bet that
IWM will have to test 104, its September 2014 lows, before it
can make much of a recovery. I note that the Russell-1000's.
A/D Line has confirmed the IWM low today and only 13% of its
stocks are above the 65-dma and that trend is declining.
SPY Daily Chart
======================== RECENT
STUDIES ======================================
But if we look back to 1929, we see there are many more cases when big market
declines began with such poor breadth numbers than they occurred at the
bottom or even before a big rally. Using a ratio of more than 7 decliners
to advancers would actually have brought good Sell signals in 63% of the
cases when they occurred when the DJI was down more than 11%
and the DJI was either in a correction or starting a bear markets.
How Well Did A
Daily Ratio of More than
7 NYSE Decliners to Advancers Work as
A Sell Signal When DJI Declined More Than 10% from Highs?
Good
Bad (It was at or near the bottom.)
Oct-Dec 1929 3
1
Aug-Dec 1937 8
1
May 1940
1
1
Aug-Dec 1941 7
1946
4
1
1948-1949 3
1
June 1950
2
1957
3
1
1962
5
2
1965
1
1966
1
1
1968
1
1969
1
1973
1
1978
3
1
1979
1
1
1980
3
1
1981
1
1
1987
1
1
1990
1
1997
1
2007-2008 1
1
2010
4
2011
2
2
2015
1
================================
49 successes (63.5%) 28 failures (36.5%)
Most Stocks Are probably Already in Bear Markets
Only 13% of the 6000 stocks we get data for each night are now above their 65-dma.
There is lots of resistance overhead and Down Volume remains much greater than
Up
Volume. In these circumstances, especially at this time of year, it's unlikely
that
|
the 65-dma will even be reached. The 21-day ma of unadjusted NYSE Up
Volume minus
Down Volume made another new low today.
As long as it is falling, we should not expect the DJI to escape the need
for a full re-testing of its recent lows. The falling A/D Line sends the same
message.
========================= Also Previously Here
===============================
What would we buy? The number of new lows is too low to
encourage us to
expect anything more than modest moves by the Bullish MAXCs. True, we see
a handful of Finance stocks among the Bullish MAXCPs. This is not
much leadership.
It is defensive, based on dividends and selective rather than representative of
an
industry-wide move. .
If this correction was over, the "natural leaders" upwards would be biotechs,
semiconductors and big banks. But these groups are still falling.
Down volume
is still very heavy among them and their Closing Powers are falling.
Too many stocks are starting to look more and more like the weak oil/gas sector
and the very troubled foreign ETFs. We see this when we plot the Tiger
Index of
each of the Groups of stocks we track or simply watch the percentage of each
Group's stocks that are above their 65-dma. These numbers now show how few
Groups or sectors are holding up and how defensive the market has
become.
There is no hurry to buy something now. Bond Funds, Beverages and
Utilities offer only small gains. Perhaps, after a successful
mid-October
test of the lows, this picture will change.
There is something else to watch. Profound weakness in the Big Banks was
the primary
warning of trouble ahead in 2007. I think we should now be asking why are
big banks
acting much weaker than the general market now.
Pct of Stocks in a
Group above their 65-dma.
60%-70% Bond Funds
50%-60% Beverages
40%-50% Airlines, Utility.
30%-40% Education, Gold, Insurance, REITS, Retails
20%-30% Computers, Green. Hackers, Home Building,
Military, NASD-100, Russell-1000,
Semi-Conductors, Software, SP-500, Transportation.
.
10%-20% Autos, Biotechs, China, DJI-30, Electronics,
Finance, Ind. Materials, Regional Banks,
0%-10% Big Banks, Chemistry, Coal, Foreign ETFs,
Gaming, Oil Gas, Pipe Lines, Solar,

The DJI is doing its job well. This Blue Chip average very often at the
end of a bull market has the special duty of maintaining the appearance
that all is well with the US stock market and that all dips are therefore
buying opportunities. This is why the DJI often tops out after the
NYSE A/D Line does, why the number of new lows on the NYSE
and NASDAQ can be greater than the number of new highs even
as the DJI rises, and how institutions are able to get out of big positions
in stocks even as they top out. Thus Friday, though the DJI rose 113 for
the day, saw 129 more down than up on the NYSE,
Down Volume
was 53 million more than Up Volume and there
were 8 times more new lows
than new highs.
One of the most common ways the DJI strengthens the illusion that all
is well, is by having one of its higher priced components jump up
inordinately. That was true on Friday when NIKE rose +10.21. This
one
stock single-handedly lifted the DJIA by 68.2 points.
When Is The Correction Typically Over?
When we look back at the Peerless indicators in the past we can see
how to judge a correction is over. The best way is normally to simply wait
for a new Peerless Buy. No Peerless Buy signal seems likely now
until the DJI retests its lows near 15600-15700. In addition, we should
look
for reversal price patterns, such as a breakout above a precisely formed
flat top (example June 1940), a compact inverted head/shoulders (August 1950
and July 1965) or a falling wedge (Nov. 1971). The NYSE A/D Line will
often break a well-defined and well-tested downtrend-line.
But most commonly, and this was a surprise to me when I did the investigating
today,
we see the correction ending only when the 21-day ma of Unadjusted
Up Volume minus Down Volume turns up. If you are using Peerless, see some
examples of this: March 1968, October 1975, December 1978, November 1979,
October 1997, March 2000, April 2001, September 2007, July 2010 and October
2011.
Conclusion: since the the 21-day ma of Unadjusted Up
Volume minus Down Volume is making
new lows now, the correction is probably not over.
Troublesome Volume Signs in DJI Now.
Stay Short IWM
IWM would need to rise by 4.1 point tomorrow to turn up its
5-day ma. Its red down-day volume has dominated trading.
It needs to more closely test its lows.
======================================================================================
Earlier Studies:
======================================================================================
Bearish Seasonality Study from Tuesday Night....
It\s hard to be bullish now when we take into account Seasonality.
Since 1965, the DJI has fallen 55% of the time this week. And since 1999,
the bearishness usually lasts for the next three weeks. In this
period,
we see a regular pattern of DJI declines from Aug-Sept highs to a mid-October
low. We see this pattern below in 11 of the years 16 years since 1999,
where the DJI's bottom was not made until 10/10 and 11/26 (Thanksgiving.)
Year Low Closing
Peerless Signal
-------------------------------------------------------------------
1999 10/14 12% below
peak B1, B3 at bottom.
2000 10/18 12% below
peak B1, B2 at bottom.
2001 9/21 Bottom after 9/11
B16 at bottom
2002 10/19 19% below
Aug peak B1, B16 at bottom.
2003 9/30 4%
below Sept peak Already on a Buy. No new Buy signal.
2004 10/22 5.5% below Sept
peak. B1, B2 at bottom.
2005 10/22 4.5% below Aug
peak. Already on a Buy. No new Buy signal.
2006 DJI was advancing steadily in this
period.
2007 11/26 10% below Sept
peak. B3, B14, B18 at bottom.
2008 10/10 27% below August
peak. B16 at bottom.
2009 DJI was advancing steadily in this
period.
2010 10/10 27% below
August peak. B16 at bottom.
2011 DJI was advancing steadily
in this period.
2012 11/26 8% below
Sept peak. B2 at bottom.
2013 10/10 6% below August
peak. B16 at bottom.
2014 10/16 6.5%
below August peak. B1 at bottom.
TABLE A
When Does A Decline Become Really
Dangerous?
We have seen how the DJI recently did find support
at the lowest possible level consistent
with it making
only a corrective decline. There were 30 "corrections", each producing
a decline of less than 14%. This was more than two and a half times the
number of bear
markets that brought a decline of more than 20%.
But now look at what happens when there is a DJI decline more than 14.5%.
There
were 15 cases where the decline was at least 19%. These are highlighted
in red: 1929, 1937, 1940, 1946, 1957, 1962, 1966, 1973-4,
1977, 1981-2,
1987, 1990, 1998, 2000-3, 2007-9. There were only four declines of 15% and
18%.
(1948, 1971, 1980 and 2017) and there were three declines of 19% to 21%:
1957, 1980 and 1998. By contrast, there were 12 bear markets where DJI
fell
more than 21%. So, the odds are are almost 4:1 that any DJI decline of
more
than 14.5% will see the DJI fall more than 19% from its highs.
Declines in Bull Market That Were Corrections
or Became Bear Markets (Declines of more
than 19%)
From 1928 to 1966, there
were 9 9%-14% corrections
and 7 bear market
declines of more than 18%. One decline
fell 15% before
reversing, but 7 others fell at least as much as 18%.
1-3 > 1928-1929 before the September 1929 peak:
3 10% corrections.
4
1929 Bear Market started with 14.5%
decline from September peak and one-week rally, then collapse.
5 > April-May 1936 11% correction.
No bear market
6 > 1937 before the August 1939 peak
1 15% correction. DJI could not get back to
old high.
7
1937 Bear Market: DJI fell 33% before
there was even a brief rally back to falling 21-dma.
8 1940 Bear Market: DJI fell
24% before reversing.
9 > 1946 before July 1946 peak
1 10% correction
10
1946 Bear Market: DJI fell 26% before reversing.
11 > 1947-48: 11%
correction. No bear market
1 10% correction
12 > 1948-1949: 15%
decline and then recovery to new highs.
13 > June-July 1950 13.5% correction.
No bear market
14 > Sept-Oct 1955
10% correction. No
bear market 1 10%
correction
15-16 > 1956 before the July 1957
peak 2 10%
corrections.
17
1957 Bear Market: DJI fell 19.5% before reversing up past falling 21-day
ma.
18 >
1959 before the January
1960 peak 1 9.2%
correction.
19 18%
1960 Bear Market:
DJI fell 11% before reversing and rallying 10%..
20
1961-1962 Bear Market: DJI fell 27% before rallying. - there was a
massive head/shoulders
-----------------------------------------------------------------------------------------------------------------
21 > 1965 before January 1966
peak 1 10.5%
correction
22
1966 Bear Market: DJI fell 25% before rallying. - 5%
rebound when down 13.5%
23 > 1967-1968 before December 1968 peak 1
12% correction 5% rebound when down 10
24
10% corrections, 10%
recovery, then a fuller 16% decline from April 1971 top.
25 Deep 1973 Bear Market.
8% recovery after only a 10% decline.
26 > July-October 1975 10%
correction. No bear market.
27
1977-8 Bear Market.
28 > 1978
13.5%
correction in Sept-Oct 1978.
No deeper
bear market.
29 >
1979 11%
correction in Sept-Oct 1979.
No deeper
bear market.
30 >
1980 16%
correction in Feb-April 1980.
No deeper
bear market.
31 > 1980 before the April
1981 peak 1 10%
correction.
32
1981-1982 Bear Market. First temporary recovery to upper band after 19.5% decline.
33 1987
- 36%
Bear Market. No minor recoveries.
34 >
1989 1 10% correction. No deeper
bear market.
35 >
1990 1 10% correction. No deeper
bear market.
36 1990 - 21% Bear
Market.
37 > 1994
1 11% correction
No deeper
bear market.
38 > 1996
1 10% correction No deeper
bear market.
39 > 1997
1 13.5% correction in Aug-October 1997.
No deeper
bear market.
40 1998 -
19.5% Bear
Market.
41 > 1999
1 11%
correction.
42 2000-2003 Bear
Market. This began with DJI 16.5% decline.
Though there
were rallies in 2000 and 2001, most stocks fell and
were trapped in a long bear market.
43 >
2004 1
9%
correction.
No deeper
bear market.
44 >
2007 1
10%
correction. before the
October 2007 peak
45
2007-2009 Bear Market.
46 >
2010
1 13.5%
correction in April - July 2010.
No deeper
bear market.
47 2011 17%
Decline - May - October 2011
? No 10% corrections before
May - August 2015 top.
|
=============== Previous Comments Here ====================
Trouble
Lies Ahead
Somehow, it is the DJI and SP-500 which will have to lead ALL other
markets higher.
The broader US market remains quite weak. 90% of all stocks are below their
65-dma.
Somehow the US now must also lead the world markets out of their Deflationary
spiral.
This won't be easy. The de-Industrialization of America and the 35
year decline
in its middle class have gravely weakened Consumer Demand just when Foreign
demand is in the tank, too. This is why we watch the Four Horses of the
Deflation
Apocalypse. Many overseas markets are in a steep declines, as are
Commodities,
Oil/Gas and the Chinese market.
Friday watch the Jobs numbers closely. It's true that +200,00 new Jobs
have
been added in each of the last 3 months, but it is also true that the
recent June and July
numbers do show a deterioration both from a year ago and from the previous month.
I think we have to get past simply relying on the standard media's write-ups of
these numbers.
NEW NON-FARM EMPLOYEES IN US
8/8/2015 (in 1000s)
| Year |
Jan |
Feb |
Mar |
Apr |
May |
Jun |
Jul |
Aug |
Sep |
Oct |
Nov |
Dec |
Annual |
| 2004 |
161 |
44 |
332 |
249 |
307 |
74 |
32 |
132 |
162 |
346 |
65 |
129 |
|
| 2005 |
134 |
239 |
134 |
363 |
175 |
245 |
373 |
196 |
67 |
84 |
337 |
159 |
|
| 2006 |
277 |
315 |
280 |
182 |
23 |
77 |
207 |
184 |
157 |
2 |
210 |
171 |
|
| 2007 |
238 |
88 |
188 |
78 |
144 |
71 |
-33 |
-16 |
85 |
82 |
118 |
97 |
|
| 2008 |
15 |
-86 |
-80 |
-214 |
-182 |
-172 |
-210 |
-259 |
-452 |
-474 |
-765 |
-697 |
|
| 2009 |
-798 |
-701 |
-826 |
-684 |
-354 |
-467 |
-327 |
-216 |
-227 |
-198 |
-6 |
-283 |
|
| 2010 |
18 |
-50 |
156 |
251 |
516 |
-122 |
-61 |
-42 |
-57 |
241 |
137 |
71 |
|
| 2011 |
70 |
168 |
212 |
322 |
102 |
217 |
106 |
122 |
221 |
183 |
164 |
196 |
|
| 2012 |
360 |
226 |
243 |
96 |
110 |
88 |
160 |
150 |
161 |
225 |
203 |
214 |
|
| 2013 |
197 |
280 |
141 |
203 |
199 |
201 |
149 |
202 |
164 |
237 |
274 |
84 |
|
| 2014 |
144 |
222 |
203 |
304 |
229 |
267 |
243 |
203 |
271 |
243 |
353 |
249 |
|
| 2015 |
201 |
266 |
119 |
187 |
260
|
231
|
215 |
|
|
|
|
|
I consider Peerless not to be offering a current
reversing Buy or Sell now. This
is highly unusual, but so is the market. The nearly 1000 point advance
in only two days did not even take the DJI above its falling 65-day ma.
This gives the appearance of a DJI only making a bear market rally up to
resistance last week. In the next Peerless update (expected to be released
on Friday), the characteristics mentioned above will give an automatic Sell S14.
In an on-going bear market the S14 would call for selling and selling short.
But currently we are not officially in a bear market. A DJI decline of more
than 18% from its high is the standard used by Peerless). As such the Sell S14
is only a "take profits" signal;. In fact, the DJI has still not fallen
more than
14% from its highs so far. You will recall that I have shown here recently that
since 1928 77% of the numerous DJI declines of 10% to 13.5% were
"corrections" in an on-going bull market and soon brought recoveries back
to their old highs, at least. . So, the new Sell S14 in our market environment
only says what I have already said here, namely to mostly go to cash
unless you are a very short-trader and can watch the Hourly DJI during the
day and want to play the typical recovery that should develop between
15700-16000 and sell when the Hourly DJI's uptrend is violated or the
DJI again reaches 16700.
===============================================
Additional Notes
===============================================
Temporary Sharp Declines
and Extreme Artificial Sell-Offs.
Looking at the Peerless charts for 1987,
1997, 2011 and 2010
show us that the odds favor a retest of the 16000. Only the 1997
case would suggest that there will only be a shallow one- or two-day
retreat.
1987 Crash (Caused by
Reckless Computerized Trading in Index Options.)
1997 Parallel:
Only
two very shallow retreats here before old high was challenged,
2010
Flash Crash
2011 Republican Shut-Down of Federal Government
(Boehner says that this will not occur in 2015.)
From Wednesday night:
Other Sharp DJI Declines to The 13.5%-Down Level
When one studies other DJI recoveries in the past after sharp declines
to the 13.5%-14% support- level below the bull market peak, we see that
the falling 21-day ma does act as resistance for a week before prices
penetrate it and resume their rally. See the study here.
../../MAXMIN/8-28-2015/big_declines_and_the_importance.htm
Look especially at the charts of 1941 (months before Pearl Harbor),
1950 (a month after North Korea invaded South Korea) and
in 1997. Especially note the 1997 Panic. It occurred because of a
panic
in Asia with the DJI up very considerably over the prior 6 years.
Computerized trading then also drove the decline down excessively.
Wikopedia writes:
"The October 27, 1997, mini-crash is the name of a global
stock market crash
that was caused by an
economic crisis in Asia. The point loss that the
Dow Jones Industrial Average suffered on this day still ranks as the eighth
biggest
point loss and 15th biggest percentage loss since its creation in 1896. This
crash is
considered a "mini-crash" because the percentage loss was relatively small
compared
to some other notable crashes. But after the crash, the markets still remained
positive
for 1997. " (See
October 27, 1997, mini-crash - Wikipedia)
BUY B16s
B16
Trading Results by which Year in 4-Year Presidential Election Cycle
the Buy B16s occurred in.
Year
No. Avg.Gain
Presidential Election Year 5
.263
PE + 1
7 .281
PE + 2
8 .150
PE + 3
6 .115
B16 Trading Results by
which Month the Buy B16s occurred in.
Month
No. Avg.Gain
January
0 ---
February
1 .988
March
2 .220
April
2 .097
May
2 .135
June
2 .044
July
2 .047
August
2 .039 (lowest)
September
2 .153
October
3 .156
November
4 .172
December
4 .176
Previous August Buy
B16s
DJI
Gain
19660831 B16
788.51 .022 no paper
loss
la/ma AROC
PI PI-Ch IP21 V-I
OPct 65-dma Pct Change
.966 -.643
-257 41
-.189 -13 -.312
-.109
-------------------------------------------------------------------------------------------------------------
19710809 B16
842.65 .055
fell to 839.59 (0.4% paper loss)
la/ma AROC
PI PI-Ch IP21 V-I
OPct 65-dma Pct Change
.963 -.802
-277 -36 -.159 -4
-.404 -.102
-------------------------------------------------------------------------------------------------------------
20150825 B16 842.65
.055
la/ma AROC
PI PI-Ch IP21 V-I
OPct 65-dma Pct Change
.906 -1.216
-310 +50 -.084 -246
-.507 -.141 |
------------------------
Announcements
--------------------------------
E-Books
1
The On-Line Explosive Stocks
2
The On-Line Killer Short
Sales book
Purchase each all new book by CC for
$42.50 or send a check for $37.50 to me.
I call your
attention now to the many new concepts and
the considerable new research in them:
For example:
1) A very good New Tiger Buy B12 for Low
Priced Stocks
2) After Red high volume reversal days use CP
uptrend-breaks.
3) Buy the stocks the Federal Govt wants you
to buy.
4) 100-Day Power Rankings...
5) Using Closing Power Hooks after Buy B26s
and B20s.
6) How A Stock Reacts to Its Earnings Report
Is Very important.
7) TigerSoft Major Buy Signals' Combinations
Which are most Powerful? Reliable?
8) Augmented Buy B20s' Independent Success
Rate.
9) What factors warn a rising 65-dma will not
hold?
10) The classic cluster of technical
characteristics that commonly appear
in the 23 stocks falling 70% or more in
the deep pullback of 2011.
----------------------------------------------------------------------------------------------------------------------------------------------------------------------------
PEERLESS STOCK MARKET TIMING:
A Guide To
Profitably Using The Tiger Nightly HOTLINE
New Peerless Signals and DJI Charts - version 7/4/2013
1965
1965-6 1966
1966-7 1967
1967-8 1968
1968-9 1969
1969-70
1970
1970-1
1971
1971-2 1972
1972-3
1973 1973-4
1974
1974-5 1975
1975-6
1976 1976-7
1977
1977-1978
1978
1978-79
1979 1979-80
1980 1980-1
1981 1981-2
1982 1982-1983
1983 1983-1984
1984
1984-1985
1985
1985-1986
1986 1986-1987
1987 1987-8
1988
1988-9 1989
1989-90
1990
1990-1 1991
1991-2 1992
1992-3 1993
1993-4 1994
1994-5 1995
1995-1996
1996
1996-7 1997
1997-8 1998
1998-1999 1999
1999-2000 2000
2000-1
2001 2001-2
2002
2002-3 2003
2003-4 2004
2004-5
2005 2005-6
2006 2006-7
2007 2007-8
2008 2008-9
2009
2009-10
2010 2010-11
2011 2011-12
2012
2012-2013
2013 2013-4 2014
Introduction to Tiger/Peerless Buys and Sells.
Different Types
of TigerSoft/Peerless CHARTS, Signals and Indicators
How reliable support is the DJI's rising 200-day ma?
-------------------------------------------------------------------------------------------------------------------
TIGERSOFT SIGNALS AND INDICATORS:
Documentation for TigerSoft
Automatic and Optimized Signals.
SPY Charts since 1994: Advisory Closing Power S7s, Accum. Index, 65-dma,
Optimized Signals.
"The
Jig Is Up": Calling September and October Tops.
A Keynesian's Warning Signs.
NUGT since 2012: A study of Tiger Technicals
Tiger Day
Traders Tool and most active Triple Leveraged ETFs
Advisory Pink Closing Power S7s at ETF at top since 1994
1994
1996
1997
1998
1999
2000 QQQ
SPY
DIA
2002
2007
2008
SPY 2011
2013-2014
Tiger Buy and Sell
Signals: New 2014 Research:
These are randomly chosen
groups.
but clearly we need to back-test them in more years.
You can replicate or do similar studies yourself
for other signals and/or other years.
9/1/2014 -
2014 Tiger
B19s - Steady rallying and no pullbacks below the 21-day ma.
9/2/2014 -
2014 Tiger
B17s on 14As taken alphabetically
9/3/2014 -
2014 Tiger B17s on 60
Biotechs taken alphabetically
9/4/2014 -
2014 Tiger
B18s on all "R" stocks taken alphabetically
* 9/8/2014 -
2014 Tiger
B20s - Conclusion: Use Closing Power trendbreaks in aftermath.
9/8/2014 -
2014 Tiger
B16s - Conclusion: Use mostly when
LA/MA under 1.05.
9/11/2014 -
2014 Tiger
B15s - Conclusion: Certain conditions
improved the results dramatically.
9/12/2014 -
2014 Tiger
B25s - Conclusion: 87.5% success rate
when other internals are positive.
9/15/2014 -
2014 Tiger B25s -
Best conditions for using B25s with somewhat
higher RSX capitalization stocks.
9/16/2014 -
New Tiger
Closing Power Take-Off Buy Signal in 2014: 14s, QQQ, DJI-30 and ETFs
9/17/2014 -
New Tiger
Closing Power Take-Off Buy Signal: 2009A-s
9/18/2014 -
New Tiger
Closing Power Take-Off Buy Signal: 2010A-s
9/21/2014 -
New Tiger
Augmented Sell S8s: DJI-30 - 2014
Requiring S8s to show
Negative CP%-Pr and IP21<+.15 produced a 70% success rate
in a rising market for
DJI-30 stocks and big ETFs.
9/24/2014 -
Tiger Sell
S14s: They make price breakdowns very bearish.
1/15/2015
-
Tiger Day
Traders' Tool Explained.
http://www.tigersoft.com/day-traders/index.html
http://www.tigersoft.com/Indicators/index.htm
http://www.tigersoftware.com/TigerBlogs/Aug-31-2009/index.html
NEW
2/16/2015
1) New -
Tiger Charts showing UP%, Opening-Up%, Closing-Up%
Note differences between bullish
and bearish stocks...
2) New -
UP%,
Opening-Up%, Closing-Up% Rankings of any directory.
3) New -
Display of what happens to a stock after various size openings up or down.
4) New -
6-month charts to better
show volume changes and 5-day ma with bands.
More profitable trading schemes coming...
Targeted Trading Opportunities:The Profits Quickly Add Up,
3/29/2015
Tiger CandleSticks:
IBB: 2001-2015
and
Recent Others.
====================================================================================
Earlier Hotlines
2-7-2014 to 3/19/2014
11-22-2014 to 2-6-2014
http://tigersoftware.com/555HL555/index.htm
10/9/2014 - 11/21/2014
http://tigersoftware.com/9933Hot/
9/2/2014 - 10/8/2014-
http://tigersoftware.com/2233HL/index.html
6/25/2013-9/1/2014
http://tigersoftware.com/112211-H/index.htm
11/22/2013-3/20/2014
http://tigersoft.com/1111-HL/index.html
10/22/2013-11/21/2013
Past
Hotline Predictions
http://tigersoft.com/-HL42013/index.html
http://www.tigersoft.com/-2GBL13HL/index.htm
==============================================================================================================================