TigerSoft and Peerless Daily
Hotline
www.tigersoft.com/HL888
(C) 1985-2015 William Schmidt,
Ph.D. www.tigersoft.com
All rights
strictly reserved.
Tiger Software
858-273-5900 PO Box 22784 San Diego, CA 92192 Email
william_schmidt@hotmail.com
------------------------------------------------------------------------------------------------------------------
Announcements
-
Tiger/Peerless UPDATE. A new TigerSoft/Peerless update
has been released today.
The new Tiger's update has the new Sell S12. It has the
new QuickSilver table which is produced for any directory's stocks.
It should work well with the stocks in LEVERAGE, HIGHIP21,
MAXCP, MINCP, REDSELL and NEAR65. With this QuickSilver
table displayed, you point the mouse at the symbol and click Graph.
The Peercomm will also allow you to get stock data again from Dial Data.
------------------------------------------------------------------------------------------------------------------
8/7/2014
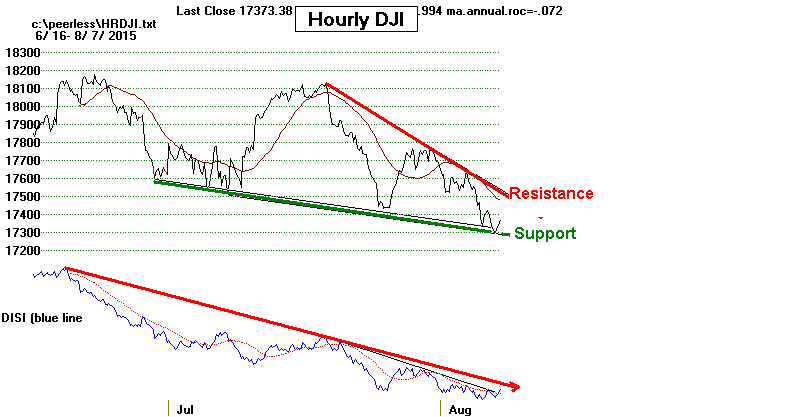
The operative Peerless signal remains a pair of Red Sell 12*s.
17300 has become the short-term hourly support. But until Peerless
gives a Buy signal, it is probably best to expect lower prices.
There were 5x more new lows than new highs of Friday and 12x more
Closing Power new lows than CP new highs. It seems likely that
there is still much more money to be made being short than long.
And in another month, we will find ourselves in September, the
year's most bearish month.
The DJI has now fallen 2.2% below its 21-day ma. The P-Indicator,
NYSE A/D Line and Accum. Index did not confirm the DJI's
new low below its neckline support at 17500. But the seven straight
down days for the DJI historically confirm the DJI penetration
of its 65-dma. Significant declines were always started in these
circumstances. There are five such earlier cases.
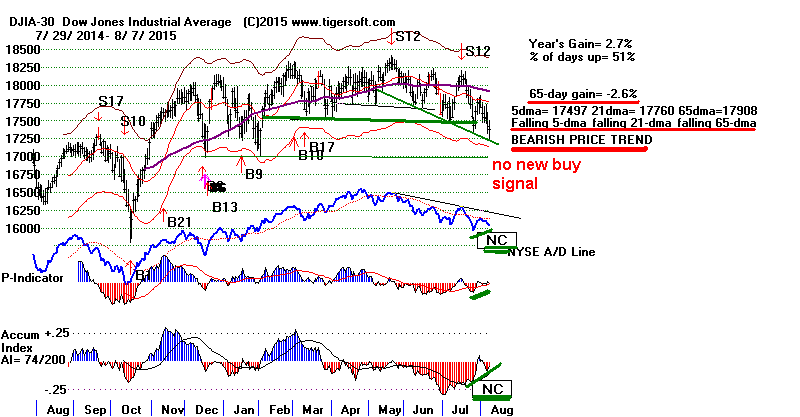
The DJI has now fallen 7 straight days in a row. Historically, this is
much more likely to be significantly bearish than afford a buying
opportunity when it takes not far below a bull market peak,
below its 65-dma and and occurs between 3% and 2% below
the 21-day ma, as now. It is true that the current Accum. Index (IP21)
for the DJI now is higher than in any of these cases, but we should
see that this cluster of characteristics out-weighs even a positive
P-Indicator.
Here are all the cases:
LA/MA 21-dmaAROC PI
IP21 OPct What DJI Did
Subsequently
-------------------------------------------------------------------------------------------------
8/7/2015 (Friday) .978
-.117
-33 -.03 -.375
?
-------------------------------------------------------------------------------------------------
1/21/1941
.979 -.055
+10 -.112
-.363 128.2 to 117.9 in 1 month
-------------------------------------------------------------------------------------------------
5/16/1956
.972 -.337
-73 -.167 -.306
492.7 to 468.8 in 2 weeks
-------------------------------------------------------------------------------------------------
6/9/1959
.975 -.139
-158 -.067 -.223
617.6 to 678.1 in 8 weeks
This is the only case where the DJI was
above its rising 65-dma
-------------------------------------------------------------------------------------------------
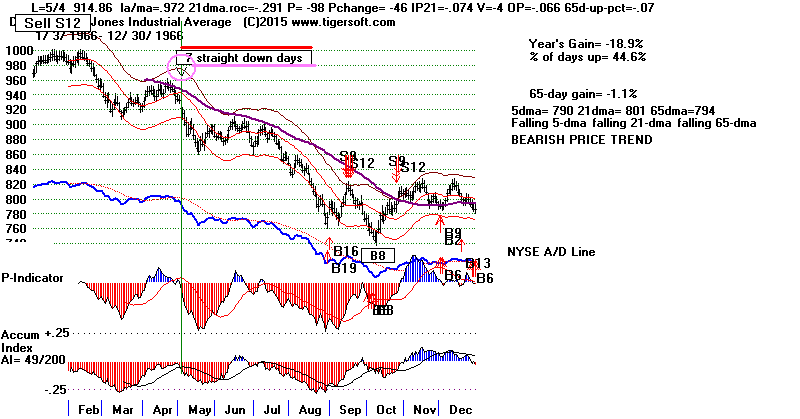
5/4/1966
.972 -.291
-98 -.274 -.066
919.86 to 749.61 in 5 months
-------------------------------------------------------------------------------------------------
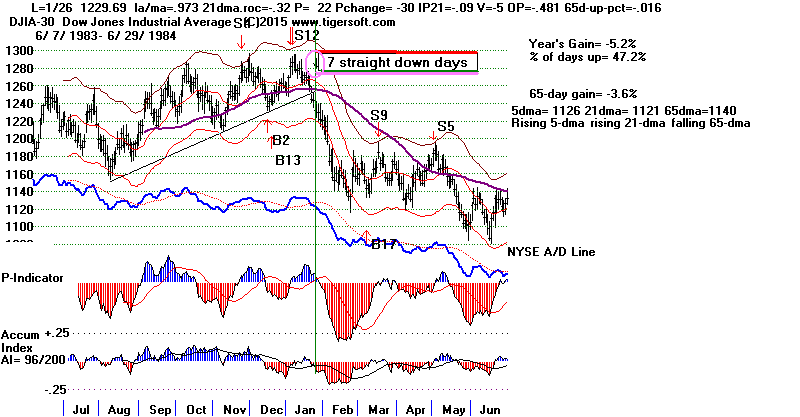
1/26/84
.973 -.320
+22
-.090 -.481
1229.69 to 1134.63 in 1 month
-------------------------------------------------------------------------------------------------
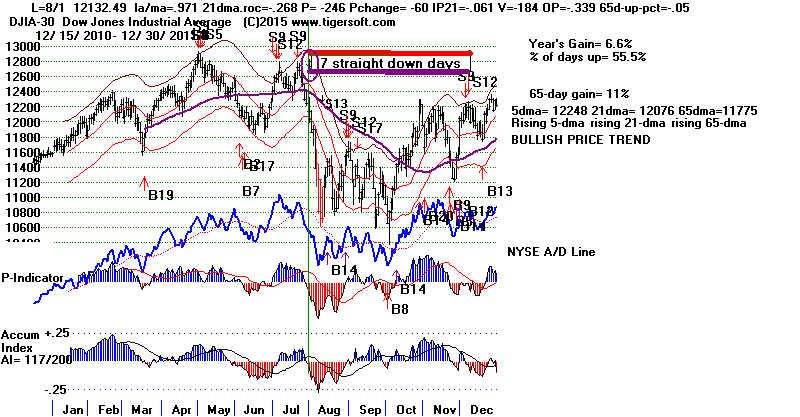
8/11/2011
.971 -.268
-246 -.061 -.339
12122 to 10655 in 10 weeks
7 Straight Down Days near a Bull
Market Peak,
2%-2.9% below 21-dma and below 65-dma.
1/21/1941
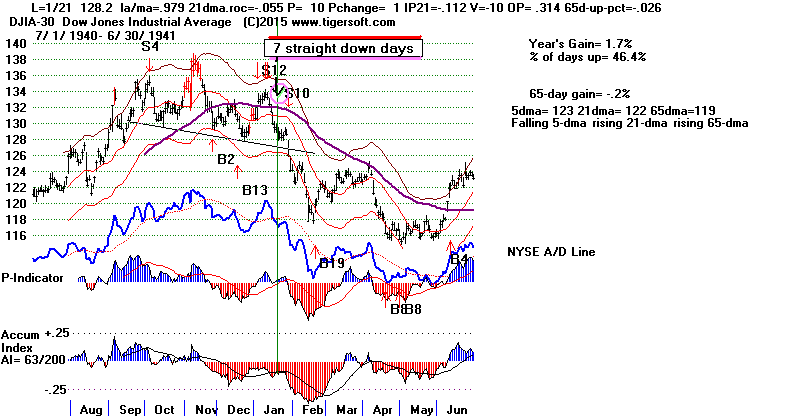
|
5/16/1956
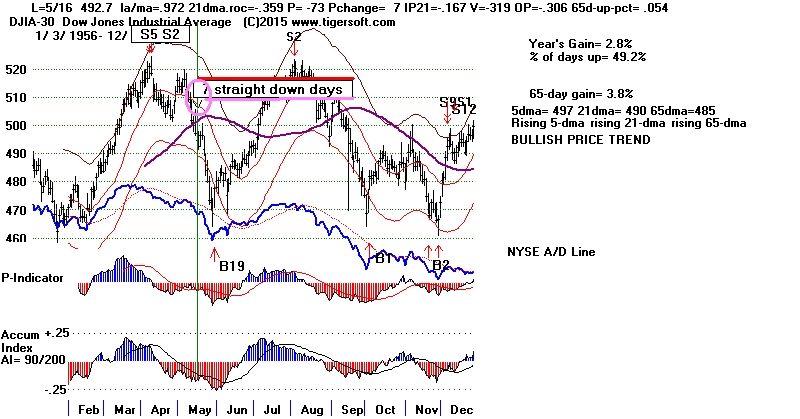 |
5/4/1966
 |
1/26/84
 |
8/11/2011
 |
Professionals are still Net Sellers even though
the
DJI is the weakest, by far, of the key general market Indexes.
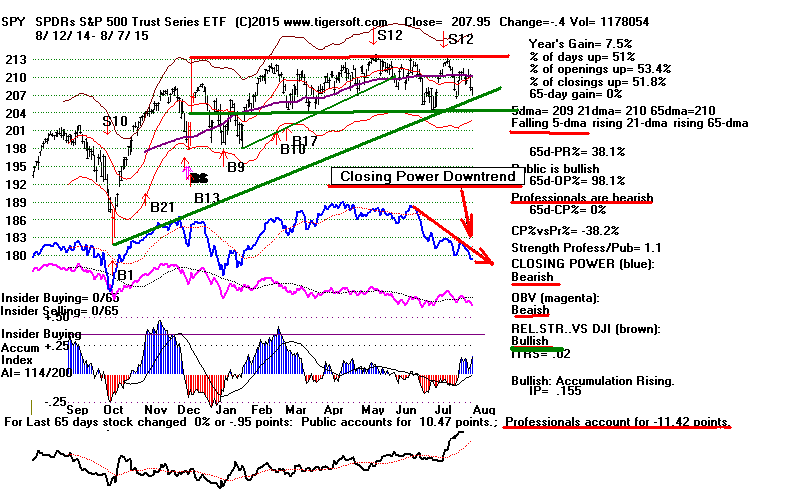
The Closing Powers for the key ETFs and their 5-day ma (5DAROC%)
are
all falling, except for FAS and OEX. See the QuickSilver
table below.
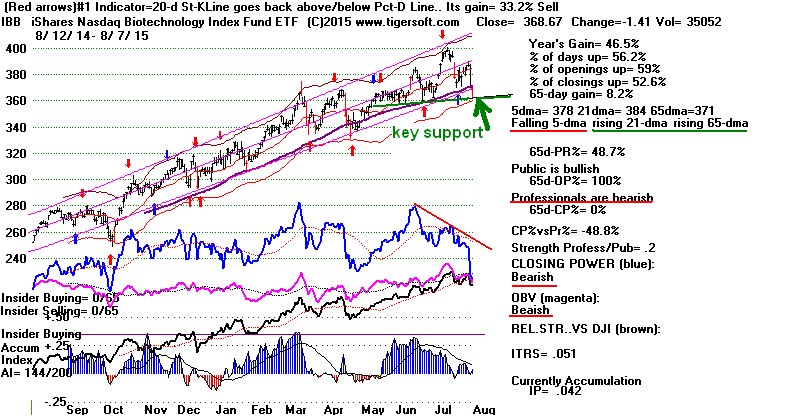
IBB has not yet decisively penetrated its neckline and 65-dma.
This gives some hope to the bulls that the more speculative stocks will
recover. This remains to be seen.
Key DJI-30 Stocks and General Market ETFs:  ( C:\dji-30 )
                                08/07/15
5DAROC%       Symbol        Last          5-dma         Pivot         Change
..............................................................................................
IP21          AI/200        OP-PWR        CP-PWR        PCT-Up   Daily Vol. notes
============================================================================================== ----------------------------------------------------------
-23.2         FAS           34.37         34.48         34.59         .14
.22           147           Rising        ?             .542          bullish
---------------------------------------------------------------------------------------------
-39.8         GS            203.44        204.82        204.69        -1.65
.01           127           Rising        Falling       .534          bearish
---------------------------------------------------------------------------------------------
-47.7         MDY           270.89        272.21        272.66        -.32
-.05          136           Rising        Falling        .518          bearish
---------------------------------------------------------------------------------------------
-60.9         SPY           207.95        209.11        209.79        -.4
.16           114           Rising        Falling        .51           bearish
---------------------------------------------------------------------------------------------
-73.6         QQQ           110.31        111.2         111.6         -.14
.11           102           Rising        Falling        .55           vol.fell on down-day
---------------------------------------------------------------------------------------------
-80           OEX           916.32        923.37        928.59        -3.15
.05           114           Rising        ?             .502           vol.fell on down-day
---------------------------------------------------------------------------------------------
-81           DIA           173.84        174.9         175.75        -.38
.06           118           Rising        Falling       .534          bearish
---------------------------------------------------------------------------------------------
-82.7         OIH           30.77         30.76         30.52         -.82
-.22          83            Falling       Falling        .434          vol.fell on down-day
---------------------------------------------------------------------------------------------
-126.2        IWM           119.88        121.46        122.35        -.81
-.02          144           ?             Falling       .538           bearish
---------------------------------------------------------------------------------------------
-181.9        IBB           368.67        378.28        382.13        -1.41
.04           144           Rising        Falling        .562          bearish
---------------------------------------------------------------------------------------------
-223.3        SOXL          25.45         25.75         26.35         .41
.15           144           ?             Falling        .55           vol.fell on up-day
---------------------------------------------------------------------------------------------
-247.1        AAPL          115.52        115.83        118.44        .39
.08           75            Falling       Falling        .506          vol.fell on up-day
---------------------------------------------------------------------------------------------
-368.4        TNA           79.63         82.79         84.61         -1.58
-.02          143           ?             Falling       .538          vol.fell on down-day
---------------------------------------------------------------------------------------------
-400          OIL           8.46          8.73          8.83          -.22
-.26          79            Falling       Falling        .43           vol.fell on down-day
---------------------------------------------------------------------------------------------
-462.1        NUGT          3.15          3.08          3.09          .01
-.29          49            Falling       Falling        .446          vol.fell on up-day
---------------------------------------------------------------------------------------------
-796.4        GASL          6.31          6.32          6.42          -.43
-.39          53            Rising        Falling       .402           vol.fell on down-day
---------------------------------------------------------------------------------------------
|
------------------------
Announcements
--------------------------------
E-Books
1
The On-Line Explosive Stocks
2
The On-Line Killer Short
Sales book
Purchase each all new book by CC for
$42.50 or send a check for $37.50 to me.
I call your
attention now to the many new concepts and
the considerable new research in them:
For example:
1) A very good New Tiger Buy B12 for Low
Priced Stocks
2) After Red high volume reversal days use CP
uptrend-breaks.
3) Buy the stocks the Federal Govt wants you
to buy.
4) 100-Day Power Rankings...
5) Using Closing Power Hooks after Buy B26s
and B20s.
6) How A Stock Reacts to Its Earnings Report
Is Very important.
7) TigerSoft Major Buy Signals' Combinations
Which are most Powerful? Reliable?
8) Augmented Buy B20s' Independent Success
Rate.
9) What factors warn a rising 65-dma will not
hold?
10) The classic cluster of technical
characteristics that commonly appear
in the 23 stocks falling 70% or more in
the deep pullback of 2011.
----------------------------------------------------------------------------------------------------------------------------------------------------------------------------
PEERLESS STOCK MARKET TIMING:
A Guide To
Profitably Using The Tiger Nightly HOTLINE
New Peerless Signals and DJI Charts - version 7/4/2013
1965
1965-6 1966
1966-7 1967
1967-8 1968
1968-9 1969
1969-70
1970
1970-1
1971
1971-2 1972
1972-3
1973 1973-4
1974
1974-5 1975
1975-6
1976 1976-7
1977
1977-1978
1978
1978-79
1979 1979-80
1980 1980-1
1981 1981-2
1982 1982-1983
1983 1983-1984
1984
1984-1985
1985
1985-1986
1986 1986-1987
1987 1987-8
1988
1988-9 1989
1989-90
1990
1990-1 1991
1991-2 1992
1992-3 1993
1993-4 1994
1994-5 1995
1995-1996
1996
1996-7 1997
1997-8 1998
1998-1999 1999
1999-2000 2000
2000-1
2001 2001-2
2002
2002-3 2003
2003-4 2004
2004-5
2005 2005-6
2006 2006-7
2007 2007-8
2008 2008-9
2009
2009-10
2010 2010-11
2011 2011-12
2012
2012-2013
2013 2013-4 2014
Introduction to Tiger/Peerless Buys and Sells.
Different Types
of TigerSoft/Peerless CHARTS, Signals and Indicators
How reliable support is the DJI's rising 200-day ma?
-------------------------------------------------------------------------------------------------------------------
TIGERSOFT SIGNALS AND INDICATORS:
Documentation for TigerSoft
Automatic and Optimized Signals.
SPY Charts since 1994: Advisory Closing Power S7s, Accum. Index, 65-dma,
Optimized Signals.
"The
Jig Is Up": Calling September and October Tops.
A Keynesian's Warning Signs.
NUGT since 2012: A study of Tiger Technicals
Tiger Day
Traders Tool and most active Triple Leveraged ETFs
Advisory Pink Closing Power S7s at ETF at top since 1994
1994
1996
1997
1998
1999
2000 QQQ
SPY
DIA
2002
2007
2008
SPY 2011
2013-2014
Tiger Buy and Sell
Signals: New 2014 Research:
These are randomly chosen
groups.
but clearly we need to back-test them in more years.
You can replicate or do similar studies yourself
for other signals and/or other years.
9/1/2014 -
2014 Tiger
B19s - Steady rallying and no pullbacks below the 21-day ma.
9/2/2014 -
2014 Tiger
B17s on 14As taken alphabetically
9/3/2014 -
2014 Tiger B17s on 60
Biotechs taken alphabetically
9/4/2014 -
2014 Tiger
B18s on all "R" stocks taken alphabetically
* 9/8/2014 -
2014 Tiger
B20s - Conclusion: Use Closing Power trendbreaks in aftermath.
9/8/2014 -
2014 Tiger
B16s - Conclusion: Use mostly when
LA/MA under 1.05.
9/11/2014 -
2014 Tiger
B15s - Conclusion: Certain conditions
improved the results dramatically.
9/12/2014 -
2014 Tiger
B25s - Conclusion: 87.5% success rate
when other internals are positive.
9/15/2014 -
2014 Tiger B25s -
Best conditions for using B25s with somewhat
higher RSX capitalization stocks.
9/16/2014 -
New Tiger
Closing Power Take-Off Buy Signal in 2014: 14s, QQQ, DJI-30 and ETFs
9/17/2014 -
New Tiger
Closing Power Take-Off Buy Signal: 2009A-s
9/18/2014 -
New Tiger
Closing Power Take-Off Buy Signal: 2010A-s
9/21/2014 -
New Tiger
Augmented Sell S8s: DJI-30 - 2014
Requiring S8s to show
Negative CP%-Pr and IP21<+.15 produced a 70% success rate
in a rising market for
DJI-30 stocks and big ETFs.
9/24/2014 -
Tiger Sell
S14s: They make price breakdowns very bearish.
1/15/2015
-
Tiger Day
Traders' Tool Explained.
http://www.tigersoft.com/day-traders/index.html
http://www.tigersoft.com/Indicators/index.htm
http://www.tigersoftware.com/TigerBlogs/Aug-31-2009/index.html
NEW
2/16/2015
1) New -
Tiger Charts showing UP%, Opening-Up%, Closing-Up%
Note differences between bullish
and bearish stocks...
2) New -
UP%,
Opening-Up%, Closing-Up% Rankings of any directory.
3) New -
Display of what happens to a stock after various size openings up or down.
4) New -
6-month charts to better
show volume changes and 5-day ma with bands.
More profitable trading schemes coming...
Targeted Trading Opportunities:The Profits Quickly Add Up,
3/29/2015
Tiger CandleSticks:
IBB: 2001-2015
and
Recent Others.
====================================================================================
Earlier Hotlines
2-7-2014 to 3/19/2014
11-22-2014 to 2-6-2014
http://tigersoftware.com/555HL555/index.htm
10/9/2014 - 11/21/2014
http://tigersoftware.com/9933Hot/
9/2/2014 - 10/8/2014-
http://tigersoftware.com/2233HL/index.html
6/25/2013-9/1/2014
http://tigersoftware.com/112211-H/index.htm
11/22/2013-3/20/2014
http://tigersoft.com/1111-HL/index.html
10/22/2013-11/21/2013
Past
Hotline Predictions
http://tigersoft.com/-HL42013/index.html
http://www.tigersoft.com/-2GBL13HL/index.htm
==============================================================================================================================
 8/7/2015 200+ TigerSoft Charts -