TigerSoft and Peerless Daily
Hotline
www.tigersoft.com/HL888
(C) 1985-2015 William Schmidt,
Ph.D. www.tigersoft.com
All rights
strictly reserved.
Tiger Software
858-273-5900 PO Box 22784 San Diego, CA 92192 Email
william_schmidt@hotmail.com
------------------------------------------------------------------------------------------------------------------
Announcements
-
Tiger/Peerless UPDATE. A new TigerSoft/Peerless update
has been released today.
The new Tiger's update has the new Sell S12. It has the
new QuickSilver table which is produced for any directory's stocks.
It should work well with the stocks in FASTUP, FASTDOWN, LEVERAGE, HIGHIP21,
MAXCP, MINCP, REDSELL and NEAR65. With this QuickSilver
table displayed, you point the mouse at the symbol and click Graph.
The Peercomm will also allow you to get stock data again from Dial Data.

8/18/2015
70+ TigerSoft Charts -
Go to www.tigersoft.com/HH/Index.html
8/19/2015
New Highs: NASD 10
NYSE 17
New Lows: NASD
115 NYSE 193
8/19/2015 Bullish MAXCP Stocks
62 ---->
www.tigersoft.com/MAXMIN/8-19/MAXCP.htm
Bearish MINCP Stocks
156 -->
www.tigersoft.com/MAXMIN/8-19/MINCP.htm
------------------------------------------------------------------------------------------------------------------
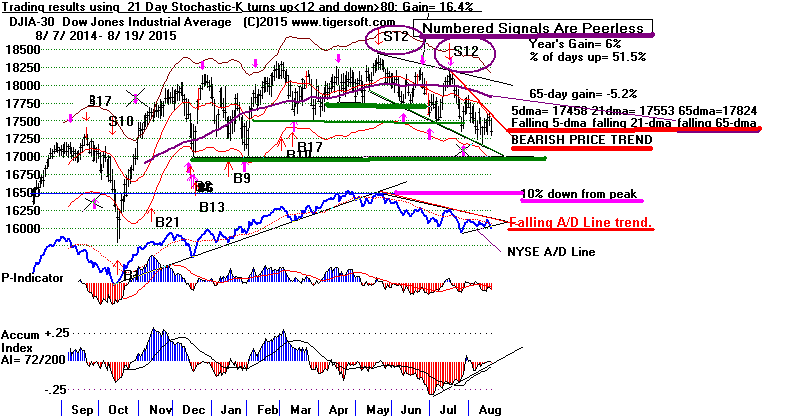
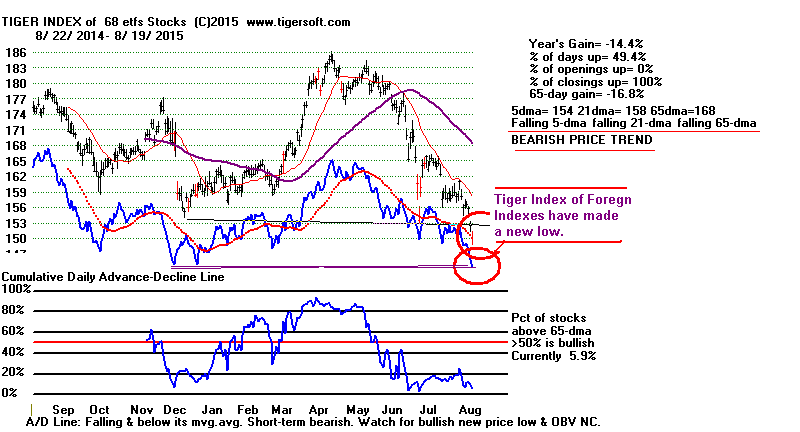
8/19/2015 Peerless
remains on Red Sell 12*s.
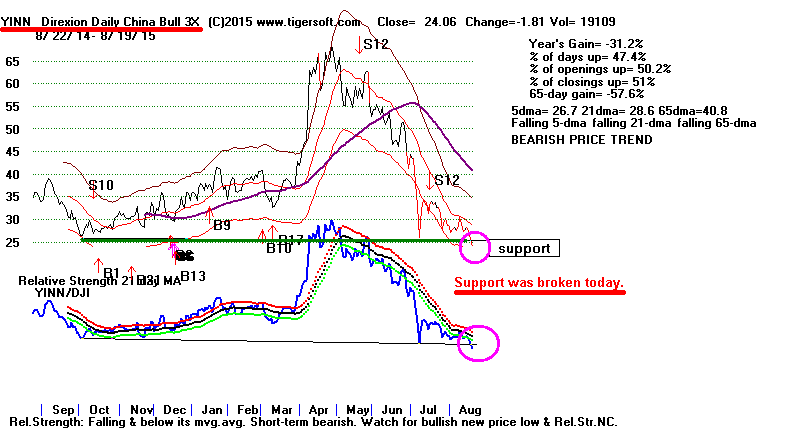
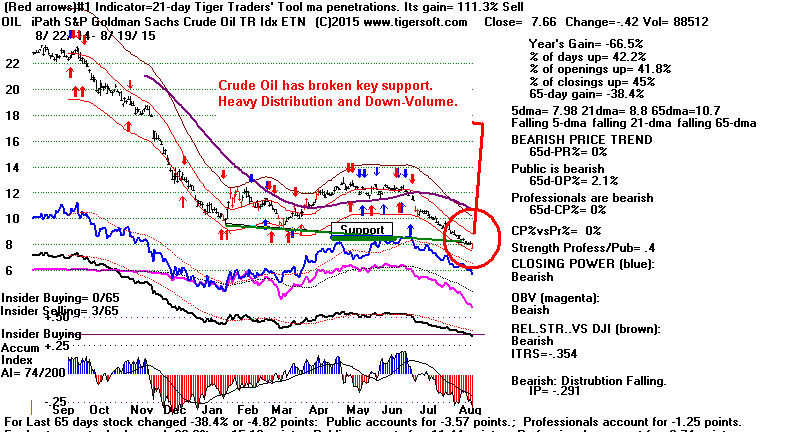
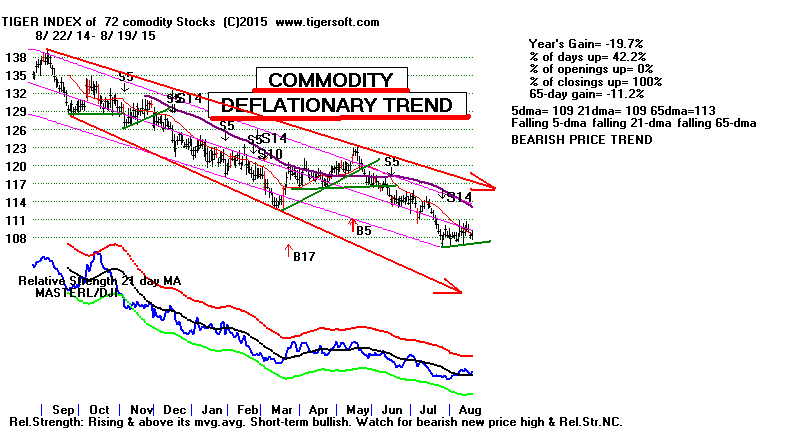
The signs of Deflation significantly worsened today as Crude Oil and
the Chinese YINN broke below key support. Somehow, the Fed and
Janet Yellen have been maintaining the declines in Oil and Commodities
are "transitory". Will the action today change their opinions or on Open
Market Committee votes? It fact, it may be too late for them to make
much of a difference.
The Fed could come out in light of the Chinese and World Market's drop
top to new lows along with Oil and Commodities and say that they are rethinking
|
their plan to raise rates in September. So far, they have not. This
is is downright
scary. I suspect Professionals may soon have no choice but to start
using
leveraged short ETFs en masse on the major market indexes. No one knows
how fast this could cause the DJI to decline.
, The NYSE A/D Line
is still in a falling trend and the 65-dma is now accelerating
downward. With the DJI only down 5% from its highs and the bearish month
of September only weeks away, the risks seem much greater than
rewards for even the blue-chips. A 10% decline from the DJI's
peak would take out the 17000 support. The next support below
that is at 16000.
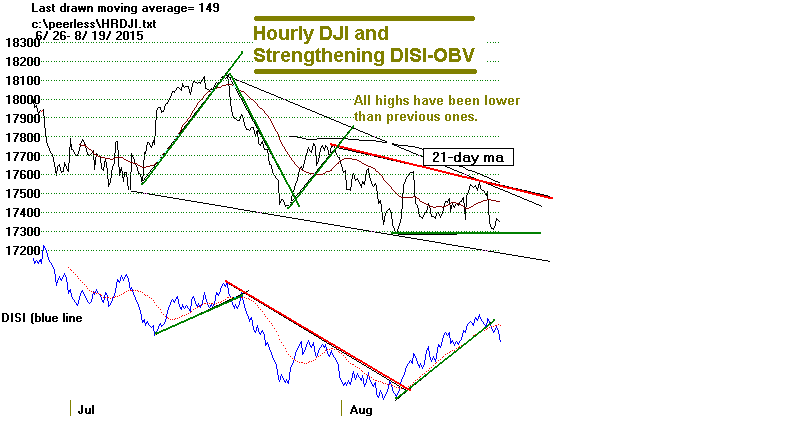
There is still some hope that the FED will change their collective
minds. The Hourly OBV-DISI Line is showing some strength.
But this comes after three months of severe bearish divergences
by it from the DJI. Another minor rally to the DJI's falling 21-day
(147-hour) ma.
is certainly a possibility. But the up-day Volume in the broader SP-500
|
remains too low to be expected to eat up much of its overhead resistance.
With the World's markets breaking down, look for more and more
lower openings. At some point, Professionals may no longer try to
support the market and instead seek to take advantage of how
steep the downtrend in a Deflationary spiral could become using
all the wonderful new derivatives and leveraged ETFs they have
created for this occasion.
The weak openings are being brought on by the troubles in the Chinese,
the Overseas and the Oil markets. YINN and OIL broke below key support
levels today.
The FED's Bubble World
Janet Yellen says when the FED is measuring "inflation" that she prefers not to
consider Oil Prices or Food Commodities. Their trends are too "transitory"
and seasonal. This may explain why she does not see Deflation now
as a problem and why apparently she will go along with a rise in interest rates
in September. She needs to look at the charts we see here .
If, in fact, the FED does stay on course and raise rates in September, and
that's the
what seems most likely, it will be making the same mistakes they made in
1929 and 1937, when they chose to try to cool off excessive stock speculation
rather than worry about Deflation or how much Unemployment that would be
caused by raising rates when the World Economy or US GNP was already
weakening.
At best, this is a "defensive market". But even dividend-paying
stocks
and blue-chips could be in trouble now. The upside potential looks very limited
with most stocks.
So, Sell when a stock breaks key support.
Watch the Closing Power
up-trends in your long positions.
If Professionals do
start selling the stocks that are still holding up, it will quickly
become too dangerous to hold them. Long bull markets are like a game of
"musical chairs". All the last men standing will be "bag holders",
as old Joe
Granville used to say. Use the
5-day ma trends with leveraged ETFs. Meanwhile,
most of our shorts in bearish MINCP stocks keep declining, as do OIL,
GAS, YINN,
along with most Commodities and many Emerging Countries'
stocks.
The DJI has only fallen 5% from its peak so far. A 10% decline, at a
minimum,
should probably be expected. It could be much worse. So, it's not too late
to Sell Short MINCP
stocks. Let me also recommend shorting the stocks that
qualify using the QuickSilver approach applied either to all stocks or to TEFS,
leveraged and un-leveraged.
Finding Short-Term Trades
among The Weakest Plungers
Using Tiger's "FASTDOWN" Group
and the new Tiger QuickSilver Program
QuickSilver lets you quickly find the stocks in fast-falling
5-day down-trends. When the 5-day ma is
rising at an annualized
rate of
less than -250%, the Downtrend
is most likely to continue.
The odds in favor of a
downtrend-resumption from the falling
5-day ma
are greatest when Both the Opening and Closing Power
are
FALLING and the current Accumulation
Index is below -.20.
Look also at the charts
where these conditions are true to see how
close the stock
is to price support, resistance, or a breakdown.
What's also nice about QuickSilver is that it also gives the
pivot-points below which a closing the next day will turn down
the 5-dma. Below are the top stocks examined this way.
Of course, the trick here is not to chase them too far above
their 5-day ma and to try to buy them on successful tests of the
5-day ma. To narrow the search down further, very high IP21s
and AI/200 scores should usually be favored. Also try to
pick stocks whose prices rise on rising, not falling, volume. And,
of course, look at their charts. These will also show you
the stocks' names. Some industry groups will be
over-represented here; these should be favored.
QuickSilver's most bearish picks are posted here:
C:\FASTDOWN - 08/19/15
                       Above $10.
                       BOTH FALLING
                       IP21<-.20
                       Bearish Daily Volume.
                       AI/200 under 70.

5-DMA ROC     Symbol        Last          5-dma         Pivot         Change
..............................................................................................
IP21          AI/200        OP-PWR        CP-PWR        PCT-Up        Daily Vol. notes
==============================================================================================
C:\fastdown - 08/19/15
5DAROC Symbol Last 5-dma Pivot Change ..........................................................................................
IP21 AI/200 OP-PWR CP-PWR PCT-Up Daily Vol. notes
==========================================================================================
-722.3 MTR 10.35 11.5 12.17 -.87
-.41 15 Falling Falling .422 bearish
---------------------------------------------------------------------------------------------
-731.5 BPT 42.38 45.85 48.5 -2.39
-.42 42 Falling Falling .446 bearish
---------------------------------------------------------------------------------------------
-753.9 UCO 20.23 21.81 22.56 -1.89
-.27 64 Falling Falling .422 bearish
---------------------------------------------------------------------------------------------
-817.6 RMTI 11.69 12.13 11.54 -.43
-.21 69 Falling Falling .482 bearish
---------------------------------------------------------------------------------------------
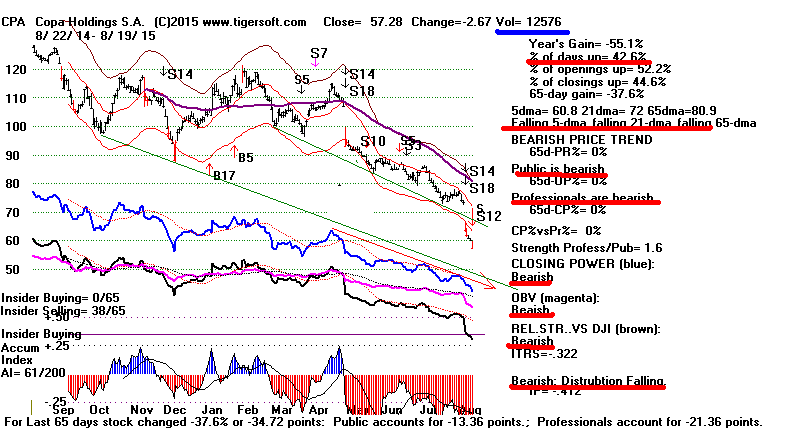
-1247.2 CPA 57.28 60.76 63.61 -2.67
-.41 61 Falling Falling .426 bearish
---------------------------------------------------------------------------------------------
|
Bearish Seasonality
Though the third year in the 4-year Presidential Cycle is normally quite
bullish, the median decline at some point from the DJI's peak to a
September or October bottom is 10% since 1945. So far,
the DJI has only fallen 4% from its July peak.
DJI's Declines in 3rd-4th Quarters of
Third Year of Pres. Election
            1947  7/24//1947 6% decline to 7/1947
            1951  9/13/1951 7% decline to 11/8/1951
            1955  9/23/1955 10% decline to 10/10/1955
            1959  8/3/1959 9% decline  to 9/29/1959
            1963  10/23/1963 10% decline to 11/22/1963

            1967  9/25/1967 10% decline to 11/14/1967
            1971  9/7/1971 13.5% decline to 11/23/1971
            1975  9/8/1975 7% decline to 10/1/1975
            1979  10/5/1979 11.5% decline to 11/7/1979
            1983  7/26/1983 6% decline to 8/5/1983

            1987  8/25/1987 36.5% decline to 10/19/1987
            1991  8/7/1991 5% decline to 10/7/1991
            1995  no declines
            1999  8/25/1999 11% decline to 10/18/1999

            2003  9/18/2003 4% decline to 9/28/2003
            2007  7/19/2007 10% decline to 8/16/2007
                  10/19/2007 10% decline to 11/26/2007
            2011  7/21/2011 16% decline to 10/3/2011
            2015  7/16/2015 4% decline so far...

                          median decline = 10%
------------------------
Announcements
--------------------------------
E-Books
1
The On-Line Explosive Stocks
2
The On-Line Killer Short
Sales book
Purchase each all new book by CC for
$42.50 or send a check for $37.50 to me.
I call your
attention now to the many new concepts and
the considerable new research in them:
For example:
1) A very good New Tiger Buy B12 for Low
Priced Stocks
2) After Red high volume reversal days use CP
uptrend-breaks.
3) Buy the stocks the Federal Govt wants you
to buy.
4) 100-Day Power Rankings...
5) Using Closing Power Hooks after Buy B26s
and B20s.
6) How A Stock Reacts to Its Earnings Report
Is Very important.
7) TigerSoft Major Buy Signals' Combinations
Which are most Powerful? Reliable?
8) Augmented Buy B20s' Independent Success
Rate.
9) What factors warn a rising 65-dma will not
hold?
10) The classic cluster of technical
characteristics that commonly appear
in the 23 stocks falling 70% or more in
the deep pullback of 2011.
----------------------------------------------------------------------------------------------------------------------------------------------------------------------------
PEERLESS STOCK MARKET TIMING:
A Guide To
Profitably Using The Tiger Nightly HOTLINE
New Peerless Signals and DJI Charts - version 7/4/2013
1965
1965-6 1966
1966-7 1967
1967-8 1968
1968-9 1969
1969-70
1970
1970-1
1971
1971-2 1972
1972-3
1973 1973-4
1974
1974-5 1975
1975-6
1976 1976-7
1977
1977-1978
1978
1978-79
1979 1979-80
1980 1980-1
1981 1981-2
1982 1982-1983
1983 1983-1984
1984
1984-1985
1985
1985-1986
1986 1986-1987
1987 1987-8
1988
1988-9 1989
1989-90
1990
1990-1 1991
1991-2 1992
1992-3 1993
1993-4 1994
1994-5 1995
1995-1996
1996
1996-7 1997
1997-8 1998
1998-1999 1999
1999-2000 2000
2000-1
2001 2001-2
2002
2002-3 2003
2003-4 2004
2004-5
2005 2005-6
2006 2006-7
2007 2007-8
2008 2008-9
2009
2009-10
2010 2010-11
2011 2011-12
2012
2012-2013
2013 2013-4 2014
Introduction to Tiger/Peerless Buys and Sells.
Different Types
of TigerSoft/Peerless CHARTS, Signals and Indicators
How reliable support is the DJI's rising 200-day ma?
-------------------------------------------------------------------------------------------------------------------
TIGERSOFT SIGNALS AND INDICATORS:
Documentation for TigerSoft
Automatic and Optimized Signals.
SPY Charts since 1994: Advisory Closing Power S7s, Accum. Index, 65-dma,
Optimized Signals.
"The
Jig Is Up": Calling September and October Tops.
A Keynesian's Warning Signs.
NUGT since 2012: A study of Tiger Technicals
Tiger Day
Traders Tool and most active Triple Leveraged ETFs
Advisory Pink Closing Power S7s at ETF at top since 1994
1994
1996
1997
1998
1999
2000 QQQ
SPY
DIA
2002
2007
2008
SPY 2011
2013-2014
Tiger Buy and Sell
Signals: New 2014 Research:
These are randomly chosen
groups.
but clearly we need to back-test them in more years.
You can replicate or do similar studies yourself
for other signals and/or other years.
9/1/2014 -
2014 Tiger
B19s - Steady rallying and no pullbacks below the 21-day ma.
9/2/2014 -
2014 Tiger
B17s on 14As taken alphabetically
9/3/2014 -
2014 Tiger B17s on 60
Biotechs taken alphabetically
9/4/2014 -
2014 Tiger
B18s on all "R" stocks taken alphabetically
* 9/8/2014 -
2014 Tiger
B20s - Conclusion: Use Closing Power trendbreaks in aftermath.
9/8/2014 -
2014 Tiger
B16s - Conclusion: Use mostly when
LA/MA under 1.05.
9/11/2014 -
2014 Tiger
B15s - Conclusion: Certain conditions
improved the results dramatically.
9/12/2014 -
2014 Tiger
B25s - Conclusion: 87.5% success rate
when other internals are positive.
9/15/2014 -
2014 Tiger B25s -
Best conditions for using B25s with somewhat
higher RSX capitalization stocks.
9/16/2014 -
New Tiger
Closing Power Take-Off Buy Signal in 2014: 14s, QQQ, DJI-30 and ETFs
9/17/2014 -
New Tiger
Closing Power Take-Off Buy Signal: 2009A-s
9/18/2014 -
New Tiger
Closing Power Take-Off Buy Signal: 2010A-s
9/21/2014 -
New Tiger
Augmented Sell S8s: DJI-30 - 2014
Requiring S8s to show
Negative CP%-Pr and IP21<+.15 produced a 70% success rate
in a rising market for
DJI-30 stocks and big ETFs.
9/24/2014 -
Tiger Sell
S14s: They make price breakdowns very bearish.
1/15/2015
-
Tiger Day
Traders' Tool Explained.
http://www.tigersoft.com/day-traders/index.html
http://www.tigersoft.com/Indicators/index.htm
http://www.tigersoftware.com/TigerBlogs/Aug-31-2009/index.html
NEW
2/16/2015
1) New -
Tiger Charts showing UP%, Opening-Up%, Closing-Up%
Note differences between bullish
and bearish stocks...
2) New -
UP%,
Opening-Up%, Closing-Up% Rankings of any directory.
3) New -
Display of what happens to a stock after various size openings up or down.
4) New -
6-month charts to better
show volume changes and 5-day ma with bands.
More profitable trading schemes coming...
Targeted Trading Opportunities:The Profits Quickly Add Up,
3/29/2015
Tiger CandleSticks:
IBB: 2001-2015
and
Recent Others.
====================================================================================
Earlier Hotlines
2-7-2014 to 3/19/2014
11-22-2014 to 2-6-2014
http://tigersoftware.com/555HL555/index.htm
10/9/2014 - 11/21/2014
http://tigersoftware.com/9933Hot/
9/2/2014 - 10/8/2014-
http://tigersoftware.com/2233HL/index.html
6/25/2013-9/1/2014
http://tigersoftware.com/112211-H/index.htm
11/22/2013-3/20/2014
http://tigersoft.com/1111-HL/index.html
10/22/2013-11/21/2013
Past
Hotline Predictions
http://tigersoft.com/-HL42013/index.html
http://www.tigersoft.com/-2GBL13HL/index.htm
==============================================================================================================================