TigerSoft and Peerless Daily
Hotline
www.tigersoft.com/HL888
(C) 1985-2015 William Schmidt,
Ph.D. www.tigersoft.com
All rights
strictly reserved.
Tiger Software
858-273-5900 PO Box 22784 San Diego, CA 92192 Email
william_schmidt@hotmail.com
------------------------------------------------------------------------------------------------------------------
Announcements
-
Tiger/Peerless UPDATE. A new TigerSoft/Peerless update
has been released today.
The new Tiger's update has the new Sell S12. It has the
new QuickSilver table which is produced for any directory's stocks.
It should work well with the stocks in FASTUP, FASTDOWN, LEVERAGE, HIGHIP21,
MAXCP, MINCP, REDSELL and NEAR65. With this QuickSilver
table displayed, you point the mouse at the symbol and click Graph.
The Peercomm will also allow you to get stock data again from Dial Data.

8/17/2015
200+ TigerSoft Charts -
Go to
www.tigersoftware.com/HH/index.html
8/17/2015
New Highs: NASD 56
NYSE 73
New Lows: NASD 43
NYSE 67
8/17/2015 Bullish MAXCP Stocks
133 ---->www.tigersoftware.com/MAXMIN/maxmin/8-17/Rbullish.htm
Bearish MINCP Stocks
60-->
http://www.tigersoftware.com/MAXMIN/maxmin/8-17/Rbearish.html
------------------------------------------------------------------------------------------------------------------
8/17/2015 Peerless
remains on Red Sell 12*s. The NYSE A/D Line
is still falling. The Hourly OBV-DISI Line is still in a short-term
uptrend. But watch for a break in the Hourly uptrends. I suspect the
upside now is quite limited. The DJI's hypothetical high hit the 17600
resistance.
This level is where it
suddenly reversed at the
beginning of last week. That will likely be too much resistance
for the DJI on this advance.
SPY is somewhat stronger. But its Daily OBV is lagging by a wide
margin. So, I doubt if it will be able to past its 65-day.
This is a market in which 75% of all stocks are below their 65-dma.
Twice as many groups have a majority of their stocks below their
65-day mvg.avgs, as have a majority above their 65-dma.
Overseas markets are getting weaker almost every day. This is a
prime reason for the continuing decline in oil prices. It has caused China
to devalue its currency. Their politicians are more concerned
about exporting industries' JOBS than keeping their currency strong.
The strong Dollar and weakening overseas economies do make
bankers and wealthy investors happy here. The leading US stocks
have become very appealing to Hot Money from overseas.
Their buying is mostly in stocks and bonds that benefit from the strong Dollar
|
and pay safe dividends. This helps explain the defensiveness of the market
now. The strongest groups now, REITs, Bonds and Utilities, of
course,
all pay dividends. Assured earnings rather than possible future
growth is favored. Thus, among the top performing groups now
are Beverage and Insurance companies.
So, this is a very selective and a defensive market. Risk-avoidance
is necessary. We can still buy stocks for short-term trades
using the Tiger Bullish MAXCPs, the highest ranked HIGH-UP%
and HIGH-IP21 Groups. Tonight, I also show how to use the
QuickSilver methodology against the FASTUP stocks. Meanwhile,
most of our shorts in bearish MINCP stocks keep declining, as do OIL,
GAS, YINN, most Commodities and many Emerging Countries'
stocks. The US markets will be hard-pressed to keep rising with
so much weakness overseas especially if the Fed yields to the
pressure of those who would like a little Deflation here.
See below the ranking of the Industry Groups we follow
showing the percent of each group's stocks above their 65-dma.
Group
Percent of Stocks
above their 65-dma
-------------------------------------------------------------------
Insurance
75%
Home-Building 72.5%
REITs
67.5%
Beverage
64.7%
Gaming
62.5%
Bonds
62.2%
Big Banks
57.1%
Military
57.1%
Software
54.4%
SP-500
53.7%
Russell-1000 52.3%
Nasdaq-100
51.0%
Auto
49.2%
DJI-30
42.6%
Computer
42.4%
Anti-Hackers
40.7%
Retail
40.7%
Finance
40.0%
Biotechs
36.2%
Transportation 34.5%
Chemicals
32.1%
Green
26.3%
Education
22.2%
Industrial Mater. 21.2%
China
20.0%
Electronics
18.4%
Semi-Conductors 16.5%
Commodities
16.0%
Solar
15.0%
Gold/Silver
14.5%
Foreign ETFs 11.8%
Oil/Gas
9.7%
Food
6.7%
Coal
0.0%
Finding Short-Term Trades
among The Strongest Swingers
Using Tiger's "FASTUP" Group
and the new Tiger QuickSilver Program
QuickSilver lets you quickly find the stocks in fast-rising
5-day uptrends (or down-trends). When the 5-day ma is
rising at an annualized rate of more than 250%, the uptrend
is most likely to continue. The odds in favor of a rebound
up off the 5-day ma are greatest when Both the Opening
and Closing Power are rising and the current Accumulation
Index is over +.20 (or even higher). Look also at the charts
where these conditions are true to see how close the stock
is to price support, resistance, a breakout or a breakdown.
What's also nice about QuickSilver is that it also gives the
pivot-points below which a closing the next day will turn down
the 5-dma. Below are the top stocks examined this way.
Of course, the trick here is not to chase them too far above
their 5-day ma and to try to buy them on successful tests of the
5-day ma. To narrow the search down further, very high IP21s
and AI/200 scores should usually be favored. Also try to
pick stocks whose prices rise on rising, not falling, volume. And,
of course, look at their charts. These will also show you
the stocks' names. Some industry groups will be
over-represented here; these should be favored.
C:\FASTUP - 08/17/15

5-DMA ROC     Symbol        Last          5-dma         Pivot         Change
..............................................................................................
IP21          AI/200        OP-PWR        CP-PWR        PCT-Up        Daily Vol. notes
==============================================================================================
1815.1        MRVC          17.07         14.83         12.75         .25
.26           111           Rising        Rising        .442          vol.fell on up-day
---------------------------------------------------------------------------------------------
1600.5        CLIR          5.38          4.99          4.12          .08
.26           121           Rising        Rising        .438          bullish
---------------------------------------------------------------------------------------------
1210.4        EZCH          21.71         19.66         16.87         1.05
.3            118           Rising        Rising        .494          bullish
---------------------------------------------------------------------------------------------
1055.2        NTLS          9.15          9.09          8.99          -.08
.24           91            Rising        Rising        .514          vol.fell on up-day
---------------------------------------------------------------------------------------------
960.5         DWTI          173.87        164.48        154.67        2.98
.32           105           Rising        Rising        .574          bullish
------------------------------------------------------------------------------------------------
945.7         ICUI          123.09        120.82        119.5         1.28
.28           110           Rising        Rising        .518          bullish
---------------------------------------------------------------------------------------------
807.1         PTNR          4.99          4.48          4.28          .53
.34           60            Rising        Rising        .418          bullish
---------------------------------------------------------------------------------------------
787.4         GSI           .83           .79           .8            .08
.27           130           Rising        Rising        .386          bullish
---------------------------------------------------------------------------------------------
731           TREE          138.08        130.65        125.09        4.37
.28           179           Rising        Rising        .574          vol.fell on up-day
---------------------------------------------------------------------------------------------
707.9         RNF           15.3          14.89         14.27         .18
.47           114           Rising        Rising        .442          vol.fell on up-day
---------------------------------------------------------------------------------------------
547.3         DTO           113.89        110.44        106.74        1.24
.26           138           Rising        Rising        .578          bullish
---------------------------------------------------------------------------------------------
537.3         FLO           24.44         23.19         22.02         .42
.31           116           Rising        Rising        .53           vol.fell on up-day
---------------------------------------------------------------------------------------------
502.7         DEST          12.36         11.77         11.4          .46
.32           102           Rising        Rising        .466          bullish
|
Bearish Seasonality
Though the third year in the 4-year Presidential Cycle is normally quite
bullish, the median decline at some point from the DJI's peak to a
September or October bottom is 10% since 1945. So far,
the DJI has only fallen 4% from its July peak.
DJI's Declines in 3rd-4th Quarters of
Third Year of Pres. Election
            1947  7/24//1947 6% decline to 7/1947
            1951  9/13/1951 7% decline to 11/8/1951
            1955  9/23/1955 10% decline to 10/10/1955
            1959  8/3/1959 9% decline  to 9/29/1959
            1963  10/23/1963 10% decline to 11/22/1963

            1967  9/25/1967 10% decline to 11/14/1967
            1971  9/7/1971 13.5% decline to 11/23/1971
            1975  9/8/1975 7% decline to 10/1/1975
            1979  10/5/1979 11.5% decline to 11/7/1979
            1983  7/26/1983 6% decline to 8/5/1983

            1987  8/25/1987 36.5% decline to 10/19/1987
            1991  8/7/1991 5% decline to 10/7/1991
            1995  no declines
            1999  8/25/1999 11% decline to 10/18/1999

            2003  9/18/2003 4% decline to 9/28/2003
            2007  7/19/2007 10% decline to 8/16/2007
                  10/19/2007 10% decline to 11/26/2007
            2011  7/21/2011 16% decline to 10/3/2011
            2015  7/16/2015 4% decline so far...

                          median decline = 10%
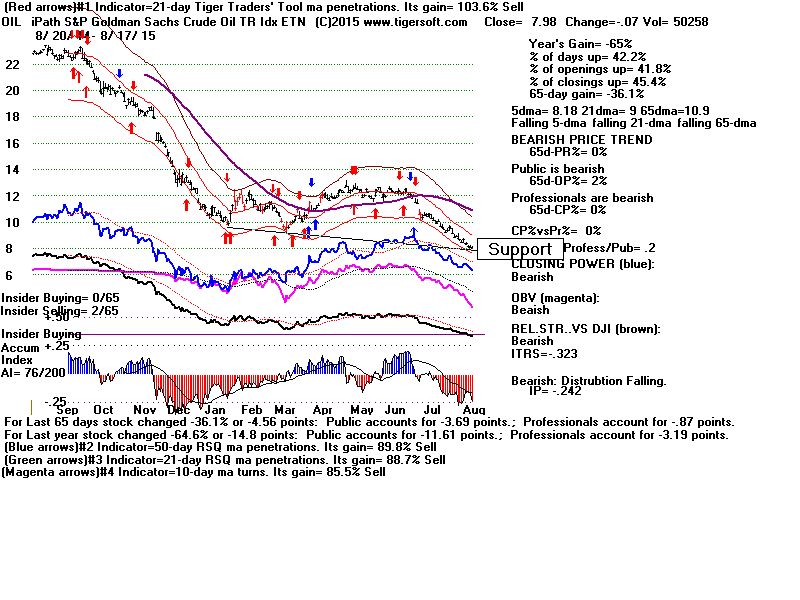
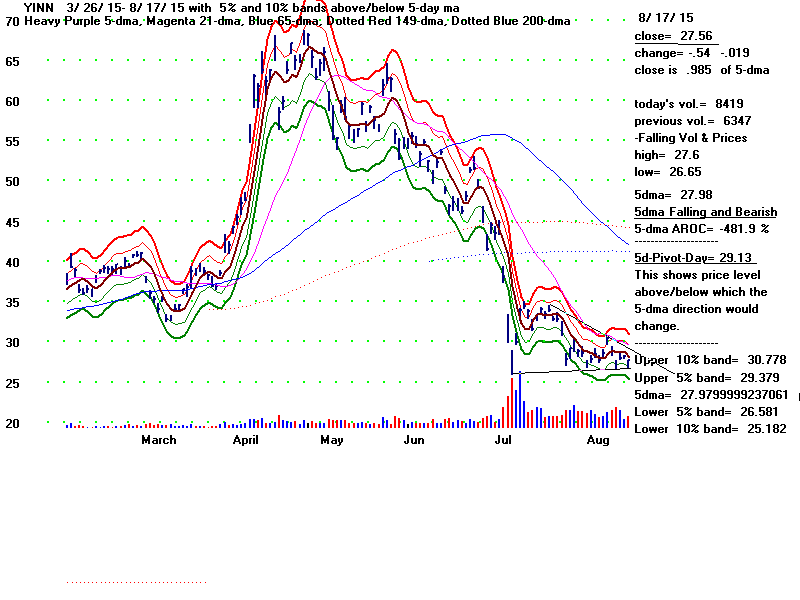
Watch to see if new lows are made by OIL, YINN and
the Tiger Index of Foreign ETFs. This will be quite bearish.
Crude Oil
 |
YINN
 |
Foreign (Non-US) ETFs
|
QUICKSILVER RANKING
OF MAJOR ETFS
BY 5-day MA AROC (at extremes) There are 8 DJI-30 Stocks with the bearish BOTH-DOWN condition.
Only 1 (HD) has the bullish BOTH-UP condition.
C:\dji-30 - 08/17/15
5DAROC Symbol Last 5-dma Pivot Change ..............................................................................................
IP21 AI/200 OP-PWR CP-PWR PCT-Up Daily Vol. notes
==============================================================================================
628.3         NUGT          4.26          4.16          3.96          .42
-.04          49            Rising        ?             .458          bullish
            (Fast moving NUGT has turned back up at rising 5-day ma).
---------------------------------------------------------------------------------------------
88.7          HD            119.7         118.77        117.69        -.05
.18           97            Rising        Rising        .538          bearish
---------------------------------------------------------------------------------------------
35.4          TNA           82.81         80.42         80.15         2.39
.05           144           Falling       ?             .534          bullish
---------------------------------------------------------------------------------------------
16.4          MDY           275.89        272.91        272.26        2.6
.16           139           Falling       Rising        .51           bullish
---------------------------------------------------------------------------------------------
14.1          IWM           121.6         120.35        120.22        1.24
.03           143           Falling       ?             .534          bullish
---------------------------------------------------------------------------------------------
2.7           IBB           371.62        367.88        367.17        7.56
-.05          138           Falling       Falling       .554          vol.fell on up-day
 (5 day ma has turned flats with BOTHDOWN Opening and Closing Power.)
---------------------------------------------------------------------------------------------
1.2           XOM           78.77         78.41         77.49         .41
-.1           75            Falling       Falling      .426          bullish
---------------------------------------------------------------------------------------------
-.3           SPY           210.56        209.25        208.67        1.14
.15           120           Falling       Rising        .506          bullish
---------------------------------------------------------------------------------------------
-6.4          QQQ           111.43        110.59        110.14        .92
.04           108           Falling       ?             .546          bullish
---------------------------------------------------------------------------------------------
-11.2         DD            54.27         53.57         53.39         .41
-.04          100           Falling       Falling      .478          vol.fell on up-day
---------------------------------------------------------------------------------------------
-13.6         OEX           924.98        919.94        917.65        4.23
0             115           Rising        Falling       .498          bullish
---------------------------------------------------------------------------------------------
-14.6         DIA           175.68        174.64        174.11        .78
.12           122           Falling       ?             .534          bullish
---------------------------------------------------------------------------------------------
-14.2         IBM           156.31        155.76        155.51        .56
-.08          88            Falling       Falling     .486          vol.fell on up-day
---------------------------------------------------------------------------------------------
-50.7         TECL          37.21         36.43         35.91         .64
.02           120           Falling       Rising        .55           bullish
---------------------------------------------------------------------------------------------
-55.9         PG            75.53         75.91         76.22         -.09
-.16          98            Falling       Falling      .47           bearish
---------------------------------------------------------------------------------------------
-84.1         GS            202.57        201.63        201.7         .55
0             129           Falling       Falling      .53           vol.fell on up-day
---------------------------------------------------------------------------------------------
-90.2         DIS           109.05        107.74        108           1.89
.11           114           Falling       Falling       .566          bullish
---------------------------------------------------------------------------------------------
-180.5        KOL           9.3           9.35          9.43          -.04
0             67            Falling       Falling       .402          vol.fell on down-day
---------------------------------------------------------------------------------------------
-196.4        OIH           30.95         31.58         31.93         -.17
.01           83            Falling       Rising        .422          bearish
---------------------------------------------------------------------------------------------
-373.2        SOXL          25.44         25.34         25.5          .75
.11           150           Falling       ?             .538          vol.fell on up-day
---------------------------------------------------------------------------------------------
-403          GASL          7.22          7.57          7.43          -.21
-.19          53            Falling       Falling      .402          vol.fell on down-day
---------------------------------------------------------------------------------------------
-414.6        OIL           7.98          8.18          8.4           -.07
-.24          76            Falling       Falling       .422          bearish
---------------------------------------------------------------------------------------------
-1118.8       DUST          23.72         25.27         27.83         -2.98
.13           147           Falling       ?             .522          vol.fell on down-day
---------------------------------------------------------------------------------------------           .55           vol.fell on up-day
|
------------------------
Announcements
--------------------------------
E-Books
1
The On-Line Explosive Stocks
2
The On-Line Killer Short
Sales book
Purchase each all new book by CC for
$42.50 or send a check for $37.50 to me.
I call your
attention now to the many new concepts and
the considerable new research in them:
For example:
1) A very good New Tiger Buy B12 for Low
Priced Stocks
2) After Red high volume reversal days use CP
uptrend-breaks.
3) Buy the stocks the Federal Govt wants you
to buy.
4) 100-Day Power Rankings...
5) Using Closing Power Hooks after Buy B26s
and B20s.
6) How A Stock Reacts to Its Earnings Report
Is Very important.
7) TigerSoft Major Buy Signals' Combinations
Which are most Powerful? Reliable?
8) Augmented Buy B20s' Independent Success
Rate.
9) What factors warn a rising 65-dma will not
hold?
10) The classic cluster of technical
characteristics that commonly appear
in the 23 stocks falling 70% or more in
the deep pullback of 2011.
----------------------------------------------------------------------------------------------------------------------------------------------------------------------------
PEERLESS STOCK MARKET TIMING:
A Guide To
Profitably Using The Tiger Nightly HOTLINE
New Peerless Signals and DJI Charts - version 7/4/2013
1965
1965-6 1966
1966-7 1967
1967-8 1968
1968-9 1969
1969-70
1970
1970-1
1971
1971-2 1972
1972-3
1973 1973-4
1974
1974-5 1975
1975-6
1976 1976-7
1977
1977-1978
1978
1978-79
1979 1979-80
1980 1980-1
1981 1981-2
1982 1982-1983
1983 1983-1984
1984
1984-1985
1985
1985-1986
1986 1986-1987
1987 1987-8
1988
1988-9 1989
1989-90
1990
1990-1 1991
1991-2 1992
1992-3 1993
1993-4 1994
1994-5 1995
1995-1996
1996
1996-7 1997
1997-8 1998
1998-1999 1999
1999-2000 2000
2000-1
2001 2001-2
2002
2002-3 2003
2003-4 2004
2004-5
2005 2005-6
2006 2006-7
2007 2007-8
2008 2008-9
2009
2009-10
2010 2010-11
2011 2011-12
2012
2012-2013
2013 2013-4 2014
Introduction to Tiger/Peerless Buys and Sells.
Different Types
of TigerSoft/Peerless CHARTS, Signals and Indicators
How reliable support is the DJI's rising 200-day ma?
-------------------------------------------------------------------------------------------------------------------
TIGERSOFT SIGNALS AND INDICATORS:
Documentation for TigerSoft
Automatic and Optimized Signals.
SPY Charts since 1994: Advisory Closing Power S7s, Accum. Index, 65-dma,
Optimized Signals.
"The
Jig Is Up": Calling September and October Tops.
A Keynesian's Warning Signs.
NUGT since 2012: A study of Tiger Technicals
Tiger Day
Traders Tool and most active Triple Leveraged ETFs
Advisory Pink Closing Power S7s at ETF at top since 1994
1994
1996
1997
1998
1999
2000 QQQ
SPY
DIA
2002
2007
2008
SPY 2011
2013-2014
Tiger Buy and Sell
Signals: New 2014 Research:
These are randomly chosen
groups.
but clearly we need to back-test them in more years.
You can replicate or do similar studies yourself
for other signals and/or other years.
9/1/2014 -
2014 Tiger
B19s - Steady rallying and no pullbacks below the 21-day ma.
9/2/2014 -
2014 Tiger
B17s on 14As taken alphabetically
9/3/2014 -
2014 Tiger B17s on 60
Biotechs taken alphabetically
9/4/2014 -
2014 Tiger
B18s on all "R" stocks taken alphabetically
* 9/8/2014 -
2014 Tiger
B20s - Conclusion: Use Closing Power trendbreaks in aftermath.
9/8/2014 -
2014 Tiger
B16s - Conclusion: Use mostly when
LA/MA under 1.05.
9/11/2014 -
2014 Tiger
B15s - Conclusion: Certain conditions
improved the results dramatically.
9/12/2014 -
2014 Tiger
B25s - Conclusion: 87.5% success rate
when other internals are positive.
9/15/2014 -
2014 Tiger B25s -
Best conditions for using B25s with somewhat
higher RSX capitalization stocks.
9/16/2014 -
New Tiger
Closing Power Take-Off Buy Signal in 2014: 14s, QQQ, DJI-30 and ETFs
9/17/2014 -
New Tiger
Closing Power Take-Off Buy Signal: 2009A-s
9/18/2014 -
New Tiger
Closing Power Take-Off Buy Signal: 2010A-s
9/21/2014 -
New Tiger
Augmented Sell S8s: DJI-30 - 2014
Requiring S8s to show
Negative CP%-Pr and IP21<+.15 produced a 70% success rate
in a rising market for
DJI-30 stocks and big ETFs.
9/24/2014 -
Tiger Sell
S14s: They make price breakdowns very bearish.
1/15/2015
-
Tiger Day
Traders' Tool Explained.
http://www.tigersoft.com/day-traders/index.html
http://www.tigersoft.com/Indicators/index.htm
http://www.tigersoftware.com/TigerBlogs/Aug-31-2009/index.html
NEW
2/16/2015
1) New -
Tiger Charts showing UP%, Opening-Up%, Closing-Up%
Note differences between bullish
and bearish stocks...
2) New -
UP%,
Opening-Up%, Closing-Up% Rankings of any directory.
3) New -
Display of what happens to a stock after various size openings up or down.
4) New -
6-month charts to better
show volume changes and 5-day ma with bands.
More profitable trading schemes coming...
Targeted Trading Opportunities:The Profits Quickly Add Up,
3/29/2015
Tiger CandleSticks:
IBB: 2001-2015
and
Recent Others.
====================================================================================
Earlier Hotlines
2-7-2014 to 3/19/2014
11-22-2014 to 2-6-2014
http://tigersoftware.com/555HL555/index.htm
10/9/2014 - 11/21/2014
http://tigersoftware.com/9933Hot/
9/2/2014 - 10/8/2014-
http://tigersoftware.com/2233HL/index.html
6/25/2013-9/1/2014
http://tigersoftware.com/112211-H/index.htm
11/22/2013-3/20/2014
http://tigersoft.com/1111-HL/index.html
10/22/2013-11/21/2013
Past
Hotline Predictions
http://tigersoft.com/-HL42013/index.html
http://www.tigersoft.com/-2GBL13HL/index.htm
==============================================================================================================================