TigerSoft and Peerless Daily
Hotline
www.tigersoft.com/HL888
(C) 1985-2015 William Schmidt,
Ph.D. www.tigersoft.com
All rights
strictly reserved.
Tiger Software
858-273-5900 PO Box 22784 San Diego, CA 92192 Email
william_schmidt@hotmail.com
------------------------------------------------------------------------------------------------------------------
Announcements
-
Tiger/Peerless UPDATE. A new TigerSoft/Peerless update
has been released today.
The new Tiger's update has the new Sell S12. It has the
new QuickSilver table which is produced for any directory's stocks.
It should work well with the stocks in LEVERAGE, HIGHIP21,
MAXCP, MINCP, REDSELL and NEAR65. With this QuickSilver
table displayed, you point the mouse at the symbol and click Graph.
The Peercomm will also allow you to get stock data again from Dial Data.
------------------------------------------------------------------------------------------------------------------
8/12/2015 Peerless
remains on Red Sell 12*s. Though the DJI's reversal
from 17000 looks impressive, it was not enough to give us a
Peerless Buy signal. The NYSE A/D Line is still falling.
Daily volume on up-days is not impressive. The World Markets
must be very weak; China has devalued its currency for a
third straight day.
So, even if SPY and the SP-500 advance here, its narrow trading range should
limit
any rally. Without a new Buy signal from Peerless and the bearish month
of September just ahead, the whole US market's upside is probably limited,
except
for special situations and oversold leveraged ETFs like NUGT
and GASL where short-covering is playing a big role.
Note that since 1965, the DJI has rallied only 36% of the time over
the week following August 12th.
It's remains too difficult to find attractive stocks to buy. Respect what
that is telling us about the market now. Meanwhile, our shorts of
bearish
MINCPs show little interest in advancing.
The big, splashy rallies in NUGT and GASL have been profitable
for us. But they probably owe mostly to short-covering. The world
markets (Oil, world ETFs and Chinese stocks) remain under
pressure despite the DJI turn-around.
The DJI rebounded from 17000, the lows of December and
January. But my reading of the DJI chart, the violation of
the 17500 now sets up a minimum target of 16700. Though
the Accum. Index is improving on the DJI chart, the IPA
(Cumulative Accum. Index is falling, as is the OBV-Line.
What To Do?
Our Bearish MINCP stocks continue to decline. Hold some of these
short. Sell long positions either when their prices are very over-extended
and break their Closing Power up-trends or when they close below their 65-dma
and their Accumulation Index is below 0. Hold long NUGT. It ought
to double. Gold should keep rising with all this talk of currency
wars
and if the FED announces it will not be raising rates in September. Use
the 5-day
ma pivot-point with the long or short ETFs to see when to close them out.
Short covering is playing a big role in the rallies of NUGT and GASL.
Crude Oil, Chinese Stocks and foreign ETFs were not able to turn around
like the DJI did today and rebound from its lows.
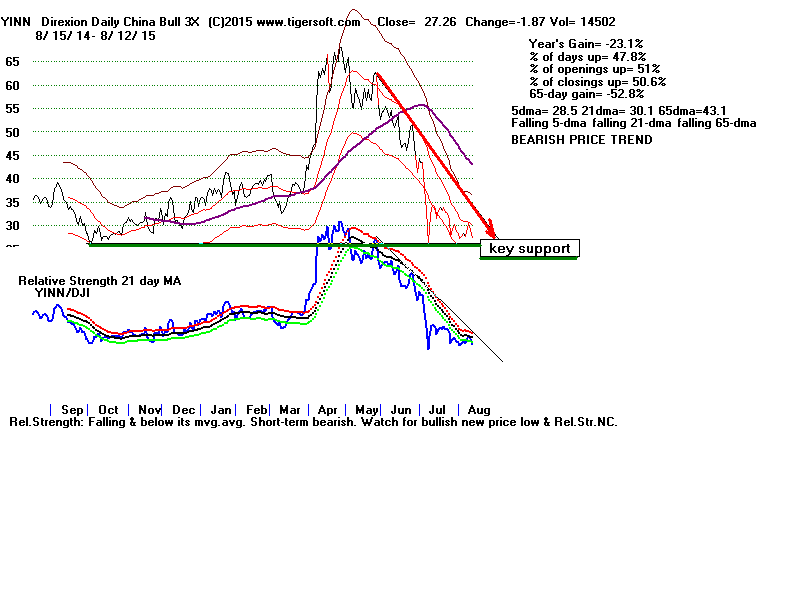
Watch Oil, YING (Chinese stocks' ETF)
and Tiger's Index of Foreign ETFs
New lows by all three of these will surely be a sign that the World Economy
is weakening dangerously. China is reported to again be devaluing its Yuan
for the third straight day.
China Seeks to Calm Markets as It Devalues Its Currency
for a 3rd Consecutive Day
It is clearly afraid of how bad the Global demand is becoming for Chinese
goods. In a deep world-wide recession, the big US multinationals (like
those in the DJI) will probably be the first to have their shares hit here.
US banks with foreign debts will also be threatened. And if the
world markets' decline worsens, foreigners will sell US stock/bond holdings to
remain liquid and solvent. US markets, as extended as they are, then will
not be able to escape an overseas' bear market.
Watch to see if new lows are made by OIL, YINN and
the Tiger Index of Foreign ETFs. This will be quite bearish.
Crude Oil
 |
YINN
 |
Foreign (Non-US) ETFs
 |
Just in Case... (From Monday Night).
Monday's "big jump reminds us that the Sell S12*s are new
Peerless creations. These Sells could prove problematic because
just as it was hard for the classic Peerless to produce a Sell in the
narrowing market of this past year, so, too, it is proving just as hard
to get a Buy signal, even though Friday's low was not confirmed
by all three of the key Peerless Indicators, P-I, V-I and IP21.
Accordingly, let's again watch the NYSE A/D Line downtrend shown below.
If the A/D Line downtrend is broken above, we can treat it as a judged Buy B6.
This was the number of the Buy signal that the original, 1981-1990, Peerless
urged users employ when a well-tested A/D Line trend was broken.
(It may not be broken, but I think we want to be prepared in case it does.
I suspect that the Closing Powers will turn up for DIA, SPY, QQQ etc
about the same time as the A/D Line trend is broken.)"
Extremely weak NUGT and GASL should keep rising
after a day or two's pullback because they are so vastly over-sold.
See the annualized rate of change of the 5-day ma. Tests of
very fast rising 5-day mvg. averages should be good buying
opportunities.
 |
 |
|
------------------------
Announcements
--------------------------------
E-Books
1
The On-Line Explosive Stocks
2
The On-Line Killer Short
Sales book
Purchase each all new book by CC for
$42.50 or send a check for $37.50 to me.
I call your
attention now to the many new concepts and
the considerable new research in them:
For example:
1) A very good New Tiger Buy B12 for Low
Priced Stocks
2) After Red high volume reversal days use CP
uptrend-breaks.
3) Buy the stocks the Federal Govt wants you
to buy.
4) 100-Day Power Rankings...
5) Using Closing Power Hooks after Buy B26s
and B20s.
6) How A Stock Reacts to Its Earnings Report
Is Very important.
7) TigerSoft Major Buy Signals' Combinations
Which are most Powerful? Reliable?
8) Augmented Buy B20s' Independent Success
Rate.
9) What factors warn a rising 65-dma will not
hold?
10) The classic cluster of technical
characteristics that commonly appear
in the 23 stocks falling 70% or more in
the deep pullback of 2011.
----------------------------------------------------------------------------------------------------------------------------------------------------------------------------
PEERLESS STOCK MARKET TIMING:
A Guide To
Profitably Using The Tiger Nightly HOTLINE
New Peerless Signals and DJI Charts - version 7/4/2013
1965
1965-6 1966
1966-7 1967
1967-8 1968
1968-9 1969
1969-70
1970
1970-1
1971
1971-2 1972
1972-3
1973 1973-4
1974
1974-5 1975
1975-6
1976 1976-7
1977
1977-1978
1978
1978-79
1979 1979-80
1980 1980-1
1981 1981-2
1982 1982-1983
1983 1983-1984
1984
1984-1985
1985
1985-1986
1986 1986-1987
1987 1987-8
1988
1988-9 1989
1989-90
1990
1990-1 1991
1991-2 1992
1992-3 1993
1993-4 1994
1994-5 1995
1995-1996
1996
1996-7 1997
1997-8 1998
1998-1999 1999
1999-2000 2000
2000-1
2001 2001-2
2002
2002-3 2003
2003-4 2004
2004-5
2005 2005-6
2006 2006-7
2007 2007-8
2008 2008-9
2009
2009-10
2010 2010-11
2011 2011-12
2012
2012-2013
2013 2013-4 2014
Introduction to Tiger/Peerless Buys and Sells.
Different Types
of TigerSoft/Peerless CHARTS, Signals and Indicators
How reliable support is the DJI's rising 200-day ma?
-------------------------------------------------------------------------------------------------------------------
TIGERSOFT SIGNALS AND INDICATORS:
Documentation for TigerSoft
Automatic and Optimized Signals.
SPY Charts since 1994: Advisory Closing Power S7s, Accum. Index, 65-dma,
Optimized Signals.
"The
Jig Is Up": Calling September and October Tops.
A Keynesian's Warning Signs.
NUGT since 2012: A study of Tiger Technicals
Tiger Day
Traders Tool and most active Triple Leveraged ETFs
Advisory Pink Closing Power S7s at ETF at top since 1994
1994
1996
1997
1998
1999
2000 QQQ
SPY
DIA
2002
2007
2008
SPY 2011
2013-2014
Tiger Buy and Sell
Signals: New 2014 Research:
These are randomly chosen
groups.
but clearly we need to back-test them in more years.
You can replicate or do similar studies yourself
for other signals and/or other years.
9/1/2014 -
2014 Tiger
B19s - Steady rallying and no pullbacks below the 21-day ma.
9/2/2014 -
2014 Tiger
B17s on 14As taken alphabetically
9/3/2014 -
2014 Tiger B17s on 60
Biotechs taken alphabetically
9/4/2014 -
2014 Tiger
B18s on all "R" stocks taken alphabetically
* 9/8/2014 -
2014 Tiger
B20s - Conclusion: Use Closing Power trendbreaks in aftermath.
9/8/2014 -
2014 Tiger
B16s - Conclusion: Use mostly when
LA/MA under 1.05.
9/11/2014 -
2014 Tiger
B15s - Conclusion: Certain conditions
improved the results dramatically.
9/12/2014 -
2014 Tiger
B25s - Conclusion: 87.5% success rate
when other internals are positive.
9/15/2014 -
2014 Tiger B25s -
Best conditions for using B25s with somewhat
higher RSX capitalization stocks.
9/16/2014 -
New Tiger
Closing Power Take-Off Buy Signal in 2014: 14s, QQQ, DJI-30 and ETFs
9/17/2014 -
New Tiger
Closing Power Take-Off Buy Signal: 2009A-s
9/18/2014 -
New Tiger
Closing Power Take-Off Buy Signal: 2010A-s
9/21/2014 -
New Tiger
Augmented Sell S8s: DJI-30 - 2014
Requiring S8s to show
Negative CP%-Pr and IP21<+.15 produced a 70% success rate
in a rising market for
DJI-30 stocks and big ETFs.
9/24/2014 -
Tiger Sell
S14s: They make price breakdowns very bearish.
1/15/2015
-
Tiger Day
Traders' Tool Explained.
http://www.tigersoft.com/day-traders/index.html
http://www.tigersoft.com/Indicators/index.htm
http://www.tigersoftware.com/TigerBlogs/Aug-31-2009/index.html
NEW
2/16/2015
1) New -
Tiger Charts showing UP%, Opening-Up%, Closing-Up%
Note differences between bullish
and bearish stocks...
2) New -
UP%,
Opening-Up%, Closing-Up% Rankings of any directory.
3) New -
Display of what happens to a stock after various size openings up or down.
4) New -
6-month charts to better
show volume changes and 5-day ma with bands.
More profitable trading schemes coming...
Targeted Trading Opportunities:The Profits Quickly Add Up,
3/29/2015
Tiger CandleSticks:
IBB: 2001-2015
and
Recent Others.
====================================================================================
Earlier Hotlines
2-7-2014 to 3/19/2014
11-22-2014 to 2-6-2014
http://tigersoftware.com/555HL555/index.htm
10/9/2014 - 11/21/2014
http://tigersoftware.com/9933Hot/
9/2/2014 - 10/8/2014-
http://tigersoftware.com/2233HL/index.html
6/25/2013-9/1/2014
http://tigersoftware.com/112211-H/index.htm
11/22/2013-3/20/2014
http://tigersoft.com/1111-HL/index.html
10/22/2013-11/21/2013
Past
Hotline Predictions
http://tigersoft.com/-HL42013/index.html
http://www.tigersoft.com/-2GBL13HL/index.htm
==============================================================================================================================
 8/12/2015 200+ TigerSoft Charts -