TigerSoft and Peerless Daily
Hotline
(C) 1985-2015 William Schmidt,
Ph.D. www.tigersoft.com
All rights
strictly reserved.
Tiger Software
858-273-5900 PO Box 22784 San Diego, CA 92192 Email
william_schmidt@hotmail.com
------------------------------------------------------------------------------------------------------------------
7/9/2014
Most Professionals are still fighting the Fed and the Chinese Government.
But be careful. The pattern of wildly higher openings could occur next
week, too, if Chinese stocks yo-yo back up or there is a bailout
agreement for Greece.
I would add to Bearish MINCP shorts on a rally to 17800 or on a close below
17500.
There are not enough Bullish MAXCP stocks to do much buying yet.
The operative Peerless S12 must stand for now, at least until the
A/D Line breaks its downtrend or we get a new Peerless Buy signal.
See below the falling Closing Power of DIA. Also see SPY, QQQ, IWM,
IBB, TECL, SOXL on
http://tigersoftware1.com/HH/ See also
how the Hourly DJI's DISI/OBV Line made a new low ahead of prices today
and how red and negatively down-trending is the Tiger Accumulation
Index on the DJI. These all warn that any DJI rally back to 17800 to try
to
close the gap down from there will face very still resistance and may be shorted
to probable advantage by nimble traders.
Another thing: watch AAPL carefully tomorrow and Monday. It has broken key
support and now must hold up at its rising 200-day ma. If it does not hold
up,
this will be a very bearish message to growth stock and blue-chip stock traders,
alike.
US stocks might then decline even if Chinese stocks rally. The DJI is only down
4.5%
from its highs. A bigger correction eould not come as a surprise.
.
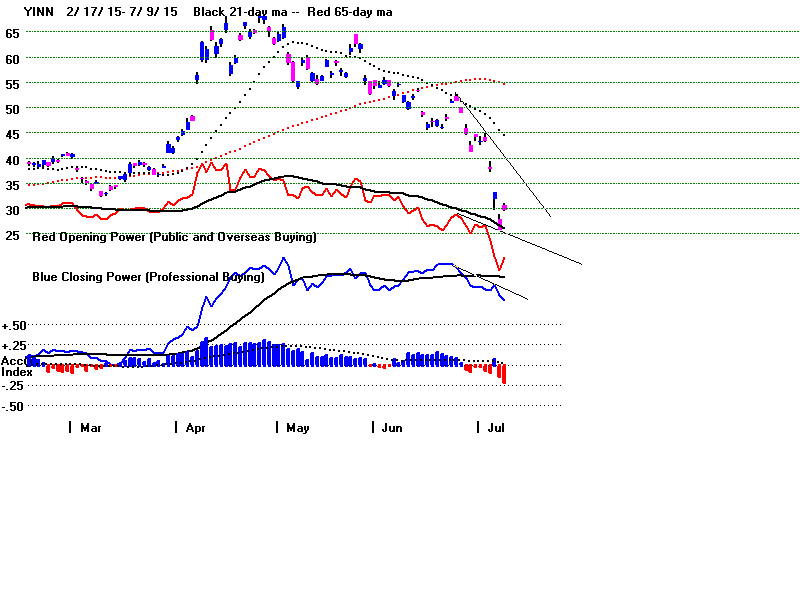
Opening Power (not shown in chart below)
keeps rising. It represents
overseas and Public net buying. Meanwhile, the blue Closing Power keeps
falling.
The US is considered a haven to foreigners from overseas financial
risks, US
Professionals are heavy net sellers into all rallies. Will they
change their mind?
They have not yet.
 |
 |
 |
The World's
Biggest Stock - AAPL -
has just broken down below important support
and had its 65-dma turn down, all following
steady net selling by Professionals.
 |
After the early rally tomorrow, yet another test of 17500 seems likely.
If the test of 17500 is successful, it will build new confidence into
the market. Then a more lasting reversal and a Summer Rally would become
more likely. Remember your physics and your Keynes. Speculative bull
markets
have lots of mass and momentum. They can defy gravity a lot longer
than most stubborn shorts can stay solvent.
Consider the super-bear in June1929. The internals of the DJI looked
absolutely dreadful,
much weaker than now, and yet prices rose 25% higher by September,
and that was with the economy's growth having peaked, the Fed voicing concern
about excessive speculation and even raising the Discount Rate from 5% to 6%
in August 1929.
So, be careful about fighting the short-term market trend (and all these higher
openings, as encouraged by the FED and the Chinese Government. If they
want
to support or even push up the market, they have ample power to do that. I
say this
having studied a lot of market history. This is a variation on the "Don't
fight the Fed" rule.
But "lookout!" when the Fed or the Chinese Government stop supporting the
market
or they do it too weakly to hold up prices.
I am comfortable holding short some of our Bearish MINCPs and holding
long some recent Bullish MAXCPs, as long as they do not break below their
65-dma by much with a negative IP21. This weekend I will work on a new
Flagging program to show all ETFs (and stocks) each night that are rising or
falling with
particularly steep 5-day moving averages and have pulled back to these averages,
where traders may want to play a resumption of trends when other
internals are either very strong or very weak. More on Sunday night about this.
Another idea, one that worked at the end of the speculative bull market in
1999-2000: aggressive traders may want to buy volatile stocks at the close
and sell them at the openings. More on this Sunday, too.
Last night I wrote: "we should not fight the Fed in this.
I would plan to
close out the DIA short if there is another DJI decline below 17600.
Another test of the lows may occur when this rally is over. The Chinese
debacle is not over. Deflation is real. And the DJI still shows
steady red
Distribution."
More and More Stocks Have
Over Head Resistance at Their 65-dma
Index/Sector Pct.of Stocks
above 65-dma.
today .... yesterday
-----------------------------------------------------------------------------------------------
DJI-30
16.7%
13.3%
http://www.tigersoftware1.com/HH/MASTDOWJ.GIF
oversold
SP-500 28.3% 26.7% http://www.tigersoftware1.com/HH/MASTSP50.GIF
QQQ 27.6% 28.6%
http://www.tigersoftware1.com/HH/MASTNASD.GIF
Russell-1000 30.1% 28.9%
http://www.tigersoftware1.com/HH/MASTRUS-.GIF
OEX
28.6% 28,7%
http://www.tigersoftware1.com/HH/MASTSP-1.GIF
All Stocks
27.7% 26.5%
http://www.tigersoftware1.com/HH/DATA65.GIF
History of New Extended
Red Sell S12s
1929 June - bad Sell: failure after price
breakout (late Summer rally)
3.4% loss - reversed 6 days later
by Buy B4.
Note DJI was essentially unchanged from what it was
65-days before
and showed an OBVPct of +.156.
This signal was redundant, as there already was a
regular Sell S12.
1929 September 5-
perfect Sell
just before Crash! BIG DECLINE
+43.3% gain
LA/MA = 1.013 PI=-26 IP21= -.109 VI= -454 OBVPct
= .112
DJI was up 19% above its level of 65-days before.
This signal was redundant, as there already were a
variety of Peerless Sells.
1932 November 7 - premature Sell 64.6 --->
68.0 ---> 55.9 BIG DECLINE
+9.0% gain
LA/MA = 1.046 PI=-41 IP21= -.079 VI= -156 OBVPct
= - .069
DJI was up 8.3% above its level of 65-days before.
This signal was not as good as the perfect Sell S2
right at top.
1936 April 2 -
perfect Sell
BIG DECLINE
+6.7% gain
LA/MA = 1.026 PI=-27 IP21= -.089 VI= -231 OBVPct
= + .198
DJI was up 11.3% above its level of 65-days before.
This signal was redundant, as there already were a
variety of Peerless Sells.
1936 October 7 - bad Sell. but A/D Line was
weak until end of 1936 and this
was right after a
perfectly flat-topped breakout.
LA/MA = 1.034 PI=-14 IP21= -.051 VI= -105
OBVPct = + .253
(too high?)
DJI was up 12.2% above its level of 65-days before.
1959 December 31 -
perfect Sell BIG
DECLINE
1963 December 4 - bad Sell.
Early
December is not usually a good time to sell short.
LA/MA = 1.015 PI=-58 IP21= -.066 VI= -577 OBVPct
= + .028
DJI was up 4.0% above its level of 65-days before.
1964 June 19 -bad Sell. - 823 ---> 851 --->
833 and then up strongly.
The loss here would have been small using
Peerless.
It would have been 2.5% based on Peerless Buy B10 on
6/17/2015
LA/MA = 1.011 PI=-11 IP21= -.108 VI= -317 OBVPct
= - .006
DJI was
only up 0.8% above its level of 65-days before.
1965 April 12 - premature Sell - 906 --->
939.6 ---> 840
1967 April 18 - premature Sell - 873 ---> 909
---> 847
1972 August 2 - premature Sell - 944 --->
970.35 ---> 921.66
1998 June 29 - premature Sell - 8997.36 --->
9337.97 ---> 7539.07 BIG DECLINE
2000 August 7 - premature Sell - 10867 --->
11311 ---> 7539 BIG DECLINE
2012 December 5 - premature Sell - 13034 --->
13351 ---> 12938
2015 May 19 -
LA/MA = 1.013 PI= 13 IP21= -.008 VI= -48
OBVPct = .115
DJI was up 1.5% above its level from 65-days
before.
|
------------------------
Announcements
--------------------------------
E-Books
1
The On-Line Explosive Stocks
2
The On-Line Killer Short
Sales book
Purchase each all new book by CC for
$42.50 or send a check for $37.50 to me.
I call your
attention now to the many new concepts and
the considerable new research in them:
For example:
1) A very good New Tiger Buy B12 for Low
Priced Stocks
2) After Red high volume reversal days use CP
uptrend-breaks.
3) Buy the stocks the Federal Govt wants you
to buy.
4) 100-Day Power Rankings...
5) Using Closing Power Hooks after Buy B26s
and B20s.
6) How A Stock Reacts to Its Earnings Report
Is Very important.
7) TigerSoft Major Buy Signals' Combinations
Which are most Powerful? Reliable?
8) Augmented Buy B20s' Independent Success
Rate.
9) What factors warn a rising 65-dma will not
hold?
10) The classic cluster of technical
characteristics that commonly appear
in the 23 stocks falling 70% or more in
the deep pullback of 2011.
----------------------------------------------------------------------------------------------------------------------------------------------------------------------------
PEERLESS STOCK MARKET TIMING:
A Guide To
Profitably Using The Tiger Nightly HOTLINE
Peerless Signals: 1915-2014
New Peerless Signals and DJI Charts - version 7/4/2013
1965
1965-6 1966
1966-7 1967
1967-8 1968
1968-9 1969
1969-70
1970
1970-1
1971
1971-2 1972
1972-3
1973 1973-4
1974
1974-5 1975
1975-6
1976 1976-7
1977
1977-1978
1978
1978-79
1979 1979-80
1980 1980-1
1981 1981-2
1982 1982-1983
1983 1983-1984
1984
1984-1985
1985
1985-1986
1986 1986-1987
1987 1987-8
1988
1988-9 1989
1989-90
1990
1990-1 1991
1991-2 1992
1992-3 1993
1993-4 1994
1994-5 1995
1995-1996
1996
1996-7 1997
1997-8 1998
1998-1999 1999
1999-2000 2000
2000-1
2001 2001-2
2002
2002-3 2003
2003-4 2004
2004-5
2005 2005-6
2006 2006-7
2007 2007-8
2008 2008-9
2009
2009-10
2010 2010-11
2011 2011-12
2012
2012-2013
2013 2013-4 2014
Introduction to Tiger/Peerless Buys and Sells.
Different Types
of TigerSoft/Peerless CHARTS, Signals and Indicators
How reliable support is the DJI's rising 200-day ma?
-------------------------------------------------------------------------------------------------------------------
TIGERSOFT SIGNALS AND INDICATORS:
Documentation for TigerSoft
Automatic and Optimized Signals.
SPY Charts since 1994: Advisory Closing Power S7s, Accum. Index, 65-dma,
Optimized Signals.
"The
Jig Is Up": Calling September and October Tops.
A Keynesian's Warning Signs.
NUGT since 2012: A study of Tiger Technicals
Tiger Day
Traders Tool and most active Triple Leveraged ETFs
Advisory Pink Closing Power S7s at ETF at top since 1994
1994
1996
1997
1998
1999
2000 QQQ
SPY
DIA
2002
2007
2008
SPY 2011
2013-2014
Tiger Buy and Sell
Signals: New 2014 Research:
These are randomly chosen
groups.
but clearly we need to back-test them in more years.
You can replicate or do similar studies yourself
for other signals and/or other years.
9/1/2014 -
2014 Tiger
B19s - Steady rallying and no pullbacks below the 21-day ma.
9/2/2014 -
2014 Tiger
B17s on 14As taken alphabetically
9/3/2014 -
2014 Tiger B17s on 60
Biotechs taken alphabetically
9/4/2014 -
2014 Tiger
B18s on all "R" stocks taken alphabetically
* 9/8/2014 -
2014 Tiger
B20s - Conclusion: Use Closing Power trendbreaks in aftermath.
9/8/2014 -
2014 Tiger
B16s - Conclusion: Use mostly when
LA/MA under 1.05.
9/11/2014 -
2014 Tiger
B15s - Conclusion: Certain conditions
improved the results dramatically.
9/12/2014 -
2014 Tiger
B25s - Conclusion: 87.5% success rate
when other internals are positive.
9/15/2014 -
2014 Tiger B25s -
Best conditions for using B25s with somewhat
higher RSX capitalization stocks.
9/16/2014 -
New Tiger
Closing Power Take-Off Buy Signal in 2014: 14s, QQQ, DJI-30 and ETFs
9/17/2014 -
New Tiger
Closing Power Take-Off Buy Signal: 2009A-s
9/18/2014 -
New Tiger
Closing Power Take-Off Buy Signal: 2010A-s
9/21/2014 -
New Tiger
Augmented Sell S8s: DJI-30 - 2014
Requiring S8s to show
Negative CP%-Pr and IP21<+.15 produced a 70% success rate
in a rising market for
DJI-30 stocks and big ETFs.
9/24/2014 -
Tiger Sell
S14s: They make price breakdowns very bearish.
1/15/2015
-
Tiger Day
Traders' Tool Explained.
http://www.tigersoft.com/day-traders/index.html
http://www.tigersoft.com/Indicators/index.htm
http://www.tigersoftware.com/TigerBlogs/Aug-31-2009/index.html
NEW
2/16/2015
1) New -
Tiger Charts showing UP%, Opening-Up%, Closing-Up%
Note differences between bullish
and bearish stocks...
2) New -
UP%,
Opening-Up%, Closing-Up% Rankings of any directory.
3) New -
Display of what happens to a stock after various size openings up or down.
4) New -
6-month charts to better
show volume changes and 5-day ma with bands.
More profitable trading schemes coming...
Targeted Trading Opportunities:The Profits Quickly Add Up,
3/29/2015
Tiger CandleSticks:
IBB: 2001-2015
and
Recent Others.
====================================================================================
Earlier Hotlines
2-7-2014 to 3/19/2014
11-22-2014 to 2-6-2014
http://tigersoftware.com/555HL555/index.htm
10/9/2014 - 11/21/2014
http://tigersoftware.com/9933Hot/
9/2/2014 - 10/8/2014-
http://tigersoftware.com/2233HL/index.html
6/25/2013-9/1/2014
http://tigersoftware.com/112211-H/index.htm
11/22/2013-3/20/2014
http://tigersoft.com/1111-HL/index.html
10/22/2013-11/21/2013
Past
Hotline Predictions
http://tigersoft.com/-HL42013/index.html
http://www.tigersoft.com/-2GBL13HL/index.htm
==============================================================================================================================

 7/8/2015 150+ TigerSoft Charts