TigerSoft and Peerless Daily
Hotline
(C) 1985-2015 William Schmidt,
Ph.D. www.tigersoft.com
All rights
strictly reserved.
Tiger Software
858-273-5900 PO Box 22784 San Diego, CA 92192 Email
william_schmidt@hotmail.com
------------------------------------------------------------------------------------------------------------------
Announcement - San Diego Tiger User Group
Meeting This Saturday:
1:00-4:00 PM La Jolla Coco's
------------------------------------------------------------------------------------------------------------------
7/28/2014 A
Short-Term Bounce within The Confines of The DJI's Trading
Range Has Started but Peerless Remains on a Sell S12*. Traders
are hoping now the Fed will delay its Rate Hike. Perhaps,
some got advanced word about the Fed's intentions.
The DJI's 21-day Stochastic has moved back above the 20-level. In the
chart below, you can see that these signals worked 11 times in
the last year and failed only twice. But a meaningful rally for most
stocks
seems unlikely. For one thing, the NYSE ratio of advances to declines
was only 2.6:1 today. I have shown that a ratio of 3.5 has generally been
needed since 2009 on these reversals back upwards if a meaningful +4% rally
is to follow..

Another rally back up to 18000 would actually give more price
symmetry
to the emerging head/shoulders that the DJI is making. By reversing the
market where it did today, the DJI has a/voided what I think would have
become a severe decline below 17000.

The operative Peerless
signal remains a Red Sell S12*. Because the
DJI's Accumulation Index has been negative or nearly
so for more
than four months,
it seems to me that it is only a matter of time before the
DJI decisively penetrates its neckline in a 6-months' wide
head/shoulders
pattern. These price patterns are also quite bearish
if they are neckline
is decisively penetrated.
What If The Fed Is Wrong Again?
Commodity deflation is quite pronounced. Some in the Fed seem to think
that these are temporary and short-term trends and not signs of a severe world-
wide economic slump. Judge the commodity trends in
this Hotline yourself. These
are significant longer term trends, I think. "Hawks" in the Fed appear
to be making mistakes comparable to the ones made by the Fed in 1929
and 1937, namely not recognizing how fragile the World Economy is
at this juncture and going ahead with interest rate hikes to stop
excessive stock speculation. The Fed, as a whole, apparently does not view
Deflation and a world-wide economic slow-down as much of a threat.
See --
http://finance.yahoo.com/news/fed-expected-push-ahead-rate-050316372.html
I would say that the most dangerous thing that could happen now would be for
the Chinese markets to collapse. Not only would this badly interrupt
trade the US has become dependent upon and cause Chinese
investors to sell US stocks in an attempt to remain liquid, it might well
force the Chinese Government to sell massive amounts of US Treasuries,
thereby causing a steep sell-off in Government bonds and forcing
up interest rates. Right now Chinese stocks appear only to have fallen
back to
their base of support.
We will keep watching this chart here.
As I said last night:
"...(E)xpect any rally in the DJI to get quickly snuffed out...If the DJI's
green neckline shown above is decisively violated, the DJI should soon
be testing 17000. In fact, give the height of the head/shoulders pattern,
a minimum objective of 16750 can be calculated.
Hold
lots of our Bearish MINCP stocks short. If the neckline above is
decisively
violated, I would get completely out of all long stock positions. There
will be
more money to be made on the downside and the risks of a sell-off even in
the best stocks are too high."
Hourly DJIA
 |
Watch Biotechs and IBB. They are the
leaders of what is left
of the 2009-2015 bull market. Bulls
will need to see them recover
their strength to remain believers in the
enduring power of
this bull market. IBB's simple price-uptrendline
has not been
violated. Note the price channel is
in.
SPY is further above its green support than the DJI. It has
more room
to rally. But it is the DJIA, not SPY, that best predicts the
overall market.
In any case, no short-term Tiger Buy signal (blue or red) has
appeared
on the current decline.
 |
The QQQ's false breakout above 111 has trapped many traders who
chased the run-up in tech stocks. The false breakout is
quite bearish.
It also ran in many short sellers, so that there is less of a
buying
cushion on the next decline.
 |
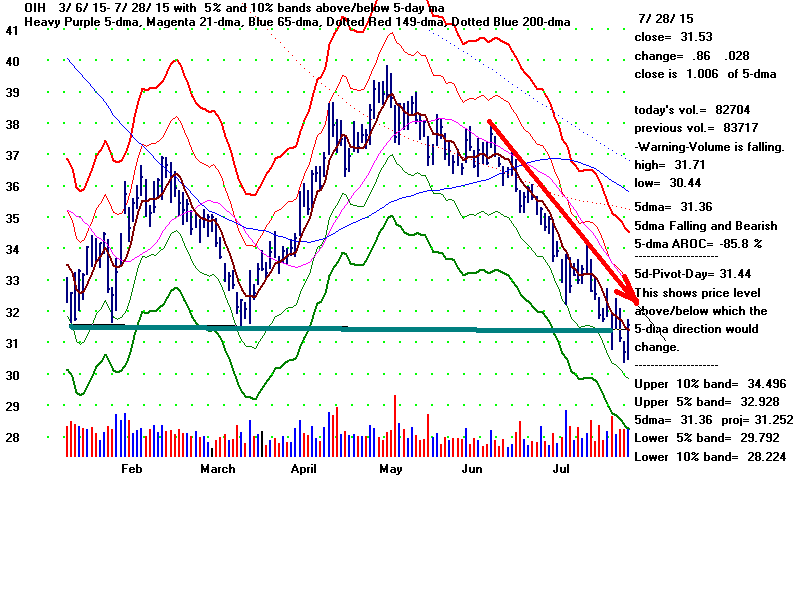
Commodites, especially Oil, Oil Drillers and
Coal
are still the Decline's Leaders. This is what we have been
primarily shorting. Until their Closing Powers downtrends
are violated, they should be shorted on minor intra-day rallies
and held short. The downward velocity of the 5-day ma is
an especially good way to pick out the weakest of these.
See below how the QuickSilver approach is applied now to Leveraged
ETFs
 |

  Bullish 5-day Momentum among Leveraged ETFs
 >Both-Up: Opening and Closing Power are both rising
 >IP21> +.23

              Of these, we want to buy them
        either when they breakout or when they
        pull back with a few percent of their
        5-dma pivot points.

              So, Buy:

  1. SCO (Crude Oil Short)but sell it if it closes below 81.47,
     its 5-day pivot point.
  2. DTO (Crude Oil Short) but sell it if it closes below 88.99,
     its 5-day pivot point.
  3. DUST (Short Gold Miners)but sell it if it closes below 32.98,
     its 5-day pivot point.


C:\leverage - 07/28/15
5DAROC        Symbol        Last          5-dma         Pivot         Daily price change          ..............................................................................................
IP21          AI/200        OP-PWR        CP-PWR        PCT-Up        Daily volume notes
==============================================================================================
871.8         DWTI          121.1         118.4         111.54        -5.32
.23           100           Rising        Rising        .558          bearish
---------------------------------------------------------------------------------------------
603.1         SCO           86.18         84.81         81.47         -2.49
.23           127           Rising        Rising        .566          bearish
---------------------------------------------------------------------------------------------
384.1         DTO           92.05         91.18         88.99         -1.52
.29           138           Rising        Rising        .566          bearish
---------------------------------------------------------------------------------------------
352.5         DUST          35.17         34.66         32.98         -.89
.37           147           Rising        Rising        .526          vol.fell on down-day
---------------------------------------------------------------------------------------------
DWTI VelocityShares 3x Inverse Crude Oil
ETN (DWTI)
 |
SCO ProShares UltraShort Bloomberg Crude Oil (SCO)
 |
DTO
 |
DUST
 |
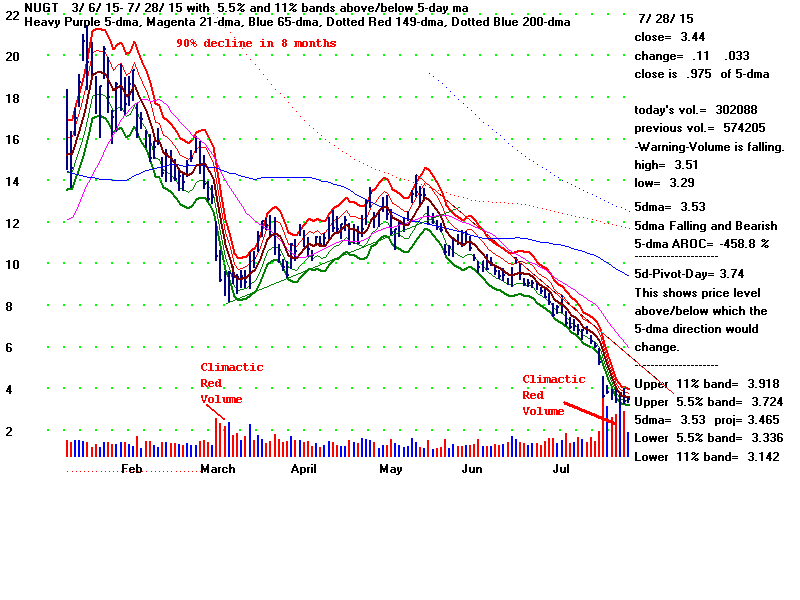
Bearish 5-day Momentum among Leveraged ETFs
>Both-Down: Opening and Closing Power are both falling
>IP21< -.23
C:\leverage - 07/28/15
5DAROC Symbol Last 5-dma Pivot Daily price change ..............................................................................................
IP21 AI/200 OP-PWR CP-PWR PCT-Up Daily volume notes
==============================================================================================
-458.9 NUGT 3.44 3.53 3.74 .11
-.32 49 Falling Falling .458 vol.fell on up-day
---------------------------------------------------------------------------------------------
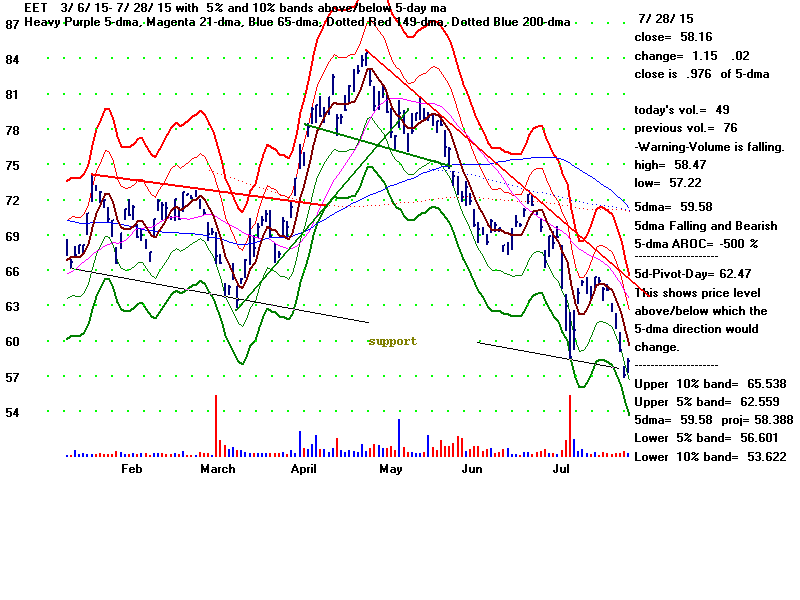
-500.9 EET 58.16 59.58 62.47 1.15
-.38 84 Falling Falling .454 vol.fell on up-day
---------------------------------------------------------------------------------------------
-540.9 UMX 28.21 29.03 29.85 0
-.5 48 Falling Falling .297 ?
---------------------------------------------------------------------------------------------
-661.2 UCO 28.56 29.08 30.27 .78
-.3 64 Falling Falling .434 bullish
---------------------------------------------------------------------------------------------
-674.9 UWN 1.5 1.66 1.7 -.17
-.38 143 Rising Falling .43 bearish
---------------------------------------------------------------------------------------------
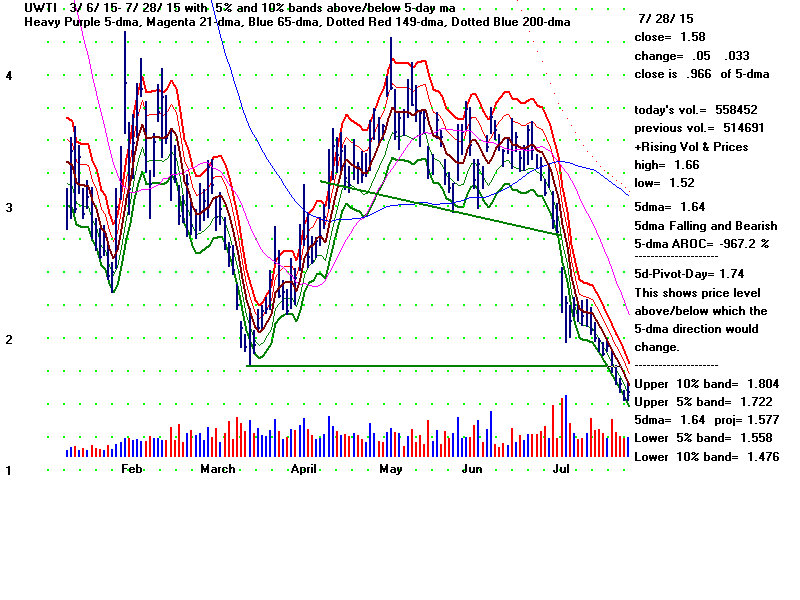
-1025.8 UWTI 1.58 1.64 1.74 .05
-.26 56 Falling Falling .434 bullish
---------------------------------------------------------------------------------------------
NUGT Direxion Daily
Gold Miners Bull 3X ETF
I would buy NUGT when Gold reaches
1000.
 |
|
------------------------
Announcements
--------------------------------
E-Books
1
The On-Line Explosive Stocks
2
The On-Line Killer Short
Sales book
Purchase each all new book by CC for
$42.50 or send a check for $37.50 to me.
I call your
attention now to the many new concepts and
the considerable new research in them:
For example:
1) A very good New Tiger Buy B12 for Low
Priced Stocks
2) After Red high volume reversal days use CP
uptrend-breaks.
3) Buy the stocks the Federal Govt wants you
to buy.
4) 100-Day Power Rankings...
5) Using Closing Power Hooks after Buy B26s
and B20s.
6) How A Stock Reacts to Its Earnings Report
Is Very important.
7) TigerSoft Major Buy Signals' Combinations
Which are most Powerful? Reliable?
8) Augmented Buy B20s' Independent Success
Rate.
9) What factors warn a rising 65-dma will not
hold?
10) The classic cluster of technical
characteristics that commonly appear
in the 23 stocks falling 70% or more in
the deep pullback of 2011.
----------------------------------------------------------------------------------------------------------------------------------------------------------------------------
PEERLESS STOCK MARKET TIMING:
A Guide To
Profitably Using The Tiger Nightly HOTLINE
New Peerless Signals and DJI Charts - version 7/4/2013
1965
1965-6 1966
1966-7 1967
1967-8 1968
1968-9 1969
1969-70
1970
1970-1
1971
1971-2 1972
1972-3
1973 1973-4
1974
1974-5 1975
1975-6
1976 1976-7
1977
1977-1978
1978
1978-79
1979 1979-80
1980 1980-1
1981 1981-2
1982 1982-1983
1983 1983-1984
1984
1984-1985
1985
1985-1986
1986 1986-1987
1987 1987-8
1988
1988-9 1989
1989-90
1990
1990-1 1991
1991-2 1992
1992-3 1993
1993-4 1994
1994-5 1995
1995-1996
1996
1996-7 1997
1997-8 1998
1998-1999 1999
1999-2000 2000
2000-1
2001 2001-2
2002
2002-3 2003
2003-4 2004
2004-5
2005 2005-6
2006 2006-7
2007 2007-8
2008 2008-9
2009
2009-10
2010 2010-11
2011 2011-12
2012
2012-2013
2013 2013-4 2014
Introduction to Tiger/Peerless Buys and Sells.
Different Types
of TigerSoft/Peerless CHARTS, Signals and Indicators
How reliable support is the DJI's rising 200-day ma?
-------------------------------------------------------------------------------------------------------------------
TIGERSOFT SIGNALS AND INDICATORS:
Documentation for TigerSoft
Automatic and Optimized Signals.
SPY Charts since 1994: Advisory Closing Power S7s, Accum. Index, 65-dma,
Optimized Signals.
"The
Jig Is Up": Calling September and October Tops.
A Keynesian's Warning Signs.
NUGT since 2012: A study of Tiger Technicals
Tiger Day
Traders Tool and most active Triple Leveraged ETFs
Advisory Pink Closing Power S7s at ETF at top since 1994
1994
1996
1997
1998
1999
2000 QQQ
SPY
DIA
2002
2007
2008
SPY 2011
2013-2014
Tiger Buy and Sell
Signals: New 2014 Research:
These are randomly chosen
groups.
but clearly we need to back-test them in more years.
You can replicate or do similar studies yourself
for other signals and/or other years.
9/1/2014 -
2014 Tiger
B19s - Steady rallying and no pullbacks below the 21-day ma.
9/2/2014 -
2014 Tiger
B17s on 14As taken alphabetically
9/3/2014 -
2014 Tiger B17s on 60
Biotechs taken alphabetically
9/4/2014 -
2014 Tiger
B18s on all "R" stocks taken alphabetically
* 9/8/2014 -
2014 Tiger
B20s - Conclusion: Use Closing Power trendbreaks in aftermath.
9/8/2014 -
2014 Tiger
B16s - Conclusion: Use mostly when
LA/MA under 1.05.
9/11/2014 -
2014 Tiger
B15s - Conclusion: Certain conditions
improved the results dramatically.
9/12/2014 -
2014 Tiger
B25s - Conclusion: 87.5% success rate
when other internals are positive.
9/15/2014 -
2014 Tiger B25s -
Best conditions for using B25s with somewhat
higher RSX capitalization stocks.
9/16/2014 -
New Tiger
Closing Power Take-Off Buy Signal in 2014: 14s, QQQ, DJI-30 and ETFs
9/17/2014 -
New Tiger
Closing Power Take-Off Buy Signal: 2009A-s
9/18/2014 -
New Tiger
Closing Power Take-Off Buy Signal: 2010A-s
9/21/2014 -
New Tiger
Augmented Sell S8s: DJI-30 - 2014
Requiring S8s to show
Negative CP%-Pr and IP21<+.15 produced a 70% success rate
in a rising market for
DJI-30 stocks and big ETFs.
9/24/2014 -
Tiger Sell
S14s: They make price breakdowns very bearish.
1/15/2015
-
Tiger Day
Traders' Tool Explained.
http://www.tigersoft.com/day-traders/index.html
http://www.tigersoft.com/Indicators/index.htm
http://www.tigersoftware.com/TigerBlogs/Aug-31-2009/index.html
NEW
2/16/2015
1) New -
Tiger Charts showing UP%, Opening-Up%, Closing-Up%
Note differences between bullish
and bearish stocks...
2) New -
UP%,
Opening-Up%, Closing-Up% Rankings of any directory.
3) New -
Display of what happens to a stock after various size openings up or down.
4) New -
6-month charts to better
show volume changes and 5-day ma with bands.
More profitable trading schemes coming...
Targeted Trading Opportunities:The Profits Quickly Add Up,
3/29/2015
Tiger CandleSticks:
IBB: 2001-2015
and
Recent Others.
====================================================================================
Earlier Hotlines
2-7-2014 to 3/19/2014
11-22-2014 to 2-6-2014
http://tigersoftware.com/555HL555/index.htm
10/9/2014 - 11/21/2014
http://tigersoftware.com/9933Hot/
9/2/2014 - 10/8/2014-
http://tigersoftware.com/2233HL/index.html
6/25/2013-9/1/2014
http://tigersoftware.com/112211-H/index.htm
11/22/2013-3/20/2014
http://tigersoft.com/1111-HL/index.html
10/22/2013-11/21/2013
Past
Hotline Predictions
http://tigersoft.com/-HL42013/index.html
http://www.tigersoft.com/-2GBL13HL/index.htm
==============================================================================================================================
 7/28/2015 200+ TigerSoft Charts - Time will not permit