TigerSoft and Peerless Daily
Hotline
(C) 1985-2015 William Schmidt,
Ph.D. www.tigersoft.com
All rights
strictly reserved.
Tiger Software
858-273-5900 PO Box 22784 San Diego, CA 92192 Email
william_schmidt@hotmail.com
------------------------------------------------------------------------------------------------------------------
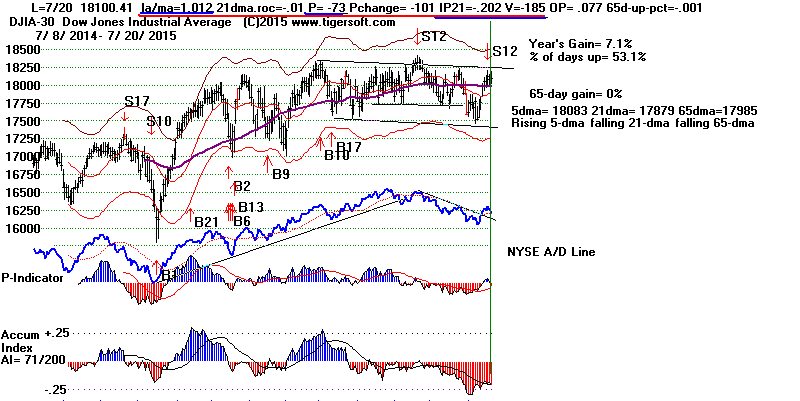
7/20/2014 Hold IBB. Sell IWM.
Its 5-day ma has turned diwn.
Remain hedged with some Bearish MINCP
short sales even though
energy and natural resources stocks dropped a lot today.
Though there were nearly 1100 more down than up on the NYSE,
the NASDAQ continued to rise into all-time high territory. Money
keeps coming out of NYSE dividend stocks and flowing into
the NASDAQ leaders: AAPL, ANZN, EQUIX, GOOG and TSLA. Growth
stocks CMG and FB also were beneficiaries of the shift of funds
into more volatile growth stocks.
The P-Indicator has now turned negative. If there is no improvement here.
we could get a regular Sell S9 on a DJI rally of 180 points.
If a regular Sell S9 and Sell S12 were to occur, it would add to the
current environment's characteristics that bear similarity to previous market
tops. Presently, the red Sell S12* signal given by Peerless Thursday tells us that
many DJI and NYSE stocks are probably going to have to test
their lows of two weeks ago. That would be less than a 5% decline
from current levels. Why so small a decline? Since 1965, these Red
Sell S12 signals have not brought any declines below the lower band.
In earlier years they did, but that was when other Peerless Sells
also occurred.

Last
night's comments still apply:
I doubt if this Sell S12* will stop the rampaging QQQ and NASDAQ
or the Biotechs' IBB. Pent-up, heavy speculation is propelling the NASDAQ
now to all-time highs and the QQQ back 119-120, its all-time high back in
2000. Institutions are apparently selling their boring blue chip and
dividend NYSE
stocks and using the proceeds to buy biotech and tech stocks,
like those represented by IBB (or BBH) and QQQ. Performance minded
fund managers realize they need to show better returns than the first
six months have offered; they must speculate. By raising rates, the
Fed has caused dividend stock to give way to a handful of big tech stocks.
After a long bull market, I expect this buying to be much like it was in
|
early 2000. This was also a time when high interest rates were expected.
The wave tech buying now may well lead to another speculative bubble.
Bubbles appear to be very hard to avoid at the end of long stock market
advances. All this could become eerily similar to what occurred in the
first
quarter of 2000.

SELECTED LEVERAGED ETFS
RANKED BY
ANNUALIZED RATE OF CHANGE (AROC) of 5-day Mvg.Avg
IWM has had its 5-day ma turn down. I think it should
be sold. I would still hold IBB.
None of the key ETFs below show the bullish combination of:
1) a rising 5-day AROC
2) a positive IP21
3) a rising Opening and a rising Closing Power.
(Actually,
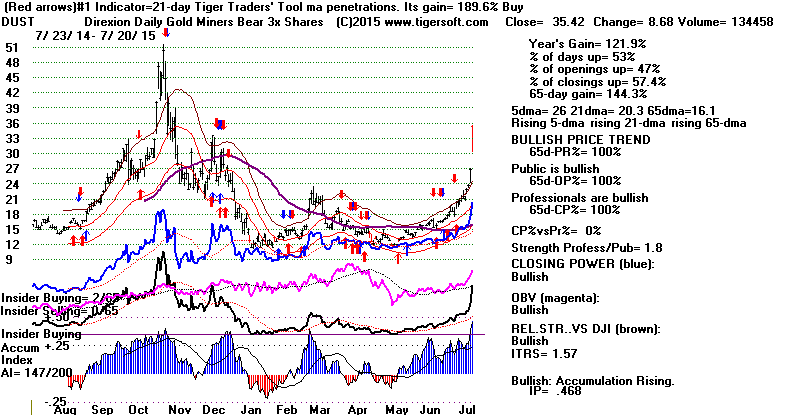
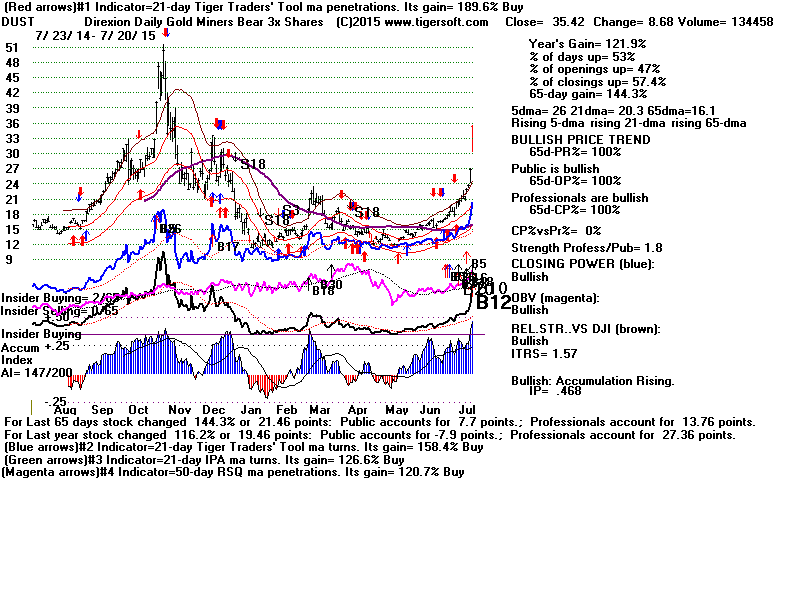
DUST (3x leveraged bearish Gold Stocks' ETF is an exception.)
The weakest key ETFS were all down very sharply today.
These ETFs
all showed the opposite conditions on Friday, and of course,
today:
1) a falling 5-day AROC
2) a negative IP21
3) a falling Opening and a falling Closing Power.
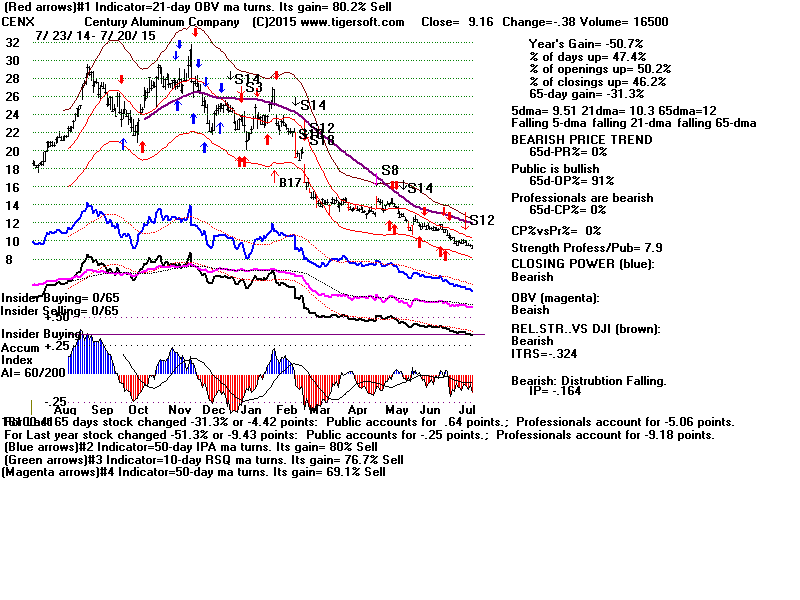
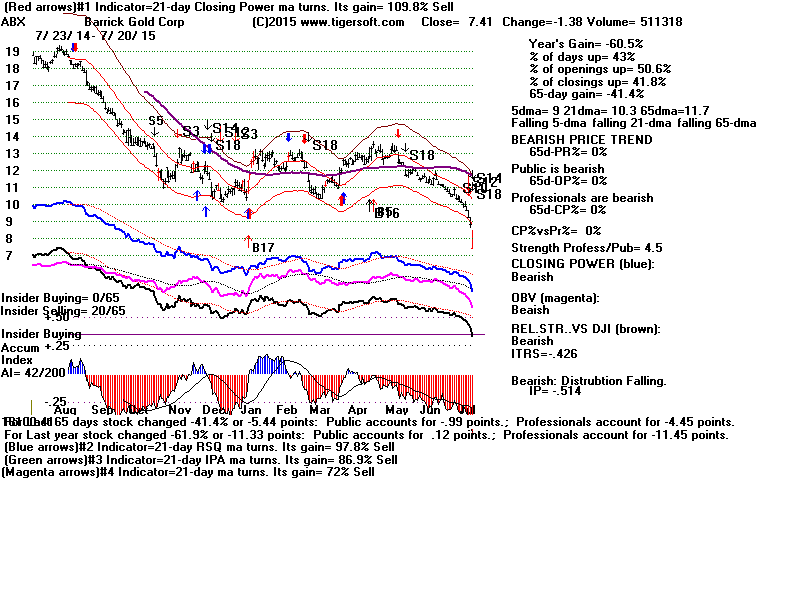
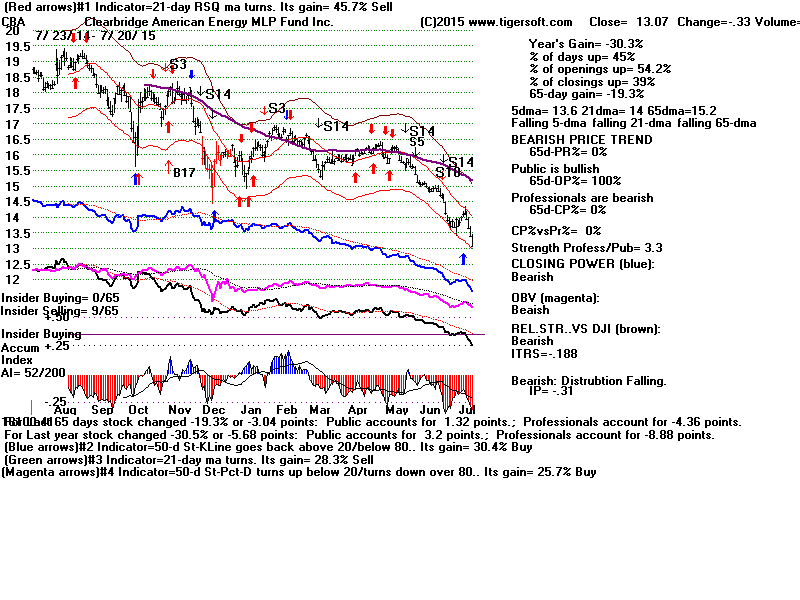
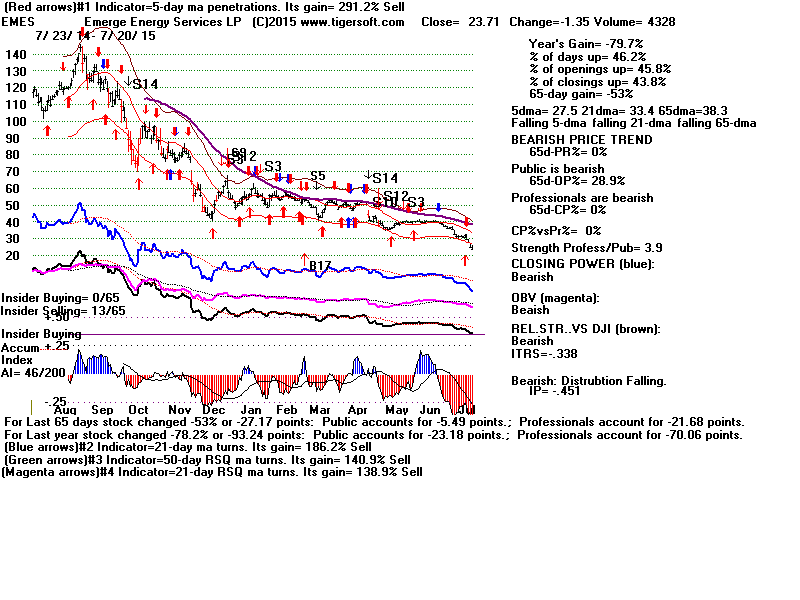
The weakest ETFs are all energy-related. Not
surprisingly, most of the stocks recently
in the Bearish MINCP group were natural resource
stocks.
- 07/20/15
5DAROC Symbol
Last 5-dma
Pivot-Price
Daily price change
---------------------------------------------------------------.---------------------------------------------------------------...
IP21 AI/200
OP-PWR CP-PWR
PCT-Up
Daily volume notes
==============================================================================================
545.2         TECL          40.06         38.04         36.41         .57
-.08          117           Rising        ?             .562          vol.fell on up-day
---------------------------------------------------------------------------------------------
270.1         FAS           35.18         34.61         33.66         .29
-.06          135           Rising        Falling       .546          vol.fell on up-day
---------------------------------------------------------------------------------------------
251.8         AAPL          132.07        128.53        125.61        2.45
-.05          66            Rising        ?             .514          bullish
---------------------------------------------------------------------------------------------
241.5         IBB           398           393.99        387.94        .42
.08           140           Rising        ?             .566          vol.fell on up-day
---------------------------------------------------------------------------------------------
199.7         QQQ           113.98        112.03        110.26        .39
-.05          99            Rising        ?             .554          vol.fell on up-day
---------------------------------------------------------------------------------------------
108.9         OEX           945.61        937.71        929.94        2.34
-.08          110           Rising        Rising        .518          vol.fell on up-day
---------------------------------------------------------------------------------------------
66.7          SPY           212.59        211.73        210.68        .11
-.09          109           Rising        Falling       .522          vol.fell on up-day
---------------------------------------------------------------------------------------------
53.5          GS            212.39        212.23        212.16        -.07
-.14          127           Rising        Falling       .534          vol.fell on down-day
---------------------------------------------------------------------------------------------
30.2          DIA           180.69        180.59        180.33        .15
-.19          113           Rising        Falling       .542          bullish
----------------------------------------------------------------------------------------------
-17.9         IWM           125.08        125.79        126.23        -.68
-.04          140           Rising        Falling       .538          vol.fell on down-day
---------------------------------------------------------------------------------------------
-240.8        OIH           31.72         32.49         33.79         -.13
-.24          85            Falling       Falling       .422          vol.fell on down-day
---------------------------------------------------------------------------------------------
-252.4        OIL           9.92          10.2          10.59         -.19
-.04          88            Falling       Falling       .426          vol.fell on down-day
---------------------------------------------------------------------------------------------
-273.9        KOL           9.98          10.29         10.51         -.25
-.4           70            Falling       Falling       .422          bearish
---------------------------------------------------------------------------------------------
-1624         GASL          9.72          12.84         15.79         -1.88
-.37          53            Falling       Falling       .398          vol.fell on down-day
---------------------------------------------------------------------------------------------
-2570.6       NUGT          3.6           5.53          6.63          -1.61
-.5           49            Falling       Falling       .454          bearish
---------------------------------------------------------------------------------------------
       This table is produced by a new Tiger Program which
       I will release to ESP subscribers at the end of the
       weak after a little more testing.
------------------------
Announcements
--------------------------------
E-Books
1
The On-Line Explosive Stocks
2
The On-Line Killer Short
Sales book
Purchase each all new book by CC for
$42.50 or send a check for $37.50 to me.
I call your
attention now to the many new concepts and
the considerable new research in them:
For example:
1) A very good New Tiger Buy B12 for Low
Priced Stocks
2) After Red high volume reversal days use CP
uptrend-breaks.
3) Buy the stocks the Federal Govt wants you
to buy.
4) 100-Day Power Rankings...
5) Using Closing Power Hooks after Buy B26s
and B20s.
6) How A Stock Reacts to Its Earnings Report
Is Very important.
7) TigerSoft Major Buy Signals' Combinations
Which are most Powerful? Reliable?
8) Augmented Buy B20s' Independent Success
Rate.
9) What factors warn a rising 65-dma will not
hold?
10) The classic cluster of technical
characteristics that commonly appear
in the 23 stocks falling 70% or more in
the deep pullback of 2011.
----------------------------------------------------------------------------------------------------------------------------------------------------------------------------
PEERLESS STOCK MARKET TIMING:
A Guide To
Profitably Using The Tiger Nightly HOTLINE
New Peerless Signals and DJI Charts - version 7/4/2013
1965
1965-6 1966
1966-7 1967
1967-8 1968
1968-9 1969
1969-70
1970
1970-1
1971
1971-2 1972
1972-3
1973 1973-4
1974
1974-5 1975
1975-6
1976 1976-7
1977
1977-1978
1978
1978-79
1979 1979-80
1980 1980-1
1981 1981-2
1982 1982-1983
1983 1983-1984
1984
1984-1985
1985
1985-1986
1986 1986-1987
1987 1987-8
1988
1988-9 1989
1989-90
1990
1990-1 1991
1991-2 1992
1992-3 1993
1993-4 1994
1994-5 1995
1995-1996
1996
1996-7 1997
1997-8 1998
1998-1999 1999
1999-2000 2000
2000-1
2001 2001-2
2002
2002-3 2003
2003-4 2004
2004-5
2005 2005-6
2006 2006-7
2007 2007-8
2008 2008-9
2009
2009-10
2010 2010-11
2011 2011-12
2012
2012-2013
2013 2013-4 2014
Introduction to Tiger/Peerless Buys and Sells.
Different Types
of TigerSoft/Peerless CHARTS, Signals and Indicators
How reliable support is the DJI's rising 200-day ma?
-------------------------------------------------------------------------------------------------------------------
TIGERSOFT SIGNALS AND INDICATORS:
Documentation for TigerSoft
Automatic and Optimized Signals.
SPY Charts since 1994: Advisory Closing Power S7s, Accum. Index, 65-dma,
Optimized Signals.
"The
Jig Is Up": Calling September and October Tops.
A Keynesian's Warning Signs.
NUGT since 2012: A study of Tiger Technicals
Tiger Day
Traders Tool and most active Triple Leveraged ETFs
Advisory Pink Closing Power S7s at ETF at top since 1994
1994
1996
1997
1998
1999
2000 QQQ
SPY
DIA
2002
2007
2008
SPY 2011
2013-2014
Tiger Buy and Sell
Signals: New 2014 Research:
These are randomly chosen
groups.
but clearly we need to back-test them in more years.
You can replicate or do similar studies yourself
for other signals and/or other years.
9/1/2014 -
2014 Tiger
B19s - Steady rallying and no pullbacks below the 21-day ma.
9/2/2014 -
2014 Tiger
B17s on 14As taken alphabetically
9/3/2014 -
2014 Tiger B17s on 60
Biotechs taken alphabetically
9/4/2014 -
2014 Tiger
B18s on all "R" stocks taken alphabetically
* 9/8/2014 -
2014 Tiger
B20s - Conclusion: Use Closing Power trendbreaks in aftermath.
9/8/2014 -
2014 Tiger
B16s - Conclusion: Use mostly when
LA/MA under 1.05.
9/11/2014 -
2014 Tiger
B15s - Conclusion: Certain conditions
improved the results dramatically.
9/12/2014 -
2014 Tiger
B25s - Conclusion: 87.5% success rate
when other internals are positive.
9/15/2014 -
2014 Tiger B25s -
Best conditions for using B25s with somewhat
higher RSX capitalization stocks.
9/16/2014 -
New Tiger
Closing Power Take-Off Buy Signal in 2014: 14s, QQQ, DJI-30 and ETFs
9/17/2014 -
New Tiger
Closing Power Take-Off Buy Signal: 2009A-s
9/18/2014 -
New Tiger
Closing Power Take-Off Buy Signal: 2010A-s
9/21/2014 -
New Tiger
Augmented Sell S8s: DJI-30 - 2014
Requiring S8s to show
Negative CP%-Pr and IP21<+.15 produced a 70% success rate
in a rising market for
DJI-30 stocks and big ETFs.
9/24/2014 -
Tiger Sell
S14s: They make price breakdowns very bearish.
1/15/2015
-
Tiger Day
Traders' Tool Explained.
http://www.tigersoft.com/day-traders/index.html
http://www.tigersoft.com/Indicators/index.htm
http://www.tigersoftware.com/TigerBlogs/Aug-31-2009/index.html
NEW
2/16/2015
1) New -
Tiger Charts showing UP%, Opening-Up%, Closing-Up%
Note differences between bullish
and bearish stocks...
2) New -
UP%,
Opening-Up%, Closing-Up% Rankings of any directory.
3) New -
Display of what happens to a stock after various size openings up or down.
4) New -
6-month charts to better
show volume changes and 5-day ma with bands.
More profitable trading schemes coming...
Targeted Trading Opportunities:The Profits Quickly Add Up,
3/29/2015
Tiger CandleSticks:
IBB: 2001-2015
and
Recent Others.
====================================================================================
Earlier Hotlines
2-7-2014 to 3/19/2014
11-22-2014 to 2-6-2014
http://tigersoftware.com/555HL555/index.htm
10/9/2014 - 11/21/2014
http://tigersoftware.com/9933Hot/
9/2/2014 - 10/8/2014-
http://tigersoftware.com/2233HL/index.html
6/25/2013-9/1/2014
http://tigersoftware.com/112211-H/index.htm
11/22/2013-3/20/2014
http://tigersoft.com/1111-HL/index.html
10/22/2013-11/21/2013
Past
Hotline Predictions
http://tigersoft.com/-HL42013/index.html
http://www.tigersoft.com/-2GBL13HL/index.htm
==============================================================================================================================
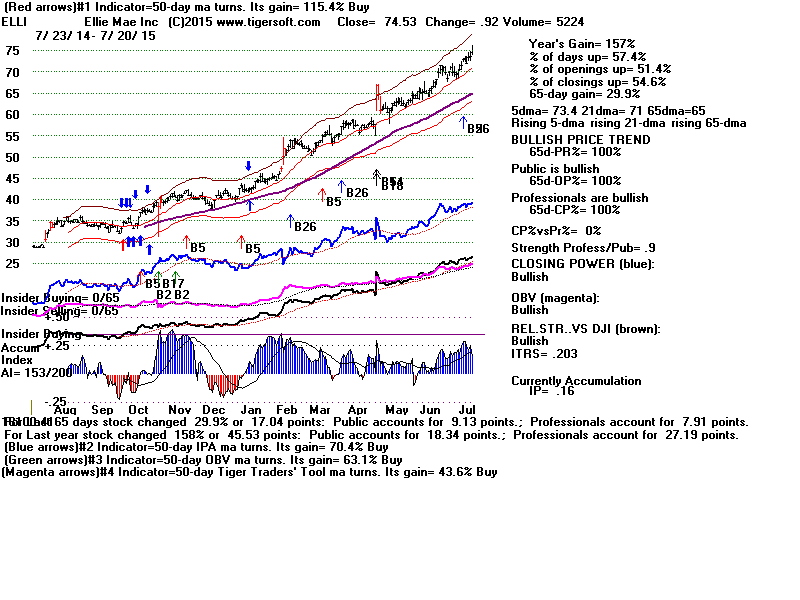
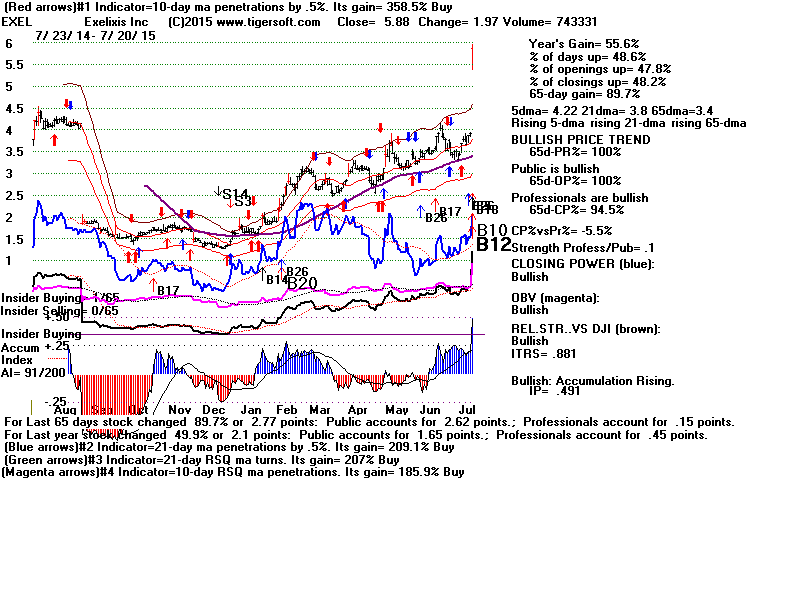
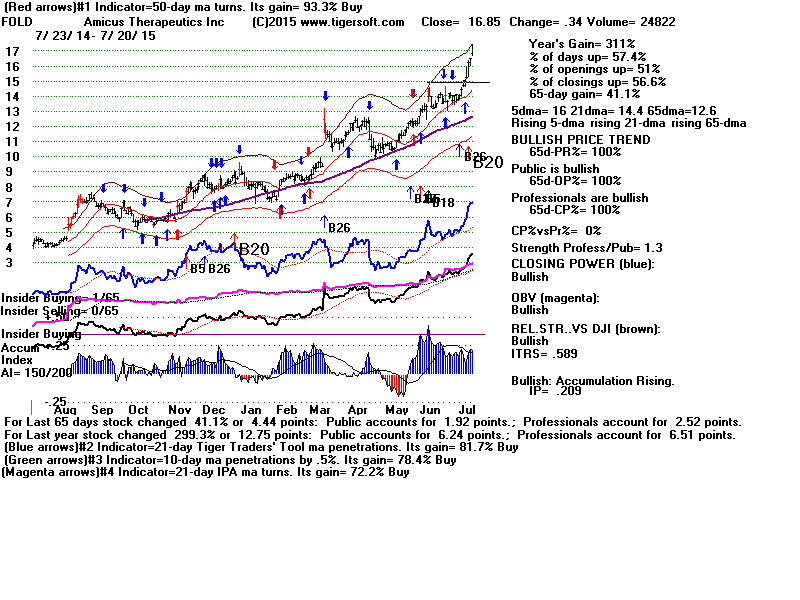
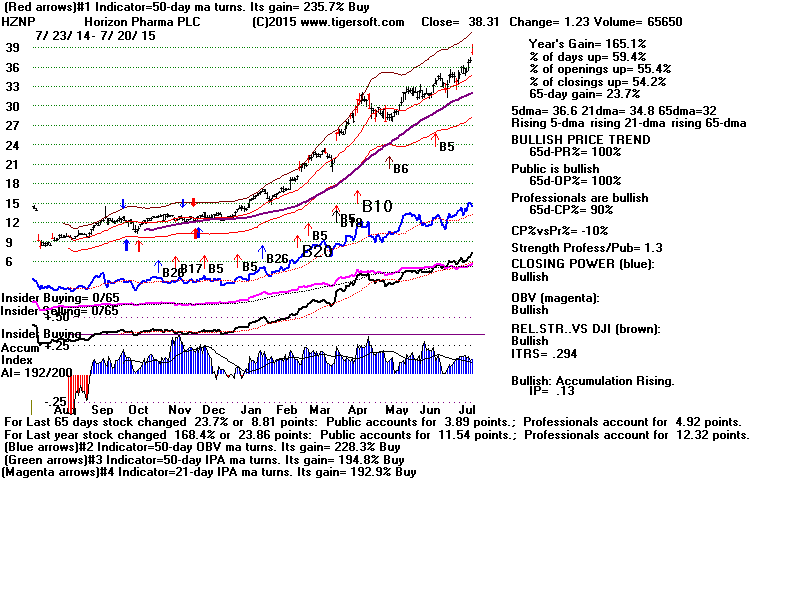
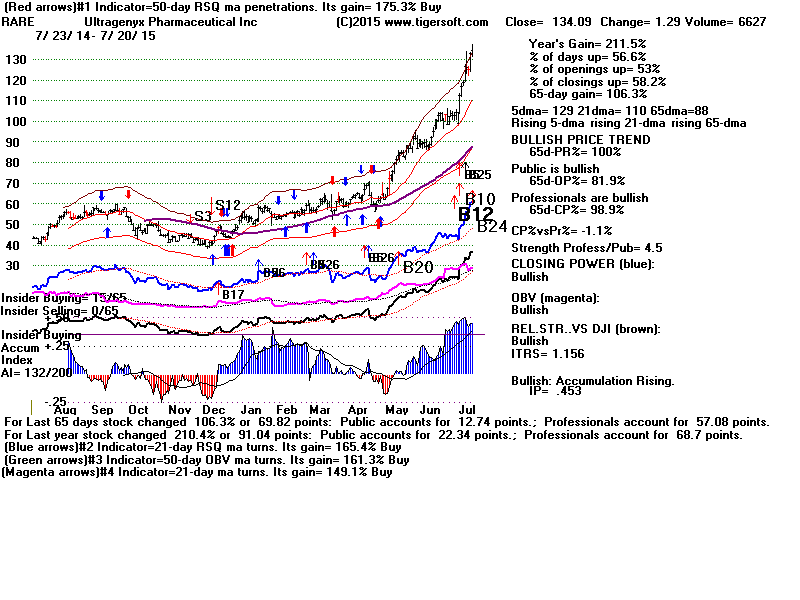
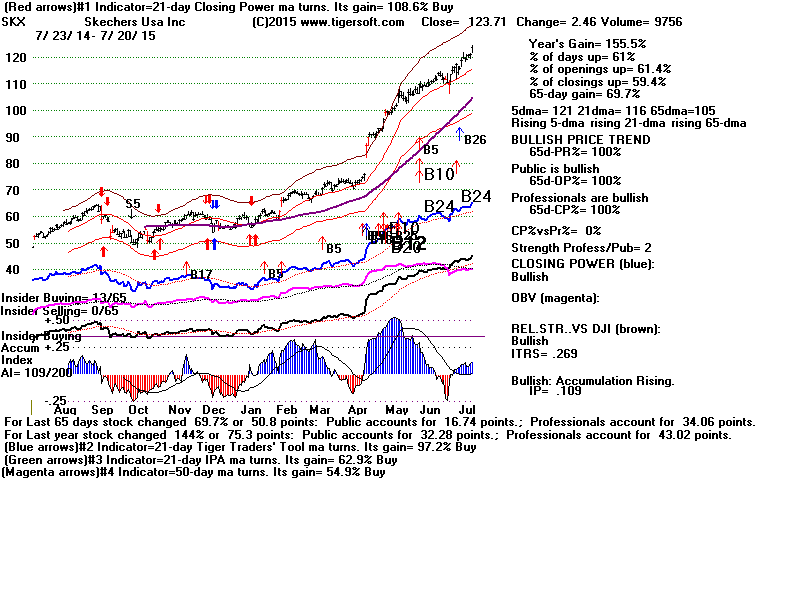
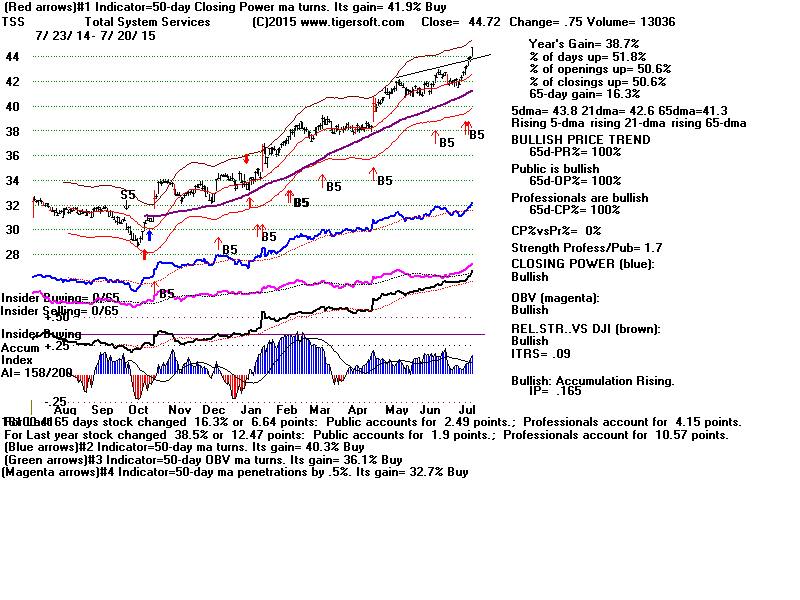
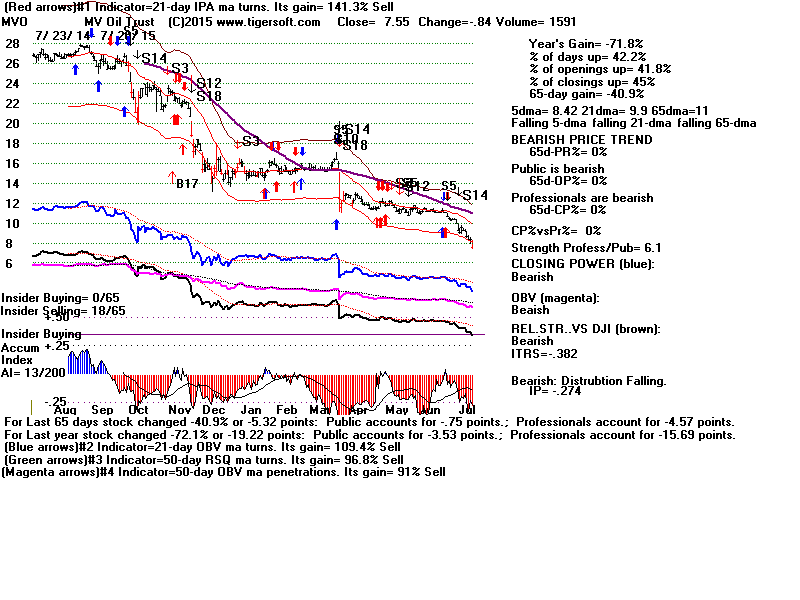
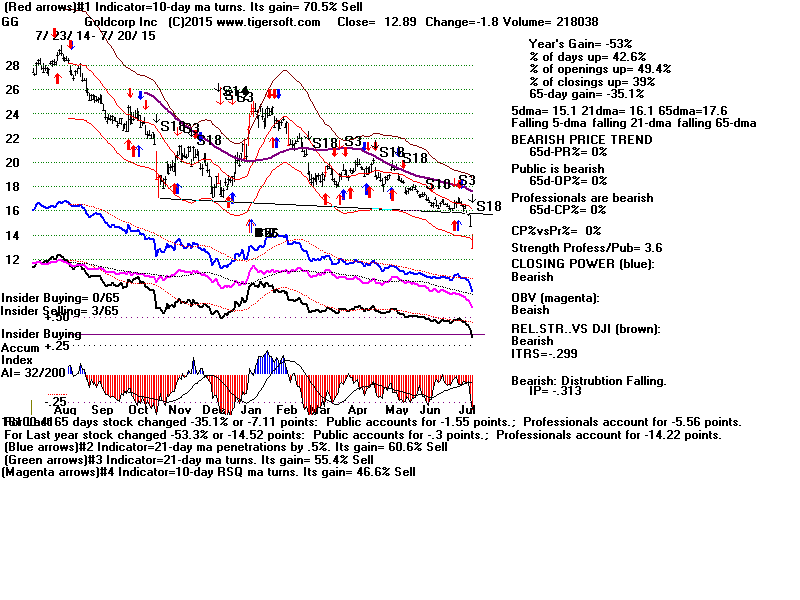
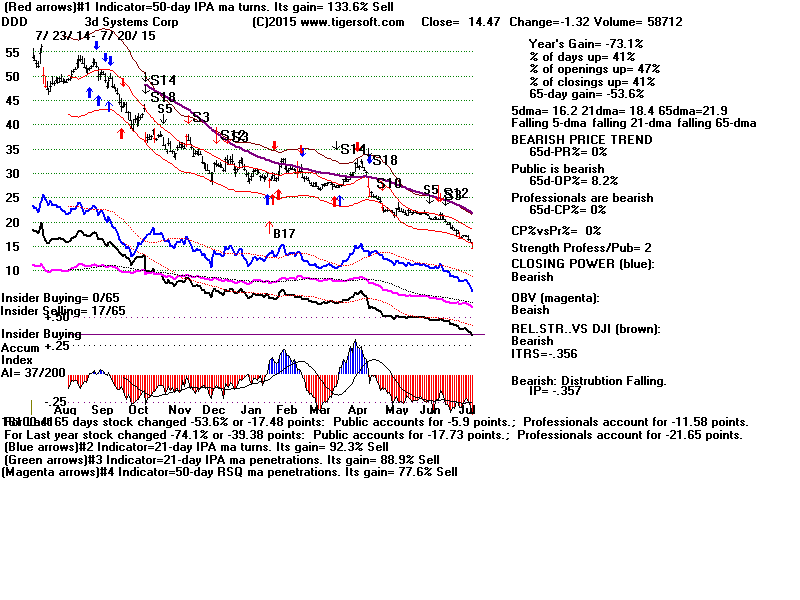
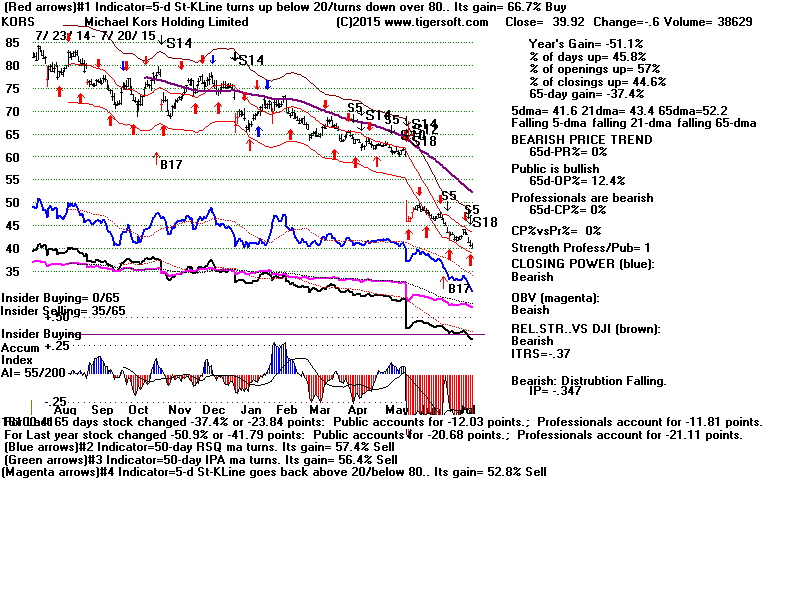
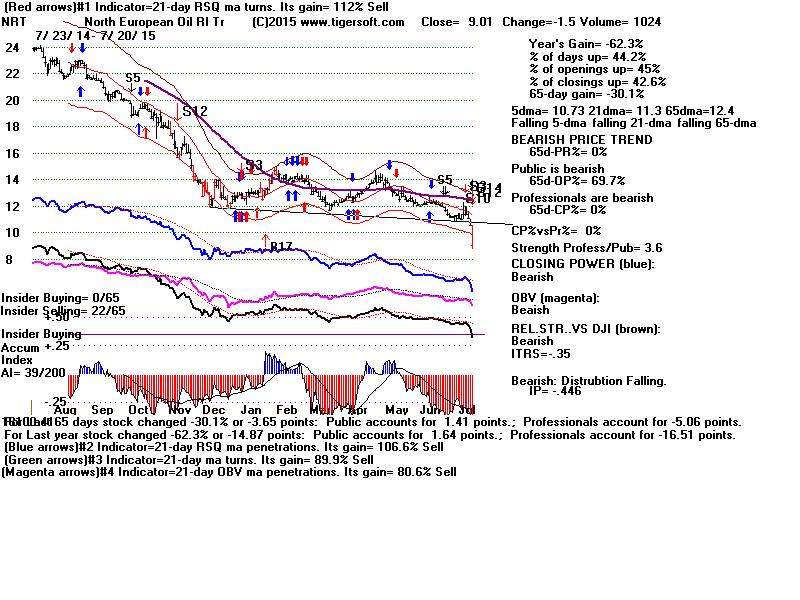
 7/20/2015 200+ TigerSoft Charts