TigerSoft and Peerless Daily Hotline  
   
(C) 1985-2015 William Schmidt, Ph.D.  www.tigersoft.com    
                 
All rights strictly reserved.  


Tiger Software  858-273-5900   PO Box 22784   San Diego, CA 92192 Email william_schmidt@hotmail.com  
------------------------------------------------------------------------------------------------------------------

    7/2/2014          Greeks vote "NO" to Extreme Austerity.


A complete Greek financial melt-down is apparently
                            what the markets have been warning us of.  This helps
                            explains all the bearish Red distribution, the Hourly
                            DJI's plunging OBV Line and the falling Closing Powers
                            and red Candle-Sticks.   

                            But now we also have to worry about a Chinese
                            stock market melt-down.  The big Head/shoulders
                            there is reminiscent of the head/shoulders in
                            the November 2007 Chinese market top.
                            (Google "Tigersoft" and "Chinese market top"
                            "November 27 2007" and you will see history repeating.)


                                                    This Could Be Bad...                        

                            I looked back at the level and amount of Red Distribution
                            in the DJI when the Stochastic-21-K-Line first turns
                            up.  One June 30th when the K-Line turned up IP21
                            (current Accumulation) for the DJI stook was a lowly
                            -.289.  There were no other cases since 1966 when the
                            IP21 was this low as the market seemingly tried to make
                            its first stand and have the Stochastic-21-K-Line turn
                            upwards
.  In fact, you have to go back to the tops of 1937,
                            1940 and 1941 to even find IP21 readings below -.210
                             in this circumstance in what still seemed like a bull market.
          .
                             This suggests to me that the recent rally attempt has
                             utterly failed and the DJI's support at 17500 will be sliced
                             right through.  Compare just below the 2011 chart with the 1937
                             chart.  I have posted red arrows where the Stochastic-21
                             K-Line has turned up from below 5, thereby showing the
                             first attempted rally as the markets started to collapse.

                                                       1937
                                                               2015

                                          What Will The Fed Do Now?  

                            Some very big investors and hedge funds in America
                            expected yet another Greek bailout.  They will be hit very
                            hard if the European Central Bankers keep telling
                            Greece to "drop dead", as some of the biggest bankers
                            did this weekend.
                            See  http://wolfstreet.com/2015/06/29/panicked-hedge-funds-now-praying-for-a-miracle-in-greece/
                                    
and my "
Uncharted Territory" below. 

                             Internals Remain Quite Weak despite the DJI's Relief Rally 

                            
After a long, artificial 76-month bull market, the appearance
                             of head and shoulders patterns in the DJI and SP-500 also take
                             on much more significance.  So does the pronounced and steady
                             pattern of selling by Professionals to the Public and
                             to overseas' buyers.  Always keep in mind that the TigerSoft SPY
                             candle-stickchart below shows Professional net buying/selling
                             while the Blue Line below and Public net buying/selling as the Red
                             Opening Power Line. 


         A bounce was expected.  But the new Peerless Red Sell S12 has not
         been reversed.  We need to see the following::
               1)  a break in the falling trend of the NYSE A/D Line;
                2) the DJI must start rising on higher volume hourly than when it falls;
                3) the key ETFs must end their 7-10 day pattern of closing below
                their openings. 
                4) the DJI's Accum. Index needs, at least, to rise back above its own
                21-dma
                5) and the bearish ratios of new lows and MINCPs to new highs and MAXCPs
                must end.

         In this environment - net bearish Professionals and heavy red distribution -
         most of our Bearish MINCPs keep falling.  Stay hedged with shorts in
         some of these.  Sell any ETF or stock that is below its 65-dma or has
         a falling Closing Power. Our QuickSilver approach tells us to short ETFS with
         both Closing Powers and Opening Powers falling when they rise back to their falling
         5-day ma or break major price support..   

         I would also hold short DIA as long as its Closing Power is falling or until Peerless
         gives a new Buy signal.   There are fewer and fewer attractive longs among our
         Bullish MAXCPs.  Here we want to try to buy those that have just broken their
         Closing Power downtrends if they have recently shown a bulge of Accumulation
         and have just successfully tested their 65-dma. 


                       Bearish Statistics on 65-Day MA Support/Resistance

 
                                                Tiger's New Charting Tool:
                            The Percentage of all stocks above the support of the 65-dma.


                             The oscillator above shows that 66.4% of all stocks are still
                             below the resistance of their 65-dma   This statistic worsened
                             on Wednesday, despite the usual bullishness of the day before
                             the start of the July4th holiday weekend. 
                                   
                                           7/3/2015              
                   Index/Sector        Pct.of Stocks
                                              above 65-dma.
                                            today .... yesterday  
                   -----------------------------------------------------------------------------------------------
                   DJI-30             20.0%         23.3%   http://www.tigersoftware1.com/HH/MASTDOWJ.GIF
                   SP-500            34.0%         35.0%     http://www.tigersoftware1.com/HH/MASTSP50.GIF         
                   QQQ               32.7%         35.7%    http://www.tigersoftware1.com/HH/MASTNASD.GIF
                   Russell-1000    36.7%         37.1%    http://www.tigersoftware1.com/HH/MASTRUS-.GIF
                   OEX                34.7%         36.7%    http://www.tigersoftware1.com/HH/MASTSP-1.GIF
                   All Stocks        33.6%         34.8%    http://www.tigersoftware1.com/HH/DATA65.GIF


           The DIA, SPY, QQQ, IWM and IBB show similar patterns in that they have
           falling Closing Powers and 5-dma, but their Opening Powers are all rising.
           The large number of days that they have had red candle-stick charts (i.e. that
           they closed below their openings) is certainly a warning that Professionals
           are selling to the Public and that higher Openings are being bid up by overseas
           buyers and market makers who absorbed a lot of stock on the recent decline
           and want to even out their positions.  In addition, these 5 first ETFs below have each
           rallied up fairly closely to resistance that must be expected at their falling
           5-dma.  Monday they will bearishly turn back down from their 5-day pivot
           points despite the bullish seasonality of the 4th of July period.   In the present
           context, this looks quite bearish, especially if red down-day volume picks up in a really
           big way.

                              7/2       Pivot-P  IP21  Comments
       ----------------------------------------------------------------
                  DIA    177.4   178.65  -.225  6 straight Red Candlestick days.
                                                                Cover when CP downtrend is broken.
                       http://www.tigersoftware1.com/HH/DIA.GIF   
                  SPY    207.5   209.86  -.157  8 straight Red Candlestick days
                       http://www.tigersoftware1.com/HH/SPY.GIF 
                  QQQ  107.92 110.00  -.117  6 straight Red Candlestick days.
                        http://www.tigersoftware1.com/HH/QQQ.GIF
                  IWM  125.23 127.85 
+.159 6 straight Red Candlestick days.
                        http://www.tigersoftware1.com/HH/IWM.GIF
                  IBB     369.9   375.84
+.199  Needs to get back above 370 breakout point
                        http://www.tigersoftware1.com/HH/IBB.GIF

                  The most bearish Bearish Big ETFS show "Both Down" condition (opening and closing
                  power falling) and a falling 5-dma. They should be shorted at their falling 5-dma
                  and covered by traders when they reach the first lower band. See charts below.
                  This process can profitably be continued until their 5-dma turns up.

                                  7/2   Pivot    IP21
                 
OIH      33.87   35.23  -.251                 
                  KOL    
11.24  11.53   -.528

                                            STOCK RED SELLS

                 
In looking for new stocks to sell short, look also at the REDSELL download.
                  This has stocks that have shown steadily red (negative) Accumulation for the last
                  3 months.  View them with Tiger CandleStick charting to see their Closing Power
                  downtrend.  Hold the most bearish in this group until their Closing Power
                  breaks its downtrend.  The Opening Power will only turn down when the
                  Public finally turns bearish.  This condition will often bring a climactic sell-off.
                  See the most bearish of these below.


                                              Greece Goes into an
                           Uncharted Territory

                                         and with It, So Does The Euro.
 
                            Can the US markets escape a likely downturn in Europe.
                            Unless Bankers from Brussels back down and
                            extend new loans to Greece, the EURO-Zone will
                            lose a member for the first time.  This has no precedent.
                            No one knows for sure what will follow.  Markets do
                            do not like certainty. 

                           Will other countries be tempted to follow Greek's example? 
                           Will other countries hold votes on their own outside-imposed
                           austerity?  What will the bankers do in that case?

                           Immediately ahead, if the Brussels' Bankers do nothing to help
                           Greece get more money into its banks very quickly, the Greek government
                           will need quickly to create its own currency, backed by its
                           own taxes and tariffs.  The Greek government then will need to
                           take over its banks and try to prevent money from getting out of
                           the country. It's not clear that the Greek government is prepared to
                           do these things.  They are still hoping that the Greek 'NO' vote will
                           change their bargaining position vis-a-vis Brussels' Bankers and
                           Greece will get more international loans.  That may be a false hope.
                           Many of Northern Europe's big bankers want to punish Greece
                           for challenging their authority and let Greece suffer the consequences
                           of its refusal to accept colonial status.


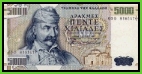
                           Re-Introducing the Drachma will not be easy.  See this article.
                           http://www.bloomberg.com/news/articles/2015-07-04/printing-the-drachma-the-messy-future-of-a-post-euro-greece  

                           Greece should be watched closely.  Will its government be
                           forced to create its own currency?  If Greece can repair its economy
                           with a devalued Drachma, by thereby encouraging foreign tourism,  
                              
                           Greek ship-building and exports, will other countries (Portugal,
                           Spain, Italy) be tempted to leave the Euro?  In that case,
                           billions in big bank loans may be defaulted on.  A bankers' panic
                           will ensue.  Interest rates will go up and money will become tighter.  


 wpe1A2.jpg (46062 bytes)   7/2/2015   150+ TigerSoft Charts
                                    Go to http://tigersoftware1.com/HH/ to see them.
                   I also want to encourage you to run our software.  I can load
                   the latest version of Tiger and Peerless in a fast Dell XP laptop
                   and send it to you for only $160.  You can then get the data
                   from me for $175/year or use TC-2000 for $30/month.  Unfortunately,
                   they do not provide the necessary data to run Peerless.  That
                   data would have to be put in by hand.)

New Highs: NASD 12         NYSE  16   
New Lows:  NASD 46         NYSE  55   
                                                 
11 -13       Bullish MAXCPs  http://www.tigersoftware1.com/MAXMIN/7-2/bullish.htm


236           Bearish MINCPs -  http://www.tigersoftware1.com/MAXMIN/7-2/bearish.htm

                 The great plurality of Bearish MINCPs over Bullish MAXCPs
                 warns that Professionals are still bearish many more stocks
                 than they are  bullish.  There is little point in trying to pick a
                 winner on the long side now. 
            History of New Extended Red Sell S12s

          1929  June - bad Sell: failure after price breakout (late Summer rally)
                    3.4% loss - reversed 6 days later by Buy B4.
                    Note DJI was essentially unchanged from what it was 65-days before
                    and showed an OBVPct of +.156.
                    This signal was redundant, as there already was a regular Sell S12.


          1929 September 5- perfect Sell just before Crash! BIG DECLINE
                    +43.3% gain
                   LA/MA = 1.013  PI=-26  IP21= -.109  VI= -454  OBVPct = .112  
                   DJI was up 19% above its level of 65-days before.
                   This signal was redundant, as there already were a variety of Peerless Sells.

          1932  November 7 -  premature Sell  64.6 ---> 68.0 ---> 55.9 BIG DECLINE
                  +9.0% gain
                   LA/MA = 1.046  PI=-41  IP21= -.079  VI= -156  OBVPct =  - .069 
                   DJI was up 8.3% above its level of 65-days before.
                   This signal was not as good as the perfect Sell S2 right at top.

          1936 April 2 -
perfect Sell    BIG DECLINE
                  +6.7% gain
                   LA/MA = 1.026  PI=-27  IP21= -.089  VI= -231  OBVPct =  + .198 
                   DJI was up 11.3% above its level of 65-days before.
                   This signal was redundant, as there already were a variety of Peerless Sells.

          1936 October 7 - bad Sell. but A/D Line was weak until end of 1936 and this
                   was right after a
perfectly flat-topped breakout.
                   LA/MA = 1.034  PI=-14  IP21= -.051  VI= -105 
OBVPct =  + .253 (too high?)
                   DJI was up 12.2% above its level of 65-days before.

          1959 December 31 -
perfect Sell BIG DECLINE
          1963 December 4 - bad Sell.
                  
Early December is not usually a good time to sell short.
                   LA/MA = 1.015  PI=-58  IP21= -.066  VI= -577  OBVPct =  + .028
                   DJI was up 4.0% above its level of 65-days before.

          1964 June 19 -bad Sell.   - 823 ---> 851 ---> 833 and then up strongly.
                   The loss here would have been small using Peerless.
                   It would have been 2.5% based on Peerless Buy B10 on 6/17/2015

                   LA/MA = 1.011  PI=-11  IP21= -.108  VI= -317  OBVPct =  - .006
                  
DJI was only up 0.8% above its level of 65-days before.    

          1965 April 12 - premature Sell - 906 ---> 939.6 ---> 840  
          1967 April 18 - premature Sell - 873 ---> 909 ---> 847

          1972 August 2 - premature Sell - 944 ---> 970.35 ---> 921.66
          1998 June 29 - premature Sell - 8997.36 ---> 9337.97 ---> 7539.07 BIG DECLINE
          2000 August 7 - premature Sell - 10867 ---> 11311 ---> 7539   BIG DECLINE
          2012 December 5 - premature Sell - 13034 ---> 13351 ---> 12938

          2015 May 19 -
  LA/MA = 1.013  PI= 13  IP21= -.008  VI= -48  OBVPct = .115  
                   DJI was up 1.5% above its level from 65-days before.  


  ------------------------     Announcements --------------------------------    

       E-Books
                                   1  The On-Line Explosive Stocks
                               
2   The On-Line Killer Short Sales book
                                       Purchase each all new book by CC for $42.50 or send a check for $37.50 to me.

                   
  I call your attention now to the many new concepts and
                     the     considerable new research in them:
  For example:
                                   1) A very good New Tiger Buy B12 for Low Priced Stocks
                                   2) After Red high volume reversal days use CP uptrend-breaks.
                                   3) Buy the stocks the Federal Govt wants you to buy. 
                                   4) 100-Day Power Rankings... 
                                   5) Using Closing Power Hooks after Buy B26s and B20s.
                                   6) How A Stock Reacts to Its Earnings Report Is Very important.
                                   7) TigerSoft Major Buy Signals' Combinations
                                           Which are most Powerful? Reliable?
                                   8) Augmented Buy B20s' Independent Success Rate.
                                   9) What factors warn a rising 65-dma will not hold?
                                 10) The classic cluster of  technical characteristics that commonly appear
                                        in the 23 stocks falling 70% or more in the deep pullback of 2011.
  
   ----------------------------------------------------------------------------------------------------------------------------------------------------------------------------

                      
   PEERLESS STOCK MARKET TIMING:

           A Guide To Profitably Using The Tiger Nightly HOTLINE

       
   Peerless Signals: 1915-2014     
             New   Peerless Signals and DJI Charts  - version 7/4/2013
               1965  1965-6    1966   1966-7    1967    1967-8    1968   1968-9   1969         1969-70   1970      1970-1 1971
               1971-2  1972  1972-3       1973   1973-4   1974        1974-5     1975   1975-6        1976    1976-7        1977 1977-1978
              1978  1978-79        1979   1979-80   1980    1980-1   1981    1981-2   1982     1982-1983        1983    1983-1984
              1984  1984-1985 1985 1985-1986       1986  1986-1987  1987    1987-8  1988 1988-9   1989    1989-90
              1990  1990-1  1991   1991-2  1992   1992-3    1993   1993-4   1994   1994-5   1995        1995-1996   1996
              1996-7       1997      1997-8    1998    1998-1999   1999    1999-2000   2000         2000-1   2001   2001-2   2002
              2002-3       2003   2003-4    2004   2004-5        2005   2005-6    2006    2006-7    2007    2007-8    2008    2008-9
              2009         2009-10       2010    2010-11    2011    2011-12        2012        2012-2013       2013    2013-4    2014

                        Introduction to Tiger/Peerless Buys and Sells.
                     Different Types of TigerSoft/Peerless CHARTS, Signals and Indicators
                 How reliable support is the DJI's rising 200-day ma? 

          -------------------------------------------------------------------------------------------------------------------
                       TIGERSOFT SIGNALS AND INDICATORS:
             Documentation for TigerSoft Automatic and Optimized Signals.
                 SPY Charts since 1994: Advisory Closing Power S7s, Accum. Index, 65-dma, Optimized Signals.
                  "The Jig Is Up": Calling September and October Tops.
                 A Keynesian's Warning Signs.
                 NUGT since 2012: A study of Tiger Technicals
                 Tiger Day Traders Tool and most active Triple Leveraged ETFs
                 Advisory Pink Closing Power S7s at ETF at top since 1994
                              1994   1996  1997  1998  1999        2000 QQQ   SPY
                              DIA       2002      2007       2008       SPY 2011 2013-2014


                 Tiger Buy and Sell Signals: New 2014 Research:
                      These are randomly chosen groups.
                       but clearly we need to back-test them in more years.
                       You can replicate or do similar studies yourself
                       for other signals and/or other years.

                  9/1/2014 - 2014 Tiger B19s - Steady rallying and no pullbacks below the 21-day ma.
                       9/2/2014 - 2014 Tiger B17s on 14As taken alphabetically
                       9/3/2014 - 2014 Tiger B17s on 60 Biotechs taken alphabetically

                 9/4/2014 - 2014 Tiger B18s on all "R" stocks taken alphabetically
*                   9/8/2014 - 2014 Tiger B20s     - Conclusion: Use Closing Power trendbreaks in aftermath.
                 9/8/2014 - 2014 Tiger B16s - Conclusion: Use mostly when LA/MA under 1.05.
                   9/11/2014 - 2014 Tiger B15s - Conclusion: Certain conditions improved the results dramatically.
                 9/12/2014 - 2014 Tiger B25s - Conclusion: 87.5% success rate when other internals are positive.
                
9/15/2014 - 2014 Tiger B25s - Best conditions for using B25s with somewhat higher RSX capitalization stocks.  
                
9/16/2014 -  New Tiger Closing Power Take-Off Buy Signal in 2014:  14s, QQQ, DJI-30 and ETFs
                
9/17/2014 - New Tiger Closing Power Take-Off Buy Signal: 2009A-s
                
9/18/2014 - New Tiger Closing Power Take-Off Buy Signal: 2010A-s
                
9/21/2014 - New Tiger Augmented Sell S8s: DJI-30 - 2014
                                                       Requiring S8s to show Negative CP%-Pr and IP21<+.15 produced a 70% success rate
                                                       in a rising market for DJI-30 stocks and big ETFs.

                
9/24/2014 - Tiger Sell S14s: They make price  breakdowns very bearish.
               
1/15/2015 - Tiger Day Traders' Tool Explained.
                                         
   http://www.tigersoft.com/day-traders/index.html  
                                                           http://www.tigersoft.com/Indicators/index.htm     
                                                           http://www.tigersoftware.com/TigerBlogs/Aug-31-2009/index.html   
              NEW   2/16/2015     
                          1) New - Tiger Charts showing UP%, Opening-Up%, Closing-Up% 
                                               Note differences between bullish and bearish stocks...
                        2) New - UP%, Opening-Up%, Closing-Up% Rankings of any directory.
                        3) New - Display of what happens to a stock after various size openings up or down.
                        4) New - 6-month charts to better show volume changes and 5-day ma with bands.
                                      More profitable trading schemes coming...
 
                   Targeted Trading Opportunities:The Profits Quickly Add Up,
               
3/29/2015   Tiger CandleSticks: IBB: 2001-2015 and Recent Others.
====================================================================================
                                 
Earlier Hotlines  2-7-2014 to 3/19/2014
                                 
11-22-2014 to 2-6-2014
                                  http://tigersoftware.com/555HL555/index.htm
10/9/2014 - 11/21/2014
                                  http://tigersoftware.com/9933Hot/ 
9/2/2014   - 10/8/2014-
                                  http://tigersoftware.com/2233HL/index.html     
6/25/2013-9/1/2014
                                  http://tigersoftware.com/112211-H/index.htm
11/22/2013-3/20/2014
                                  http://tigersoft.com/1111-HL/index.html        
10/22/2013-11/21/2013
                                  
Past Hotline Predictions    http://tigersoft.com/-HL42013/index.html           
                                                                                                       http://www.tigersoft.com/-2GBL13HL/index.htm   
==============================================================================================================================