TigerSoft and Peerless Daily
Hotline
(C) 1985-2015 William Schmidt,
Ph.D. www.tigersoft.com
All rights
strictly reserved.
Tiger Software
858-273-5900 PO Box 22784 San Diego, CA 92192 Email
william_schmidt@hotmail.com
------------------------------------------------------------------------------------------------------------------
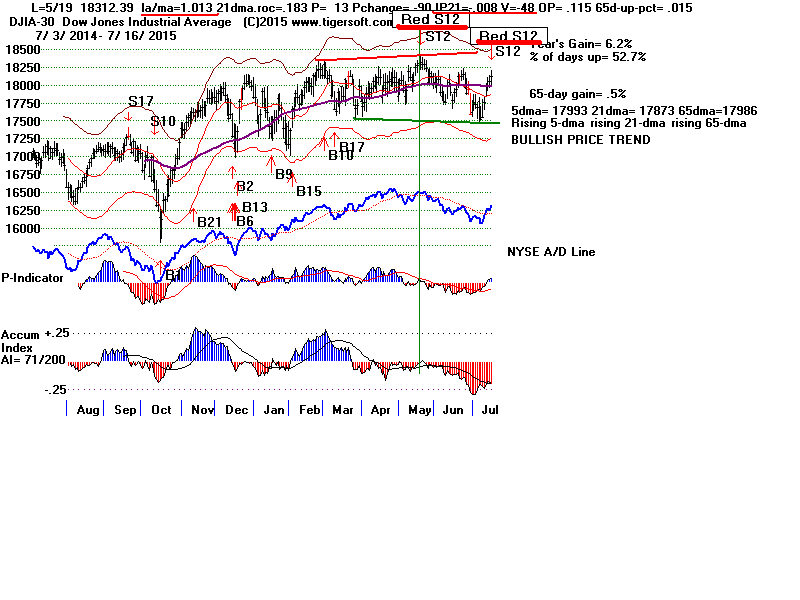
7/16/2014 Peerless gave a new
Red Sell S12* signal today but the QQQ
broke out above flat resistance and would seem to now have a
clear path to 119, from back in March 2000. The QQQ strength
is even more impressive when we take into consideration that
a number of QQQ semi-conductors were quite weak today.
There is a good chance that the QQQ and IBB will keep advancing
while the DJI stalls here for the next month and possibly re-tests 17500.
QQQ and IBB strength while the DJI falls back would match what happened
in early 2000 and in 2007-2008. I can't recommend buying QQQ,
however. See how its Closing Power is lagging prices and how
negative the IP21 still is.
Sell short some of the Bearish MINCP stocks or wait until this
weekend when I will present a new way to rank the most bearish
Leveraged ETFs based on their 5-day ma ROC's.
A DJI Retreat to 17500 Seems Likely,
The new Red Sell S12* signal occurs when the DJI closes 1.1% to 2.6%
above the 21-day ma with the Accum. Index below .02 for each of
the last 50 trading days. It is a rare signal, but it helps us guard
against a market top occurring without the DJI reaching at least
the 2.0% upper band. We want a way now to deal with narrowing
DJI volatility. The problem with narrowing volatility occurs because
90% of the Sell S9s and normal S12s take place with the DJI above the
2% band. (The other 10% of S9s and normal S12s do occur between
the 1.1% and 2% band. But nearly all of these take place in January
and September.)
Since 1965, none of these Red S12* signals brought a decline of more
than 4.4%. It may help to note that there have been 5 regular S12s in July.
They gained an average 7.0% by selling short and covering at the next Buy
signal. Only one of these took place in the year before a Presidential
Election and it gained only 1.9%.
Past Cases of New Red Sell S12*
signals
la/ma P-I IP21 V-I
OPct Subsequent Comments
Gain
------------------------------------------------------------------------------
1. 9/5/1929 1.013 -26 -.109 +454
+.112 43.5%
Crash immediately followed.
2. 4/4/1934 1.015 +5 -.03
-15 +.044
11.0% Steep decline immediately followed.
3. 4/2/1936 1.026
-27 -.289 -231
+.169 6.7%
Decline immediately followed.
4. 1/5/1960 1.018 -4 -.068
-170 +.099 4.4%
Small paper loss.
5. 4/13/1965 1.013 +14 -.040 -252
+.098 4.4%
Small paper loss.
6. 4/19/1967 1.013 +28 -.058 +1
+.076 -0.1%
Small paper loss
7. 8/2/1972 1.019 -79 -.067 -2
-.156 2.0%
Small paper loss
8. 5/19/2015 1.013 +13 -.008 -47
+.115 4% decline Immediate decline.
9 7/16/2015 1.014 +79 -.193 -129
+.116 ?
Considering the DJI's behavior after new Sell S12*s since 1960,
it seems likely that the DJI will remain stuck in its17500-18200
trading range
and
stay
between the narrow +2% and -2% bands around the 21-day ma.
There is every indication that the FED will respond quickly once
again to curb a bigger decline.
Other Supporting Evidence for A Decline
For some time, we've been pointing out the weakness in the DJI's internals.
I have also said that it takes a lot of such weakness to reverse a bull market
of this length in time. Still, bearish weakness like we are now seeing is
cumulative. Eventually, the market will have a fall back.
I keep saying that jumps at the openings should not comprise such a high
percentage of the DJI gains. In addition, the Hourly DISI-OBV is too
weak,
I think, to permit a Summer take-off for most stocks.
Exceptions may be biotechs and well know high techs, like those that rose
sharply
today in the QQQ's breakout; namely, AMZN (+ 14.29, today), GOOG (+19.63)
and NFLX (17.68). Breadth was much better today, but the IP21 and
V-I are so low, if the DJI were to gain 125 more points, would
almost certainly
get a classic Peerless Sell S12 and a Sell S9v. The IP21
now stands
at a very negative
-.193 and the V-I is - 129.
HOURLY DJIA and Peerless DJI chart
 |
The Biotech ETFs, IBB and BIIB again made new all-time highs again
today. The resolution of the Greek finance crisis was on the terms|
of the big bankers, who were backed up by the EURO and
American banks. This successful show of strength was not
lost on Wall Street. Not surprisingly, FAS made good gains.
 7/16/2015 200+ TigerSoft Charts
Go to
http://tigersoftware1.com/HH/ to see them.
New Highs: NASD 102
NYSE 85
New Lows: NASD 52
NYSE 80
47 Bullish MAXCPs HZNP, ANCR, JKHY,
FOLD, NWBO (graphs are not shown tonight.)
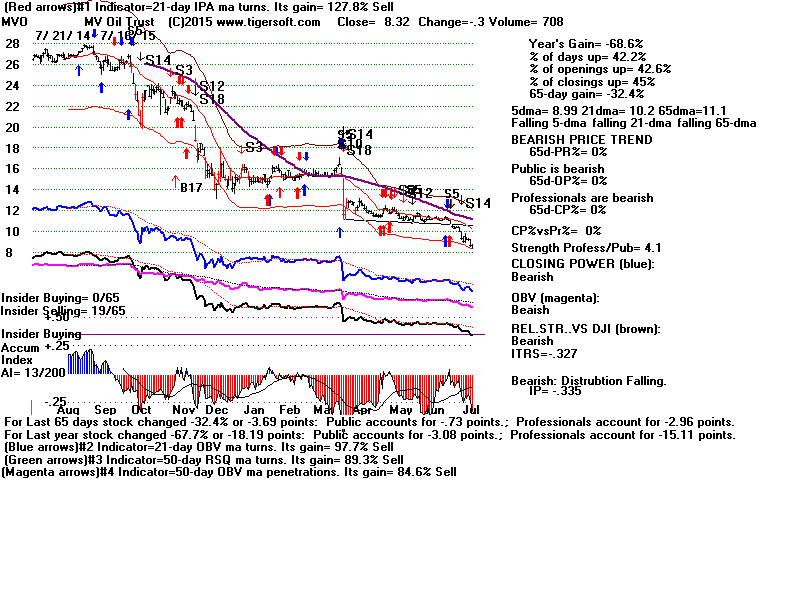
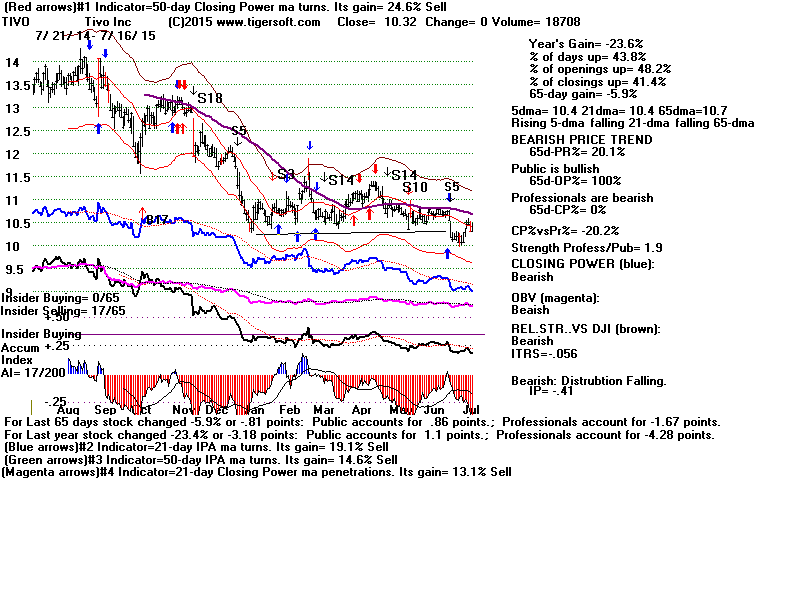
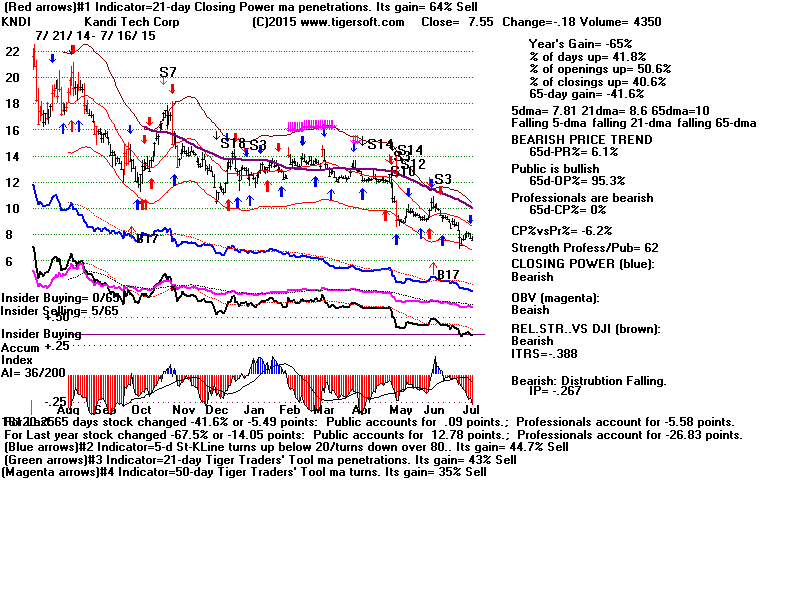
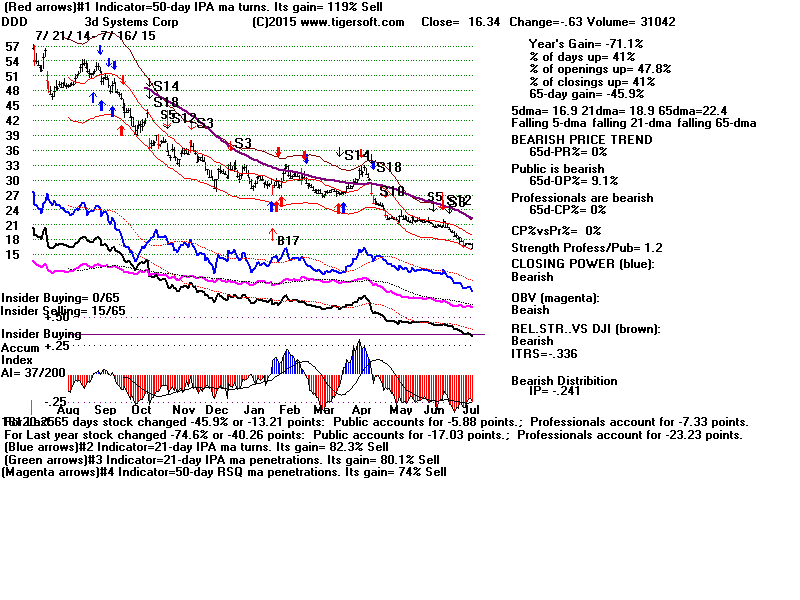
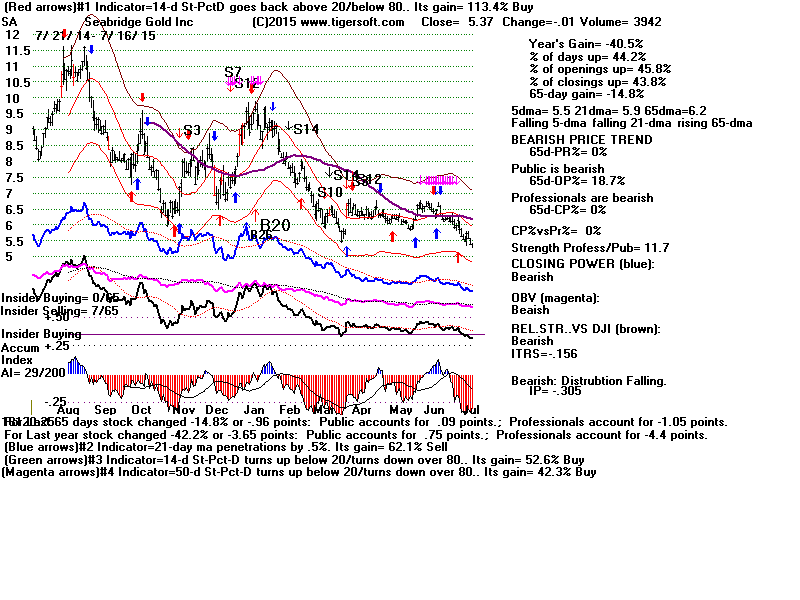
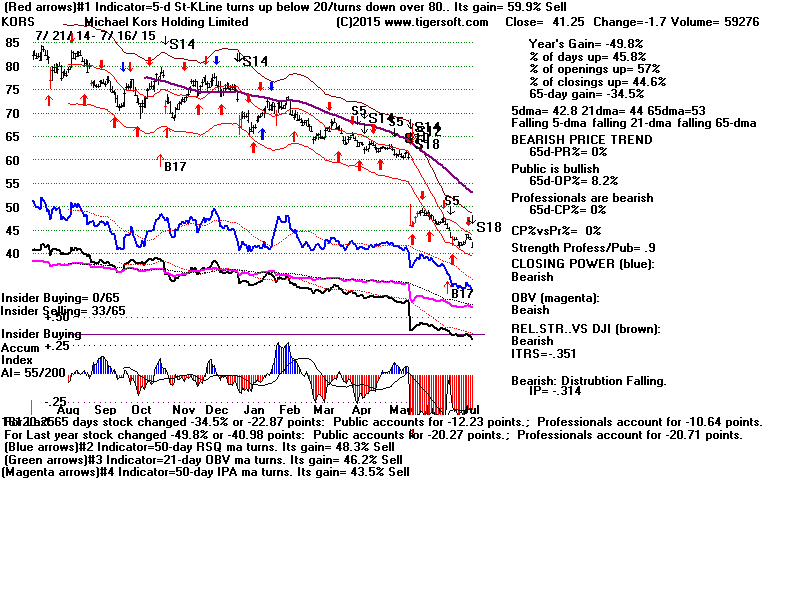
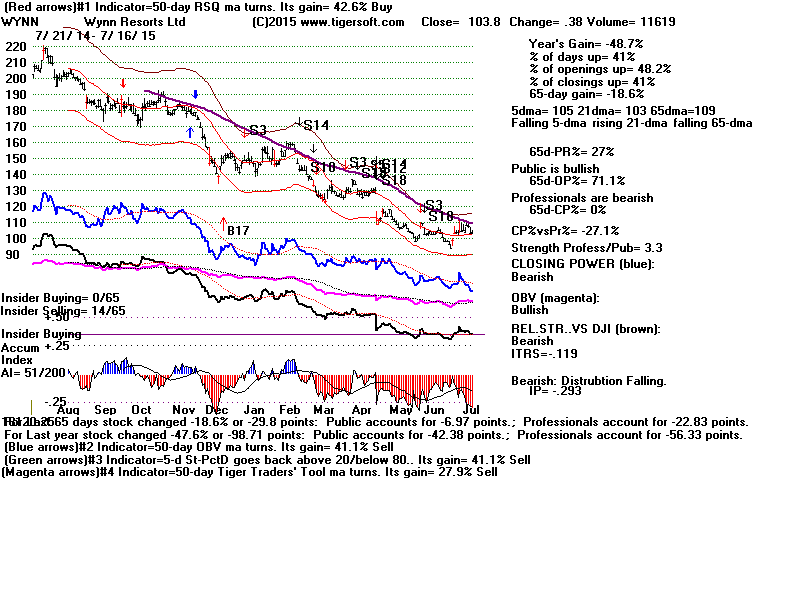
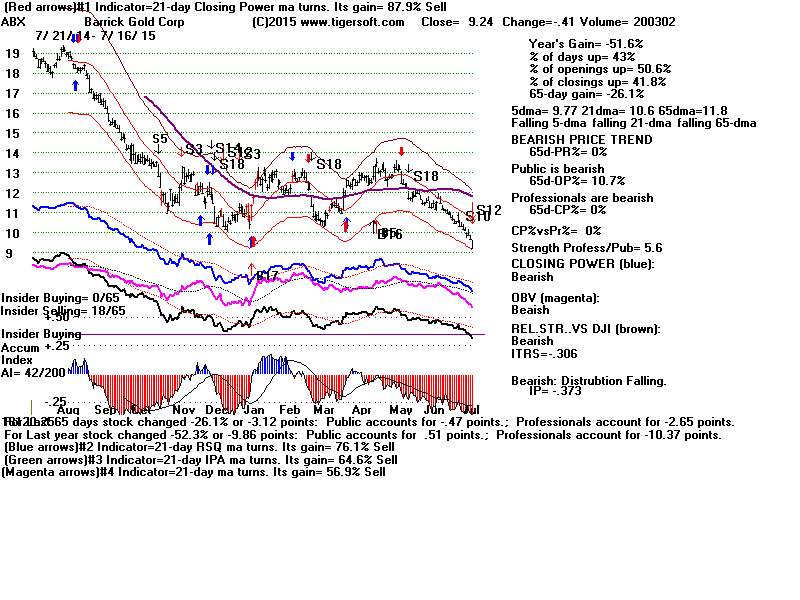
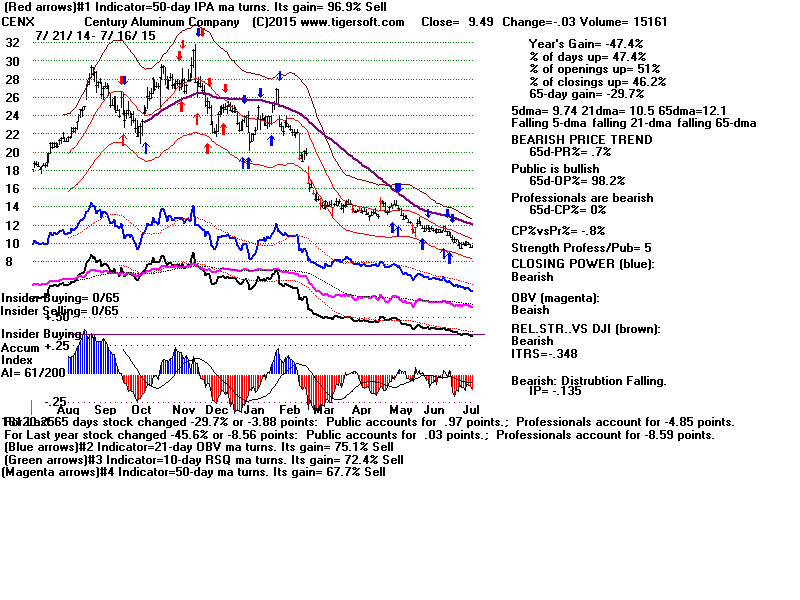
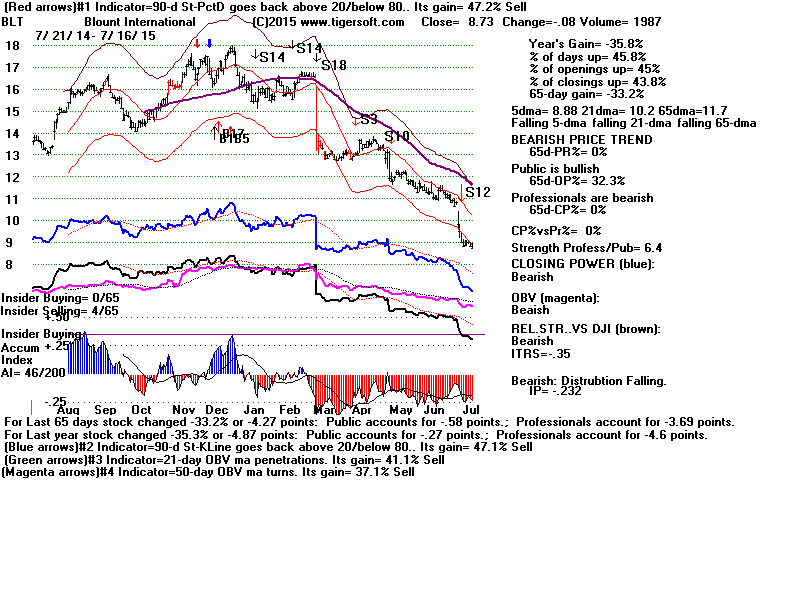
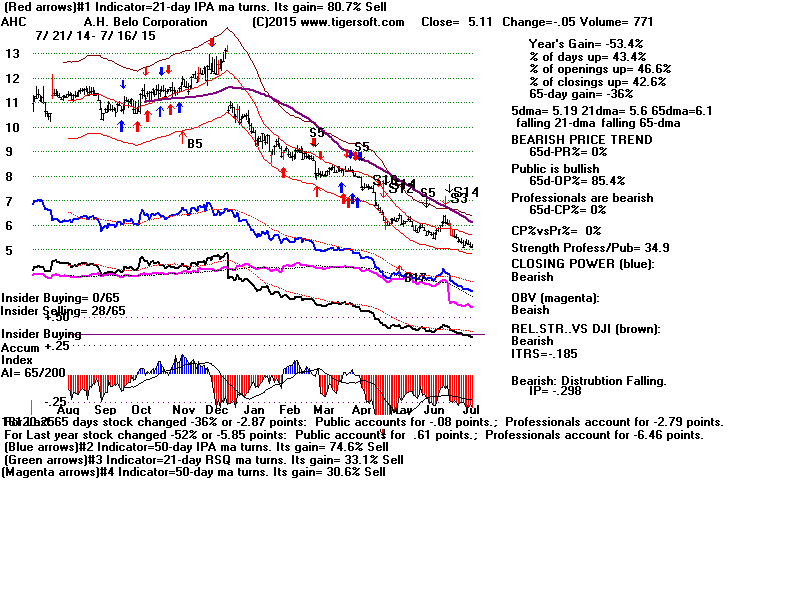
222 Bearish MINCPs
MVO 8.32 -.30, TIVO 10.22,
KNDI 7.55 -.18
DDD 16.34 -.63, SA 5.37 -.01,
KORS 41.25 -1.7,
WYNN 103,8 +.38, ABX 9.24, CENX 9.89
-.03
BLT 8.73 AHC 5.11 -.75
See charts just below
|
------------------------
Announcements
--------------------------------
E-Books
1
The On-Line Explosive Stocks
2
The On-Line Killer Short
Sales book
Purchase each all new book by CC for
$42.50 or send a check for $37.50 to me.
I call your
attention now to the many new concepts and
the considerable new research in them:
For example:
1) A very good New Tiger Buy B12 for Low
Priced Stocks
2) After Red high volume reversal days use CP
uptrend-breaks.
3) Buy the stocks the Federal Govt wants you
to buy.
4) 100-Day Power Rankings...
5) Using Closing Power Hooks after Buy B26s
and B20s.
6) How A Stock Reacts to Its Earnings Report
Is Very important.
7) TigerSoft Major Buy Signals' Combinations
Which are most Powerful? Reliable?
8) Augmented Buy B20s' Independent Success
Rate.
9) What factors warn a rising 65-dma will not
hold?
10) The classic cluster of technical
characteristics that commonly appear
in the 23 stocks falling 70% or more in
the deep pullback of 2011.
----------------------------------------------------------------------------------------------------------------------------------------------------------------------------
PEERLESS STOCK MARKET TIMING:
A Guide To
Profitably Using The Tiger Nightly HOTLINE
Peerless Signals: 1915-2014
New Peerless Signals and DJI Charts - version 7/4/2013
1965
1965-6 1966
1966-7 1967
1967-8 1968
1968-9 1969
1969-70
1970
1970-1
1971
1971-2 1972
1972-3
1973 1973-4
1974
1974-5 1975
1975-6
1976 1976-7
1977
1977-1978
1978
1978-79
1979 1979-80
1980 1980-1
1981 1981-2
1982 1982-1983
1983 1983-1984
1984
1984-1985
1985
1985-1986
1986 1986-1987
1987 1987-8
1988
1988-9 1989
1989-90
1990
1990-1 1991
1991-2 1992
1992-3 1993
1993-4 1994
1994-5 1995
1995-1996
1996
1996-7 1997
1997-8 1998
1998-1999 1999
1999-2000 2000
2000-1
2001 2001-2
2002
2002-3 2003
2003-4 2004
2004-5
2005 2005-6
2006 2006-7
2007 2007-8
2008 2008-9
2009
2009-10
2010 2010-11
2011 2011-12
2012
2012-2013
2013 2013-4 2014
Introduction to Tiger/Peerless Buys and Sells.
Different Types
of TigerSoft/Peerless CHARTS, Signals and Indicators
How reliable support is the DJI's rising 200-day ma?
-------------------------------------------------------------------------------------------------------------------
TIGERSOFT SIGNALS AND INDICATORS:
Documentation for TigerSoft
Automatic and Optimized Signals.
SPY Charts since 1994: Advisory Closing Power S7s, Accum. Index, 65-dma,
Optimized Signals.
"The
Jig Is Up": Calling September and October Tops.
A Keynesian's Warning Signs.
NUGT since 2012: A study of Tiger Technicals
Tiger Day
Traders Tool and most active Triple Leveraged ETFs
Advisory Pink Closing Power S7s at ETF at top since 1994
1994
1996
1997
1998
1999
2000 QQQ
SPY
DIA
2002
2007
2008
SPY 2011
2013-2014
Tiger Buy and Sell
Signals: New 2014 Research:
These are randomly chosen
groups.
but clearly we need to back-test them in more years.
You can replicate or do similar studies yourself
for other signals and/or other years.
9/1/2014 -
2014 Tiger
B19s - Steady rallying and no pullbacks below the 21-day ma.
9/2/2014 -
2014 Tiger
B17s on 14As taken alphabetically
9/3/2014 -
2014 Tiger B17s on 60
Biotechs taken alphabetically
9/4/2014 -
2014 Tiger
B18s on all "R" stocks taken alphabetically
* 9/8/2014 -
2014 Tiger
B20s - Conclusion: Use Closing Power trendbreaks in aftermath.
9/8/2014 -
2014 Tiger
B16s - Conclusion: Use mostly when
LA/MA under 1.05.
9/11/2014 -
2014 Tiger
B15s - Conclusion: Certain conditions
improved the results dramatically.
9/12/2014 -
2014 Tiger
B25s - Conclusion: 87.5% success rate
when other internals are positive.
9/15/2014 -
2014 Tiger B25s -
Best conditions for using B25s with somewhat
higher RSX capitalization stocks.
9/16/2014 -
New Tiger
Closing Power Take-Off Buy Signal in 2014: 14s, QQQ, DJI-30 and ETFs
9/17/2014 -
New Tiger
Closing Power Take-Off Buy Signal: 2009A-s
9/18/2014 -
New Tiger
Closing Power Take-Off Buy Signal: 2010A-s
9/21/2014 -
New Tiger
Augmented Sell S8s: DJI-30 - 2014
Requiring S8s to show
Negative CP%-Pr and IP21<+.15 produced a 70% success rate
in a rising market for
DJI-30 stocks and big ETFs.
9/24/2014 -
Tiger Sell
S14s: They make price breakdowns very bearish.
1/15/2015
-
Tiger Day
Traders' Tool Explained.
http://www.tigersoft.com/day-traders/index.html
http://www.tigersoft.com/Indicators/index.htm
http://www.tigersoftware.com/TigerBlogs/Aug-31-2009/index.html
NEW
2/16/2015
1) New -
Tiger Charts showing UP%, Opening-Up%, Closing-Up%
Note differences between bullish
and bearish stocks...
2) New -
UP%,
Opening-Up%, Closing-Up% Rankings of any directory.
3) New -
Display of what happens to a stock after various size openings up or down.
4) New -
6-month charts to better
show volume changes and 5-day ma with bands.
More profitable trading schemes coming...
Targeted Trading Opportunities:The Profits Quickly Add Up,
3/29/2015
Tiger CandleSticks:
IBB: 2001-2015
and
Recent Others.
====================================================================================
Earlier Hotlines
2-7-2014 to 3/19/2014
11-22-2014 to 2-6-2014
http://tigersoftware.com/555HL555/index.htm
10/9/2014 - 11/21/2014
http://tigersoftware.com/9933Hot/
9/2/2014 - 10/8/2014-
http://tigersoftware.com/2233HL/index.html
6/25/2013-9/1/2014
http://tigersoftware.com/112211-H/index.htm
11/22/2013-3/20/2014
http://tigersoft.com/1111-HL/index.html
10/22/2013-11/21/2013
Past
Hotline Predictions
http://tigersoft.com/-HL42013/index.html
http://www.tigersoft.com/-2GBL13HL/index.htm
==============================================================================================================================