TigerSoft and Peerless Daily
Hotline
(C) 1985-2015 William Schmidt,
Ph.D. www.tigersoft.com
All rights
strictly reserved.
Tiger Software
858-273-5900 PO Box 22784 San Diego, CA 92192 Email
william_schmidt@hotmail.com
------------------------------------------------------------------------------------------------------------------
7/14/2014 The DJI's 17500-18200
Trading Range has been re-established.
The Biotech ETFs, IBB and BIIB soared to new all-time highs.
IWM and FAS made good gains. If QQQ can advance past 111,
biotechs and leading smaller companies will get a nice further boost.
First, the DJI will probably need to surpass its hourly resistance at 18100.
The news of the international agreement on Iran should be a boost
for the market just as Nixon's surprise trip to China was in February
1972 had been. 9000 miles away, a refusal by the Greek Parliament to
approve
PM Tsipras' austerity and privatization concessions to the Euro Union
in order to keep Greek banks from failing would undoubtedly fling
the market back down to 17800 and possibly even 17500.
It's not clear that the DJI has consolidated enough to breakout
to new highs. With the DJI 1.2% over the 21-day ma, the IP21
(current Accumulation) and V-I are both very negative (-.177
and -135, respectively). This means another DJI advance and
close 200 points higher will probably bring a Sell S12 (normal)
and Sell S9V.
.
But for now, the clear break in the NYSE
A/D Line downtrend was
used to reverse the Red Sell S12* and today the break in the
leading ETFs (DIA, SPY, QQQ and IWM plus IBB)
confirm this decision. I have suggested being long IWM and
and IBB for this rally. Though, IWM's advance is taking place
on falling volume, its 5-day ma is rising and resistance are still 3 points
higher.
It may turn out that the DJI will again fall back from its overhead
resistance, but Biotechs and more speculative smaller tech stocks
as represented by IWM and QQQ could well keep rising. This is exactly
what happened between mid-January and March 2000. And,
keep in mind, biotechs also topped out nine months after the DJI did
in October 2007. I think that it's reasonable to expect biotechs again
to be among the "last men standing" again. Note how many biotechs are
among the Bullish MAXCP stocks.
For the rest of this week, we want to watch to see if QQQ can score a break out
past its flat resistance at 111. This would be a boost to the market.
in this,
it is very important that AAPL get back above its overhead resistance
 7/14/2015 150+ TigerSoft Charts
Go to
http://tigersoftware1.com/HH/ to see them.
New Highs: NASD 76
NYSE 75
New Lows: NASD 23 NYSE
21
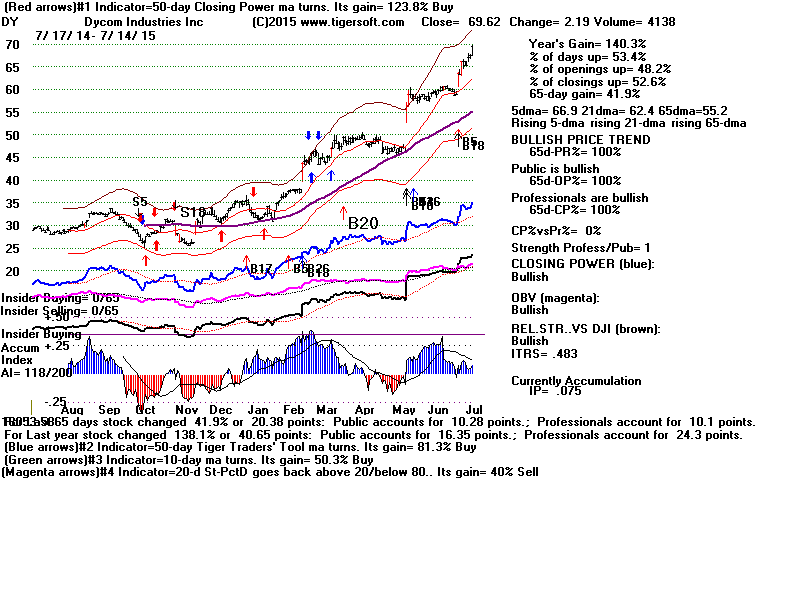
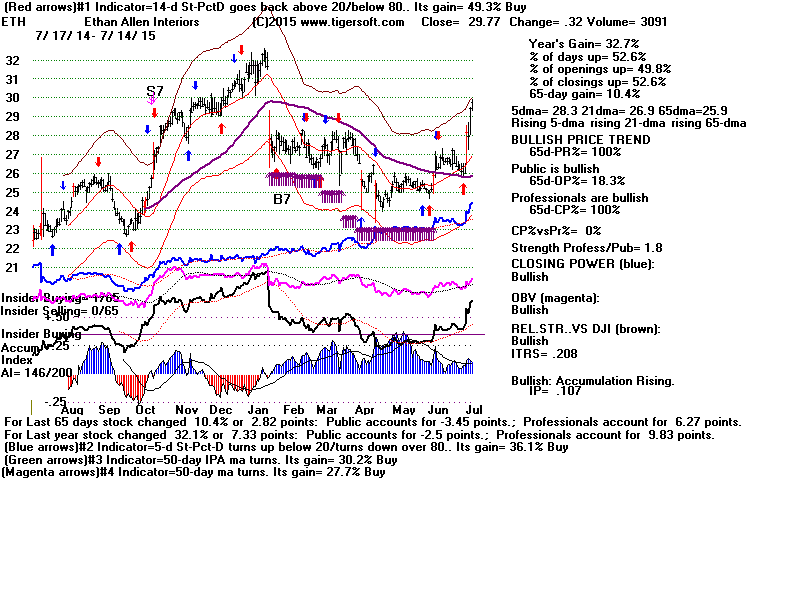
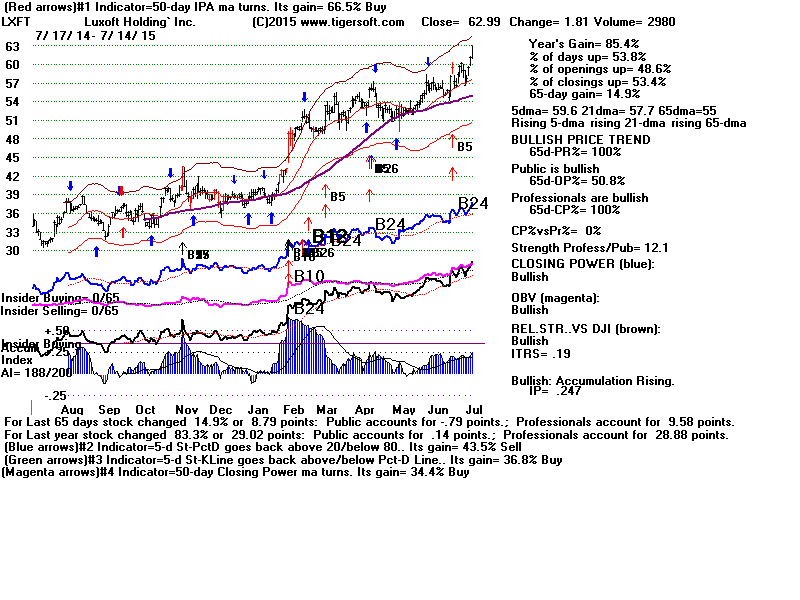
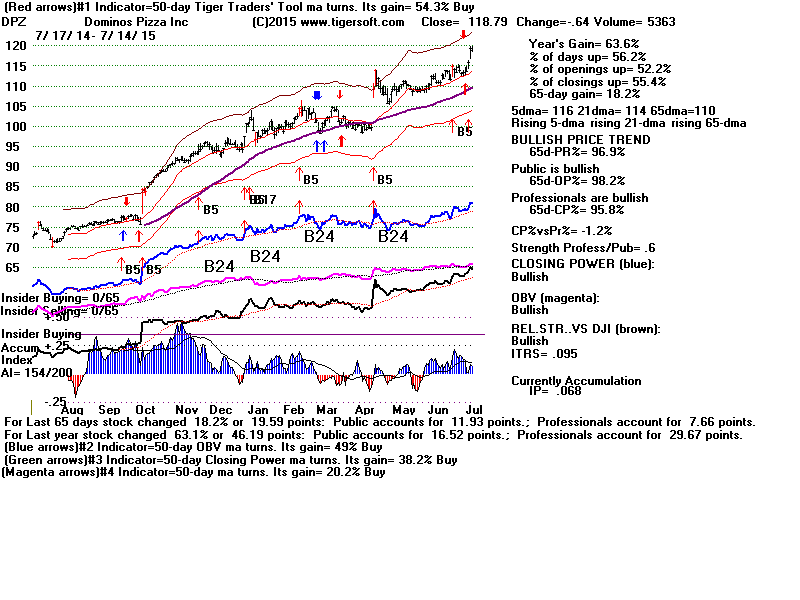
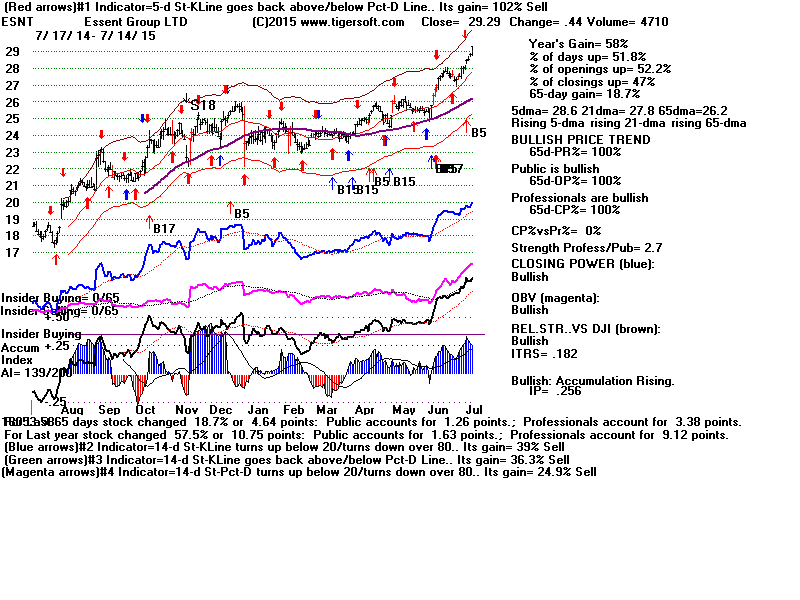
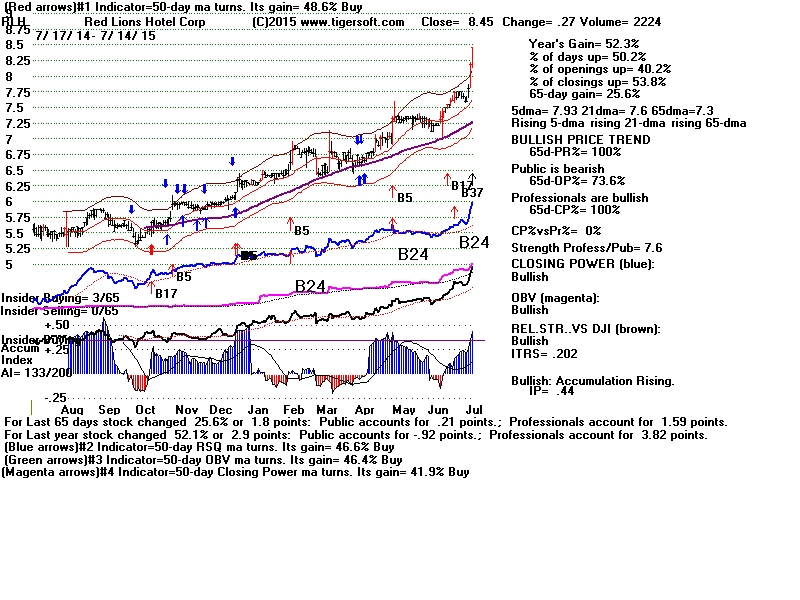
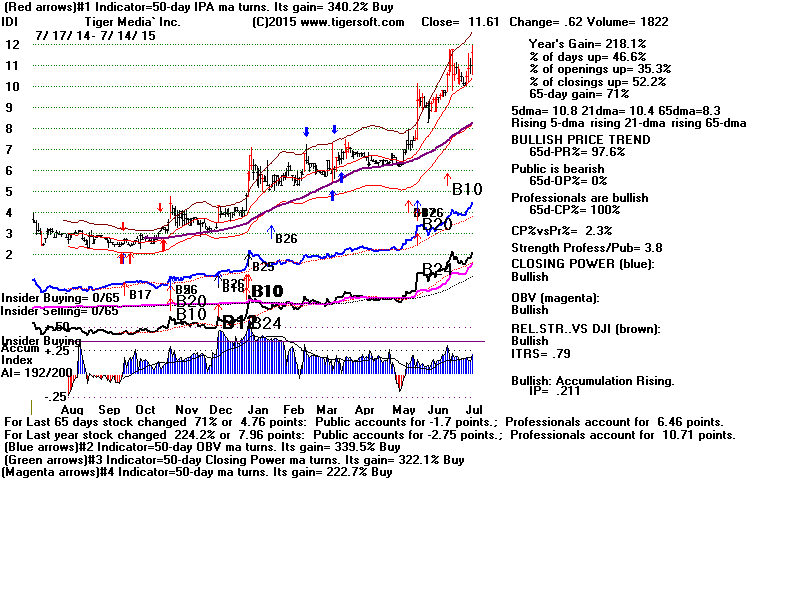
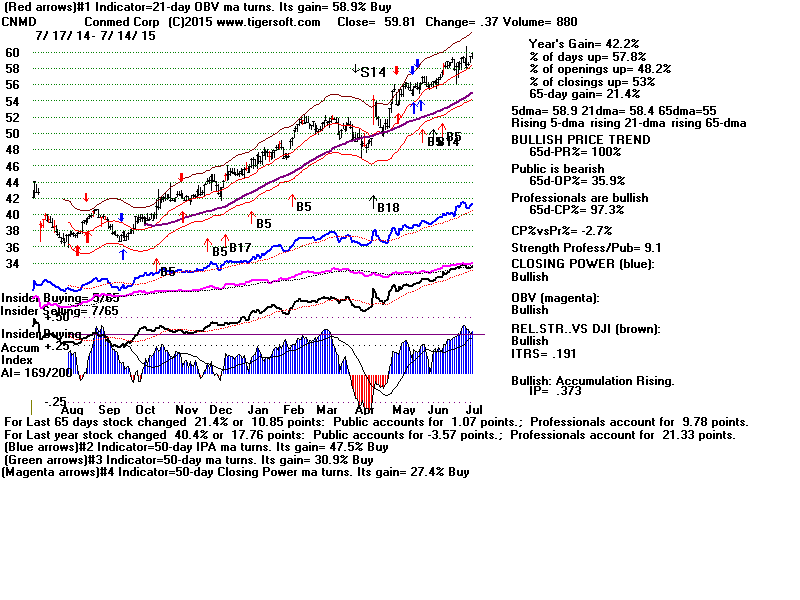
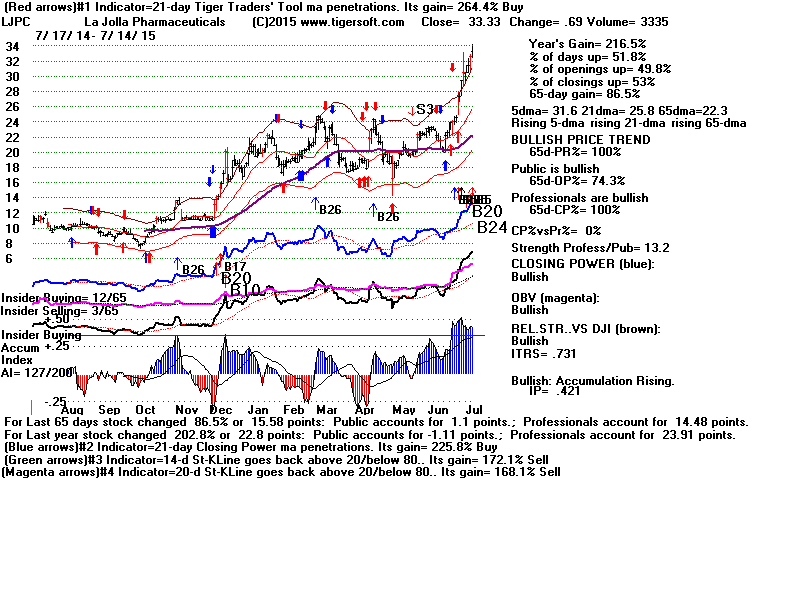
50 Bullish MAXCPs
DY,
ETH,
LXFT,
DPZ,
ESNT,
RLH,
IDI
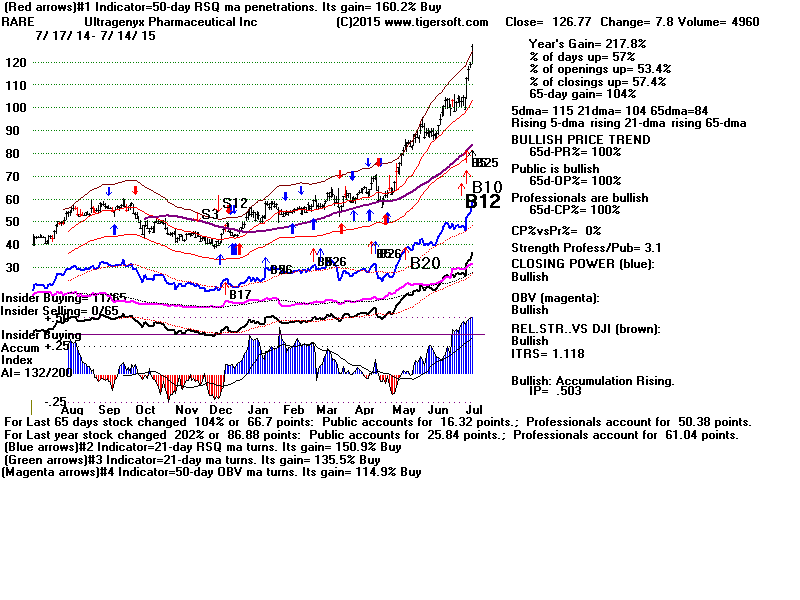
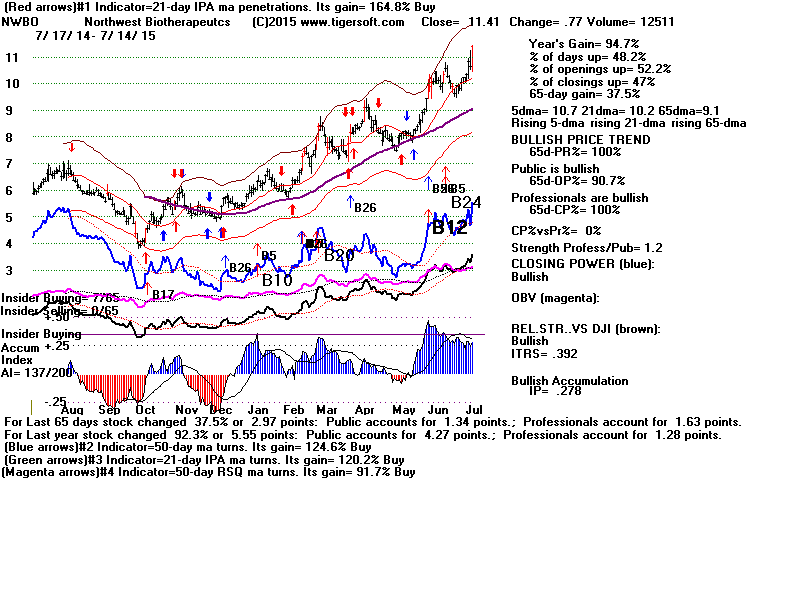
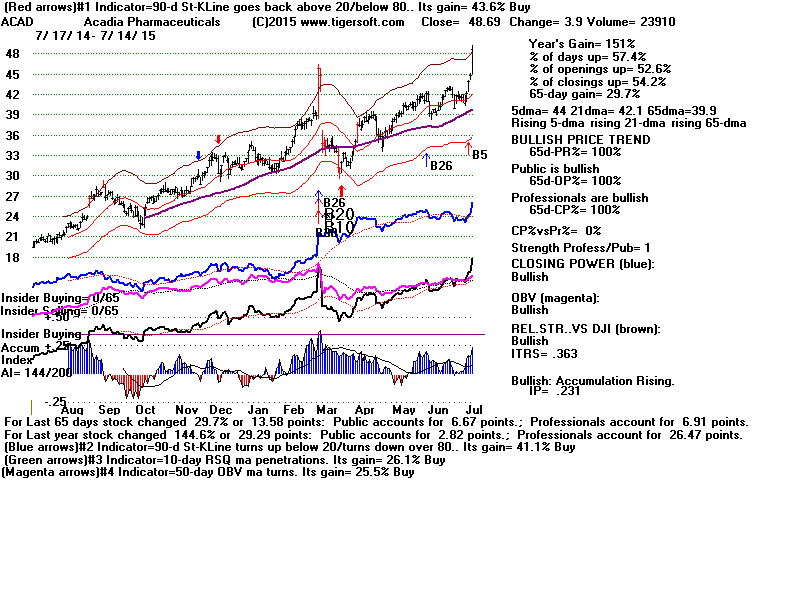
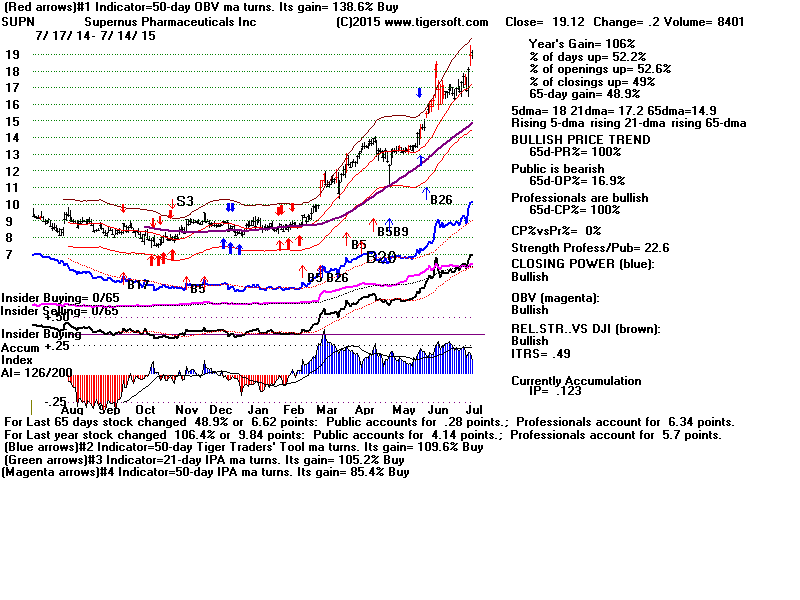
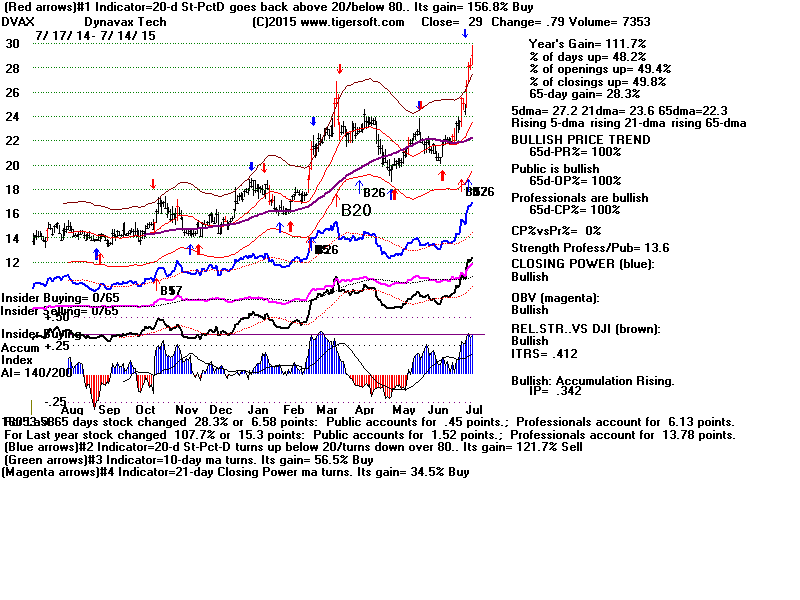
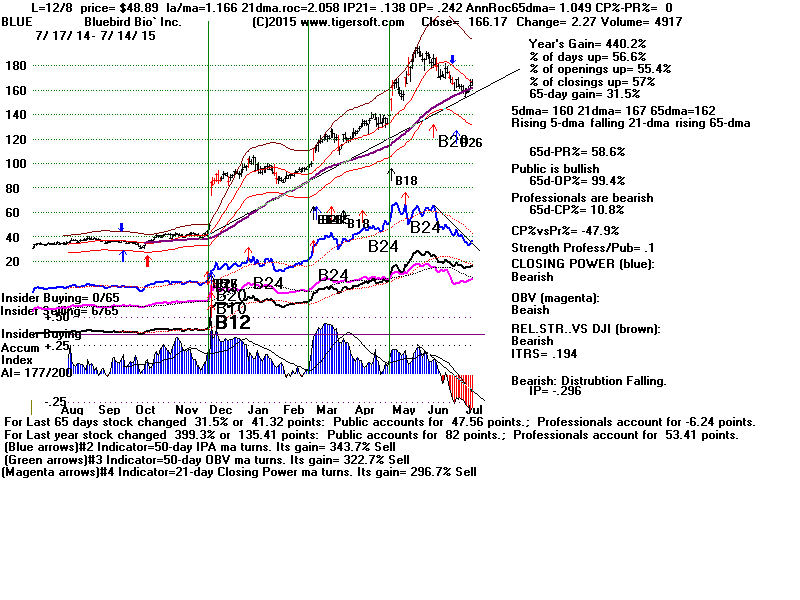
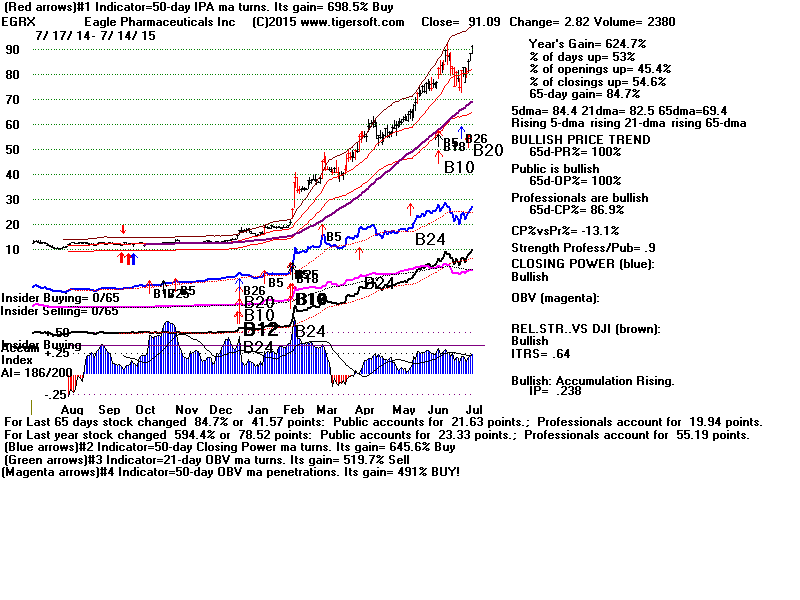
Biotechs/Biomed:
RARE (secondary announced)
140 employees
NWBO - only 12 employees,
ACAD - 118 employees
SUPN - 309 employees
DVAX - 197 employees
BLUE - 143 employees
EGRX - 30 employees
CNMD - 35 employees - medical
appliances
LJPC - 25 employees
ANAC - 100 employees
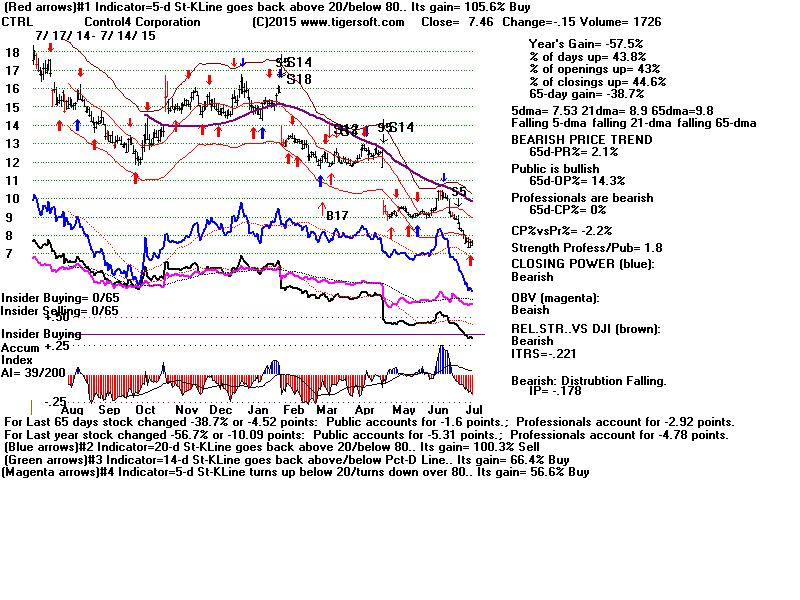
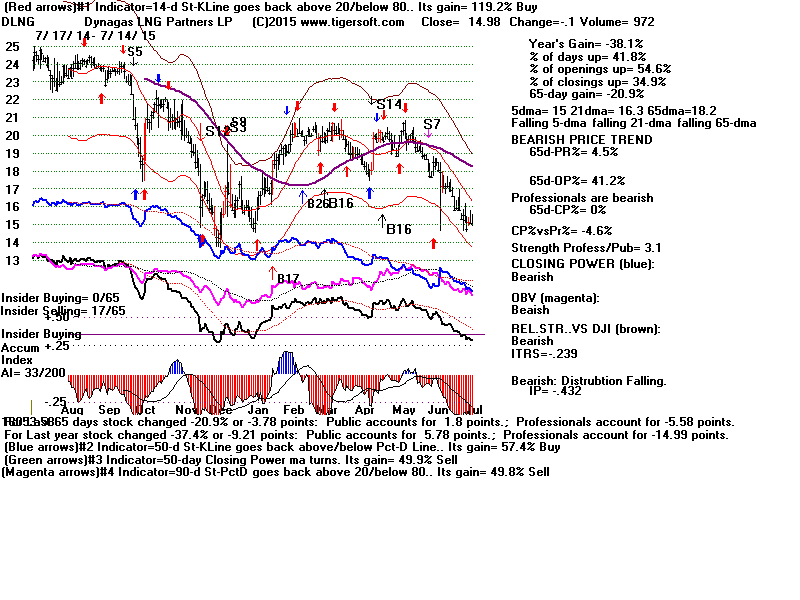
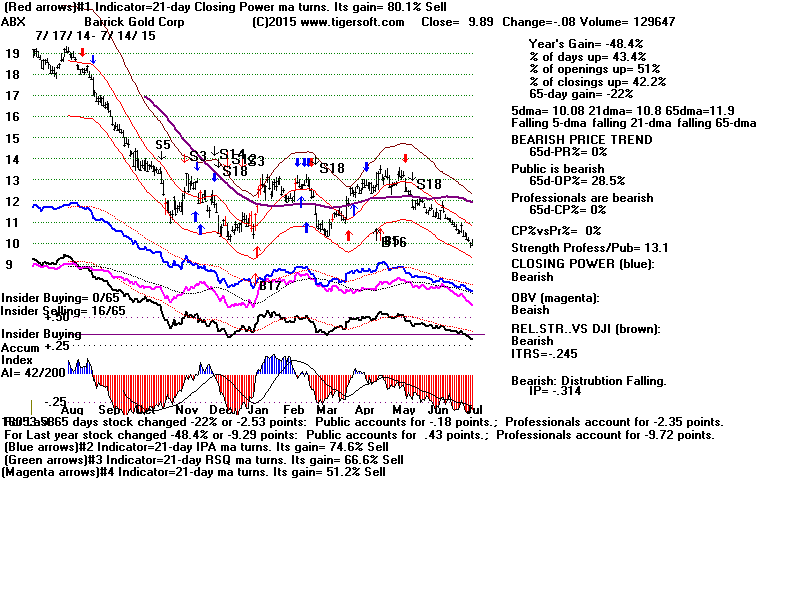
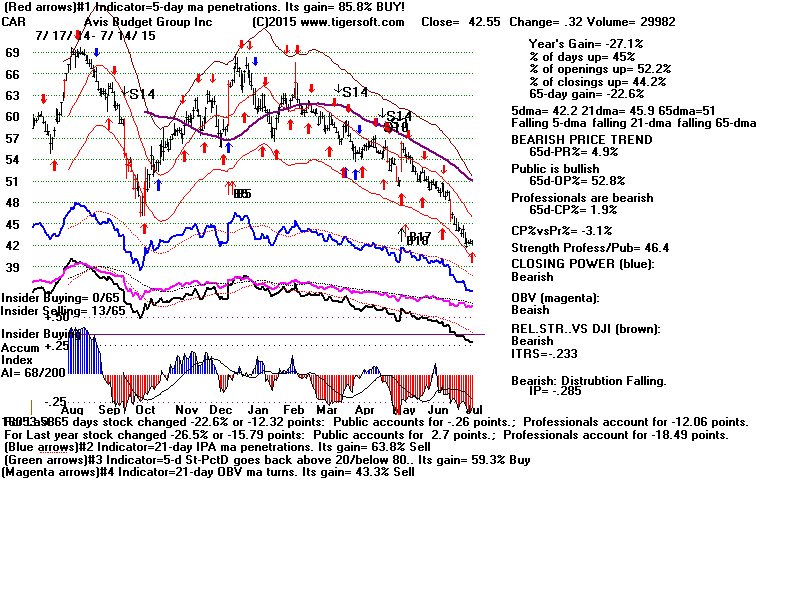
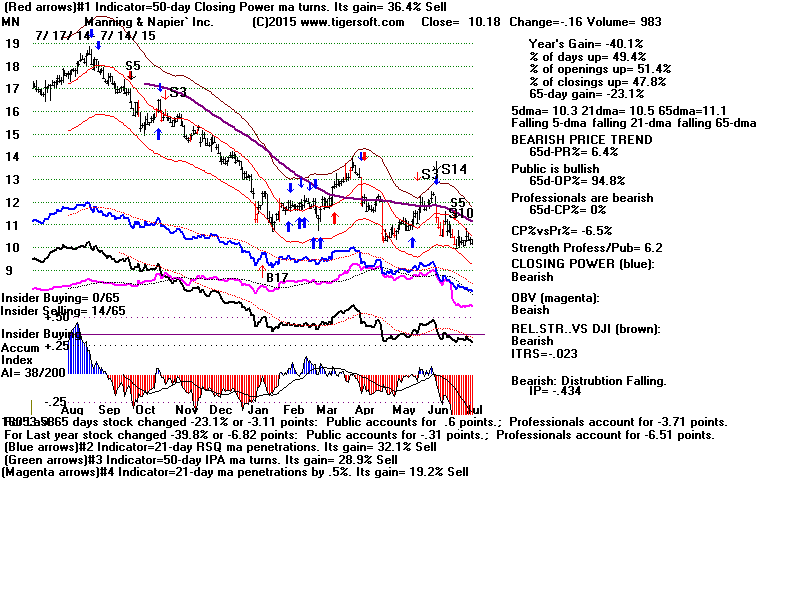
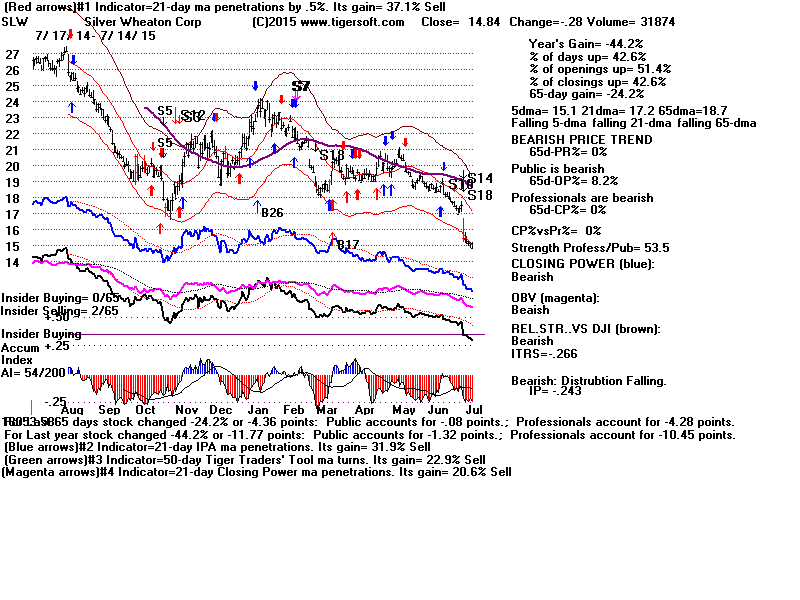
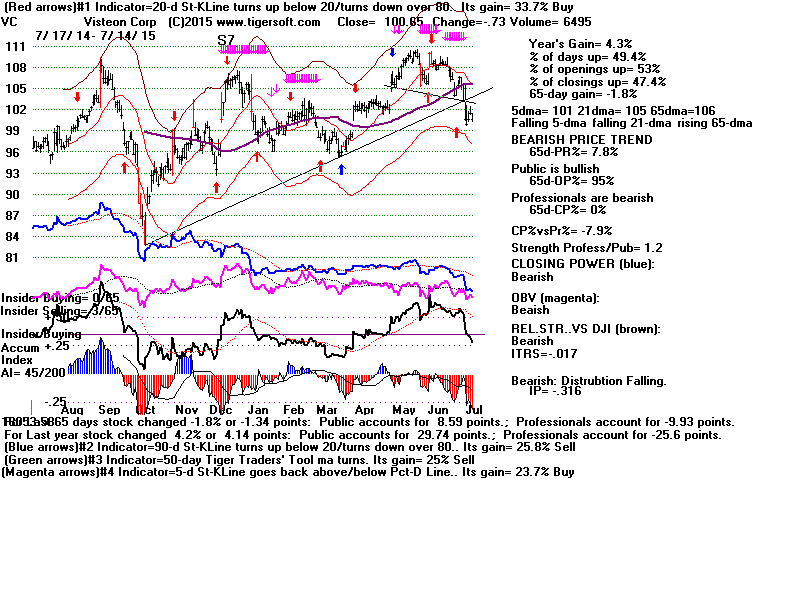
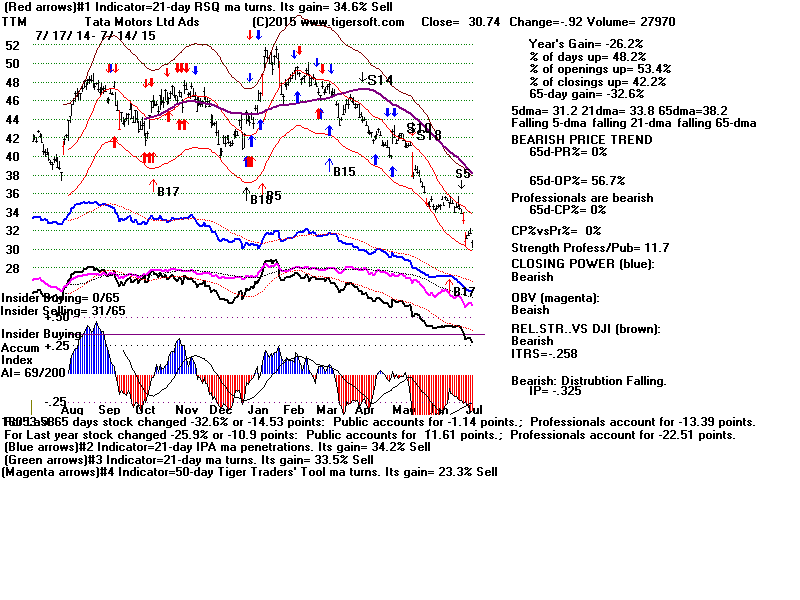
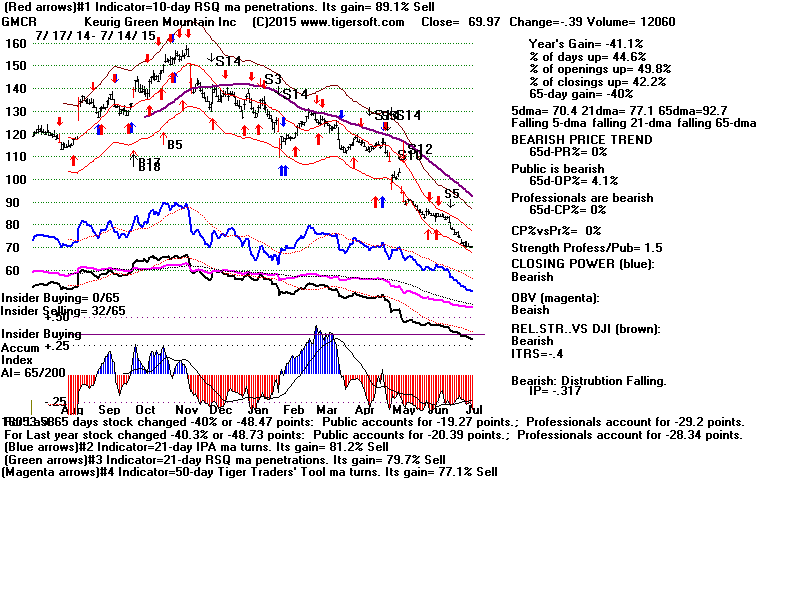
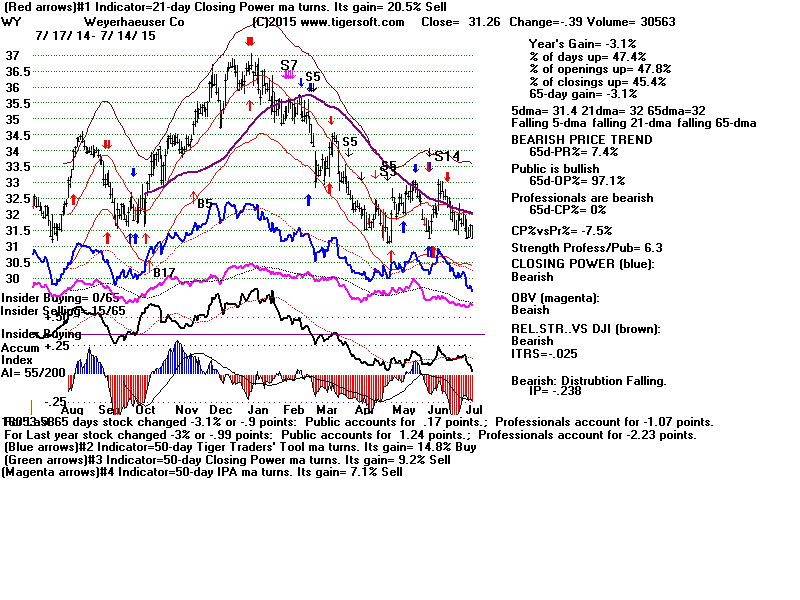
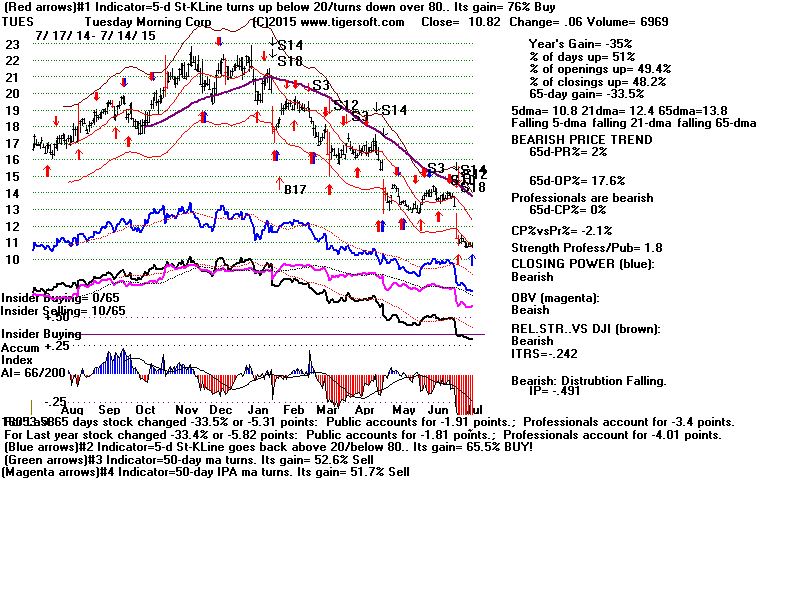
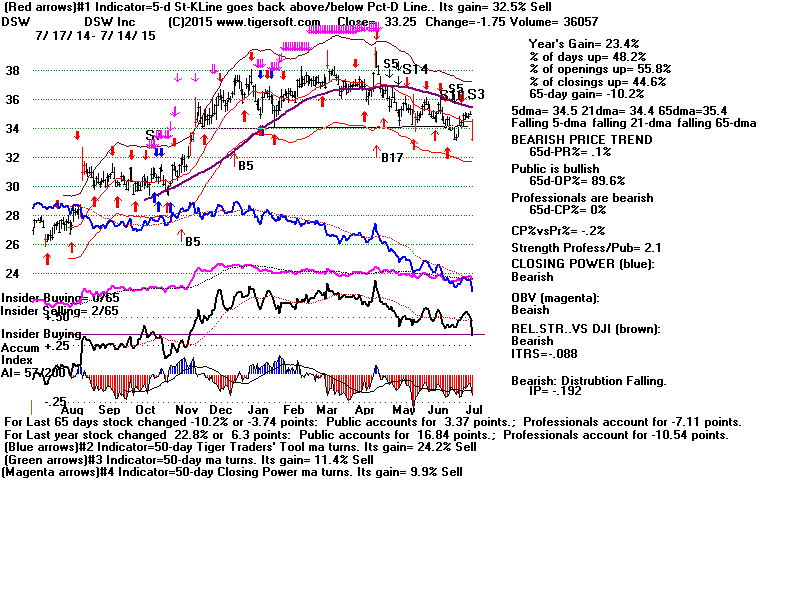
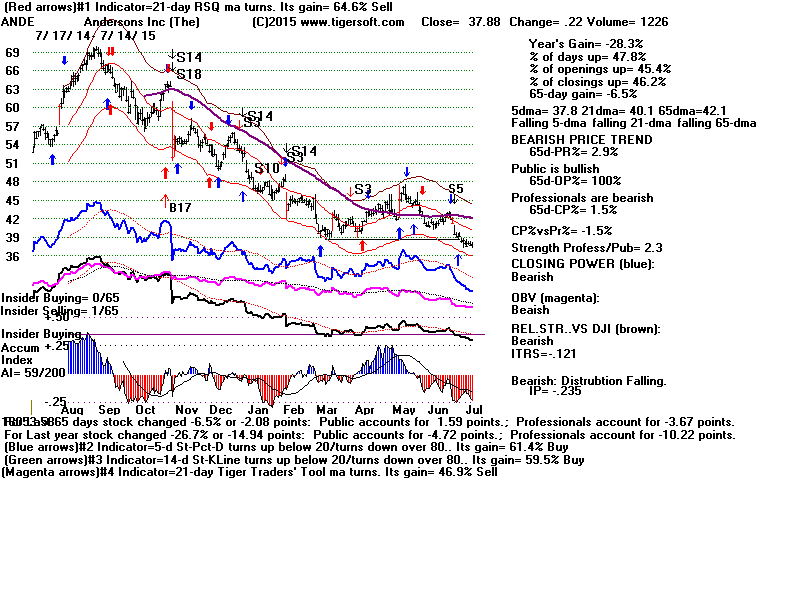
93 Bearish MINCPs
CTRL,
DLNC,
ABX,
CAR,
MN,
SLW,
VC,
TTM,
GMCR,
WY,
TUES,
DSW,
ANDE
|
History of New Extended
Red Sell S12s
1929 June - bad Sell: failure after price
breakout (late Summer rally)
3.4% loss - reversed 6 days later
by Buy B4.
Note DJI was essentially unchanged from what it was
65-days before
and showed an OBVPct of +.156.
This signal was redundant, as there already was a
regular Sell S12.
1929 September 5-
perfect Sell
just before Crash! BIG DECLINE
+43.3% gain
LA/MA = 1.013 PI=-26 IP21= -.109 VI= -454 OBVPct
= .112
DJI was up 19% above its level of 65-days before.
This signal was redundant, as there already were a
variety of Peerless Sells.
1932 November 7 - premature Sell 64.6 --->
68.0 ---> 55.9 BIG DECLINE
+9.0% gain
LA/MA = 1.046 PI=-41 IP21= -.079 VI= -156 OBVPct
= - .069
DJI was up 8.3% above its level of 65-days before.
This signal was not as good as the perfect Sell S2
right at top.
1936 April 2 -
perfect Sell
BIG DECLINE
+6.7% gain
LA/MA = 1.026 PI=-27 IP21= -.089 VI= -231 OBVPct
= + .198
DJI was up 11.3% above its level of 65-days before.
This signal was redundant, as there already were a
variety of Peerless Sells.
1936 October 7 - bad Sell. but A/D Line was
weak until end of 1936 and this
was right after a
perfectly flat-topped breakout.
LA/MA = 1.034 PI=-14 IP21= -.051 VI= -105
OBVPct = + .253
(too high?)
DJI was up 12.2% above its level of 65-days before.
1959 December 31 -
perfect Sell BIG
DECLINE
1963 December 4 - bad Sell.
Early
December is not usually a good time to sell short.
LA/MA = 1.015 PI=-58 IP21= -.066 VI= -577 OBVPct
= + .028
DJI was up 4.0% above its level of 65-days before.
1964 June 19 -bad Sell. - 823 ---> 851 --->
833 and then up strongly.
The loss here would have been small using
Peerless.
It would have been 2.5% based on Peerless Buy B10 on
6/17/2015
LA/MA = 1.011 PI=-11 IP21= -.108 VI= -317 OBVPct
= - .006
DJI was
only up 0.8% above its level of 65-days before.
1965 April 12 - premature Sell - 906 --->
939.6 ---> 840
1967 April 18 - premature Sell - 873 ---> 909
---> 847
1972 August 2 - premature Sell - 944 --->
970.35 ---> 921.66
1998 June 29 - premature Sell - 8997.36 --->
9337.97 ---> 7539.07 BIG DECLINE
2000 August 7 - premature Sell - 10867 --->
11311 ---> 7539 BIG DECLINE
2012 December 5 - premature Sell - 13034 --->
13351 ---> 12938
2015 May 19 -
LA/MA = 1.013 PI= 13 IP21= -.008 VI= -48
OBVPct = .115
DJI was up 1.5% above its level from 65-days
before.
|
------------------------
Announcements
--------------------------------
E-Books
1
The On-Line Explosive Stocks
2
The On-Line Killer Short
Sales book
Purchase each all new book by CC for
$42.50 or send a check for $37.50 to me.
I call your
attention now to the many new concepts and
the considerable new research in them:
For example:
1) A very good New Tiger Buy B12 for Low
Priced Stocks
2) After Red high volume reversal days use CP
uptrend-breaks.
3) Buy the stocks the Federal Govt wants you
to buy.
4) 100-Day Power Rankings...
5) Using Closing Power Hooks after Buy B26s
and B20s.
6) How A Stock Reacts to Its Earnings Report
Is Very important.
7) TigerSoft Major Buy Signals' Combinations
Which are most Powerful? Reliable?
8) Augmented Buy B20s' Independent Success
Rate.
9) What factors warn a rising 65-dma will not
hold?
10) The classic cluster of technical
characteristics that commonly appear
in the 23 stocks falling 70% or more in
the deep pullback of 2011.
----------------------------------------------------------------------------------------------------------------------------------------------------------------------------
PEERLESS STOCK MARKET TIMING:
A Guide To
Profitably Using The Tiger Nightly HOTLINE
Peerless Signals: 1915-2014
New Peerless Signals and DJI Charts - version 7/4/2013
1965
1965-6 1966
1966-7 1967
1967-8 1968
1968-9 1969
1969-70
1970
1970-1
1971
1971-2 1972
1972-3
1973 1973-4
1974
1974-5 1975
1975-6
1976 1976-7
1977
1977-1978
1978
1978-79
1979 1979-80
1980 1980-1
1981 1981-2
1982 1982-1983
1983 1983-1984
1984
1984-1985
1985
1985-1986
1986 1986-1987
1987 1987-8
1988
1988-9 1989
1989-90
1990
1990-1 1991
1991-2 1992
1992-3 1993
1993-4 1994
1994-5 1995
1995-1996
1996
1996-7 1997
1997-8 1998
1998-1999 1999
1999-2000 2000
2000-1
2001 2001-2
2002
2002-3 2003
2003-4 2004
2004-5
2005 2005-6
2006 2006-7
2007 2007-8
2008 2008-9
2009
2009-10
2010 2010-11
2011 2011-12
2012
2012-2013
2013 2013-4 2014
Introduction to Tiger/Peerless Buys and Sells.
Different Types
of TigerSoft/Peerless CHARTS, Signals and Indicators
How reliable support is the DJI's rising 200-day ma?
-------------------------------------------------------------------------------------------------------------------
TIGERSOFT SIGNALS AND INDICATORS:
Documentation for TigerSoft
Automatic and Optimized Signals.
SPY Charts since 1994: Advisory Closing Power S7s, Accum. Index, 65-dma,
Optimized Signals.
"The
Jig Is Up": Calling September and October Tops.
A Keynesian's Warning Signs.
NUGT since 2012: A study of Tiger Technicals
Tiger Day
Traders Tool and most active Triple Leveraged ETFs
Advisory Pink Closing Power S7s at ETF at top since 1994
1994
1996
1997
1998
1999
2000 QQQ
SPY
DIA
2002
2007
2008
SPY 2011
2013-2014
Tiger Buy and Sell
Signals: New 2014 Research:
These are randomly chosen
groups.
but clearly we need to back-test them in more years.
You can replicate or do similar studies yourself
for other signals and/or other years.
9/1/2014 -
2014 Tiger
B19s - Steady rallying and no pullbacks below the 21-day ma.
9/2/2014 -
2014 Tiger
B17s on 14As taken alphabetically
9/3/2014 -
2014 Tiger B17s on 60
Biotechs taken alphabetically
9/4/2014 -
2014 Tiger
B18s on all "R" stocks taken alphabetically
* 9/8/2014 -
2014 Tiger
B20s - Conclusion: Use Closing Power trendbreaks in aftermath.
9/8/2014 -
2014 Tiger
B16s - Conclusion: Use mostly when
LA/MA under 1.05.
9/11/2014 -
2014 Tiger
B15s - Conclusion: Certain conditions
improved the results dramatically.
9/12/2014 -
2014 Tiger
B25s - Conclusion: 87.5% success rate
when other internals are positive.
9/15/2014 -
2014 Tiger B25s -
Best conditions for using B25s with somewhat
higher RSX capitalization stocks.
9/16/2014 -
New Tiger
Closing Power Take-Off Buy Signal in 2014: 14s, QQQ, DJI-30 and ETFs
9/17/2014 -
New Tiger
Closing Power Take-Off Buy Signal: 2009A-s
9/18/2014 -
New Tiger
Closing Power Take-Off Buy Signal: 2010A-s
9/21/2014 -
New Tiger
Augmented Sell S8s: DJI-30 - 2014
Requiring S8s to show
Negative CP%-Pr and IP21<+.15 produced a 70% success rate
in a rising market for
DJI-30 stocks and big ETFs.
9/24/2014 -
Tiger Sell
S14s: They make price breakdowns very bearish.
1/15/2015
-
Tiger Day
Traders' Tool Explained.
http://www.tigersoft.com/day-traders/index.html
http://www.tigersoft.com/Indicators/index.htm
http://www.tigersoftware.com/TigerBlogs/Aug-31-2009/index.html
NEW
2/16/2015
1) New -
Tiger Charts showing UP%, Opening-Up%, Closing-Up%
Note differences between bullish
and bearish stocks...
2) New -
UP%,
Opening-Up%, Closing-Up% Rankings of any directory.
3) New -
Display of what happens to a stock after various size openings up or down.
4) New -
6-month charts to better
show volume changes and 5-day ma with bands.
More profitable trading schemes coming...
Targeted Trading Opportunities:The Profits Quickly Add Up,
3/29/2015
Tiger CandleSticks:
IBB: 2001-2015
and
Recent Others.
====================================================================================
Earlier Hotlines
2-7-2014 to 3/19/2014
11-22-2014 to 2-6-2014
http://tigersoftware.com/555HL555/index.htm
10/9/2014 - 11/21/2014
http://tigersoftware.com/9933Hot/
9/2/2014 - 10/8/2014-
http://tigersoftware.com/2233HL/index.html
6/25/2013-9/1/2014
http://tigersoftware.com/112211-H/index.htm
11/22/2013-3/20/2014
http://tigersoft.com/1111-HL/index.html
10/22/2013-11/21/2013
Past
Hotline Predictions
http://tigersoft.com/-HL42013/index.html
http://www.tigersoft.com/-2GBL13HL/index.htm
==============================================================================================================================