TigerSoft and Peerless Daily
Hotline
(C) 1985-2015 William Schmidt,
Ph.D. www.tigersoft.com
All rights
strictly reserved.
Tiger Software
858-273-5900 PO Box 22784 San Diego, CA 92192 Email
william_schmidt@hotmail.com
------------------------------------------------------------------------------------------------------------------
7/13/2014 International Events Are
Pushing Aside
Our Technical Concerns about The Stock Market.
With the DJI back above 17800, I think we
have to be optimistic. The break in the NYSE
A/D Line downtrend needs towiden. But it
is enough to reverse the Red Sell S12.
NIXON's Surprise Trip To China in February 1972 helped
the bull market then run still higher. New trade
with Iran
will be very profitable.
Perhaps, the market can forget Greece and the EURO for a while
and now consider what a thaw in relations with Iran could bring. New
consumer markets and more oil production on the World Markets...
These are bullish developments. I would think that they will
let the current advance continue, even though it seems to be coming mostly
from higher openings. Of course, just as the Greek Parliament still
still needs to approve the additional austerity agreement that
P.M. Tsipras has negotiated with the EURO leaders,
(See
http://www.bbc.com/news/world-europe-33517252 )
the Obama Administration must constitutionally now get the approval of the
Republican controlled Senate for a new US-Iran treaty by a 2:1 vote
or else a majority of both the Senate and the House.
(Source -
https://en.wikipedia.org/wiki/Treaty_Clause . It is doubtful
that the Obama-Iran agreement can be legally considered an Executive agreement. )
Hourly DJI shows 17800 is now support
and 18100 is resistance. The higher prices
should allow our MAXCPs and QUICKSILVER
picks to rally more. But without much more
up-day and up-hour volume, I can't see how the
DJI will be able to get past its overhead resistance.
With The Breakout above 17800,
The Pullback Must Be Considered over.
It's true that the downtrend of the NYSE A/D Line has only been
slightly
broken. But this is the best tool for deciding that a correction is over
when
one doubts a current Peerless Sell signal. I mentioned when we announced
the new Sell S12 that since 1965 its signals have only produced relatively
shallow declines. I then researched how to reverse these signals if we
assumed that there was no Peerless Buy. The best tactic here I discovered
was to use the A/D Line trendbreak to reverse a Red Sell S12..
The downtrends of the Closing Powers for the DIA and SPY have not
yet broken their downtrends. So, a small retreat might occur. But
breadth was
again very favorable today. The ratio of NYSE Advances to Declines was
2.73:1.
It was 3.93 yesterday. I think this
and the big gap today above 17800 should
keep us from doing new
shorting, except in oil/gas stocks.
Biotechs again are the leaders
on the long side. I would think the best of these
will keep
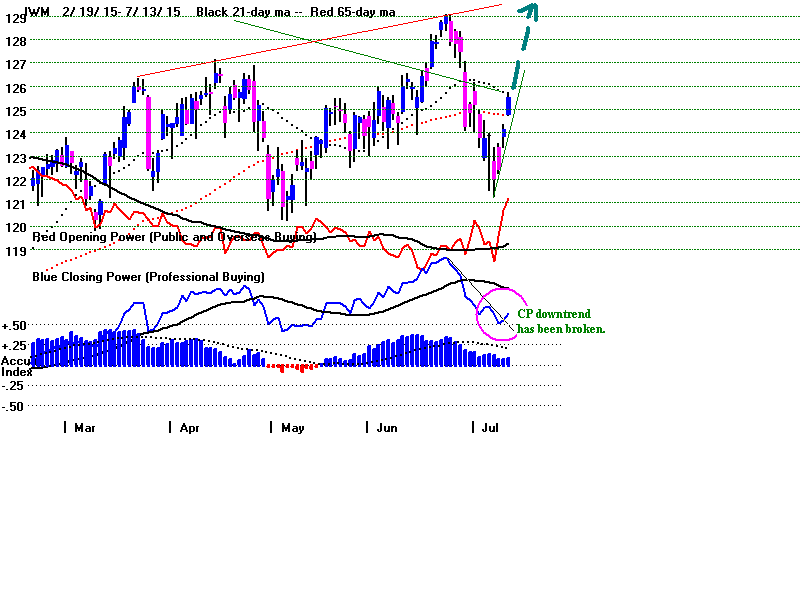
rising. IBB is the simplest way to play this advance. Also note that
IWM's CP did break its
downtrend
and should have been bought.
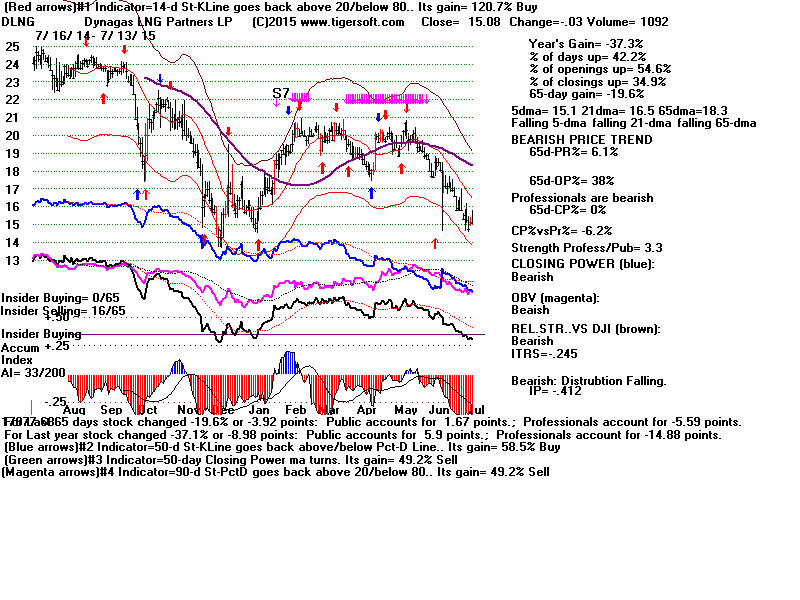
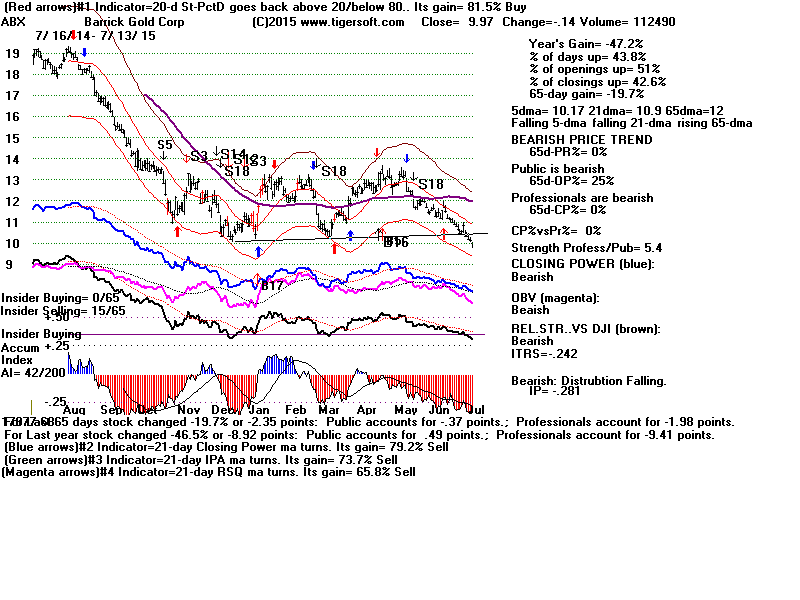
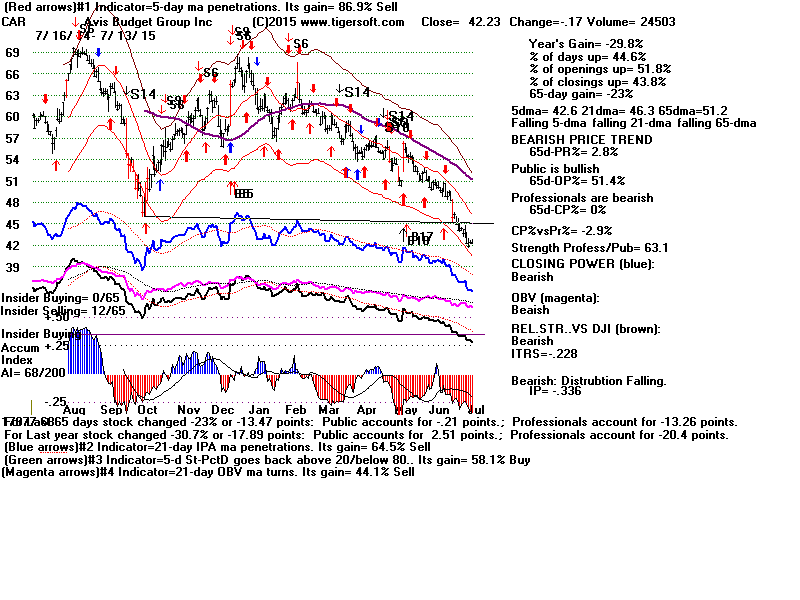
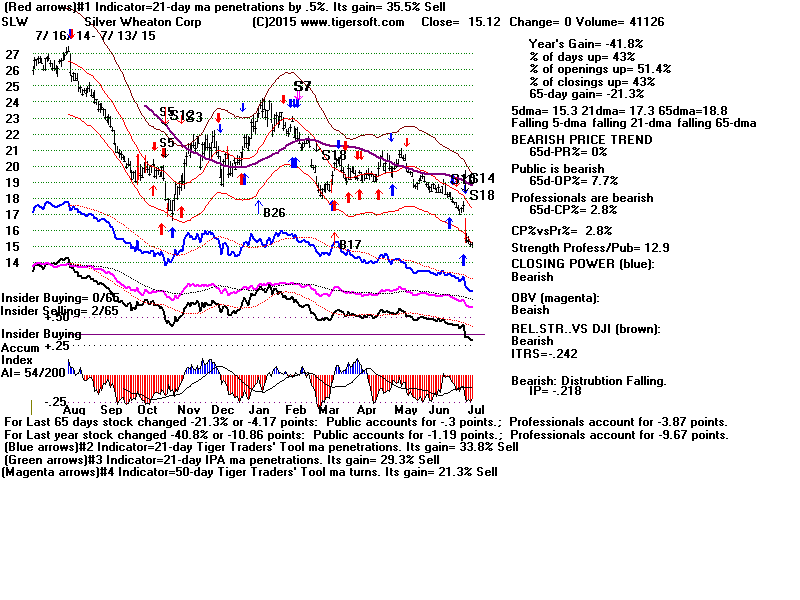
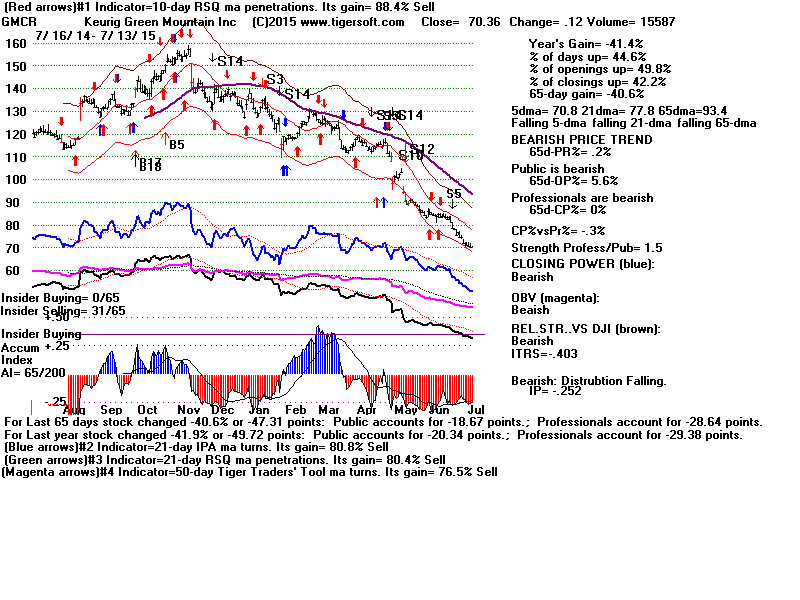
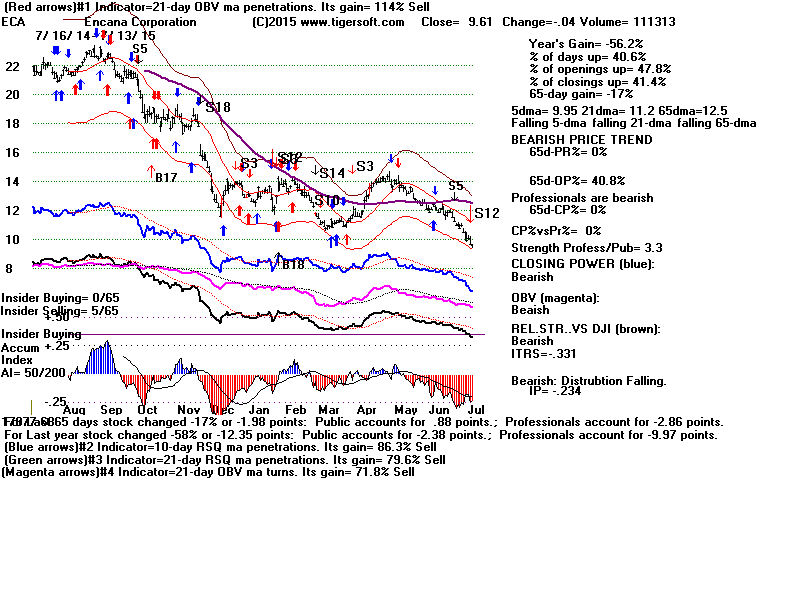
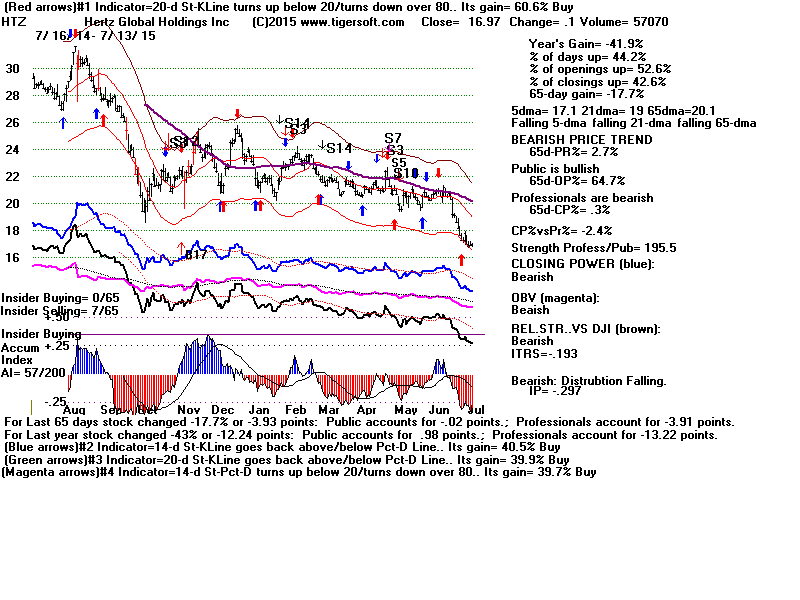
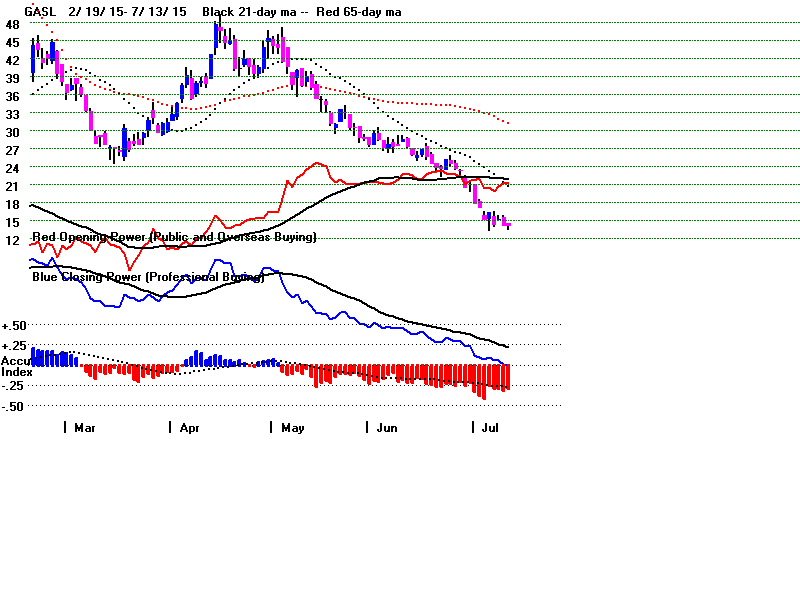
Abide by Breaks of the 65-dma when the
Accum. Index is negative. Knowing this
has been vital to our avoiding buying oil/gas or
service stocks and even selling some short.
(See the charts of OIL, OIH and GASL
below.)
Falling oil prices are an economic stimulant. Translated into lower
fuel prices,
they should put more money in consumers' hands around the world.
And technically, the
breakout
above 17800 now sets up a DJI move up to 18100.
This
may well allow the Stochastic tools that work well with the DJI (the 14-day
and 21-day K-Lines
to rise up to an over-sold position). At 18100, resistance
will probably
be too much for the DJI.
 |
 |
 |
Beyond Peerless....
One of the reasons I suggested taking profits in many of the shorts we had
on Bearish MINCP stocks was because of how well many other stocks had held
up in the face of very scary reporting late last week
about Greece and China.
Our Stock's Hotline now is long more than twice as many stocks as we are short.
Always consider the psychology of the market makers, too. These folks clearly
did not want to the DJI to close below 17500. In fact, so adamant were
they
about this, it appears that they even arranged a "glitch" to prevent this and
give
them time to plan a market rally, probably with the help of the FED and the
Chinese Government.
Of course, keep track of support and resistance levels, too. If prices cannot
break
below a support level, they usually rally up to the overhead resistance.
Now the DJI has rallied back to its falling 65-dma. This will pose some
resistance.
But I suspect prices get past it before the new17800 support is again violated.
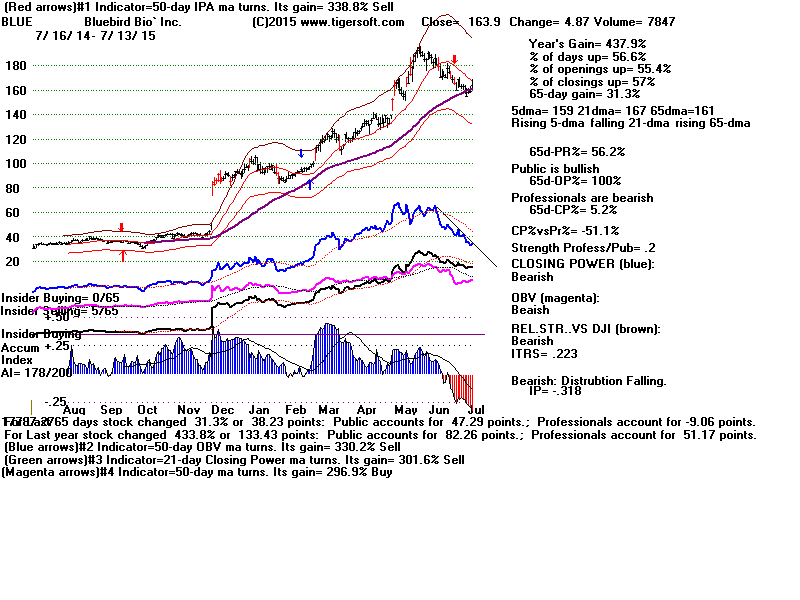
Biotechs appear very well-represented in the Bullish Stocks tonight.
It was
important that IBB held above its rising 65-dma. When this became apparent,
IBB then worked its way back to and then above the key 370 level.
.
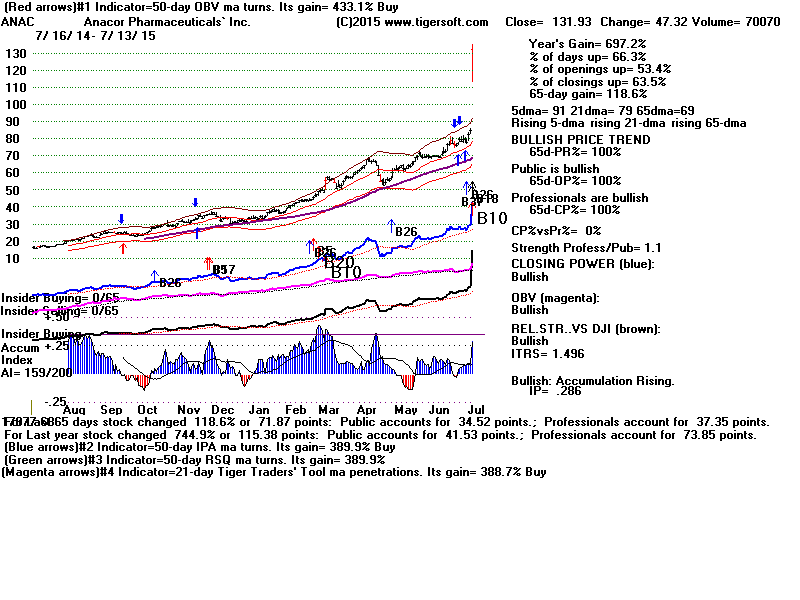
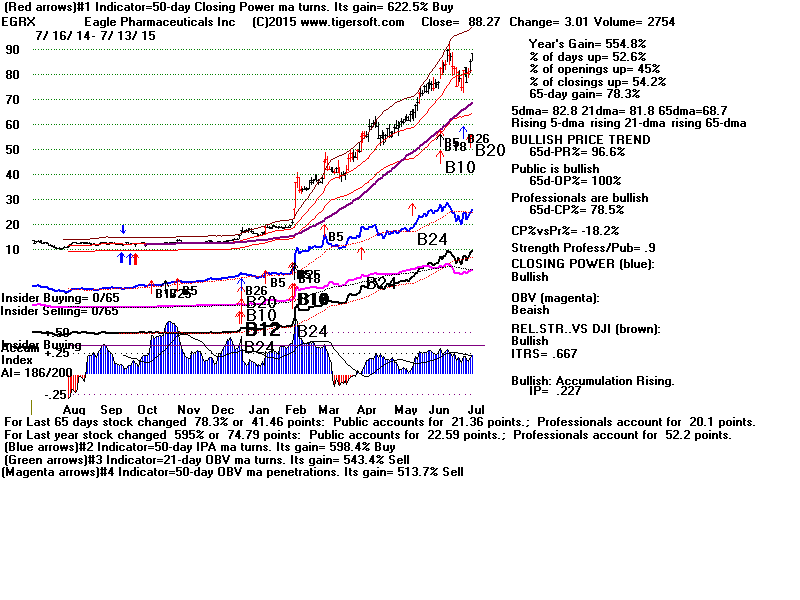
Today one of the Bullish MAXCP Biotechs rose 50% on successful completion
of stage 3 trials. ANAC is of great interest to us because this was a
$10/share stock
two years ago, when we noticed here that the CEO had just bought a big chunk
of his own stock and was starting a promotional tour for the stock. Note
the
tell-tale bulge of Accumulation at the start of its big two-year 1000%+ advance
back in 2013..
(Find the Accum. bulging stocks by running the Tiger Power Ranker against
the "HIGHIP21", "ACCUMVER" and "VHIP21" stocks.)
I suggested adding more short sales from among the Bearish MINCP stocks
on a rally to 17800 or on a close below
17500. There are still not enough
Bullish MAXCP stocks to do much buying yet.
The operative Peerless
S12 must stand for now, at least until the
A/D Line breaks its downtrend
or we get a new Peerless Buy signal.
 7/13/2015 150+ TigerSoft Charts
Go to
http://tigersoftware1.com/HH/ to see them.
New Highs: NASD 87
NYSE 72
New Lows: NASD 28 NYSE
27
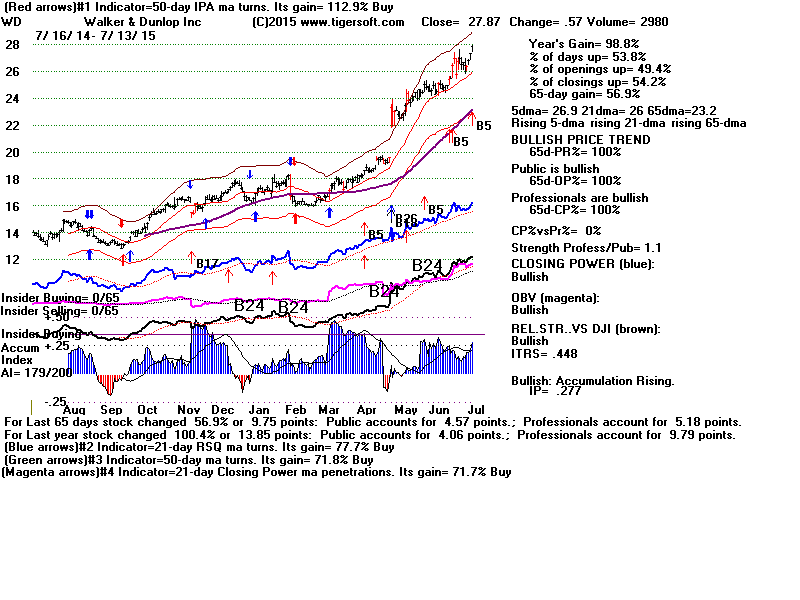
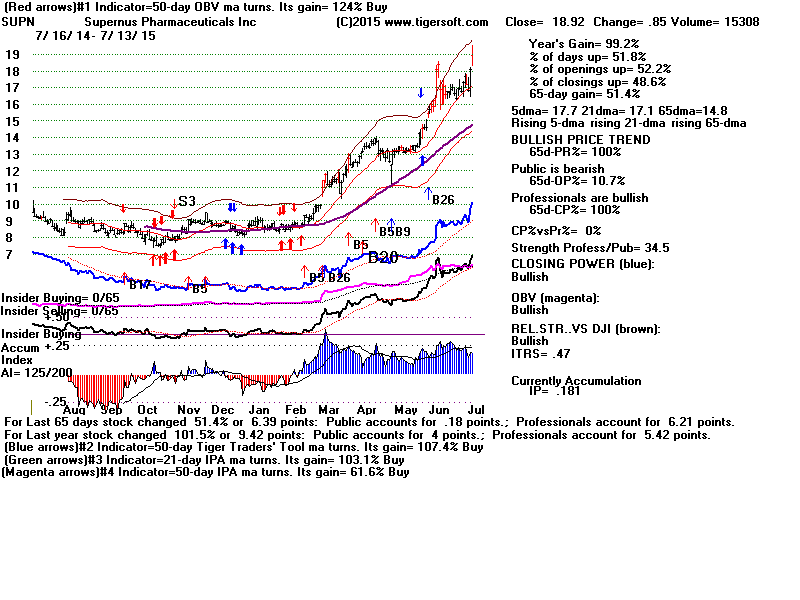
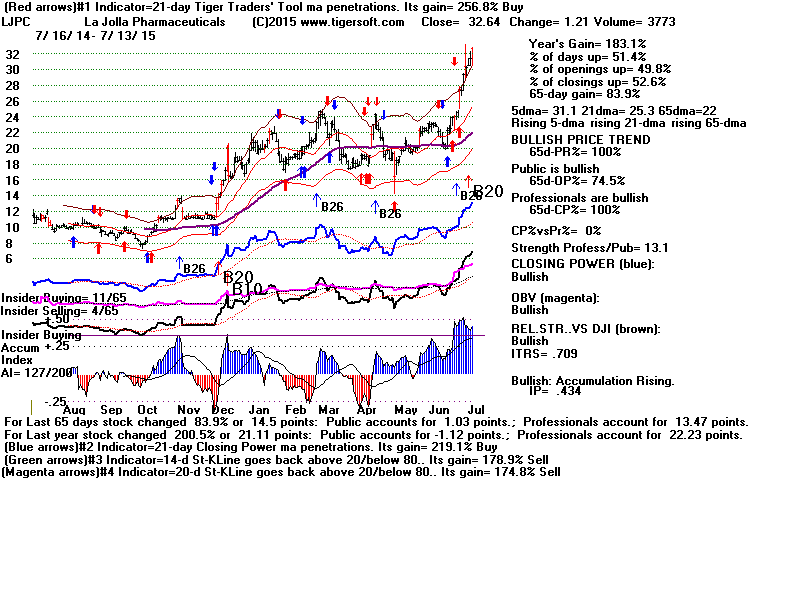
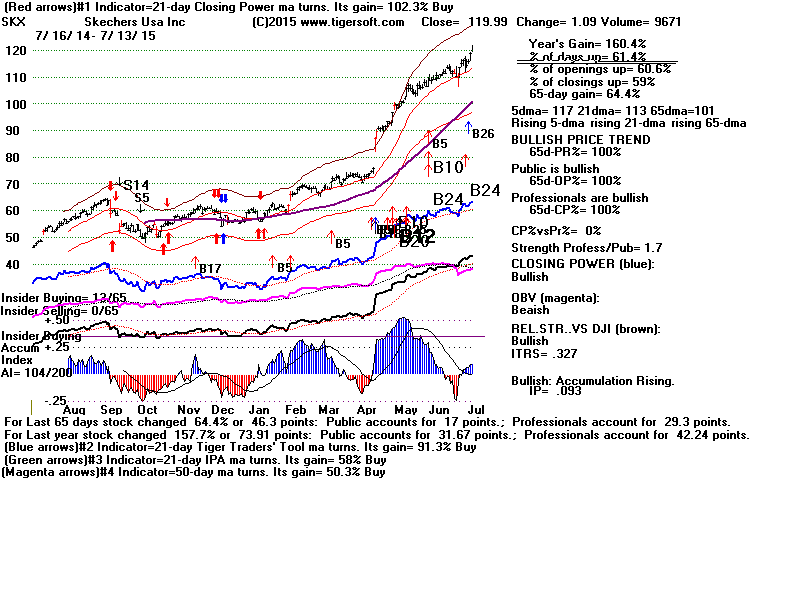
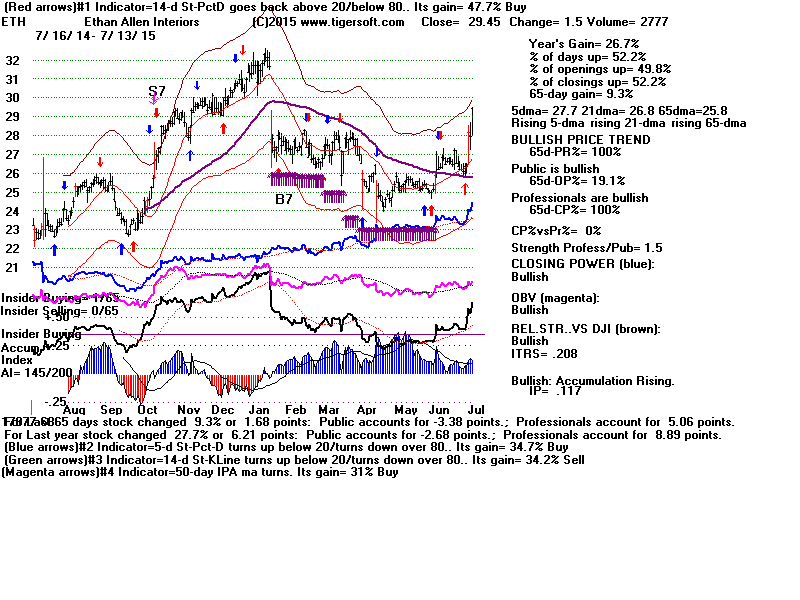
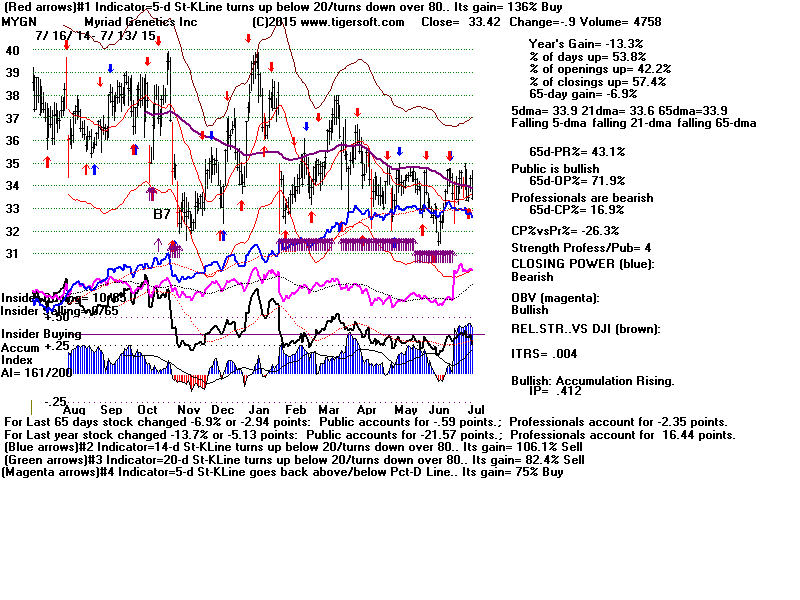
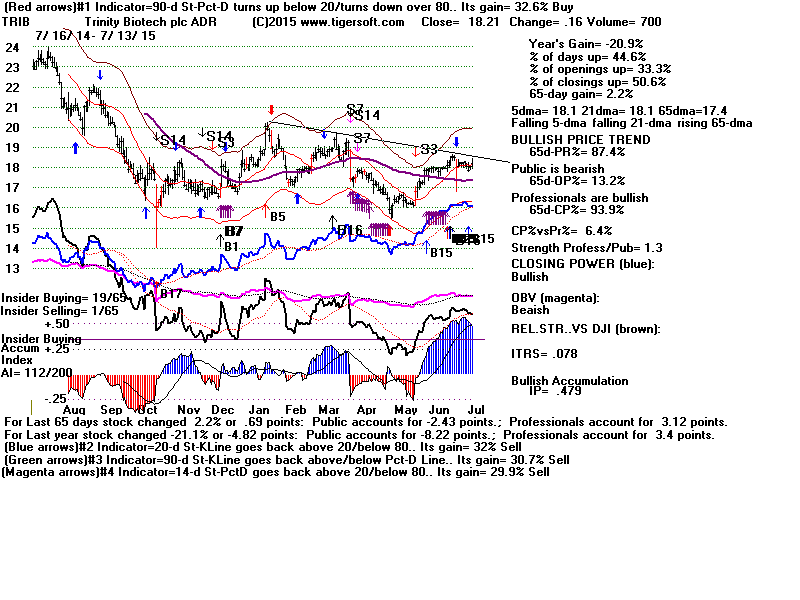
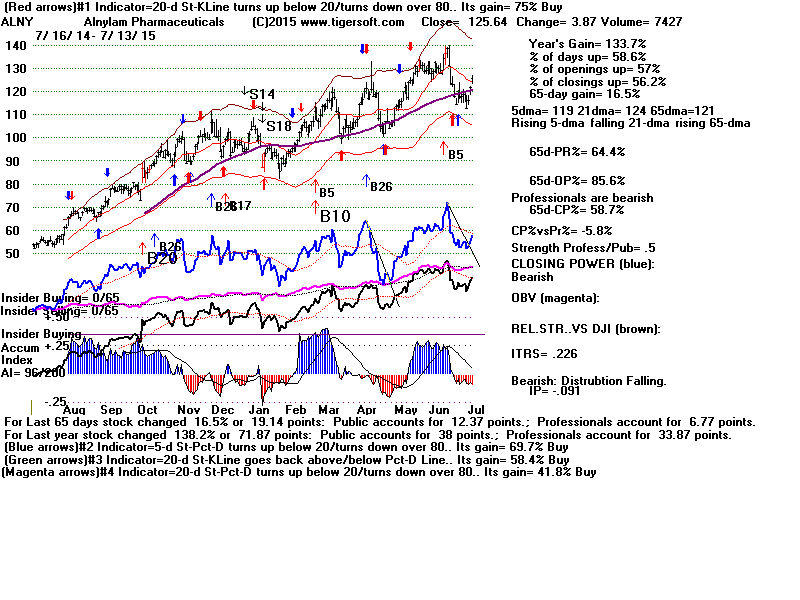
30 Bullish MAXCPs
WD,
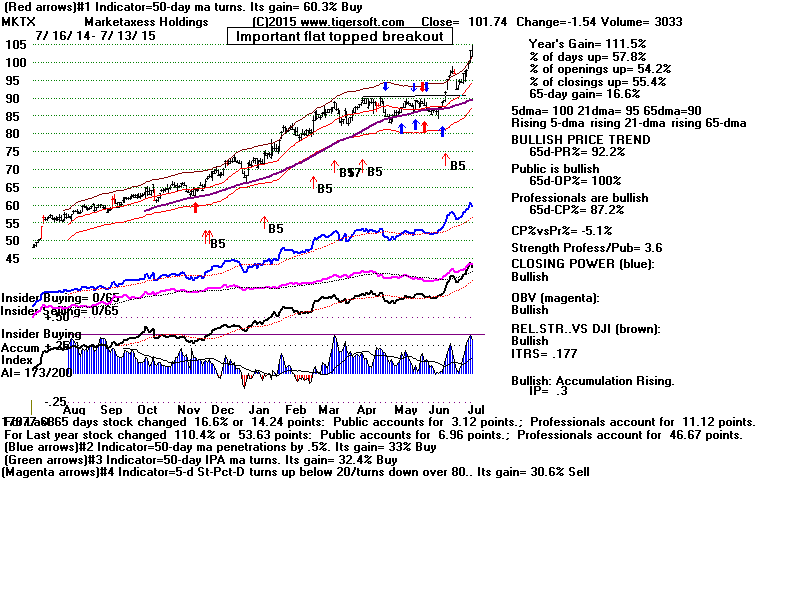
MKTX,
ANAC,
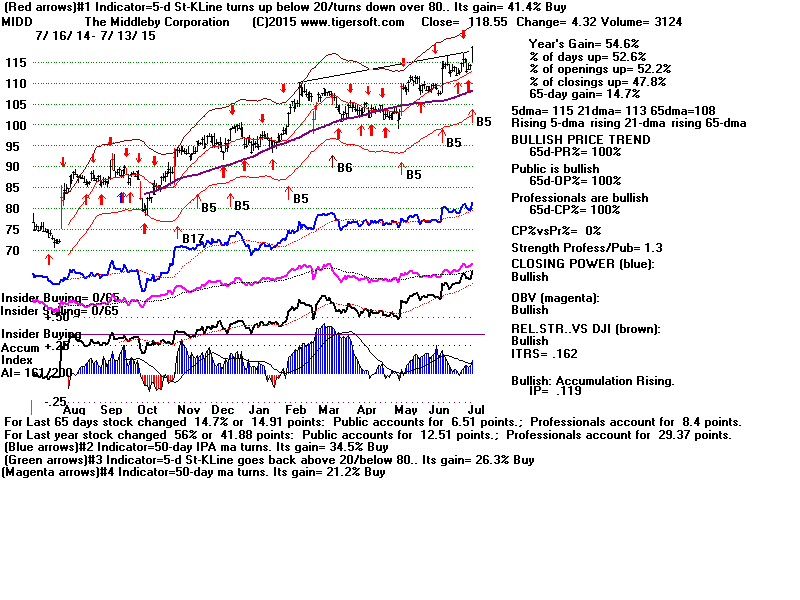
MIDD,
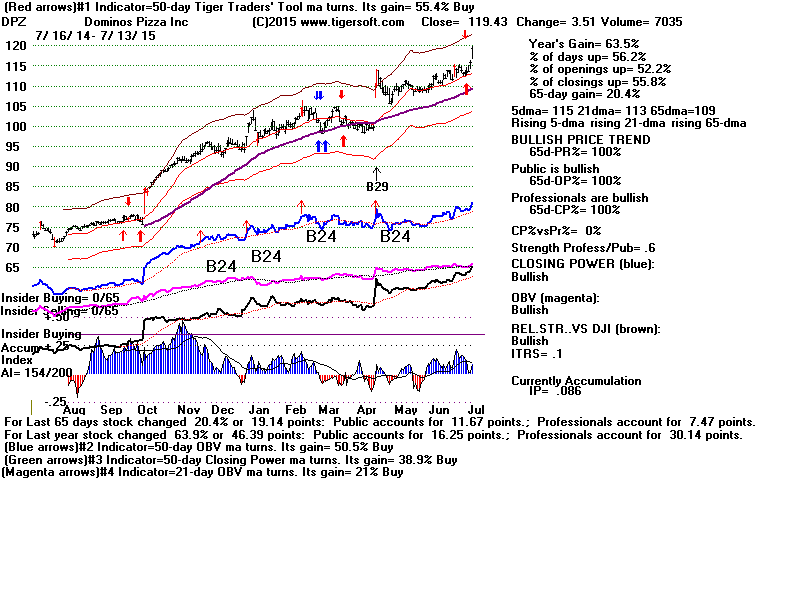
DPZ,
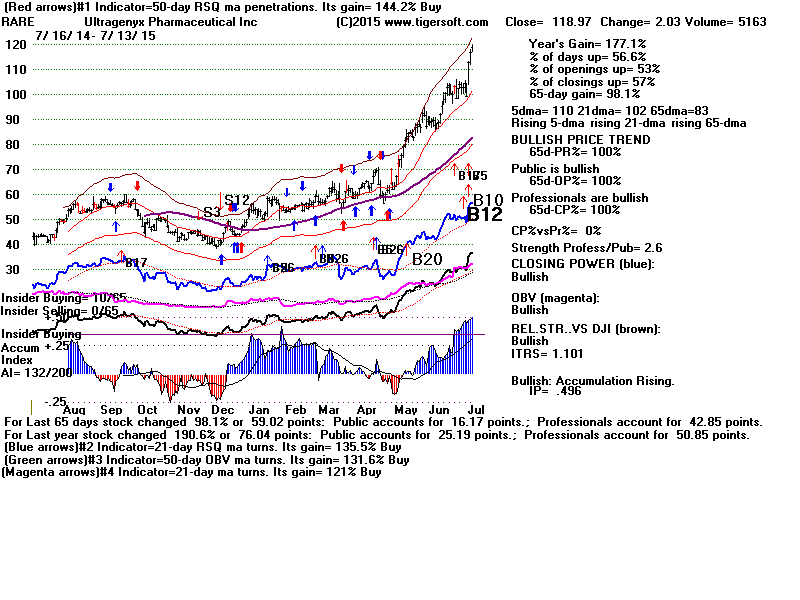
RARE,
SUPN,
LJPC,
SKX,
ETH,
MYGN,
TRIB,
EGRX,
ALNY,
BLUE
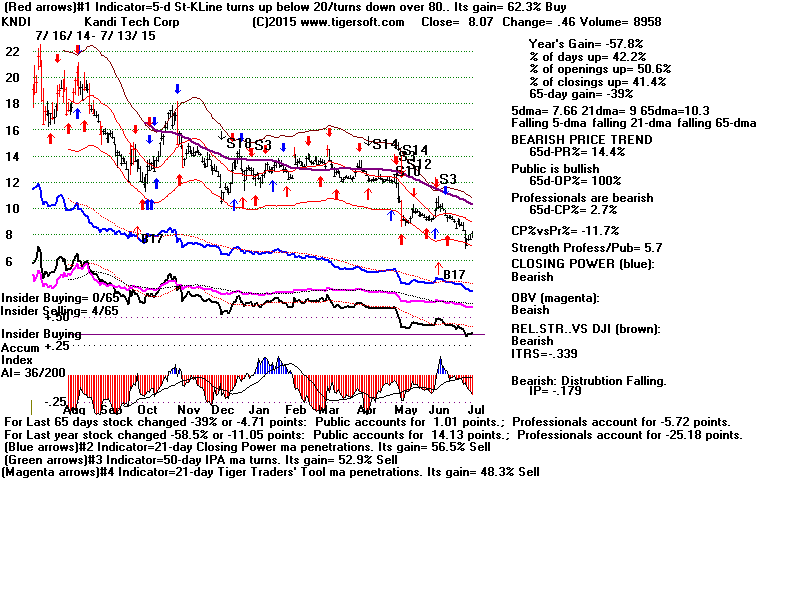
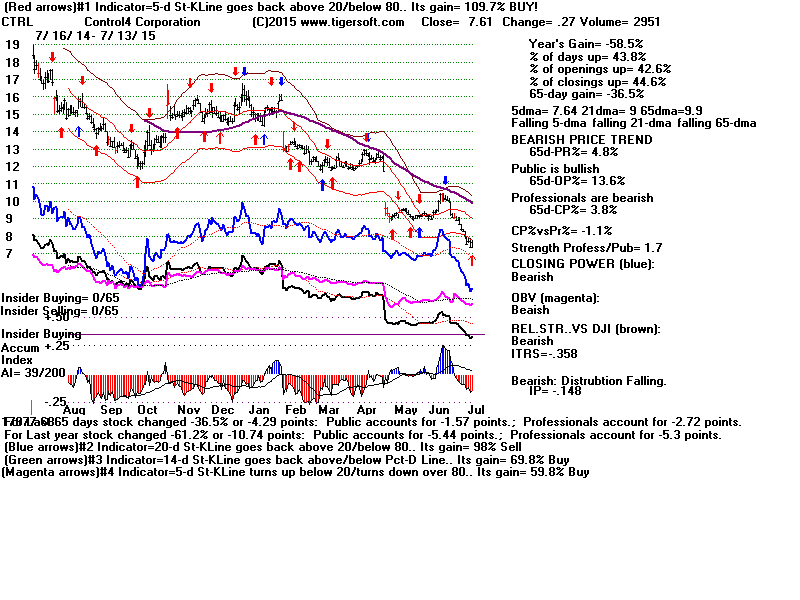
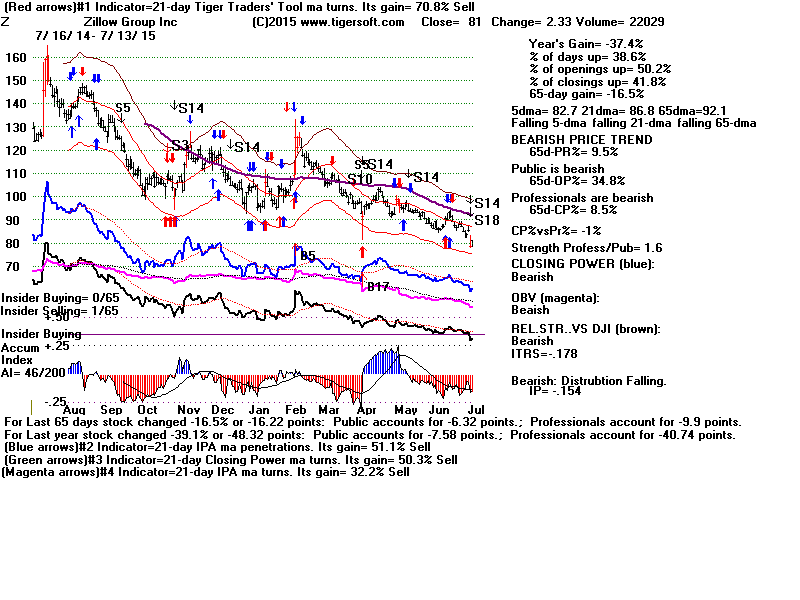
138 Bearish MINCPs
KNDI,
CTRL,
Z,
DLNG,
ABX,
CAR,
SLW,
GMCR,
ECA,
HTZ,
GASL,
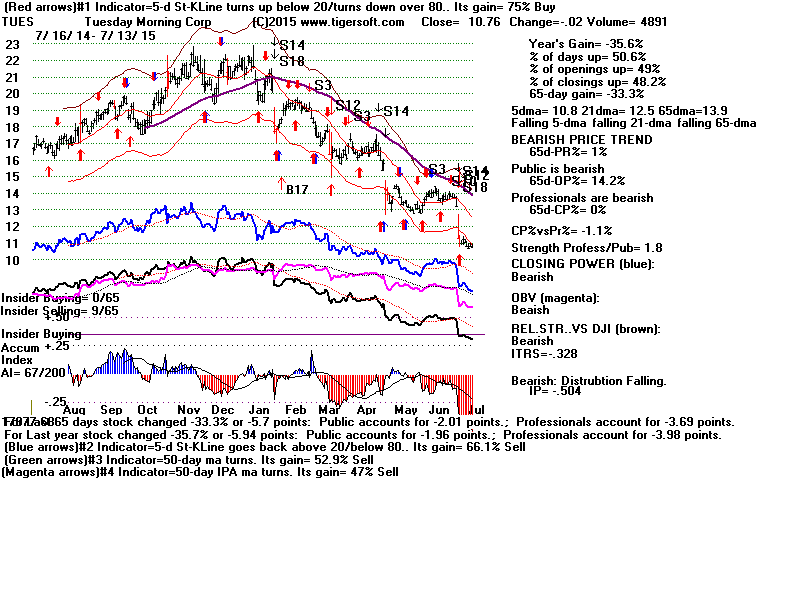
TUES,
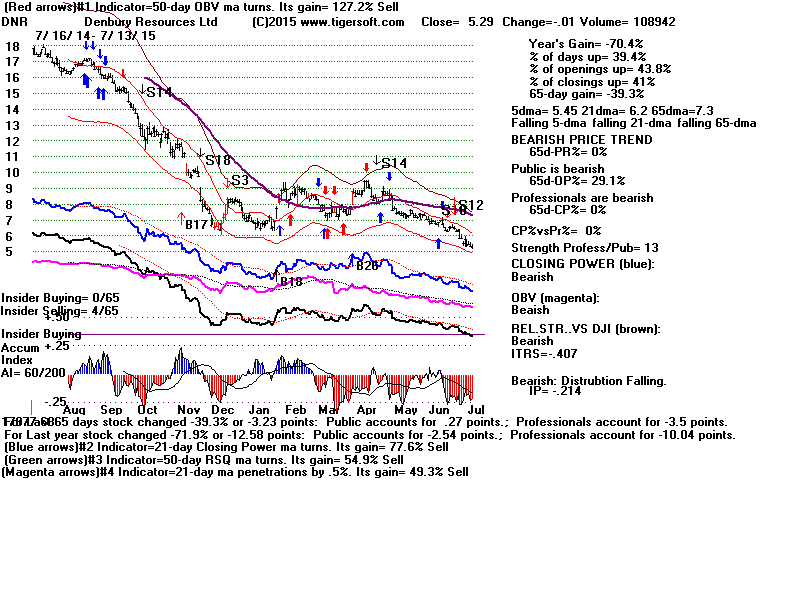
DNR
|
History of New Extended
Red Sell S12s
1929 June - bad Sell: failure after price
breakout (late Summer rally)
3.4% loss - reversed 6 days later
by Buy B4.
Note DJI was essentially unchanged from what it was
65-days before
and showed an OBVPct of +.156.
This signal was redundant, as there already was a
regular Sell S12.
1929 September 5-
perfect Sell
just before Crash! BIG DECLINE
+43.3% gain
LA/MA = 1.013 PI=-26 IP21= -.109 VI= -454 OBVPct
= .112
DJI was up 19% above its level of 65-days before.
This signal was redundant, as there already were a
variety of Peerless Sells.
1932 November 7 - premature Sell 64.6 --->
68.0 ---> 55.9 BIG DECLINE
+9.0% gain
LA/MA = 1.046 PI=-41 IP21= -.079 VI= -156 OBVPct
= - .069
DJI was up 8.3% above its level of 65-days before.
This signal was not as good as the perfect Sell S2
right at top.
1936 April 2 -
perfect Sell
BIG DECLINE
+6.7% gain
LA/MA = 1.026 PI=-27 IP21= -.089 VI= -231 OBVPct
= + .198
DJI was up 11.3% above its level of 65-days before.
This signal was redundant, as there already were a
variety of Peerless Sells.
1936 October 7 - bad Sell. but A/D Line was
weak until end of 1936 and this
was right after a
perfectly flat-topped breakout.
LA/MA = 1.034 PI=-14 IP21= -.051 VI= -105
OBVPct = + .253
(too high?)
DJI was up 12.2% above its level of 65-days before.
1959 December 31 -
perfect Sell BIG
DECLINE
1963 December 4 - bad Sell.
Early
December is not usually a good time to sell short.
LA/MA = 1.015 PI=-58 IP21= -.066 VI= -577 OBVPct
= + .028
DJI was up 4.0% above its level of 65-days before.
1964 June 19 -bad Sell. - 823 ---> 851 --->
833 and then up strongly.
The loss here would have been small using
Peerless.
It would have been 2.5% based on Peerless Buy B10 on
6/17/2015
LA/MA = 1.011 PI=-11 IP21= -.108 VI= -317 OBVPct
= - .006
DJI was
only up 0.8% above its level of 65-days before.
1965 April 12 - premature Sell - 906 --->
939.6 ---> 840
1967 April 18 - premature Sell - 873 ---> 909
---> 847
1972 August 2 - premature Sell - 944 --->
970.35 ---> 921.66
1998 June 29 - premature Sell - 8997.36 --->
9337.97 ---> 7539.07 BIG DECLINE
2000 August 7 - premature Sell - 10867 --->
11311 ---> 7539 BIG DECLINE
2012 December 5 - premature Sell - 13034 --->
13351 ---> 12938
2015 May 19 -
LA/MA = 1.013 PI= 13 IP21= -.008 VI= -48
OBVPct = .115
DJI was up 1.5% above its level from 65-days
before.
|
------------------------
Announcements
--------------------------------
E-Books
1
The On-Line Explosive Stocks
2
The On-Line Killer Short
Sales book
Purchase each all new book by CC for
$42.50 or send a check for $37.50 to me.
I call your
attention now to the many new concepts and
the considerable new research in them:
For example:
1) A very good New Tiger Buy B12 for Low
Priced Stocks
2) After Red high volume reversal days use CP
uptrend-breaks.
3) Buy the stocks the Federal Govt wants you
to buy.
4) 100-Day Power Rankings...
5) Using Closing Power Hooks after Buy B26s
and B20s.
6) How A Stock Reacts to Its Earnings Report
Is Very important.
7) TigerSoft Major Buy Signals' Combinations
Which are most Powerful? Reliable?
8) Augmented Buy B20s' Independent Success
Rate.
9) What factors warn a rising 65-dma will not
hold?
10) The classic cluster of technical
characteristics that commonly appear
in the 23 stocks falling 70% or more in
the deep pullback of 2011.
----------------------------------------------------------------------------------------------------------------------------------------------------------------------------
PEERLESS STOCK MARKET TIMING:
A Guide To
Profitably Using The Tiger Nightly HOTLINE
Peerless Signals: 1915-2014
New Peerless Signals and DJI Charts - version 7/4/2013
1965
1965-6 1966
1966-7 1967
1967-8 1968
1968-9 1969
1969-70
1970
1970-1
1971
1971-2 1972
1972-3
1973 1973-4
1974
1974-5 1975
1975-6
1976 1976-7
1977
1977-1978
1978
1978-79
1979 1979-80
1980 1980-1
1981 1981-2
1982 1982-1983
1983 1983-1984
1984
1984-1985
1985
1985-1986
1986 1986-1987
1987 1987-8
1988
1988-9 1989
1989-90
1990
1990-1 1991
1991-2 1992
1992-3 1993
1993-4 1994
1994-5 1995
1995-1996
1996
1996-7 1997
1997-8 1998
1998-1999 1999
1999-2000 2000
2000-1
2001 2001-2
2002
2002-3 2003
2003-4 2004
2004-5
2005 2005-6
2006 2006-7
2007 2007-8
2008 2008-9
2009
2009-10
2010 2010-11
2011 2011-12
2012
2012-2013
2013 2013-4 2014
Introduction to Tiger/Peerless Buys and Sells.
Different Types
of TigerSoft/Peerless CHARTS, Signals and Indicators
How reliable support is the DJI's rising 200-day ma?
-------------------------------------------------------------------------------------------------------------------
TIGERSOFT SIGNALS AND INDICATORS:
Documentation for TigerSoft
Automatic and Optimized Signals.
SPY Charts since 1994: Advisory Closing Power S7s, Accum. Index, 65-dma,
Optimized Signals.
"The
Jig Is Up": Calling September and October Tops.
A Keynesian's Warning Signs.
NUGT since 2012: A study of Tiger Technicals
Tiger Day
Traders Tool and most active Triple Leveraged ETFs
Advisory Pink Closing Power S7s at ETF at top since 1994
1994
1996
1997
1998
1999
2000 QQQ
SPY
DIA
2002
2007
2008
SPY 2011
2013-2014
Tiger Buy and Sell
Signals: New 2014 Research:
These are randomly chosen
groups.
but clearly we need to back-test them in more years.
You can replicate or do similar studies yourself
for other signals and/or other years.
9/1/2014 -
2014 Tiger
B19s - Steady rallying and no pullbacks below the 21-day ma.
9/2/2014 -
2014 Tiger
B17s on 14As taken alphabetically
9/3/2014 -
2014 Tiger B17s on 60
Biotechs taken alphabetically
9/4/2014 -
2014 Tiger
B18s on all "R" stocks taken alphabetically
* 9/8/2014 -
2014 Tiger
B20s - Conclusion: Use Closing Power trendbreaks in aftermath.
9/8/2014 -
2014 Tiger
B16s - Conclusion: Use mostly when
LA/MA under 1.05.
9/11/2014 -
2014 Tiger
B15s - Conclusion: Certain conditions
improved the results dramatically.
9/12/2014 -
2014 Tiger
B25s - Conclusion: 87.5% success rate
when other internals are positive.
9/15/2014 -
2014 Tiger B25s -
Best conditions for using B25s with somewhat
higher RSX capitalization stocks.
9/16/2014 -
New Tiger
Closing Power Take-Off Buy Signal in 2014: 14s, QQQ, DJI-30 and ETFs
9/17/2014 -
New Tiger
Closing Power Take-Off Buy Signal: 2009A-s
9/18/2014 -
New Tiger
Closing Power Take-Off Buy Signal: 2010A-s
9/21/2014 -
New Tiger
Augmented Sell S8s: DJI-30 - 2014
Requiring S8s to show
Negative CP%-Pr and IP21<+.15 produced a 70% success rate
in a rising market for
DJI-30 stocks and big ETFs.
9/24/2014 -
Tiger Sell
S14s: They make price breakdowns very bearish.
1/15/2015
-
Tiger Day
Traders' Tool Explained.
http://www.tigersoft.com/day-traders/index.html
http://www.tigersoft.com/Indicators/index.htm
http://www.tigersoftware.com/TigerBlogs/Aug-31-2009/index.html
NEW
2/16/2015
1) New -
Tiger Charts showing UP%, Opening-Up%, Closing-Up%
Note differences between bullish
and bearish stocks...
2) New -
UP%,
Opening-Up%, Closing-Up% Rankings of any directory.
3) New -
Display of what happens to a stock after various size openings up or down.
4) New -
6-month charts to better
show volume changes and 5-day ma with bands.
More profitable trading schemes coming...
Targeted Trading Opportunities:The Profits Quickly Add Up,
3/29/2015
Tiger CandleSticks:
IBB: 2001-2015
and
Recent Others.
====================================================================================
Earlier Hotlines
2-7-2014 to 3/19/2014
11-22-2014 to 2-6-2014
http://tigersoftware.com/555HL555/index.htm
10/9/2014 - 11/21/2014
http://tigersoftware.com/9933Hot/
9/2/2014 - 10/8/2014-
http://tigersoftware.com/2233HL/index.html
6/25/2013-9/1/2014
http://tigersoftware.com/112211-H/index.htm
11/22/2013-3/20/2014
http://tigersoft.com/1111-HL/index.html
10/22/2013-11/21/2013
Past
Hotline Predictions
http://tigersoft.com/-HL42013/index.html
http://www.tigersoft.com/-2GBL13HL/index.htm
==============================================================================================================================