continued by the Accum. Index (IP21) being below its 21-day and the
A/D Line downtrend still extant.
TigerSoft and Peerless Daily
Hotline
(C) 1985-2015 William Schmidt,
Ph.D. www.tigersoft.com
All rights
strictly reserved.
Tiger Software
858-273-5900 PO Box 22784 San Diego, CA 92192 Email
william_schmidt@hotmail.com
------------------------------------------------------------------------------------------------------------------
7/10/2014 A new Greek bailout has just been
agreed to. This saves the EURO.
and big European bankers for the time being. In response, the DJI should
continue its rally back to 17800 to close the downward gap there in the DJI.
Have We Just Had A Typical Pullback?
Bulls will point to how well the DJI has held up in the face of scary reporting
about Greece and China. They will point to the general bullishness of July.
In addition, I have warned not to fight the Fed or the Chinese Government.
They can make a long bull market get even longer if they wish. And with
next year being a Presidential Election year, we should not be surprised if the
Administration gets its allies in the FED to prop up the market for a lot
longer than the perma-bears will like.
Another Pullback and Test of 17500 Seems Likely
Friday's saw a reversal up from the 17500 support with a ratio of advancing
NYSE stocks to declining stocks of 3.93 to 1. I did more checking
about recent reversals since 2011. In fact, six of the last 12
reversals upwards had lower ratios of advances to declines as they
turned back upward preparatory to making at least a nominal closing
high. This means can take Monday's breadth as being consistent with a
valid recovery. So, that's a bullish consideration now.
But there are several problems with the bullish viewpoint that we have just had
a typical benign intermediate-term decline. The first problem is the
the depth of the DJI's pullback from its previous high was shallower here
than in all of the 12 pullbacks that led to a recovery. The second problem
is how much lower the IP21 was at its bottom here than in any of the
previous cases.. I think this suggests that the DJI has probably not
reached a
sufficiently oversold reading to make a bottom very trustworthy. It's true
the OBVPct does not show heavy dumping. But OBVPct is not as good a
predictor as the Hourly OBV/DISI has been and as I keep saying, this
Hourly indicator remains distinctly bearish.
Strong Breadth and DJI Reversals back Upward
after An Intermediate-Term Decline: 2011-2015
Date Pct. Decline from
Ratio of
Lowest Lowest
Recent Peak NYSE
Adv/Decl IP21 Level OBVPct
------------------------------------------------------------------------------------
8/11/2011 15.0%
12.4 :1
-.275
-.442 Quick bounce and
and then a re-test of lows.
10/5/2011 8.0%
2.74 :1 (lower) -.064
+.028
11/28/2011 8.2%
5.09 :1
-.037
-.032
6/6/2012 8.8%
7.14 :1
-.131
-.659 (very oversold)
12/19/2012 7.5%
7.57 :1
-.205
-.179
6/26/2013 5.0%
3.5 :1 (lower) -.111
-.018
9/9/2013 5.5%
4.01 :1 (lower) -.127
-.347
10/10/2013 6.0%
5.68 :1
-.129
-.241
2/6/2014 7.0%
3.02 :1 (lower) -.167
-.382
10/20/2014 6.5%
2.85 :1 (lower) -.186
-.212
12/17/2014 4.7%
7.61 :1
-.088
-.025
2/15/2015 5.0%
3.08 :1 (lower) -.075
-.210
7/10/2015 4.2%
LOWEST 3.93 :1
-.293 LOWEST -.076
(fifth lowest)
The Technicals Are Still Bearish. So another successful test of
17500 will probably be needed before the market shows an ability
to advance after the Opening.
Most Professionals are still fighting the Fed and the Chinese Government.
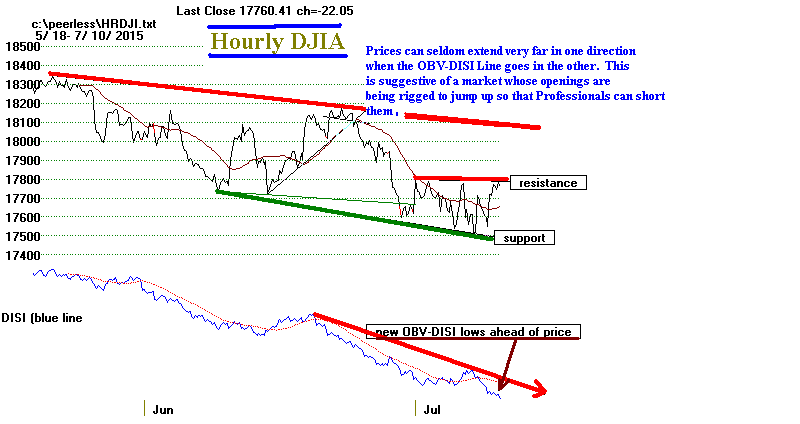
We continue to see this in the way the Hourly DJI's DISI-OBV Line is
making new lows despite the DJI's move up from just above 17500 to
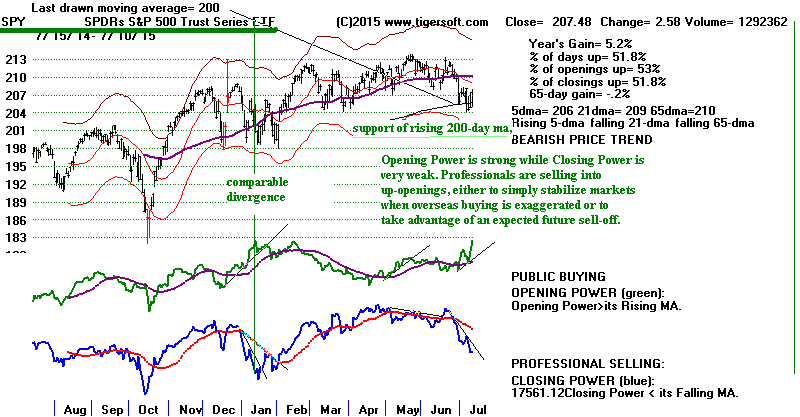
just below 17800 on Friday. We see it in the way Opening Powers for
the DIA (as well as SPY and QQQ) are making new highs while their
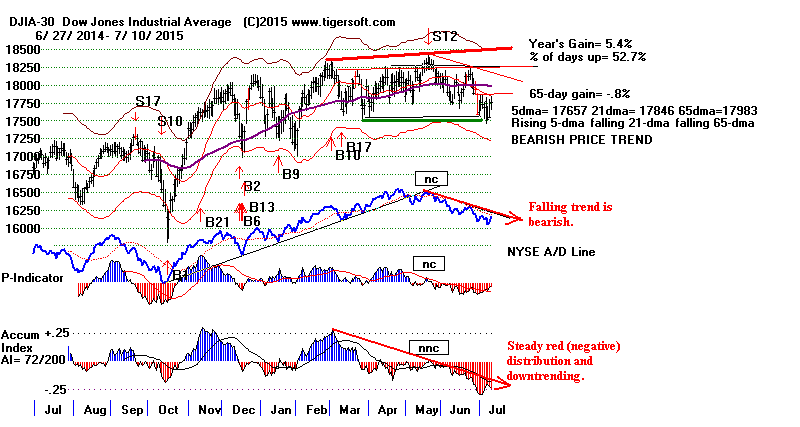
Closing Powers still downtrending. And we see it in the way the Peerless
Accumulation Index on the DJI-30 remains deeply red and is still downtrending.
See this in the charts just below.
| Hourly DJI
vs DISI/OBV Line |
| Opening
Power Strength versus Closing Power Weakness in SPY |
| Peerless
DJI's last signal is based on lengthy red (negative) period and is continued by the Accum. Index (IP21) being below its 21-day and the A/D Line downtrend still extant. |
I suggested adding more short sales from among the Bearish MINCP stocks
on a rally to 17800 or on a close below
17500. There are still not enough
Bullish MAXCP stocks to do much buying yet.
The operative Peerless
S12 must stand for now, at least until the
A/D Line breaks its downtrend
or we get a new Peerless Buy signal.

Playing The
Over-Night Bounces
PLUS
QUICKSILVER FASTUP and FASTDOWN STOCKS
With the market showing more smaller jerks and jolts and fewer
sustained trends, it probably pays to trade more. With all the higher
openings than the previous day's close, one might simply buy stocks with a
high UP% at the close and sell them at the opening. The High UP%
rankings offer some ideas here.
Stock % of days in
last year Avg
Daily Gain on Openings
that Openings were higher when Opening Power Rising
------------------------------------------------------------------------
CURE 64.5%
0.5%
ESPR 57.0%
0.7%
ALNY 57.0%
0.4%
QUICKSILVER FASTUP and FASTDOWN STOCKS
. .
One new thing traders can do now is to trade with the five-day ma trends
with the new "FASTUP" and FASTDOWN" downloads I have just
added to the Tiger Data Page. These are all the stocks and ETFs with
a 5-day ma that is rising faster than an annualized rate of 500% or falling
faster that at a rate of more than -500%. I suggest running the Tiger
Power Ranker against these two groups of stocks and using our QuickSilver
rules. Short-term traders should hold long the very strongest FASTUPs
so long as they do not close below their 5-day "pivot-points" and hold short
the very weakest FASTDOWN so long as they do not close above their
5-day pivot points. Try to take positions within 1% of the 5-day ma.
If you
like, close out part of the position on moves 5-7% away from the 5-day ma.
and keep shorting on each reversal down from the 5-day ma.
To show how this works, consider the recent recent cases of GASL, LJPC
and NUGT. More on this tomorrow night.
Many good trades will also start out when the 5-day ma reaches a more
modest +250% or a less steep -250%. I will add a flag program to let you
find such stocks in any directory you wish to apply it. I also want to
provide
a file ranking the percent changes of the 5-day ma with the associated key
values.
See this below as it works with he leveraged ETFs.
QUICKSILVER FASTUP and FASTDOWN STOCKS
GASL 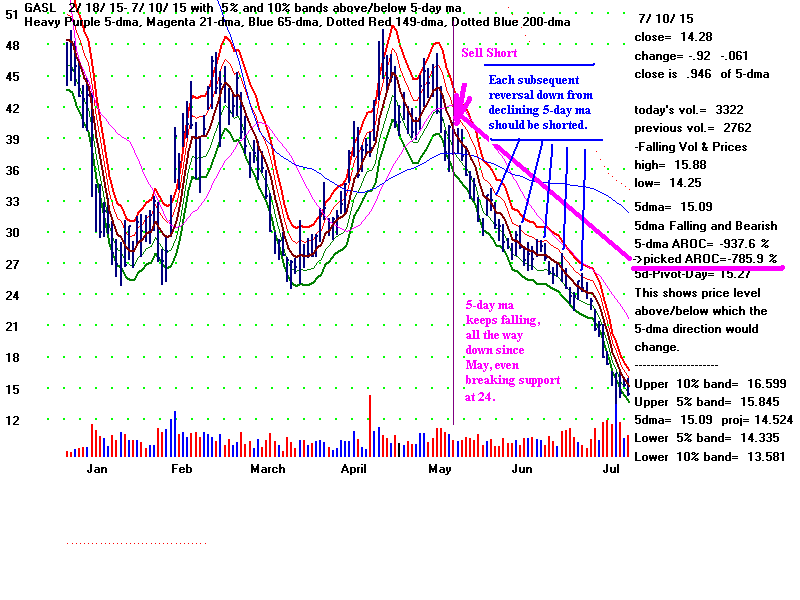 |
LJPC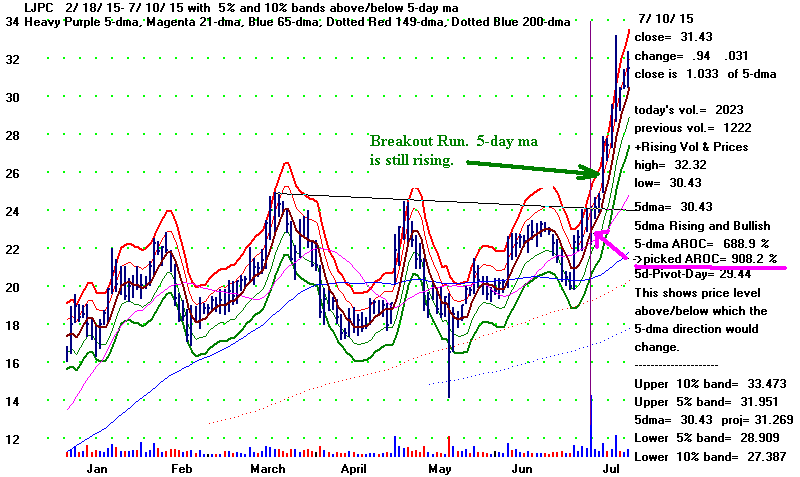 |
NUGT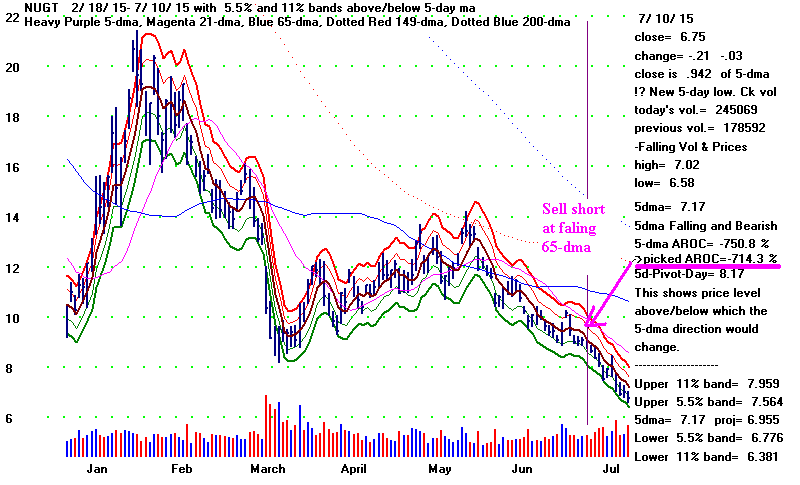 |
More and More Stocks Have
Over Head Resistance at Their 65-dma
Index/Sector Pct.of Stocks
above 65-dma.
today .... yesterday
-----------------------------------------------------------------------------------------------
DJI-30
33.0%
16.7%
http://www.tigersoftware1.com/HH/MASTDOWJ.GIF
oversold
SP-500 40,8% 28.3% http://www.tigersoftware1.com/HH/MASTSP50.GIF
QQQ 34.7% 27.6%
http://www.tigersoftware1.com/HH/MASTNASD.GIF
Russell-1000 52.9% 30.1%
http://www.tigersoftware1.com/HH/MASTRUS-.GIF
OEX
40.8% 28.6%
http://www.tigersoftware1.com/HH/MASTSP-1.GIF
All Stocks
27.7% 26.5%
http://www.tigersoftware1.com/HH/DATA65.GIF
| DIA, SPY, QQQ, IWM and IBB ---------------------------------------------------------------- DIA http://www.tigersoftware1.com/HH/DIA.GIF SPY http://www.tigersoftware1.com/HH/SPY.GIF QQQ http://www.tigersoftware1.com/HH/QQQ.GIF IWM http://www.tigersoftware1.com/HH/IWM.GIF IBB http://www.tigersoftware1.com/HH/IBB.GIF OIH http://www.tigersoftware1.com/HH/OIH.GIF KOL http://www.tigersoftware1.com/HH/KOL.GIF
|
 7/10/2015 150+ TigerSoft Charts
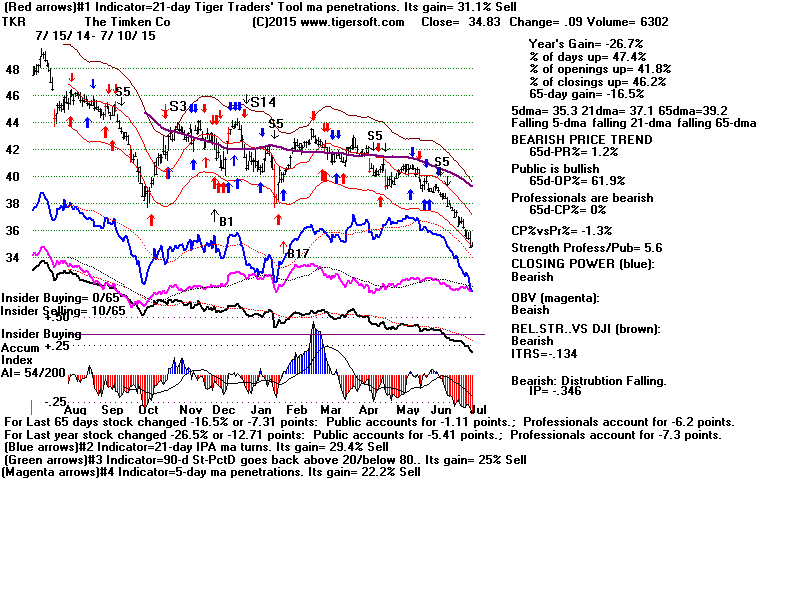
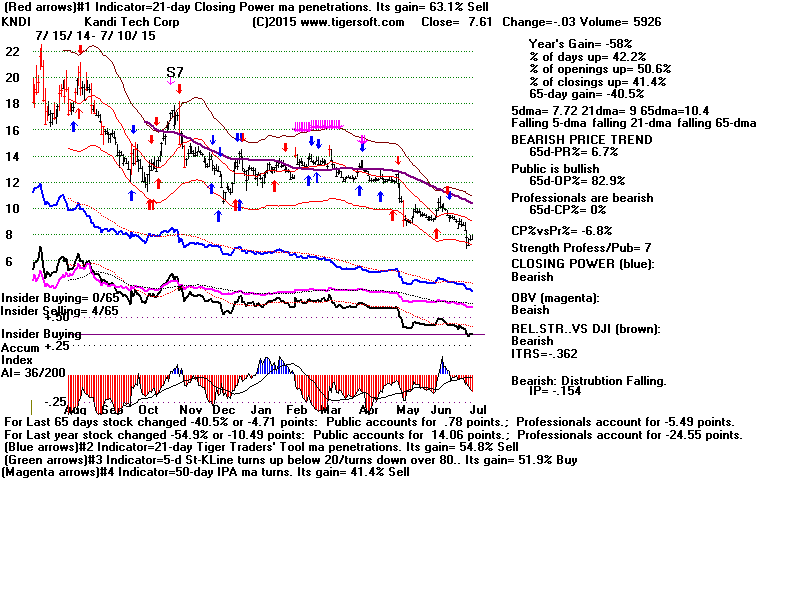
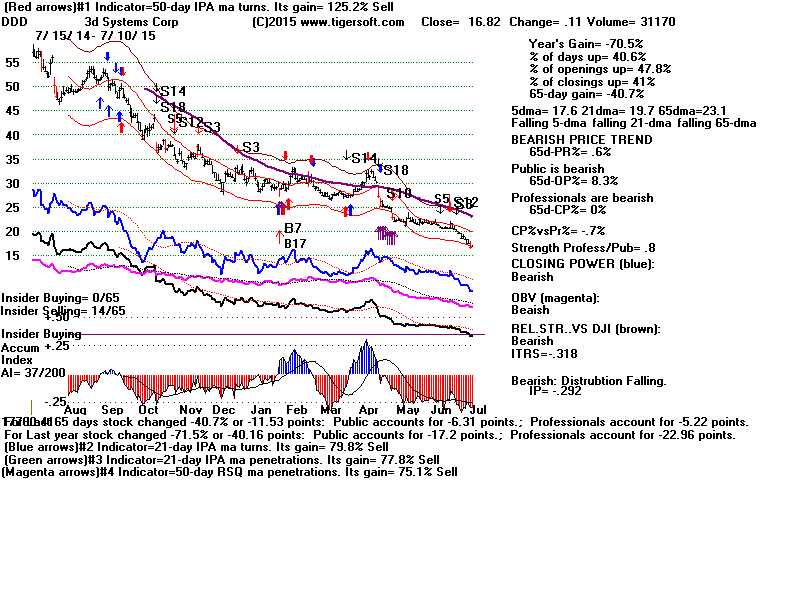
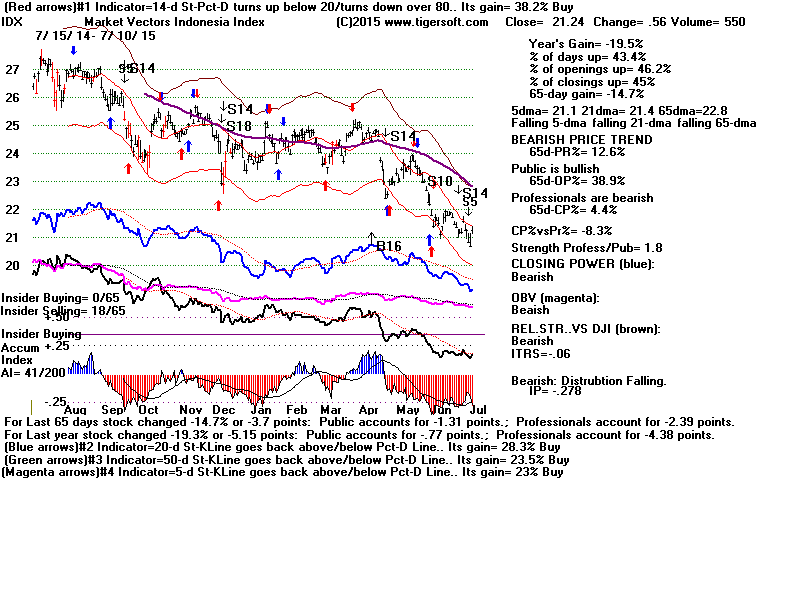
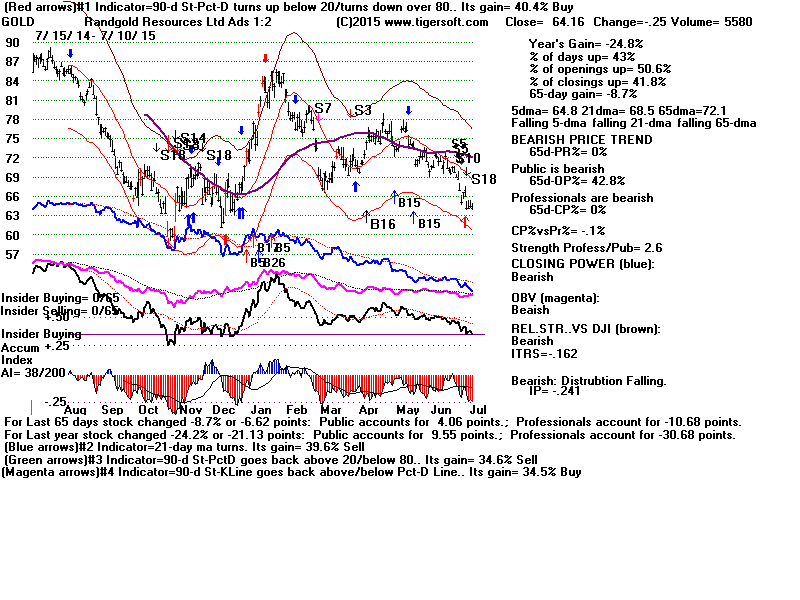
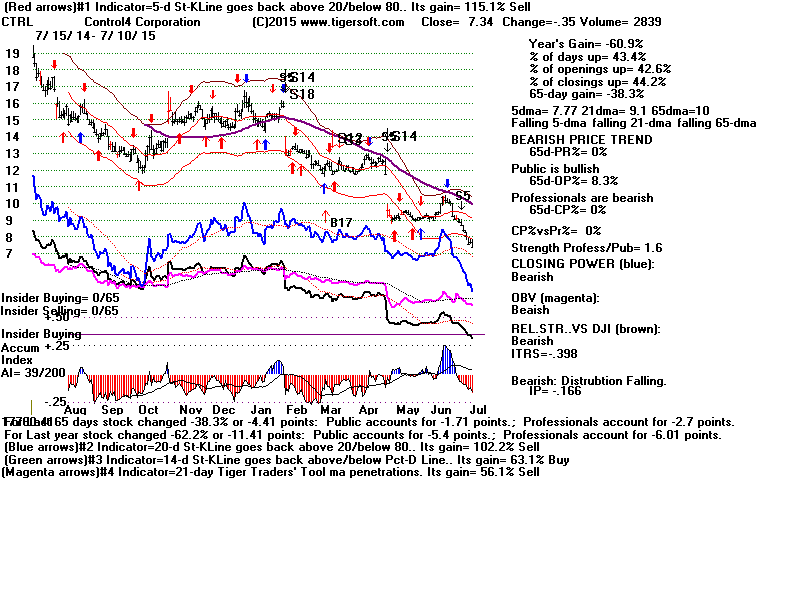
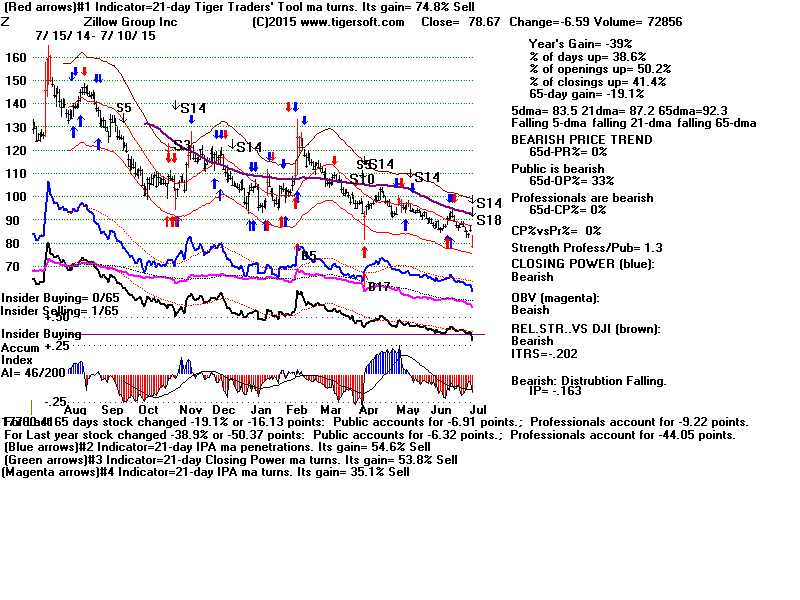
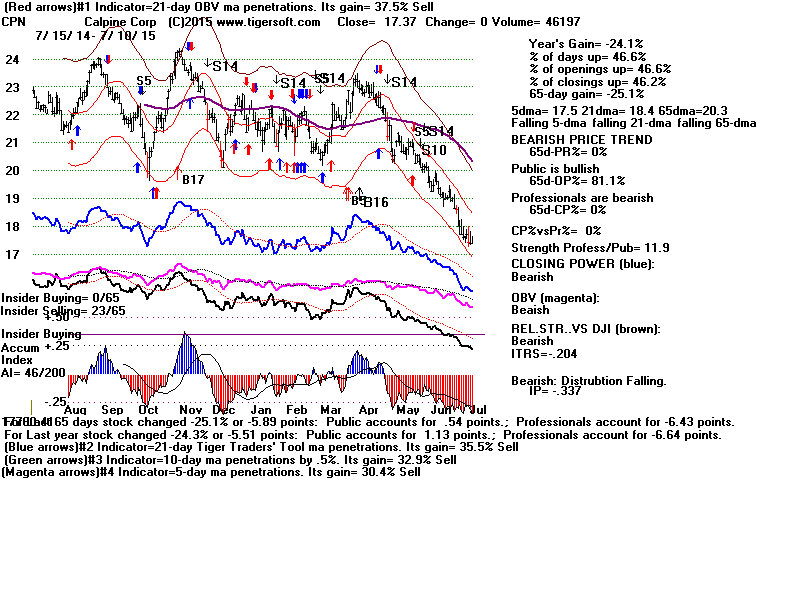
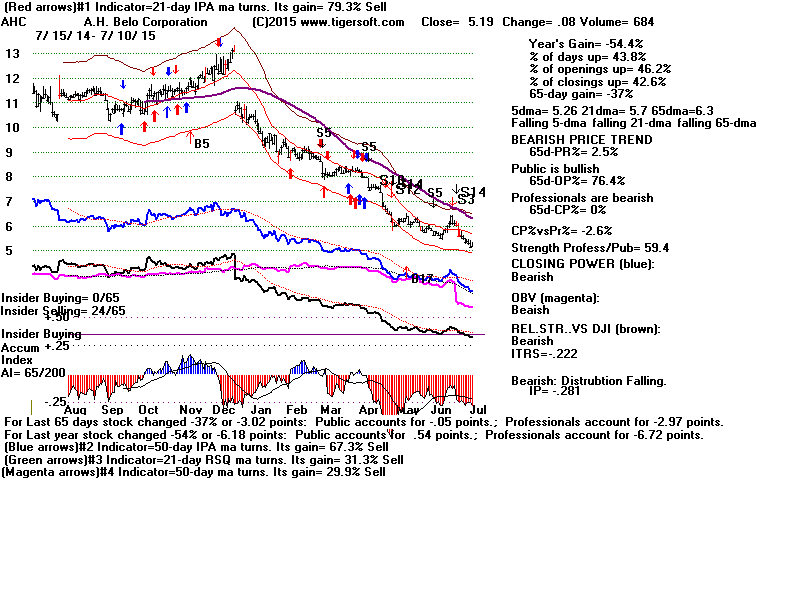
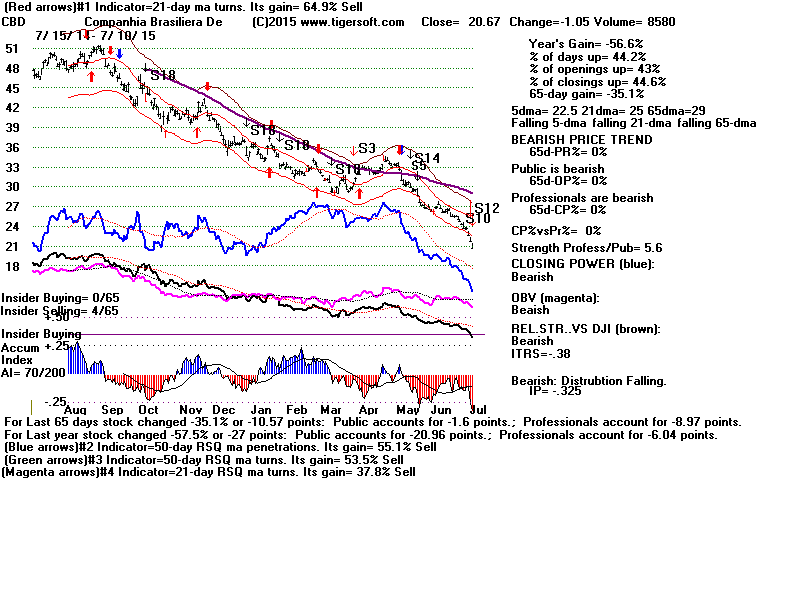
 Go to http://tigersoftware1.com/HH/ to see them. New Highs: NASD 48 NYSE 33 New Lows: NASD 30 NYSE 32 22 Bullish MAXCPs http://www.tigersoftware1.com/MAXMIN/7-10/bullish.htm 272 Bearish MINCPs - The stocks are: TKR, KNDI, DDD, IDX, GOLD, CTRL, Z, CPN, AHC and CBD The great plurality of Bearish MINCPs over Bullish MAXCPs warns that Professionals are still bearish many more stocks than they are bullish. There is little point in trying to pick a winner on the long side now. |
|
History of New Extended
Red Sell S12s 1929 June - bad Sell: failure after price breakout (late Summer rally) 3.4% loss - reversed 6 days later by Buy B4. Note DJI was essentially unchanged from what it was 65-days before and showed an OBVPct of +.156. This signal was redundant, as there already was a regular Sell S12. 1929 September 5- perfect Sell just before Crash! BIG DECLINE +43.3% gain LA/MA = 1.013 PI=-26 IP21= -.109 VI= -454 OBVPct = .112 DJI was up 19% above its level of 65-days before. This signal was redundant, as there already were a variety of Peerless Sells. 1932 November 7 - premature Sell 64.6 ---> 68.0 ---> 55.9 BIG DECLINE +9.0% gain LA/MA = 1.046 PI=-41 IP21= -.079 VI= -156 OBVPct = - .069 DJI was up 8.3% above its level of 65-days before. This signal was not as good as the perfect Sell S2 right at top. 1936 April 2 - perfect Sell BIG DECLINE +6.7% gain LA/MA = 1.026 PI=-27 IP21= -.089 VI= -231 OBVPct = + .198 DJI was up 11.3% above its level of 65-days before. This signal was redundant, as there already were a variety of Peerless Sells. 1936 October 7 - bad Sell. but A/D Line was weak until end of 1936 and this was right after a perfectly flat-topped breakout. LA/MA = 1.034 PI=-14 IP21= -.051 VI= -105 OBVPct = + .253 (too high?) DJI was up 12.2% above its level of 65-days before. 1959 December 31 - perfect Sell BIG DECLINE 1963 December 4 - bad Sell. Early December is not usually a good time to sell short. LA/MA = 1.015 PI=-58 IP21= -.066 VI= -577 OBVPct = + .028 DJI was up 4.0% above its level of 65-days before. 1964 June 19 -bad Sell. - 823 ---> 851 ---> 833 and then up strongly. The loss here would have been small using Peerless. It would have been 2.5% based on Peerless Buy B10 on 6/17/2015 LA/MA = 1.011 PI=-11 IP21= -.108 VI= -317 OBVPct = - .006 DJI was only up 0.8% above its level of 65-days before. 1965 April 12 - premature Sell - 906 ---> 939.6 ---> 840 1967 April 18 - premature Sell - 873 ---> 909 ---> 847 1972 August 2 - premature Sell - 944 ---> 970.35 ---> 921.66 1998 June 29 - premature Sell - 8997.36 ---> 9337.97 ---> 7539.07 BIG DECLINE 2000 August 7 - premature Sell - 10867 ---> 11311 ---> 7539 BIG DECLINE 2012 December 5 - premature Sell - 13034 ---> 13351 ---> 12938 2015 May 19 - LA/MA = 1.013 PI= 13 IP21= -.008 VI= -48 OBVPct = .115 DJI was up 1.5% above its level from 65-days before. |
------------------------
Announcements
--------------------------------
E-Books
1
The On-Line Explosive Stocks
2
The On-Line Killer Short
Sales book
Purchase each all new book by CC for
$42.50 or send a check for $37.50 to me.
I call your
attention now to the many new concepts and
the considerable new research in them:
For example:
1) A very good New Tiger Buy B12 for Low
Priced Stocks
2) After Red high volume reversal days use CP
uptrend-breaks.
3) Buy the stocks the Federal Govt wants you
to buy.
4) 100-Day Power Rankings...
5) Using Closing Power Hooks after Buy B26s
and B20s.
6) How A Stock Reacts to Its Earnings Report
Is Very important.
7) TigerSoft Major Buy Signals' Combinations
Which are most Powerful? Reliable?
8) Augmented Buy B20s' Independent Success
Rate.
9) What factors warn a rising 65-dma will not
hold?
10) The classic cluster of technical
characteristics that commonly appear
in the 23 stocks falling 70% or more in
the deep pullback of 2011.
----------------------------------------------------------------------------------------------------------------------------------------------------------------------------
PEERLESS STOCK MARKET TIMING:
A Guide To
Profitably Using The Tiger Nightly HOTLINE
Peerless Signals: 1915-2014
New Peerless Signals and DJI Charts - version 7/4/2013
1965
1965-6 1966
1966-7 1967
1967-8 1968
1968-9 1969
1969-70
1970
1970-1
1971
1971-2 1972
1972-3
1973 1973-4
1974
1974-5 1975
1975-6
1976 1976-7
1977
1977-1978
1978
1978-79
1979 1979-80
1980 1980-1
1981 1981-2
1982 1982-1983
1983 1983-1984
1984
1984-1985
1985
1985-1986
1986 1986-1987
1987 1987-8
1988
1988-9 1989
1989-90
1990
1990-1 1991
1991-2 1992
1992-3 1993
1993-4 1994
1994-5 1995
1995-1996
1996
1996-7 1997
1997-8 1998
1998-1999 1999
1999-2000 2000
2000-1
2001 2001-2
2002
2002-3 2003
2003-4 2004
2004-5
2005 2005-6
2006 2006-7
2007 2007-8
2008 2008-9
2009
2009-10
2010 2010-11
2011 2011-12
2012
2012-2013
2013 2013-4 2014
Introduction to Tiger/Peerless Buys and Sells.
Different Types
of TigerSoft/Peerless CHARTS, Signals and Indicators
How reliable support is the DJI's rising 200-day ma?
-------------------------------------------------------------------------------------------------------------------
TIGERSOFT SIGNALS AND INDICATORS:
Documentation for TigerSoft
Automatic and Optimized Signals.
SPY Charts since 1994: Advisory Closing Power S7s, Accum. Index, 65-dma,
Optimized Signals.
"The
Jig Is Up": Calling September and October Tops.
A Keynesian's Warning Signs.
NUGT since 2012: A study of Tiger Technicals
Tiger Day
Traders Tool and most active Triple Leveraged ETFs
Advisory Pink Closing Power S7s at ETF at top since 1994
1994
1996
1997
1998
1999
2000 QQQ
SPY
DIA
2002
2007
2008
SPY 2011
2013-2014
Tiger Buy and Sell
Signals: New 2014 Research:
These are randomly chosen
groups.
but clearly we need to back-test them in more years.
You can replicate or do similar studies yourself
for other signals and/or other years.
9/1/2014 -
2014 Tiger
B19s - Steady rallying and no pullbacks below the 21-day ma.
9/2/2014 -
2014 Tiger
B17s on 14As taken alphabetically
9/3/2014 -
2014 Tiger B17s on 60
Biotechs taken alphabetically
9/4/2014 -
2014 Tiger
B18s on all "R" stocks taken alphabetically
* 9/8/2014 -
2014 Tiger
B20s - Conclusion: Use Closing Power trendbreaks in aftermath.
9/8/2014 -
2014 Tiger
B16s - Conclusion: Use mostly when
LA/MA under 1.05.
9/11/2014 -
2014 Tiger
B15s - Conclusion: Certain conditions
improved the results dramatically.
9/12/2014 -
2014 Tiger
B25s - Conclusion: 87.5% success rate
when other internals are positive.
9/15/2014 -
2014 Tiger B25s -
Best conditions for using B25s with somewhat
higher RSX capitalization stocks.
9/16/2014 -
New Tiger
Closing Power Take-Off Buy Signal in 2014: 14s, QQQ, DJI-30 and ETFs
9/17/2014 -
New Tiger
Closing Power Take-Off Buy Signal: 2009A-s
9/18/2014 -
New Tiger
Closing Power Take-Off Buy Signal: 2010A-s
9/21/2014 -
New Tiger
Augmented Sell S8s: DJI-30 - 2014
Requiring S8s to show
Negative CP%-Pr and IP21<+.15 produced a 70% success rate
in a rising market for
DJI-30 stocks and big ETFs.
9/24/2014 -
Tiger Sell
S14s: They make price breakdowns very bearish.
1/15/2015
-
Tiger Day
Traders' Tool Explained.
http://www.tigersoft.com/day-traders/index.html
http://www.tigersoft.com/Indicators/index.htm
http://www.tigersoftware.com/TigerBlogs/Aug-31-2009/index.html
NEW
2/16/2015
1) New -
Tiger Charts showing UP%, Opening-Up%, Closing-Up%
Note differences between bullish
and bearish stocks...
2) New -
UP%,
Opening-Up%, Closing-Up% Rankings of any directory.
3) New -
Display of what happens to a stock after various size openings up or down.
4) New -
6-month charts to better
show volume changes and 5-day ma with bands.
More profitable trading schemes coming...
Targeted Trading Opportunities:The Profits Quickly Add Up,
3/29/2015
Tiger CandleSticks:
IBB: 2001-2015
and
Recent Others.
====================================================================================
Earlier Hotlines
2-7-2014 to 3/19/2014
11-22-2014 to 2-6-2014
http://tigersoftware.com/555HL555/index.htm
10/9/2014 - 11/21/2014
http://tigersoftware.com/9933Hot/
9/2/2014 - 10/8/2014-
http://tigersoftware.com/2233HL/index.html
6/25/2013-9/1/2014
http://tigersoftware.com/112211-H/index.htm
11/22/2013-3/20/2014
http://tigersoft.com/1111-HL/index.html
10/22/2013-11/21/2013
Past
Hotline Predictions
http://tigersoft.com/-HL42013/index.html
http://www.tigersoft.com/-2GBL13HL/index.htm
==============================================================================================================================