TigerSoft and Peerless Daily
Hotline
(C) 1985-2015 William Schmidt,
Ph.D. www.tigersoft.com
All rights
strictly reserved.
Tiger Software
858-273-5900
PO Box 22784 San Diego, CA 92192 Email
william_schmidt@hotmail.com
------------------------------------------------------------------------------------------------------------------
6/24/2015 DJI's
Internal Weakness Predicts Another Key Test of 17700.
This is an easy prediction to
make. Short DIA on its strong opening tomorrow
but hold long IBB and IWM.
1) The DJI's Accumulation Index remains negative, just as it has been
for nearly 60 trading days.
This represents a stunning amount of steady distribution
of stock on intra-day strength
by Institutions. (See DJI's "Data" chart).
This is
what has produced the new Red
Peerless Sell S12. It warns that the 17700 support
may well give way in the next
month. The upside potential for the DJI is just too limited
for most traders to keep
supporting the DJI at 17700.
2) The declining NYSE A/D Line trend shows the abundant selling
in bonds, REITs, and the
majority of dividend stocks. (See NYSE A/D Line
on
DJI's "Data" chart). In fact, only 2.4% of utilities, only 4.7% of
bond
| funds and only 12.5% of utilities
are above their 65-dma. (See DJI's "Data" chart).
The market is adjusting to the
increasing likelihood of higher interest rates.
3) The truly terrible looking bearish divergence between the
Hourly DJI and its Hourly DISI/OBV
Line warns that aggressive selling
in the highly visible and
potent DJI stocks has now become a well-established
pattern.
The only question now is how much of these funds will go into smaller
NASDAQ stocks. A little
money can go a long ways in smaller stocks.
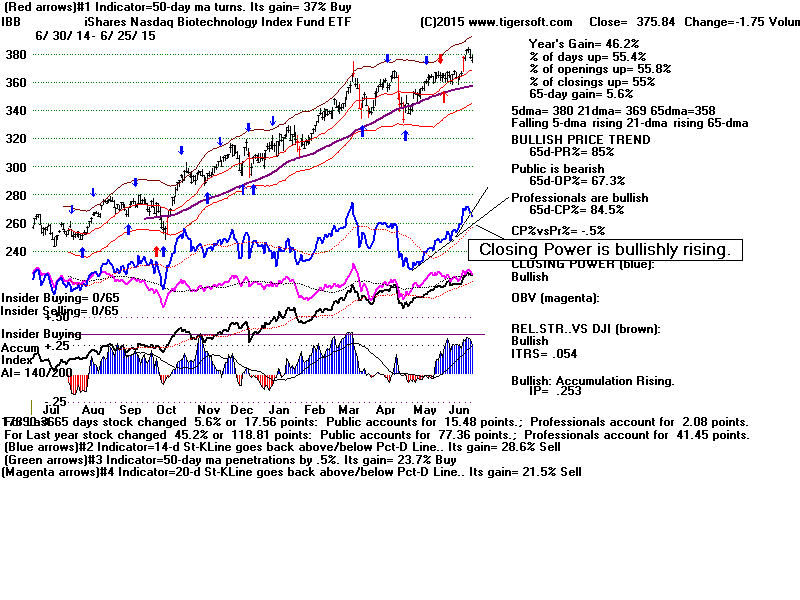
We know that new
high-performance money is being re-channeled into
aggressive purchases on the
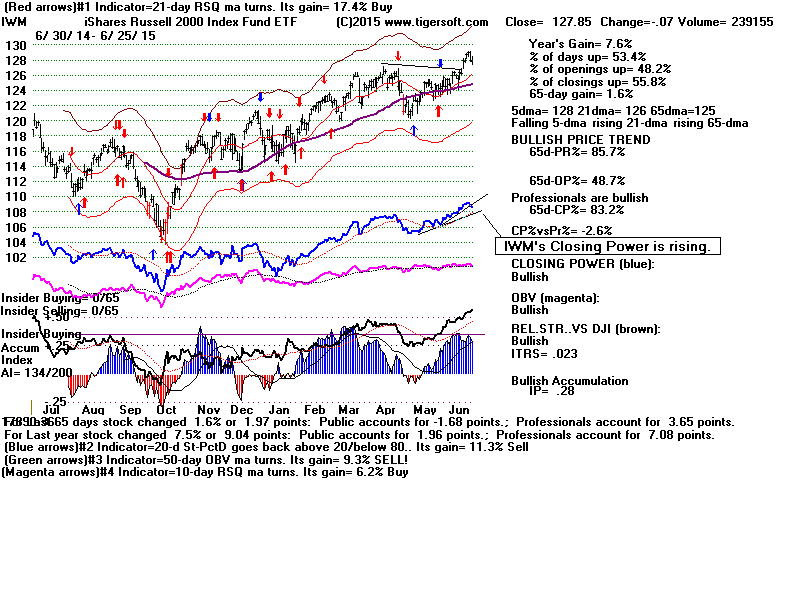
best performing biotechs and ETFs like IWM
and IBB.
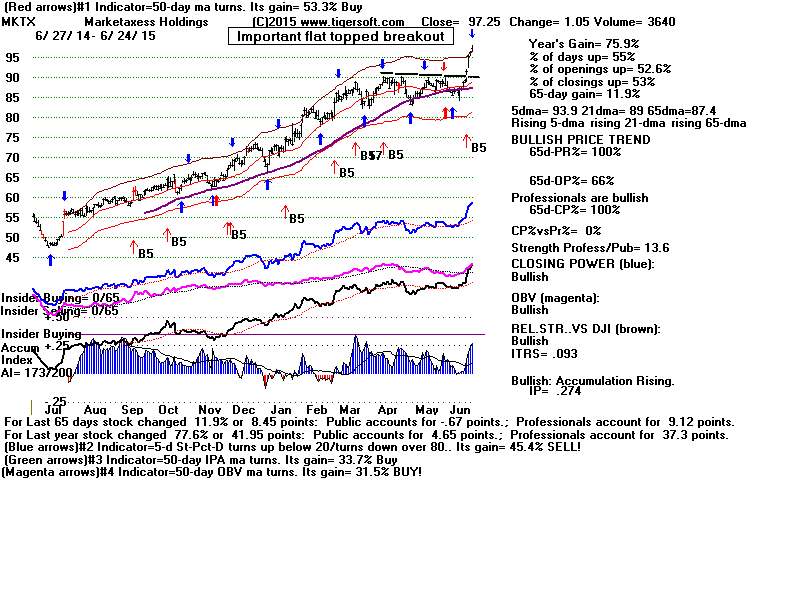
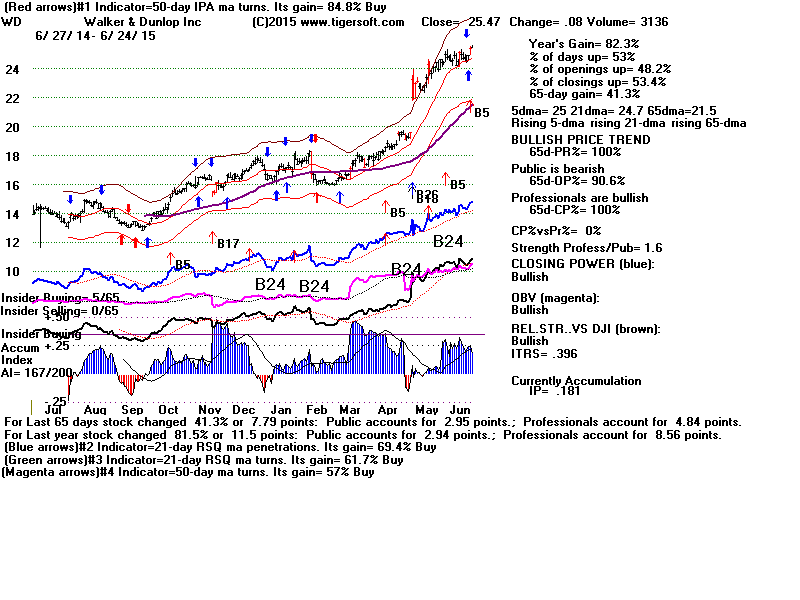
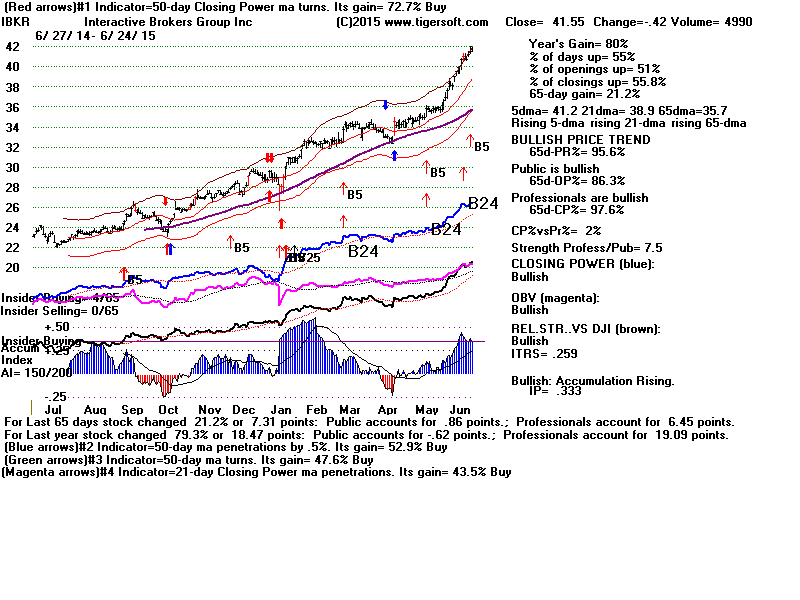
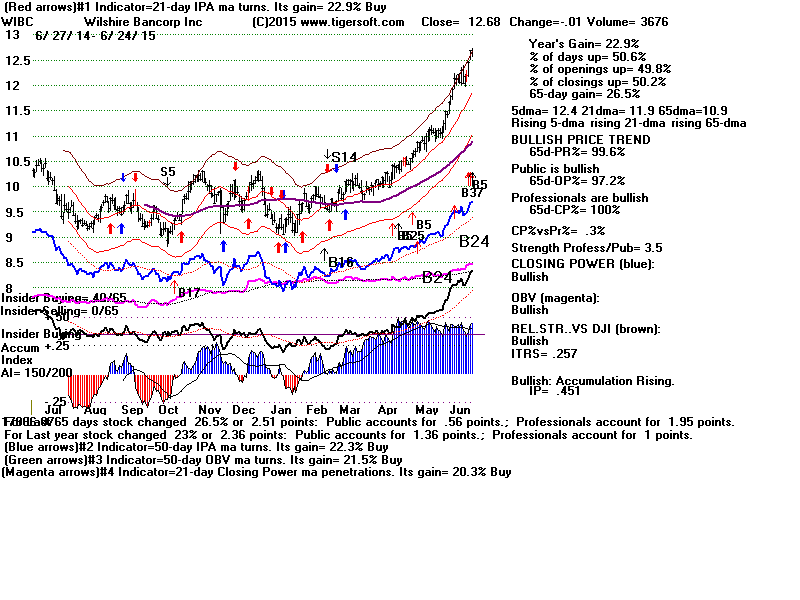
These showed excellent flat
topped breakouts last week. Their Closing Powers
and 5-dma are still rising.
The point of breakout should act as support, too.
See their high current
Accumulation (IP21) and rising Closing Powers.
Unfortunately, the NASDAQ's very weak OBV-Percent warns us
that the NASDAQ may not be able
to make a big advance like it did in
| early 2000.
And, we should be concerned if much of the hot money that boosted
the DJI and SP-500 with
aggressive buying of their futures and long ETFs
using virtually free money from
the FED chooses to take profits. Or much worse,
decides to playing leveraged
short ETFs on the DJI and the SP-500. The DJI's
17700 support-level would
probably then not be able to hold up for more than
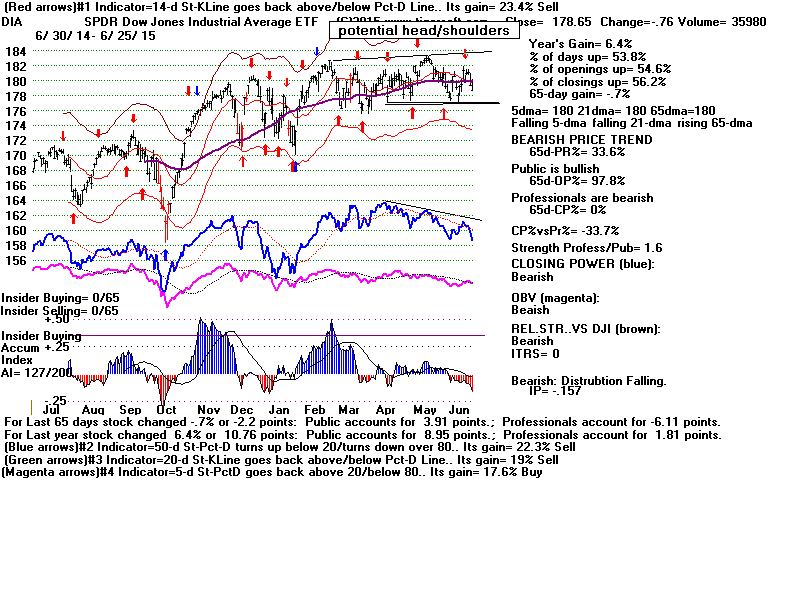
a month more. New head
and shoulders patterns could then be completed,
giving a DJI target 1000 points below the close today.
Today, we saw Professionals reverse to new net short positions on DIA.
See the break in the DIA's
briefly rising blue Closing Power on DIA chart.
It is our invitation now to
short DIA.
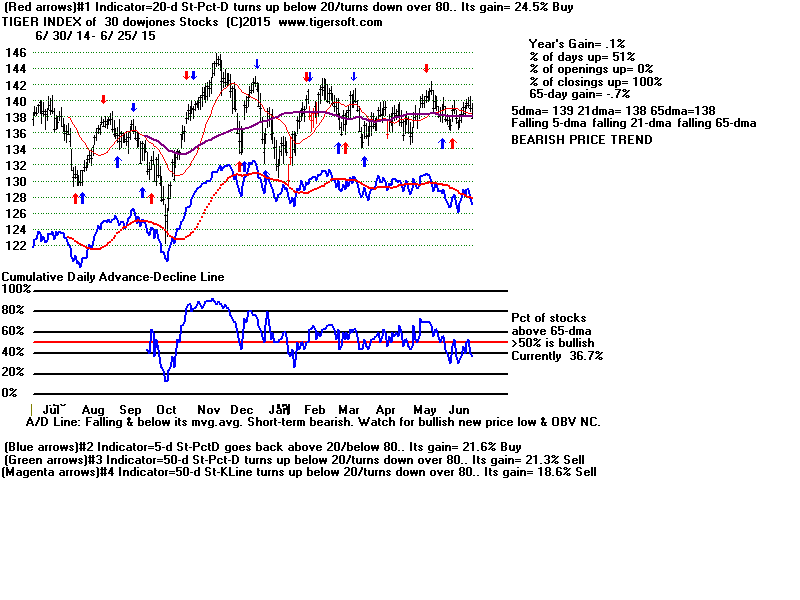
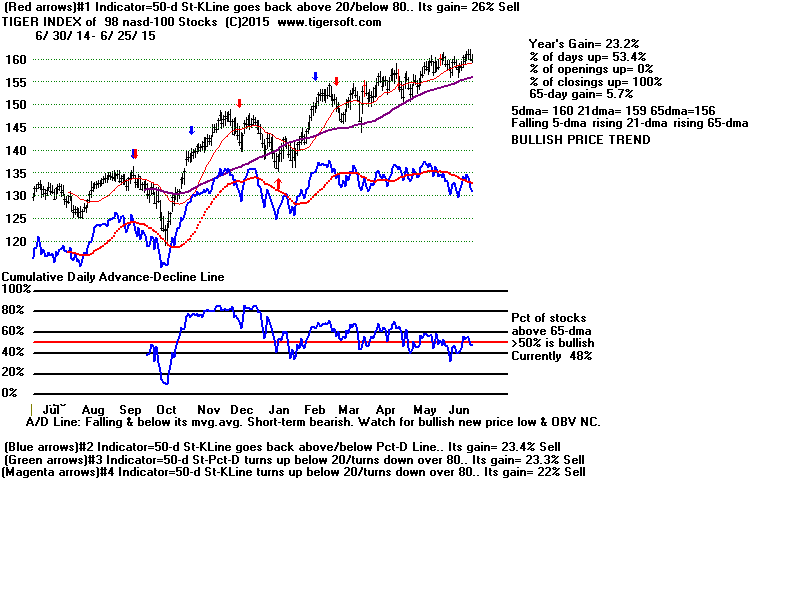
Tiger's New Charting Tool:
The Percentage of all stocks above the support of
the 65-dma.
The oscillator above shows that 50% of all stocks
are still
below the resistance of their 65-dma The
downtrendline of the last
6 weeks has been broken.
6/24/2015
Index/Sector Pct.of Stocks
above 65-dma.
today .... yesterday
--------------------------------------
DJI 40%..........50.0%
-10% Big drop in underlying support.
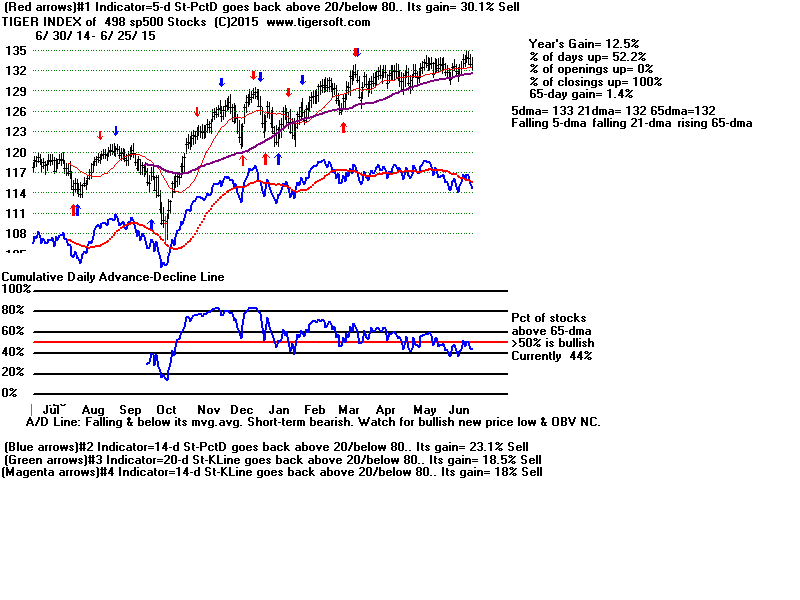
SP-500
44.6%.......51.0%
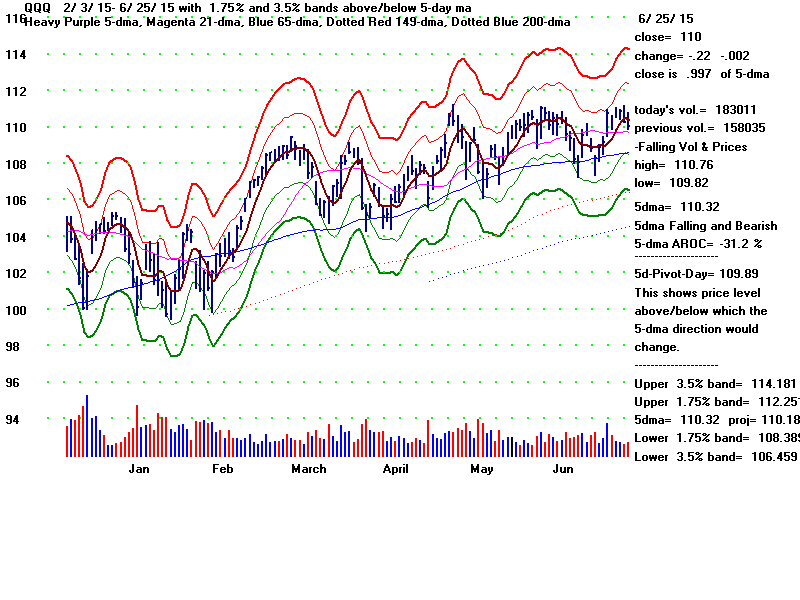
QQQ 49.0%.......55.1%
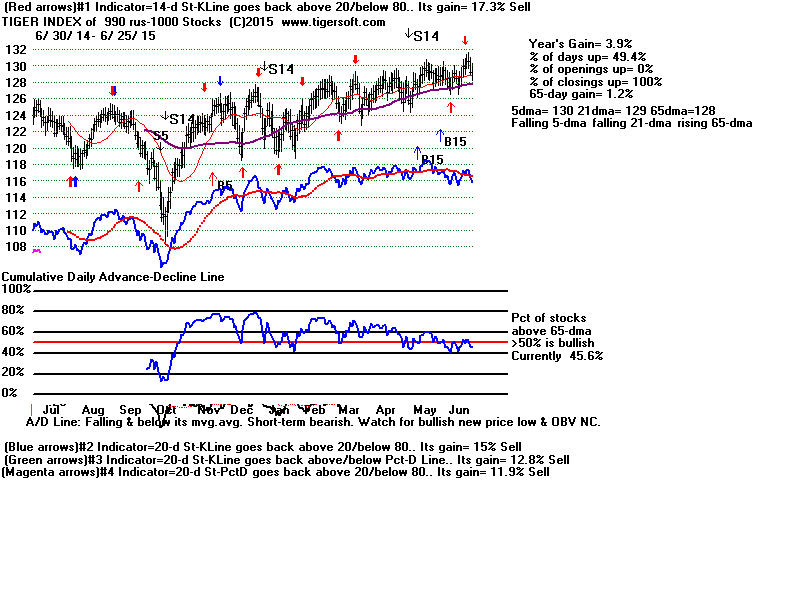
Russell-1000 47.0%.......53.4%
All Stocks
47.1%......50.1%

6/24/2015
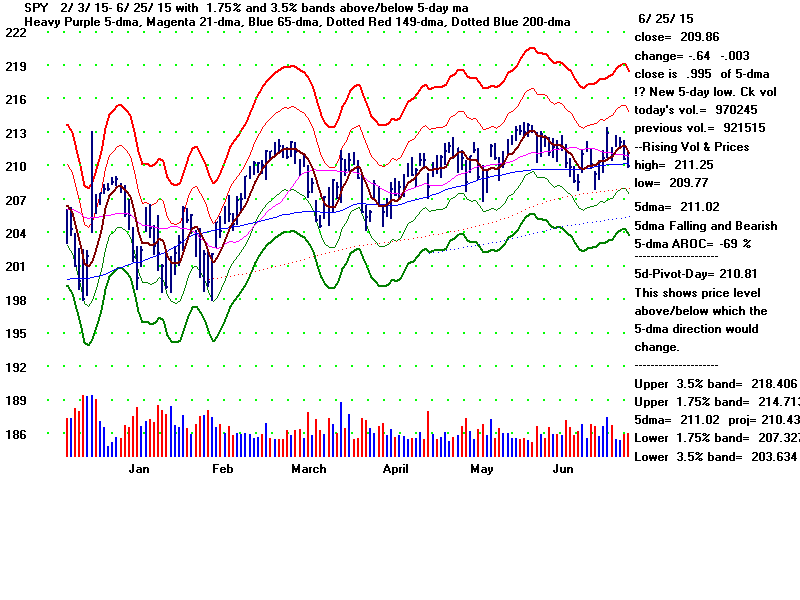
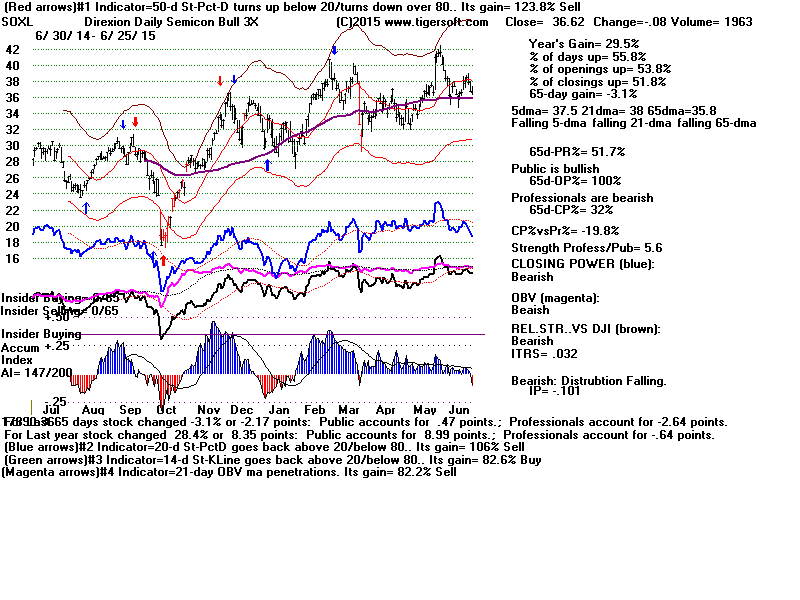
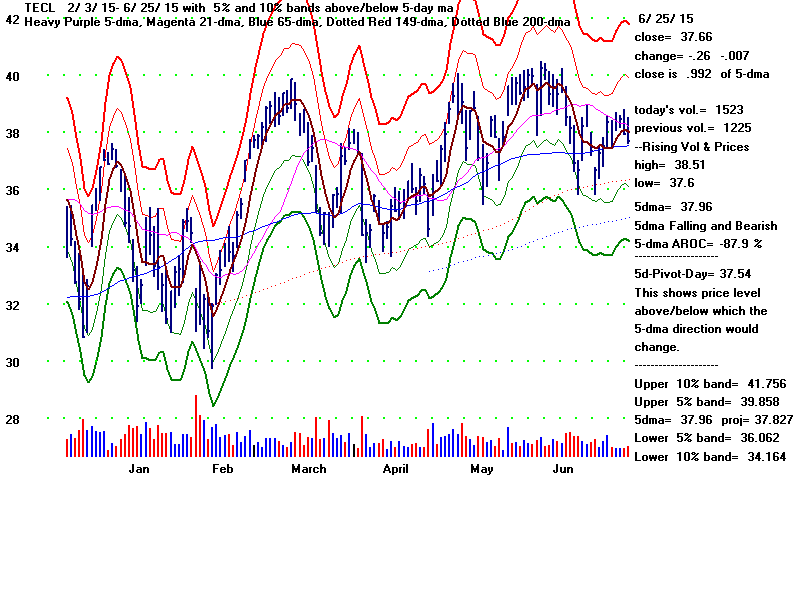
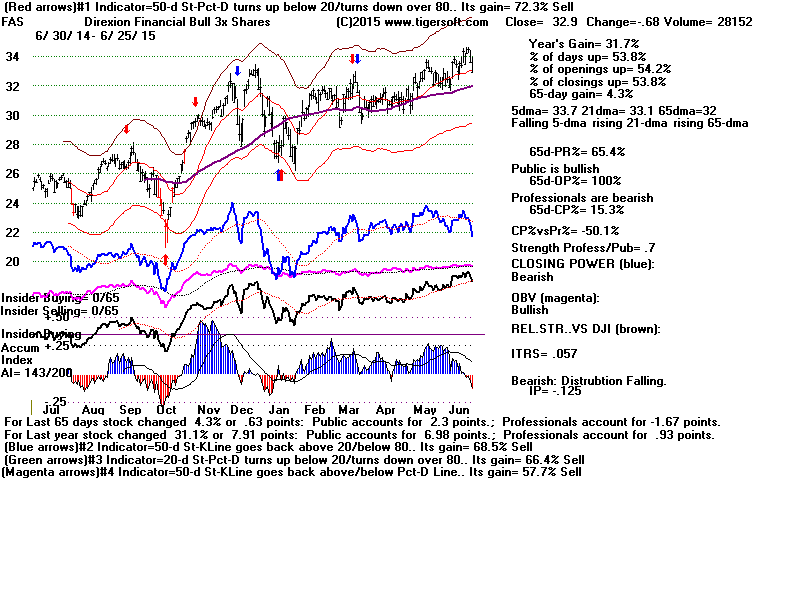
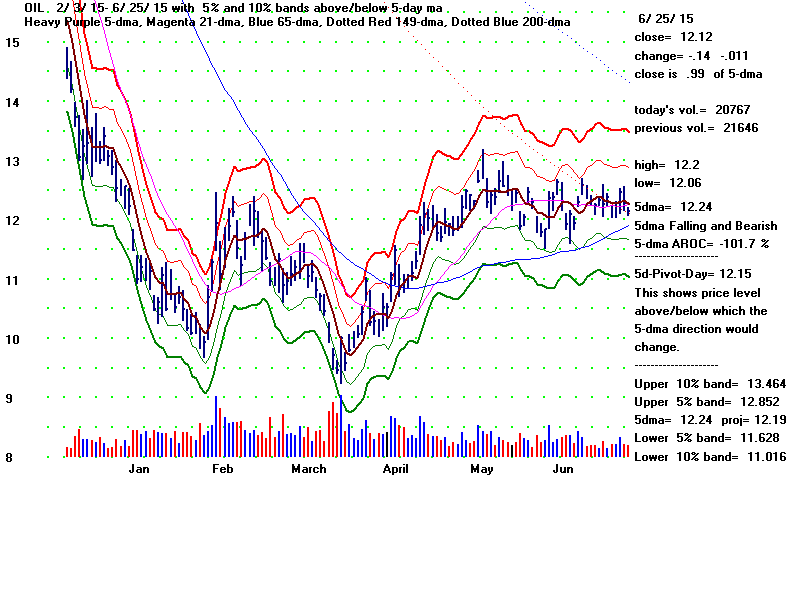
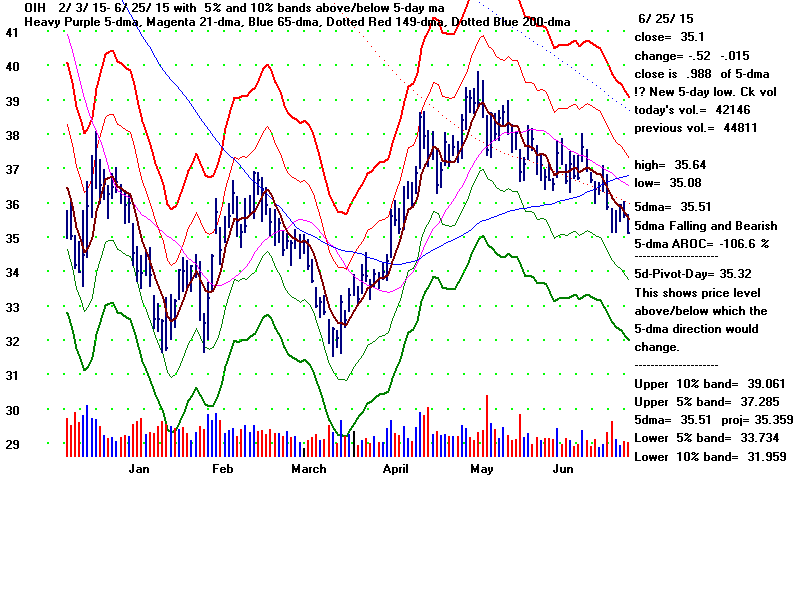
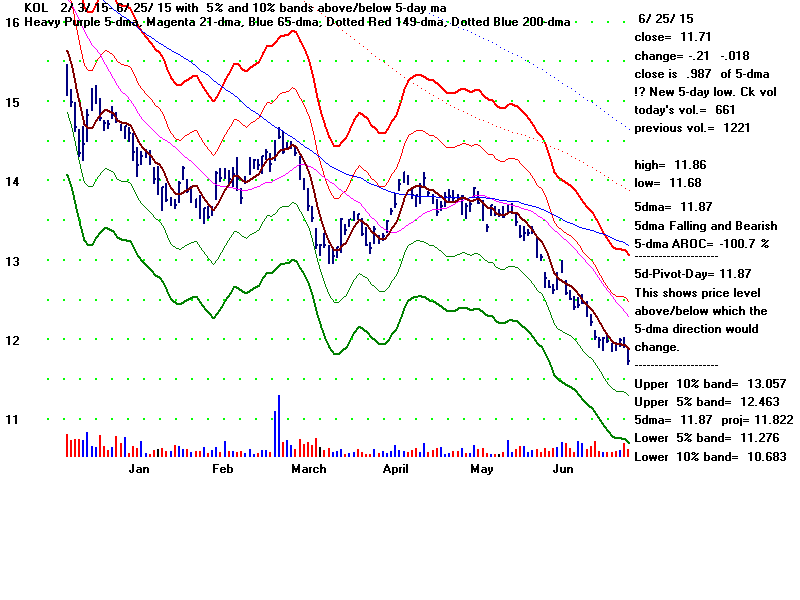
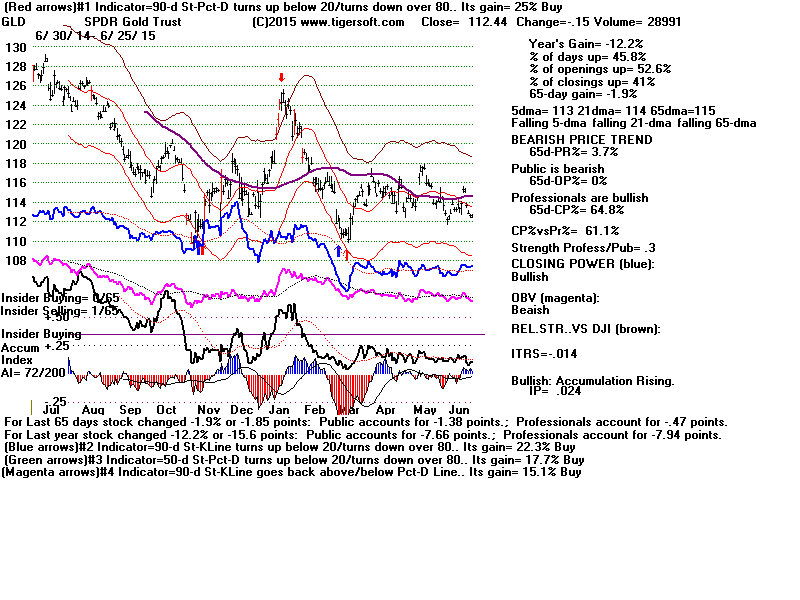
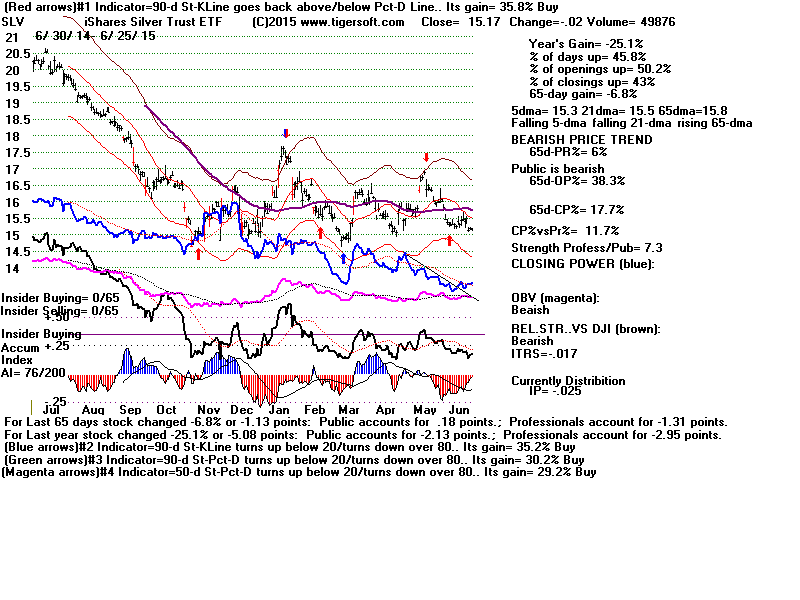
Let's watch closely some of the most important ETFs short-term trends.
We want
to be long ETFs that show rising Closing Powers and have a rising
5-dma, provided their IP21
is above, say, +.23 now. Traders can use the 5-day ma pivot-points to
spot short-term
reversals. The opposite is true of short sales, like OIH and KOL. In
both longs and
shorts, the best short-term positions are taken on retreats to the
trending 5-day ma.
Use the upper bands to take profits if the stock is in a trading
range. These are shown
on the Tiger 6-month charts.
....................Observations.
----------------------------------------------------------------
==> DIA 5-day ma
is now falling and will not turn up unless DJI closes above 181.33. .
SPY
QQQ
==> IWM Closing Power is
rising. High IP21.
SOXL
TECL
==>
IBB Closing
Power is rising. High IP21.
FAS
Other ETFS
OIL
OIH
KOL
GLD
SLV
History of New Extended
Red Sell S12s
1929 June - bad Sell: failure after price
breakout (late Summer rally)
3.4% loss - reversed 6 days later
by Buy B4.
Note DJI was essentially unchanged from what it was
65-days before
and showed an OBVPct of +.156.
This signal was redundant, as there already was a
regular Sell S12.
1929 September 5-
perfect Sell
just before Crash! BIG DECLINE
+43.3% gain
LA/MA = 1.013 PI=-26 IP21= -.109 VI= -454 OBVPct
= .112
DJI was up 19% above its level of 65-days before.
This signal was redundant, as there already were a
variety of Peerless Sells.
1932 November 7 - premature Sell 64.6 --->
68.0 ---> 55.9 BIG DECLINE
+9.0% gain
LA/MA = 1.046 PI=-41 IP21= -.079 VI= -156 OBVPct
= - .069
DJI was up 8.3% above its level of 65-days before.
This signal was not as good as the perfect Sell S2
right at top.
1936 April 2 -
perfect Sell
BIG DECLINE
+6.7% gain
LA/MA = 1.026 PI=-27 IP21= -.089 VI= -231 OBVPct
= + .198
DJI was up 11.3% above its level of 65-days before.
This signal was redundant, as there already were a
variety of Peerless Sells.
1936 October 7 - bad Sell. but A/D Line was
weak until end of 1936 and this
was right after a
perfectly flat-topped breakout.
LA/MA = 1.034 PI=-14 IP21= -.051 VI= -105
OBVPct = + .253
(too high?)
DJI was up 12.2% above its level of 65-days before.
1959 December 31 -
perfect Sell BIG
DECLINE
1963 December 4 - bad Sell.
Early
December is not usually a good time to sell short.
LA/MA = 1.015 PI=-58 IP21= -.066 VI= -577 OBVPct
= + .028
DJI was up 4.0% above its level of 65-days before.
1964 June 19 -bad Sell. - 823 ---> 851 --->
833 and then up strongly.
The loss here would have been small using
Peerless.
It would have been 2.5% based on Peerless Buy B10 on
6/17/2015
LA/MA = 1.011 PI=-11 IP21= -.108 VI= -317 OBVPct
= - .006
DJI was
only up 0.8% above its level of 65-days before.
1965 April 12 - premature Sell - 906 --->
939.6 ---> 840
1967 April 18 - premature Sell - 873 ---> 909
---> 847
1972 August 2 - premature Sell - 944 --->
970.35 ---> 921.66
1998 June 29 - premature Sell - 8997.36 --->
9337.97 ---> 7539.07 BIG DECLINE
2000 August 7 - premature Sell - 10867 --->
11311 ---> 7539 BIG DECLINE
2012 December 5 - premature Sell - 13034 --->
13351 ---> 12938
2015 May 19 -
LA/MA = 1.013 PI= 13 IP21= -.008 VI= -48
OBVPct = .115
DJI was up 1.5% above its level from 65-days
before.
|
6/24/2015 The charts I usually place here cannot be shown
using this new server.
It loads them way too slowly. What I would like soon to try is
posting them on
www.tigersoftware1.com and
providing links from here to them.
I also want to encourage you to run our software. I can load
the latest version of Tiger and Peerless in a fast Dell XP laptop
and send it to you for only $160. You can then get the data
from me for $175/year or use TC-2000 for $30/month. Unfortunately,
they do not provide the necessary data to run Peerless. That
data would have to be put in by hand.
New Highs: NASD 35 NYSE
17 Sum = 42
New Lows: NASD 17 NYSE
30 Sum = 50+8
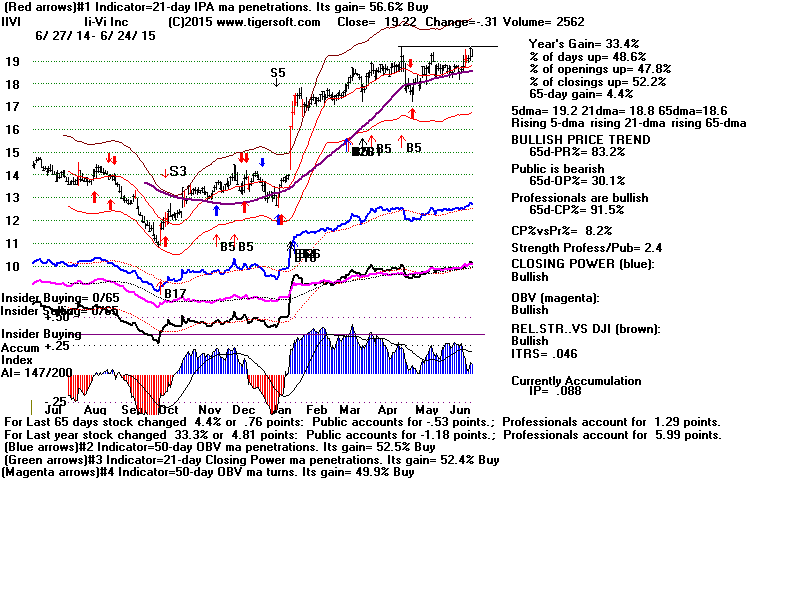
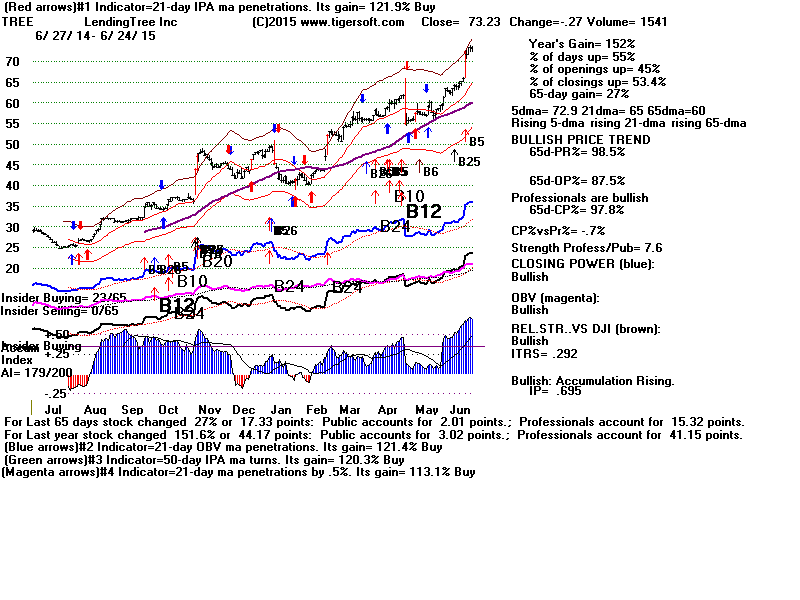
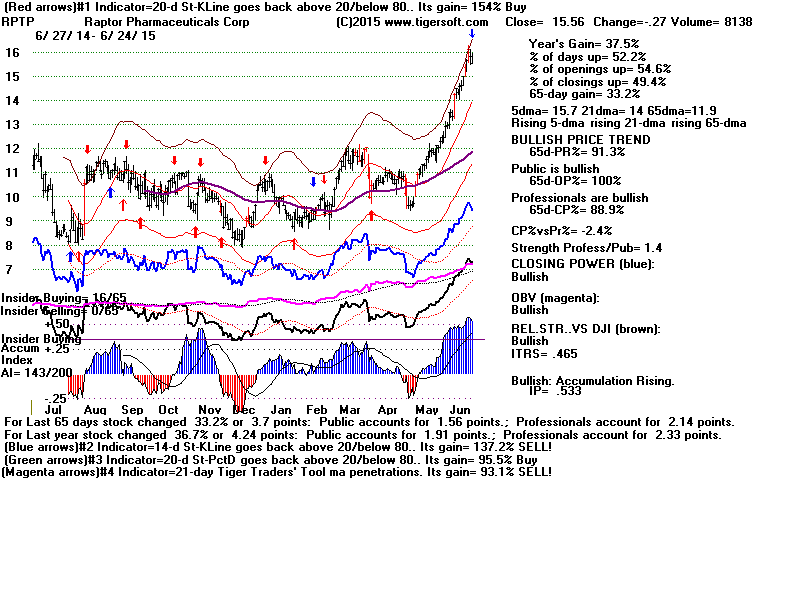
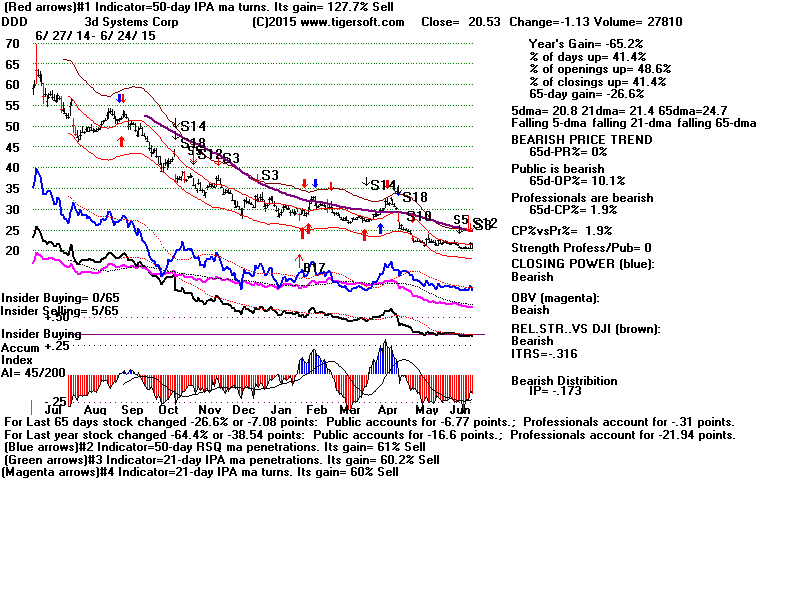
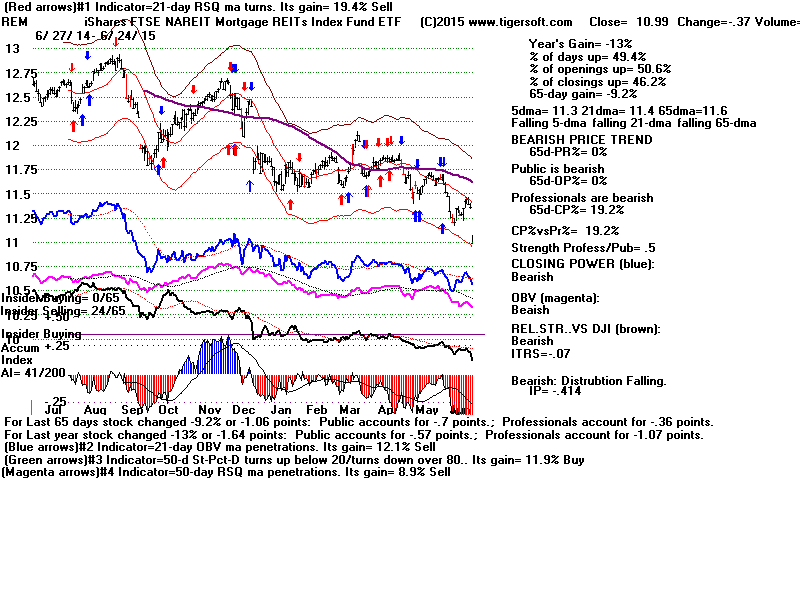
65 -90 Bullish MAXCP Stocks:
MKTX
WD IBKR WIBC
IIVI TREE
RPTR
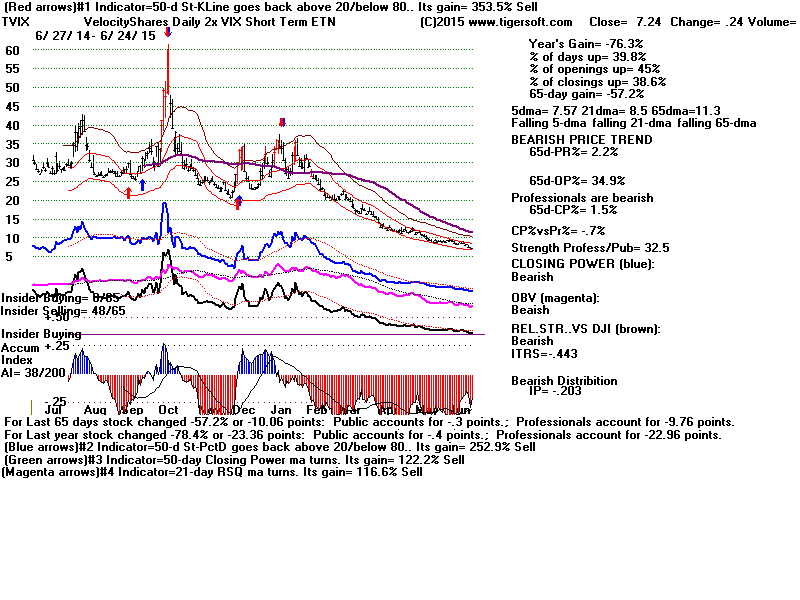
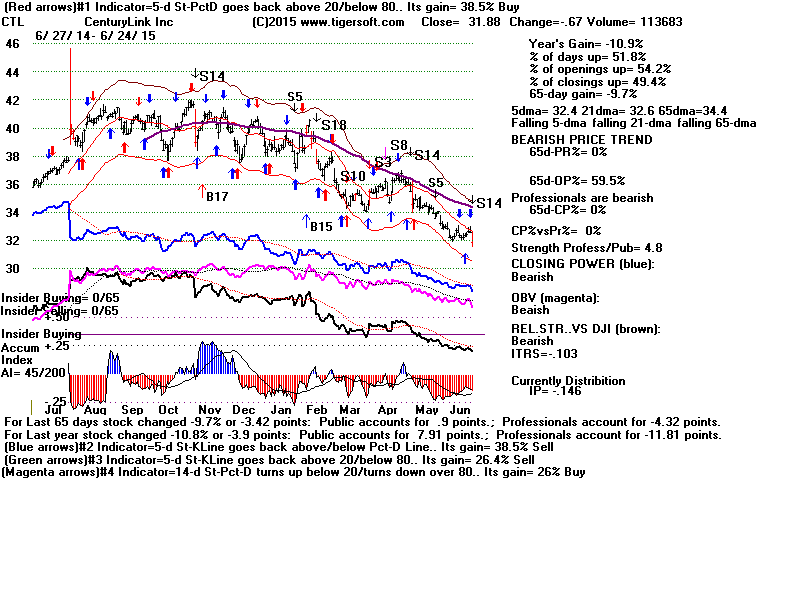
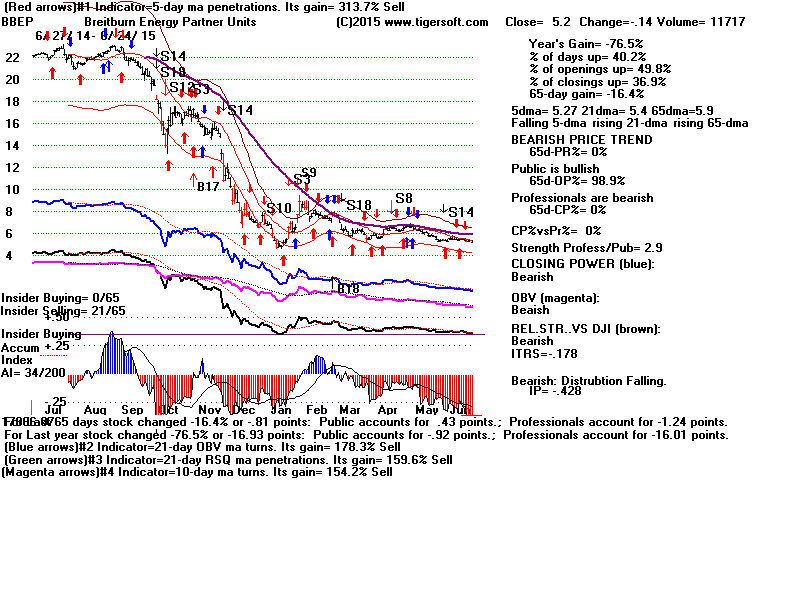
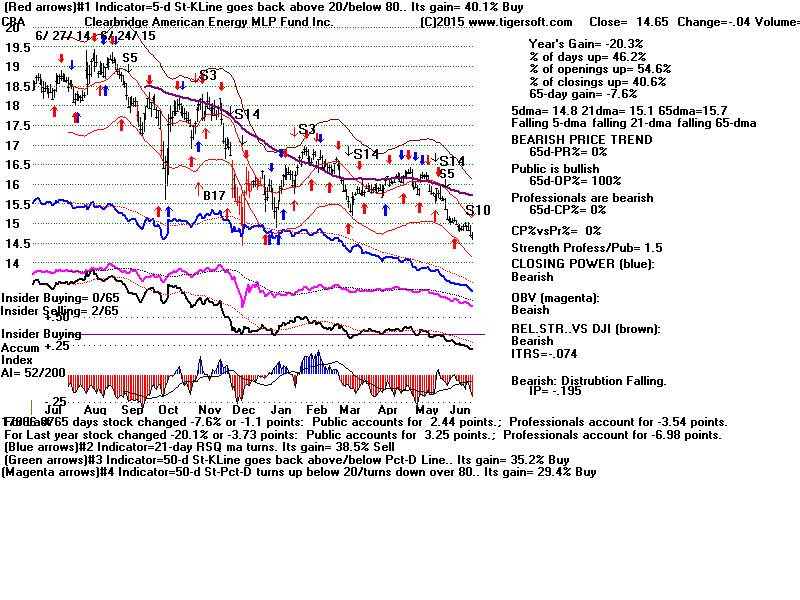
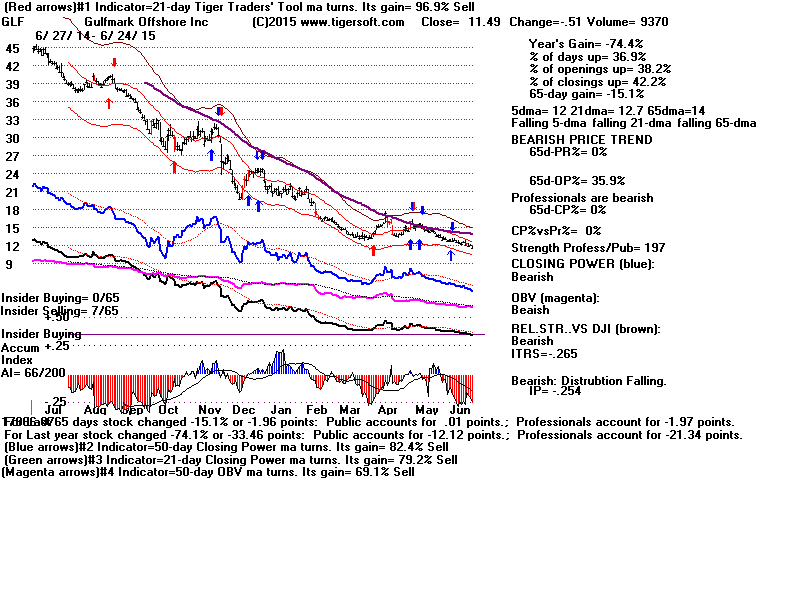
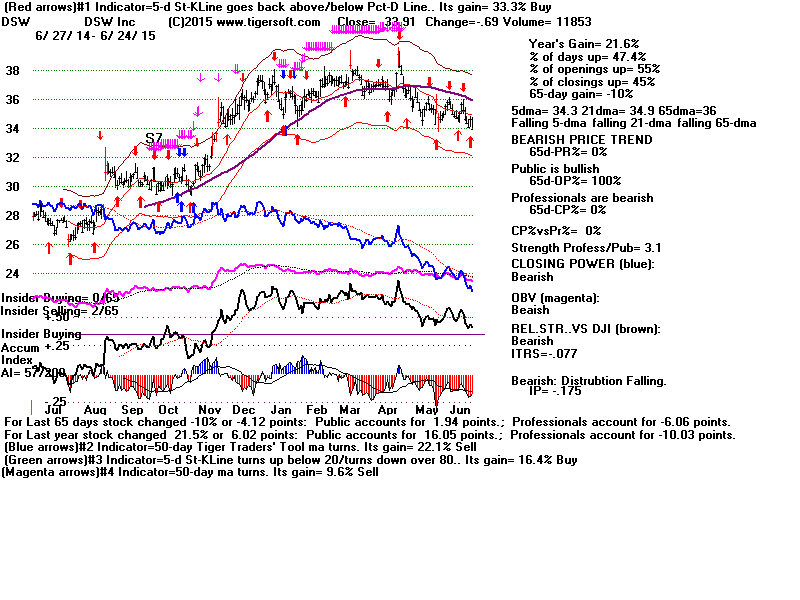
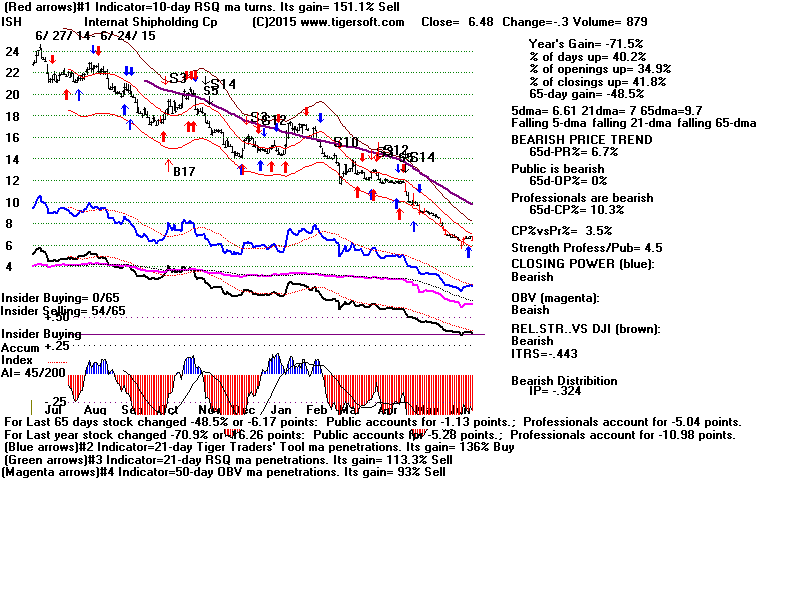
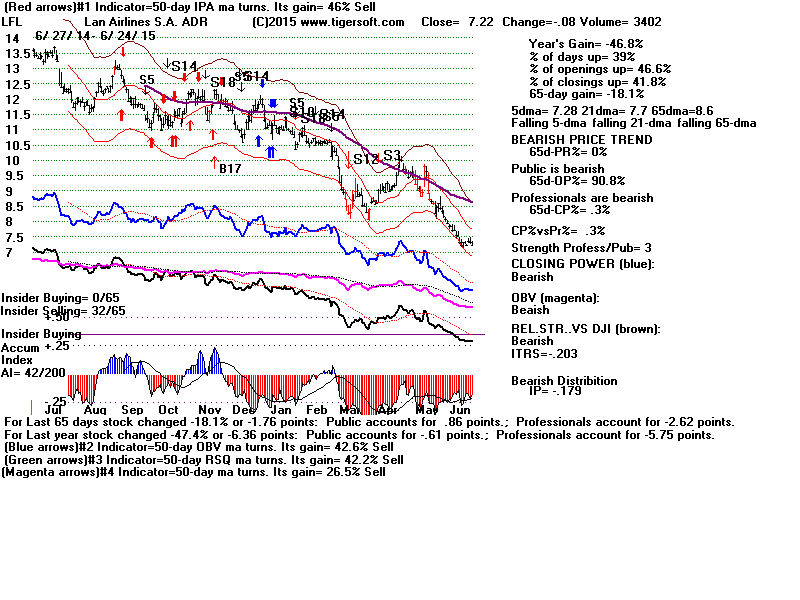
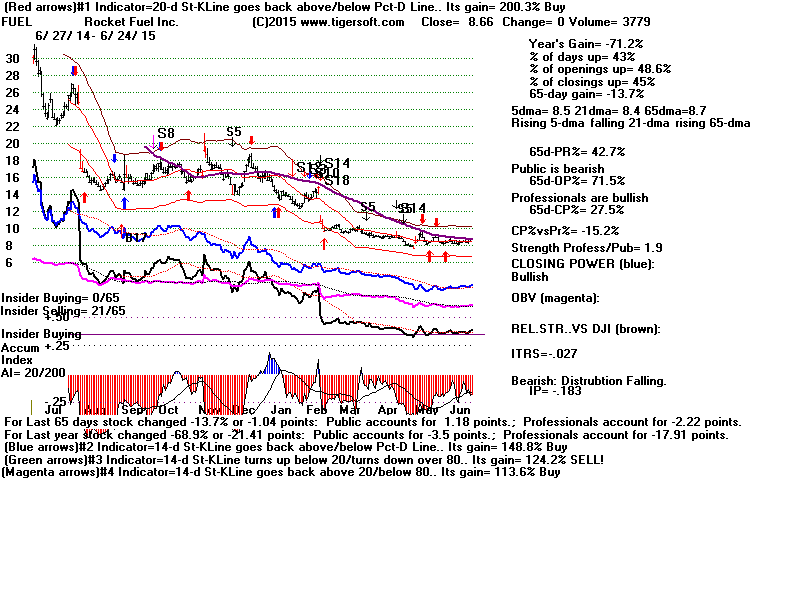
90 +25 Bearish MAXCP Stocks:
TVIK CTL
BBEP CBA
GLF DSW
ISH
LFL FUEL
DDD REM |
------------------------
Announcements
--------------------------------
E-Books
1
The On-Line Explosive Stocks
2
The On-Line Killer Short
Sales book
Purchase each all new book by CC for
$42.50 or send a check for $37.50 to me.
I call your
attention now to the many new concepts and
the considerable new research in them:
For example:
1) A very good New Tiger Buy B12 for Low
Priced Stocks
2) After Red high volume reversal days use CP
uptrend-breaks.
3) Buy the stocks the Federal Govt wants you
to buy.
4) 100-Day Power Rankings...
5) Using Closing Power Hooks after Buy B26s
and B20s.
6) How A Stock Reacts to Its Earnings Report
Is Very important.
7) TigerSoft Major Buy Signals' Combinations
Which are most Powerful? Reliable?
8) Augmented Buy B20s' Independent Success
Rate.
9) What factors warn a rising 65-dma will not
hold?
10) The classic cluster of technical
characteristics that commonly appear
in the 23 stocks falling 70% or more in
the deep pullback of 2011.
----------------------------------------------------------------------------------------------------------------------------------------------------------------------------
PEERLESS STOCK MARKET TIMING:
A Guide To
Profitably Using The Tiger Nightly HOTLINE
Peerless Signals: 1915-2014
New Peerless Signals and DJI Charts - version 7/4/2013
1965
1965-6 1966
1966-7 1967
1967-8 1968
1968-9 1969
1969-70
1970
1970-1
1971
1971-2 1972
1972-3
1973 1973-4
1974
1974-5 1975
1975-6
1976 1976-7
1977
1977-1978
1978
1978-79
1979 1979-80
1980 1980-1
1981 1981-2
1982 1982-1983
1983 1983-1984
1984
1984-1985
1985
1985-1986
1986 1986-1987
1987 1987-8
1988
1988-9 1989
1989-90
1990
1990-1 1991
1991-2 1992
1992-3 1993
1993-4 1994
1994-5 1995
1995-1996
1996
1996-7 1997
1997-8 1998
1998-1999 1999
1999-2000 2000
2000-1
2001 2001-2
2002
2002-3 2003
2003-4 2004
2004-5
2005 2005-6
2006 2006-7
2007 2007-8
2008 2008-9
2009
2009-10
2010 2010-11
2011 2011-12
2012
2012-2013
2013 2013-4 2014
Introduction to Tiger/Peerless Buys and Sells.
Different Types
of TigerSoft/Peerless CHARTS, Signals and Indicators
How reliable support is the DJI's rising 200-day ma?
-------------------------------------------------------------------------------------------------------------------
TIGERSOFT SIGNALS AND INDICATORS:
Documentation for TigerSoft
Automatic and Optimized Signals.
SPY Charts since 1994: Advisory Closing Power S7s, Accum. Index, 65-dma,
Optimized Signals.
"The
Jig Is Up": Calling September and October Tops.
A Keynesian's Warning Signs.
NUGT since 2012: A study of Tiger Technicals
Tiger Day
Traders Tool and most active Triple Leveraged ETFs
Advisory Pink Closing Power S7s at ETF at top since 1994
1994
1996
1997
1998
1999
2000 QQQ
SPY
DIA
2002
2007
2008
SPY 2011
2013-2014
Tiger Buy and Sell
Signals: New 2014 Research:
These are randomly chosen
groups.
but clearly we need to back-test them in more years.
You can replicate or do similar studies yourself
for other signals and/or other years.
9/1/2014 -
2014 Tiger
B19s - Steady rallying and no pullbacks below the 21-day ma.
9/2/2014 -
2014 Tiger
B17s on 14As taken alphabetically
9/3/2014 -
2014 Tiger B17s on 60
Biotechs taken alphabetically
9/4/2014 -
2014 Tiger
B18s on all "R" stocks taken alphabetically
* 9/8/2014 -
2014 Tiger
B20s - Conclusion: Use Closing Power trendbreaks in aftermath.
9/8/2014 -
2014 Tiger
B16s - Conclusion: Use mostly when
LA/MA under 1.05.
9/11/2014 -
2014 Tiger
B15s - Conclusion: Certain conditions
improved the results dramatically.
9/12/2014 -
2014 Tiger
B25s - Conclusion: 87.5% success rate
when other internals are positive.
9/15/2014 -
2014 Tiger B25s -
Best conditions for using B25s with somewhat
higher RSX capitalization stocks.
9/16/2014 -
New Tiger
Closing Power Take-Off Buy Signal in 2014: 14s, QQQ, DJI-30 and ETFs
9/17/2014 -
New Tiger
Closing Power Take-Off Buy Signal: 2009A-s
9/18/2014 -
New Tiger
Closing Power Take-Off Buy Signal: 2010A-s
9/21/2014 -
New Tiger
Augmented Sell S8s: DJI-30 - 2014
Requiring S8s to show
Negative CP%-Pr and IP21<+.15 produced a 70% success rate
in a rising market for
DJI-30 stocks and big ETFs.
9/24/2014 -
Tiger Sell
S14s: They make price breakdowns very bearish.
1/15/2015
-
Tiger Day
Traders' Tool Explained.
http://www.tigersoft.com/day-traders/index.html
http://www.tigersoft.com/Indicators/index.htm
http://www.tigersoftware.com/TigerBlogs/Aug-31-2009/index.html
NEW
2/16/2015
1) New -
Tiger Charts showing UP%, Opening-Up%, Closing-Up%
Note differences between bullish
and bearish stocks...
2) New -
UP%,
Opening-Up%, Closing-Up% Rankings of any directory.
3) New -
Display of what happens to a stock after various size openings up or down.
4) New -
6-month charts to better
show volume changes and 5-day ma with bands.
More profitable trading schemes coming...
Targeted Trading Opportunities:The Profits Quickly Add Up,
3/29/2015
Tiger CandleSticks:
IBB: 2001-2015
and
Recent Others.
====================================================================================
Earlier Hotlines
2-7-2014 to 3/19/2014
11-22-2014 to 2-6-2014
http://tigersoftware.com/555HL555/index.htm
10/9/2014 - 11/21/2014
http://tigersoftware.com/9933Hot/
9/2/2014 - 10/8/2014-
http://tigersoftware.com/2233HL/index.html
6/25/2013-9/1/2014
http://tigersoftware.com/112211-H/index.htm
11/22/2013-3/20/2014
http://tigersoft.com/1111-HL/index.html
10/22/2013-11/21/2013
Past
Hotline Predictions
http://tigersoft.com/-HL42013/index.html
http://www.tigersoft.com/-2GBL13HL/index.htm
==============================================================================================================================