


TigerSoft and Peerless Daily
Hotline
www.tigersoft.com/-HL2013M28M/index.htm
IMPORTANT: The Server has become very, very slow. We will use
http://www.tigersoftware.com/SUPPLEMENTA/7-16-2013/index.htm
starting
7/16/2013 evening
This
address will change soon. But no notice has been sent out
yet giving new addresses, includingh Data Page and Elite Page.
-----------------------------------------------------------------------------------------------------------------------
(C) 1985-2013 William Schmidt, Ph.D. www.tigersoft.com
All rights strictly reserved.
Tiger Software 858-273-5900
PO Box 22784 San Diego, CA 92192
Email william_schmidt@hotmail.com
-----------------------------------------------------------------------------------------------------------------------
 Shhh.
Sharing this hotline address with non-subscribers is a violation of our contract
Shhh.
Sharing this hotline address with non-subscribers is a violation of our contract
with you and a violation of copyright laws. I work hard for you. Respect that
effort!
---> To
renew this Hotline,
order here $350 (check) - $360(Visa/MC)
www.tigersoft.com/-2GBL13HL/index.htm
-----------------------------------------------------------------------------------------------------
 http://tigersoft.com/-HL42013/index.html
http://www.tigersoft.com/-2GBL13HL/index.htm
http://tigersoft.com/-HL42013/index.html
http://www.tigersoft.com/-2GBL13HL/index.htm
 A Guide To Profitably Using The
Tiger Nightly HOTLINE
A Guide To Profitably Using The
Tiger Nightly HOTLINE
 Peerless Signals: 1915-2013

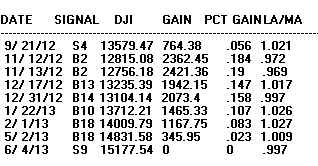
New Peerless
Signals and DJI Charts - version 7/4/2013
1965 1965-6 1966 1966-7 1967 1967-8 1968 1968-9 1969 1969-70
1970 1970-1 1971
1971-2 1972 1972-3 1973 1973-4 1974 1974-5 1975 1975-6 1976 1976-7 1977 1977-1978
1978 1978-79 1979 1979-80 1980 1980-1 1981 1981-2 1982 1982-1983 1983 1983-1984
1984 1984-1985 1985 1985-1986
1986 1986-1987 1987 1987-8 1988 1988-9
1989 1989-90
1990 1990-1 1991 1991-2 1992 1992-3 1993 1993-4 1994 1994-5 1995 1995-1996 1996
1996-7 1997 1997-8 1998 1998-1999 1999 1999-2000 2000 2000-1 2001 2001-2 2002
2002-3 2003 2003-4 2004 2004-5 2005 2005-6 2006 2006-7 2007 2007-8 2008 2008-9
2009 2009-10 2010 2010-11 2011 2011-12 2012 2012-2013
Background
New Introduction to
Tiger/Peerless Buys and Sells.
Peerless Charts and Signals
Documentation for TigerSoft
Automatic and Optimized Signals.
======================================================================================
IMPORTANT: The Server has become very, very slow. We will use
www.tigersoftware/SUPPLEMENTA
starting 7/16/2013 evening
7/15/2013 If NYSE declines outpace advancers at the close tomorrow
by 100 or more, I think we should trust Peerless and short DIA or SPY.
There are still lots of high Accumulation breakouts. That makes me think
we should delay taking profits in in the very strong and high Accum. ETFs
like URTY.
See http://tigersoftware.com/SUPPLEMENTA/7-15-2013/Special/up715/index.html
Current
Peerless Key Values
Date
DJIA
La/MA
AnnRoc P-I
P-I ch P^ ^ IP21 V-I Opct 65PctChange
7/15/2013
15484 +20 1.027 .243
+282
-69 +282 -.039
-21 +.246 .041
7/15//2013 ---> To Key Index and Leading Stock Charts
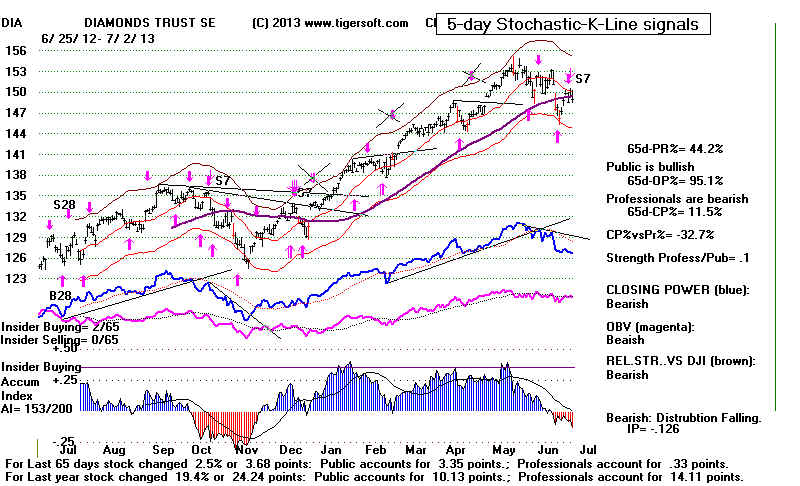
5-day
Pct-K Stochastic SPY Chart
----> 257 MAXCP stocks Bullish MAXCP Stocks (7/15/2013) Bullish plurality
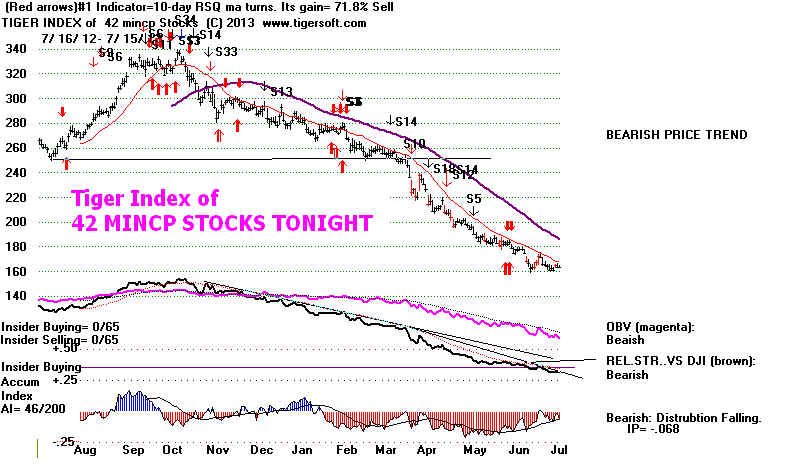
---> 42 MINCP stocks Bearish MINCP
Stocks (7/12/2013)
---> 208 New Highs on NASDAQ 9
new lows. Bullish
plurality
---> 174 New Highs on NYSE 11 new
lows. Bullish plurality
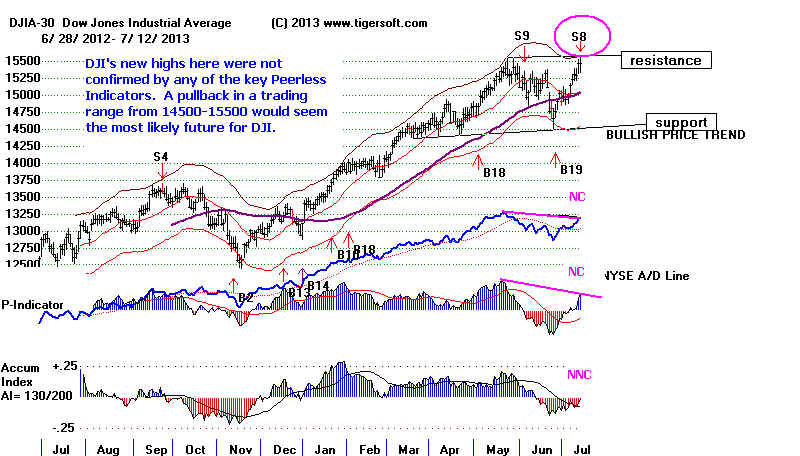
Friday's Peerless Sell S8 was not "clinched" today, as
there were
.
739 more up than down on the New York Stock Exchange. The Russell-2000,
Value Line, SAA (Leveraged Ultra
Small Caps' ETF), URTY
(Leveraged Russell-2000 ETF) and TNA (3x Leveraged Small Cap) all made
good gains. Their Closing Powers are still rising. Speculative momentum
and the demands for high performance from funds keep boosting the
best performing stocks. Wall Street believes that Bernanke and the
Fed will not dare to push up rates higher for fear of causing the weak
economy recovery to falter.
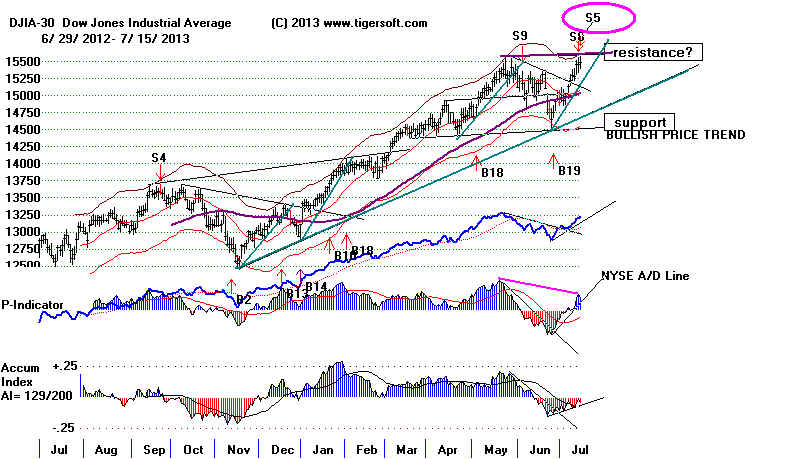
But Peerless has given a new signal. A Sell S5. It is based the
DJI being
above the 2.65% upper band with a very big non-confirmation from the
P-Indicator (the 21-day ma of NYSE advances - declines). The current
P-Indicator must be less than 50% of its 2 month high. The Sell S5 only
can occur from April to July.
New Sell S5
Its Sell signals have always been profitable. Paper losses were never over
2.5% in the new Peerless. The average DJI decline by the time of the next
Peerless Buy signal was 7.6%. The risk:reward ratio favors the short side
here.
But there is one important caveat. The adjusted P-Indicator
now is higher than in any
of the earlier Sell S5 cases. As with every new Peerless signal, I think it
is important
to place lower credibity on it if any of its key values (especially the P-Indicator
when adjusted) lie outside the range of their range in earlier signals.
Conclusion
With all the strength we are still seeing in the broader market, as
opposed
to the DJI-30 or even the SP-500, I think we have to wait, at least, for
NYSE declines to outnumber advances by more than 100 at the close.
This "clinching" rule worked very well in June 1987, as I mentioned last
night. Meanwhile, our long positions keep rising and the bearish MINCPs
are having a difficult time finding support. If NYSE
declines outpace advancers
at the close tomorrow, I think we should trust Peerless and short DIA or SPY,
but for now hold long the very strong ETFs, like URTY.
Past Sell S5s since 1929
Date
DJIA LA/MA
AnnRoc P-I
P-I ch P^ ^ IP21 V-I
Opct 65PctChange
7/15/2013
15484 1.027
.243
282 -69
282 -.039
-21 .256 .041
-----------------------------------------------------------------------------------------------------------------------------------------
1 6/19/1934 12.4% drop to next Peerless Buy signal.
99.00 1.033 .473
9
-7 52
-.001 -6 .151
-.037
-----------------------------------------------------------------------------------------------------------------------------------------
2 4/3/1936 6.5% drop to next Peerless Buy signal.
160.1 1.024
.198 -37
-10 -160 -.126 .112 ?
?
-----------------------------------------------------------------------------------------------------------------------------------------
3 6/5/1939 3.1% drop to next Peerless Buy signal.
137.1 1.027 .465
42
-7 195
.037 24 .318
-.067
-----------------------------------------------------------------------------------------------------------------------------------------
4 5/29/1946 23.2% drop to next Peerless Buy signal.
212.5 1.029
.329 64
-4 251
.260 43 .275 .142
-----------------------------------------------------------------------------------------------------------------------------------------
5 4/4/1956 8.3% drop to next Peerless Buy signal.
518.7 1.024
.636
39
-20 125 .14
4 -79
.468 .062
-----------------------------------------------------------------------------------------------------------------------------------------
6 4/12/1972 3.3% drop to next Peerless Buy signal.
966.96
1.023 .483
-2
43 -4
.087 0
.234 .064
-----------------------------------------------------------------------------------------------------------------------------------------
7 6/21/1976 4.7% drop to next Peerless Buy signal.
1007.45 1.031 .124
28
-3
52 .058 0
.024 .028
-----------------------------------------------------------------------------------------------------------------------------------------
8 6/6/1978 5.0% drop to next Peerless Buy signal.
866.51 1.028
.53
88
-2 183 .027 3
.264 .159
-----------------------------------------------------------------------------------------------------------------------------------------
9 5/1/1984 8.1% drop to next Peerless Buy signal.
1182.89
1.025 .186
-37
32 -65
-.004 -2 .114
-.039
-----------------------------------------------------------------------------------------------------------------------------------------
10 6/2/1986 2.2% drop to next Peerless Buy signal.
DJI rose from 1862 to 1909. Paper loss = 2.5%
(approx.)
1862 1.031
.556
51
-8
99 .135 5
.006 .086
-----------------------------------------------------------------------------------------------------------------------------------------
11 4/8/1988 2.8% drop to next Peerless Buy signal.
DJI rose from 2090 to 2110. Paper loss = 1% (approx.)
2090 1.027
.093 -39 21
-66 .043
-4 .242
.025
-----------------------------------------------------------------------------------------------------------------------------------------
12 7/19/1990 18.1% drop to next Peerless Buy signal.
DJI rose from 2090 to 2110. Paper loss = 1% (approx.)
2994 1.027
.41 0
-16
-0
.065 -5 .416
.082
-----------------------------------------------------------------------------------------------------------------------------------------
13 4/21/1992 1.6%
drop to next Peerless Buy signal.
DJI rose from 3354 to 3413 Paper loss = 2% (approx.)
3343 1.023
.244
-125
-15 -241
.064 -19
.235 .023
-----------------------------------------------------------------------------------------------------------------------------------------
14 7/6/1999 9.1% drop to next Peerless Buy signal.
DJI rose from 11194 to to 11326 Paper
loss = 1.2% (approx.)
11135 1.034
.371
58
-43
57 .043 -6 .18 .132
-----------------------------------------------------------------------------------------------------------------------------------------
15 5/3/2001 5.1% drop to next Peerless Buy signal.
12808 1.027
.412
113
-99
113 .154 -47
.335 .083
-----------------------------------------------------------------------------------------------------------------------------------------
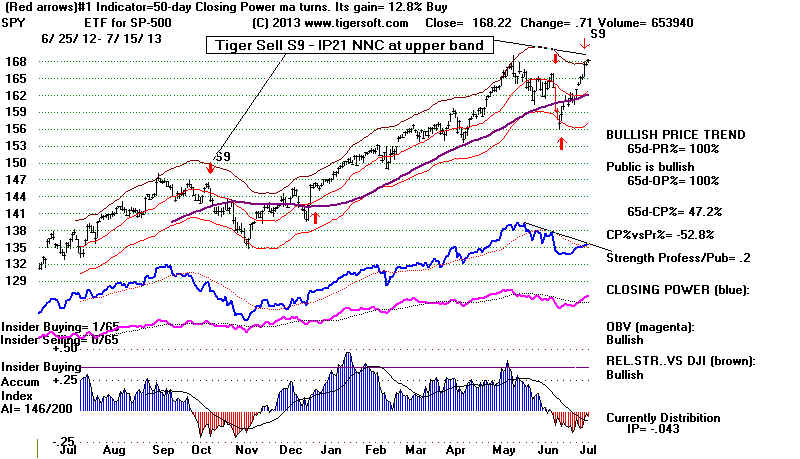
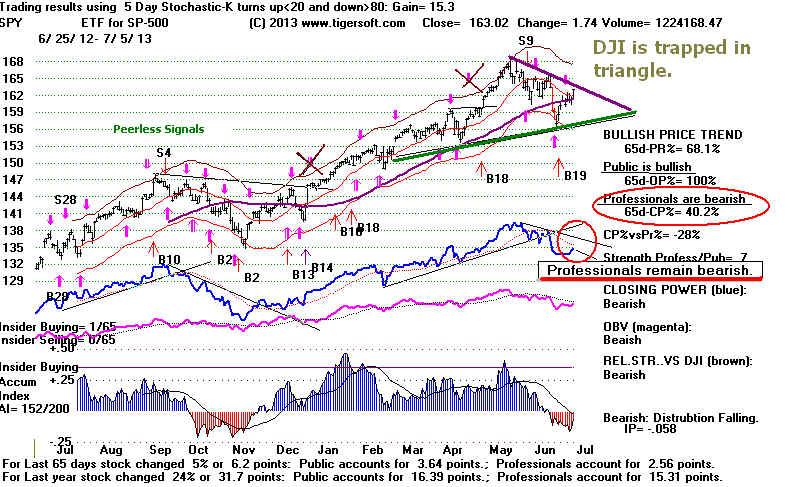
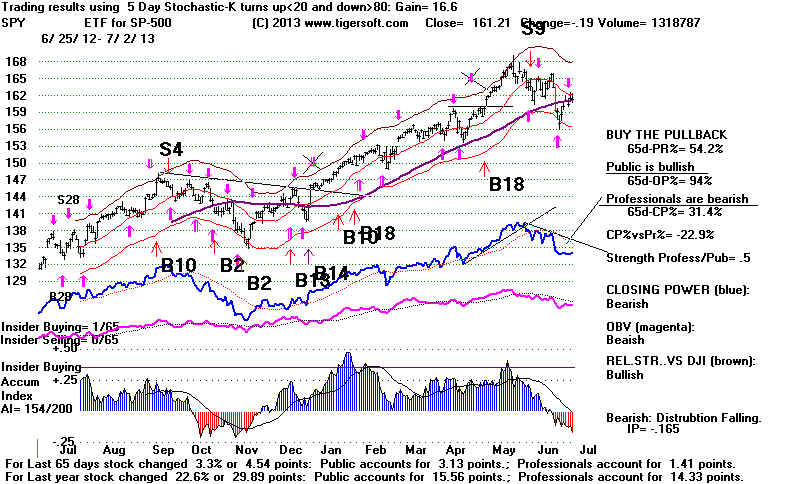
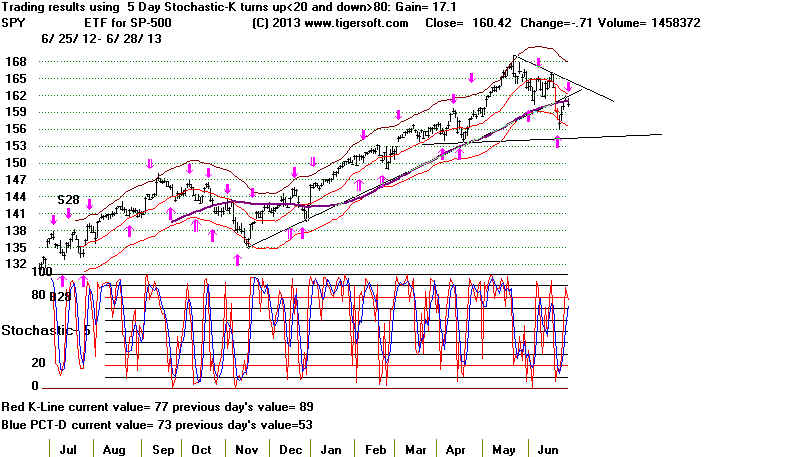
SPY has gotten above its upper band. It is at the cusp
of a breakout
or a breakdown. Its volume recently has been low. Its Closing
Power is lagging. This makes it more vulnerable if prices do turn
down. .
 |
 |
 |
A Comparison between MAXCP Stocks and
MINCP Stocks
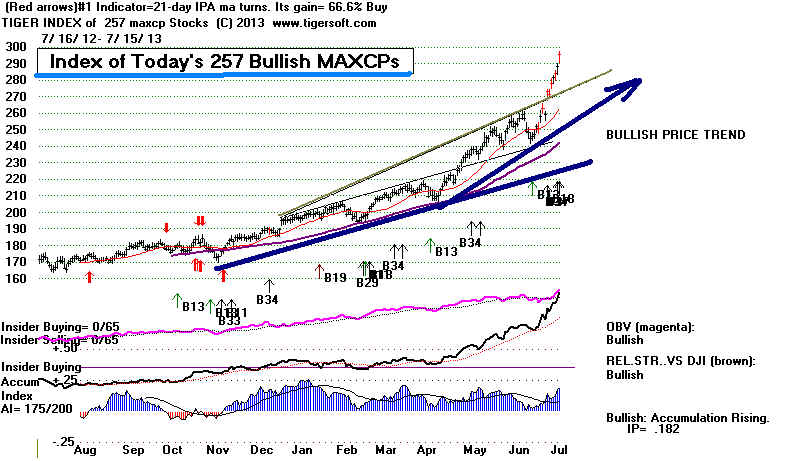
MINCPs Are Declining and show very weak internals.
 |
--------------------------------------------------------------------------------------------------------------------------------------------------------
OLDER HOTLINES
------------------------------------------------------------------------------------------------------------------------------------------------------
7/13/2013 Wait for the new Sell S8 to be
"Clinched". Stay short some of
the bearish MINCP stocks. These are South
American stocks and
short ETFs on smaller, less well-known stocks. Stay long the Leveraged
IWM ETF URTY and some of the Bullish MAXCPs.
Speculation
is picking up and will not be easy to stop. A number of
SP-500 stocks
made attractive and bullish flat topped breakouts on their
weekly charts.
So wait to act on the Sell S8. Otherwise, let's see what happens this week.
Ordinarily, the market is down starting the third week in July. Looking
all the 5 trading day periods after July 14th since 1965, we find that the
DJI was down 61.7% of the time. A continuation of the rally this week
despite those odds would be an impressive display of strength for the bulls.
Current Peerless Key Values
Date
DJIA
La/MA
AnnRoc P-I
P-I ch P^ ^ IP21 V-I Opct 65PctChange
7/12/2013
15464 +3 1.026 .371
+350
+91 +350 -.008 -.044 -4 +.264 .044
7/12//2013 ---> To Key Index and Leading Stock Charts
5-day
Pct-K Stochastic SPY Chart
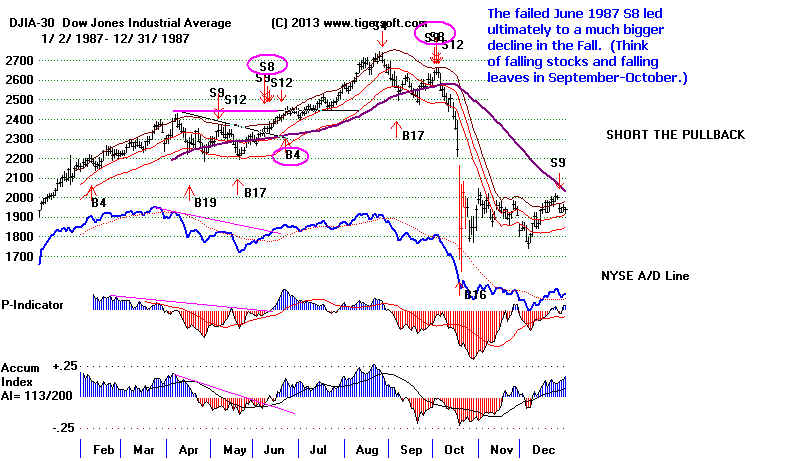
Sell S8s can fail for a while. Study the failed
case of June 1987. We have an
increasingly speculative market. The excesses always seem to get bigger
than we might imagine.
"The market can stay irrational longer than you can stay
solvent."
-- John Maynard Keynes
7/13/2013 New Sell S8
using the new 7/4/2013 Peerless. This link shows the track
record of the signal and its technical basis. The previous version of Peerless
shows the
operative Peerless signal still to be a Sell S9-B. The 7/27/2006 version
helpfully warns
of the A/D Line non-confirmation with a minor Sell S13 (which did not have a strong
track record.)
These Sell S8 signals are not perfect, but they are reliable enought to act on,
once the
market stops rising with positive breadth. Only one of the 14 Sell S8s brought a
loss
at the time of the next Peerless Buy. Half of them led to declines of 10% or more,
though the declines sometimes delayed. But the signal is not perfect. There
were
3 paper losses between 3% and 4.1%. If they do not bring about a decline now, it
usually
means a bigger decline is coming after Labor Day. (Think of leaves and stocks
falling
together).
Because the P-Indicator is positive, we do have to be concerned that the market will
keep rising as it did in June of 1987. As in the June 1987 case, the percent
change
of the DJI now over 65 days is relatively small. Keep in mind that big reversals are
more likely to come in the Fall and when there is more to reverse. So, if the DJI
makes
a brief sidewise pattern here with excellent breadth, we could see a new Buy signal,
most likely a Buy B4, as in 1987. We'll watch also to see if the Accumulation Index
turns up quite positively, as it did in late June and early July 1987.
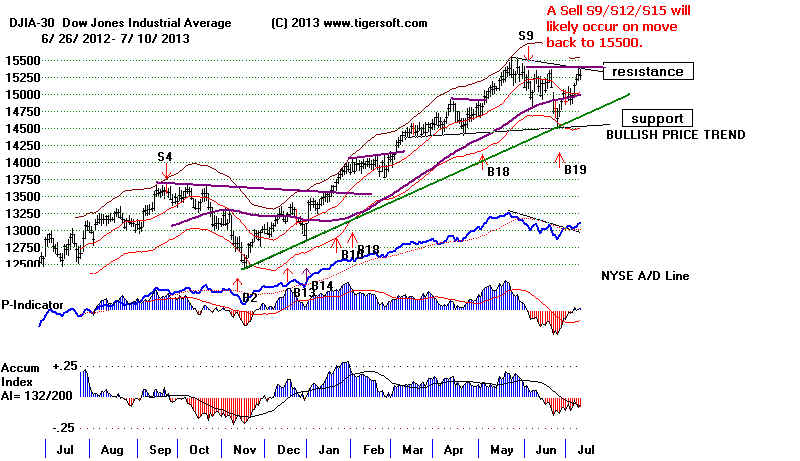
1987's Failed June Sell S8/S9/S12 led eventually to
a much bigger October Crash.
As I have been saying. we have an increasingly speculative market.
The large
number Bullish MAXCPs testify to that. So do the bullish leveraged ETFs.
So, at this stage, the Sell S8 signal applies mostly to the DJI-30 and NYSE
and not so much to the NASDAQ.
Details are important. If you study the key values associated with past Sell S8s
and the new one now, you will see that the failed June 1987 Sell S8 and the current
S8 case have something in common. The 65-day Pct Change in both cases was
up less than 4.5%. All the others had a higher key value. This means that
prices
may not be sufficiently over-bought to be reversed. We'll see.
Back in June 1987, we worked with a "clinching rule". There had be 25 more
NYSE stocks down than up on the day of the signal or on a subsequent day to
"clinch" the Sell S9 back then. As it turned out, the S9 then was never
"clinched:
before a new Buy B4 signal reversed the unclinched Sell. This turned out well
because the DJI advanced another 10% by mid August.
So, while the DJI may fall
back from the 15500 resistance, the NASDAQ,
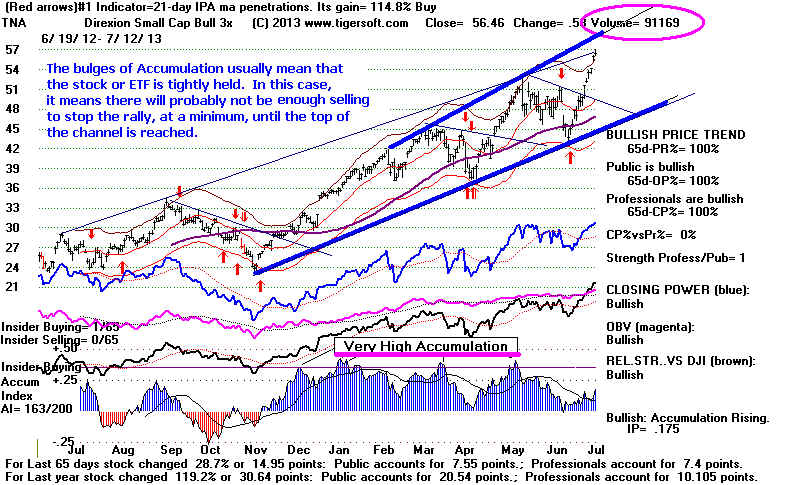
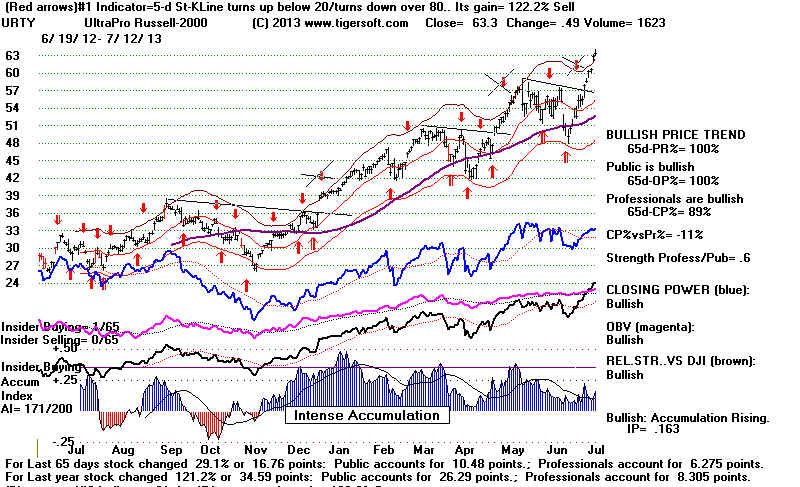
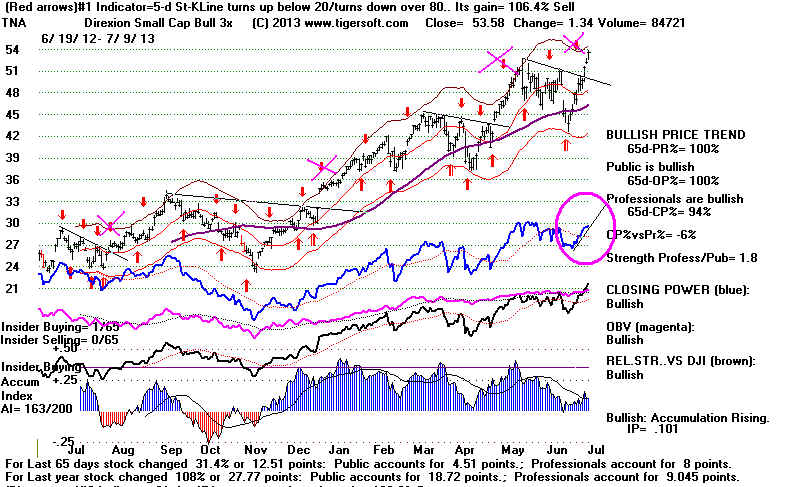
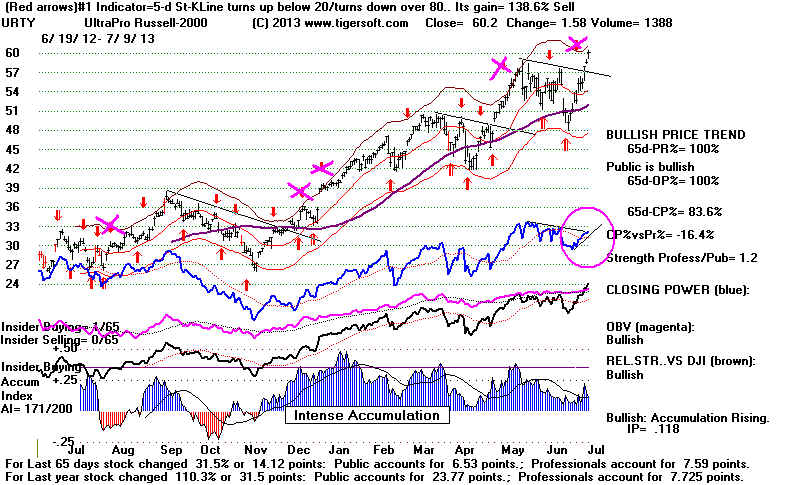
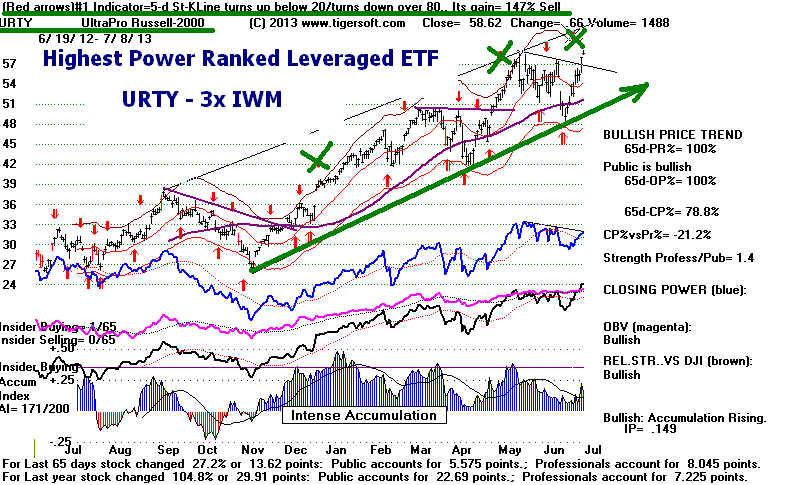
SAA (Leveraged Ultra Small Caps' ETF), URTY (Leveraged Russell-2000 ETF)
and TNA (3x Leveraged Small Cap) show high Accumulation and very superior
strength relative to the DJI. It would be surprising for their advances to halt
before they reach the top of their price channels. And, of course, they might
breakout, just to make life more miserable for the shorts and for the
skeptical.
Accordingly, if you hold URTY, as recommended here when the head/shoulders
pattern was aborted by the DJI closing above 15050, I would let them run further.
This has become a speculative market for secondary stocks. Money has been
coming out of well-known dividend stocks and put to work in high performance stocks.
That is likely to continue even if the DJI pauses or pulls back. (If you do not have
a position in URTY, we have to hope for a pull-back.) But keep in mind, the moves
up by TNA and URTY are not fluke-moves. Look at the high Accumulation, the
high relative strength and the very high trading volume in TNA. Speculative
advances in the "cats and dogs" has a long Wall Street tradition. It is
usually
the final stage up of a bull market and it can last a year or two, 1967-1968 and
1998-2000.
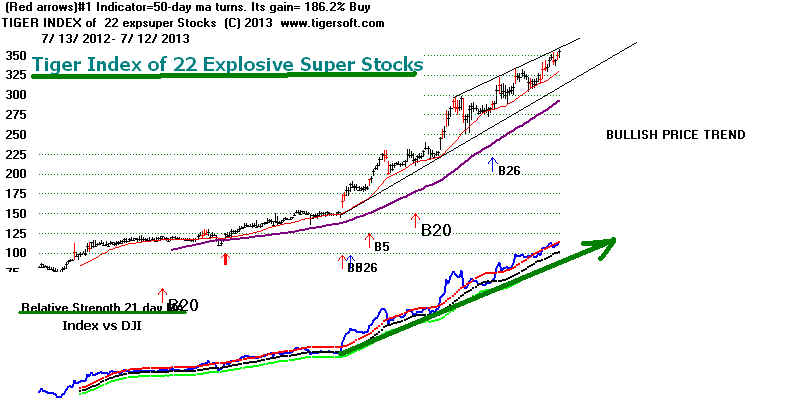
2013's Explosive Super Stocks
The 22 stocks here are worth studying, so that we have
no doubts about what to look
for in search for the best performing stocks.
But they have another use. Below I have created an Index of the 22 stocks
making new highs today that show extremely big bulges of Accumulation (IP21>.48)
at one or points this past year and are also up 110% over the last year. These
I call EXPLOSIVE SUPER STOCKS. I will post its chart here regularly.
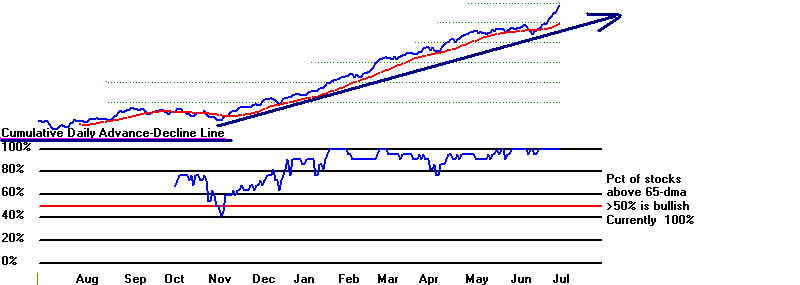
It should be helpful to watch the A/D Line and RSQ (Relative Strength) Line for this group
of stocks. Until these uptrend-lines are broken, I suspect the speculative
surge we are
mpw seeing will continue despite the Peerless Sell S4. It is hard for stock
markets not
to top out (or bottom out) without going to some foolish excess. The psychology of greed
and fear among the masses of fund managers (not to mention the broad public) are just
too entrenched by the need to perform well. They are too powerful to resist.
It is better
to accept that reality than fight it, I think, provided one is particularly vigilant and
sensitive to changes in the these trends.
----> 222
MAXCP stocks Bullish MAXCP Stocks (7/12/2013) Bullish plurality
---> 35 MINCP stocks Bearish MINCP
Stocks (7/12/2013)
---> 173 New Highs on NASDAQ 5
new lows. Bullish
plurality
---> 149 New Highs on NYSE 7 new
lows. Bullish plurality
=====================================================================================
OLDER HOTLINES
=====================================================================================
7/11/2013
No Peerless Sell Yet but the Distribution
in many of the
biggest
stocks in the SP-500 continues and is a warning.
Current Peerless Key Values
Date
DJIA
La/MA
AnnRoc P-I
P-I ch P^ ^ IP21 V-I Opct 65PctChange
7/11/2013
15461 +169 1.028 .268
+258 +217 +258 -.044
-25
+.186 .053
7/11//2013 ---> To Key Index and Leading Stock Charts
5-day
Pct-K Stochastic SPY Chart
The High Ratio (>7:1) of NYSE UP Volume to NYSE Down Volume today
prevented a
Peerless Sell S9V and a Sell S12. But with the heavy distribution and the DJI
at the
upper band, waiting for a pullback to buy more seems best. Hold long some of
the lesser
known, high Accumulation stocks and the ETFs IWM or URTY. Stay short
a few
Bearish MINCPs, too. We may still get a Sell tomorrow.
By my
research below, there is a 18% chance for an additional 13%-20% DJI
gain, but a
27% chance of an immediate sell off. If the rally continues, know
that in all
the Summers since 1929 in this this technical configuration, there were
only 2
cases of the DJI rallying more than 4.5% and 5 cases where the rally ended
with a a
further gain of 1% to 4.5% plus the 3 cases of an immediate sell-off. .
Consider
the history of negative divergences by the IP21 (Accum. Index) and V-Indicator
when the
DJI is 2.8% over the 21-day ma. since 1929 shows. I found 11 cases from
mid June
18th to September 8th. We see this is normally a bearish combination.
thuough
there are a 2 cases when prices rise to much higher levels, only to eventually
fall even
further.
In 3 of the
11 cases, the DJI fell immediately and below the lower band.
This alone
argues for
caution even though there was no official Sell yet. +27.2%
Probability.
In 5 of the
11 cases, the DJI first rallied 1% to 4% and then fell below the lower band.
This
included the Crash of 1929. In 4 of these 5 cases, the DJI fell below the lower
band.
+45.5% Probability.
In 2
of the 11 cases, the DJI rallied strongly. In the first case, 1935. momentum was
very
poswerful. The DJI was up 20% over the last 65 trading days. In the second case,the DJI
was
also
up 5.3% on 6/18/1987 when a Sell S12 occurred which failed as rhw DJI rallied
for
two more months before crashing. See 1987 The DJI is now also up 5.3%
over the
last
65 trading days. The adjustible P-I readings are also similar now compared to the
June
1987 case, +256 to +370. So, good momentum and comparable P-Indicator readings
offer
hope to the bulls that we may see another two months' strength. +18.2% Probability.
Negative IP21 and V-I in Rising Markets
with DJI 2.7% or more over 21-day ma
from July to September
1.
7/3/1929 DJI rallied 13% (from 342 to 381.2
on 9/3/1929) and
then crashed to 198. (11/131929) 65-day pct
change pct = 13.4%. P^^=20
2.
8/22/1929 DJI rallied 2.5% more from 369.9 to to 381.2
(9/3/1929) and
then crashed to 198. (11/131929)
Adjusted P-I = -135. 65-day pct change pct = 17.7%.
3.
9/6/1932 DJI fell immediately
from 77.3 to 56.4 on 11/30/1932.
5.4% over the 21-dma with IP21 = -.05
4.
6/24/1935 DJI rallied strongly.
This was not allowed because the DJI was up 20.3% over the last 65 days,
showing too much momentum with adjusted P-I was +165, too.
DJI was 3.5% over 21-dma with IP21 = -.024
5.
7/26/1938 DJI fell immediately from 143.3 to 129.9
(9/26/1938).
6.
7/1/1959 DJI rose 4% from 650.2 to 678.1 (8/3/59)
and then
fell to 616.5 on 9/22/1959. This was a Sell
S9/S12
7.
8/17/1971 DJI rose 2% from 899.9 to 916.47
(9/6/1971) and then
fell to 797.97 (11/23/1971). This was a Sell S12
8.
6/18/1987 DJI rose 13% from 2408.13 to 2722.42 (8/25/1987)
and then
fell to 1728.74 on 10/19/87. This was a Sell S9/S12
9.
7/8/1998 DJI rose 2% from
9174.57 to 9337.97 (7/17/1998) and then
fell to 7827.4 on 9/1/98. This was a Sell S9/S12
10.
8/14/2000 DJI rose 1% from 11176.14 to
11310.64 (9/6/00) and then
fell to 9975.02 on 10/18/2000. This was a Sell
S9/S12
11.
7/17/2007 DJI fell immediately from 13971.55 to 12845.70 on
8/16/2007.
This was a Sell S9/S12. Sell S9/S12
------------------------------------------------------------------------------------------------------------------------------------------------
7/11/2013 New Bullish Leveraged ETFs
----> 228 MAXCP stocks Bullish
MAXCP Stocks (7/11/2013) Bullish plurality
---> 63 -2 MINCP stocks
Bearish MINCP Stocks (7/11/2013)
---> 250 New Highs on NASDAQ 7 new
lows. Bullish plurality
--->232 New Highs on NYSE 2
new lows. Bullish plurality
=====================================================================================
OLDER HOTLINES
=====================================================================================
7/10/2013
We Are Close to A Peerless Sell S12. Usually
after a Sell S9B,
the DJI
goes into a trading range. Here the likely boundaries would be 14500 and
15500.
The big
jump in Crude Oil prices will hurt the recovery and could cause the
Fed to
raise interest rates more quickly than otherwise. It certainly is bearish
for LFL, Latin American Airlines Group.
The minutes for
the June Fed meeting on interest rates released late today suggest
there will not be
much if any reduction in QE-3 this year because the recovery
is still too
fragile. Knowledge of these minutes prior its public release was
something big
banks clearly have already acted on. After all, it is their
representatives
who make up the Open Market Committee. This accounts for
a big part of the
recent rally up from 14500. So, buying tomorrow morning on the
basis of this
"news" is probably not a good idea.
The DJI
stands +1.7% over the 21-day ma with an IP21 (Accum. index) of -.072
and a V-I
of -72. A rally of 153 points would cause the DJI to be
at the 2.7%
upper band
tomorrow. Since these internal strength indicators cannot easily
turn
positive. Peerless may give a Sell S9-V, a Sell S12 or a Sell S15 tomorrow
if the
closing price holds the higher opening.
We use 21-day moving averages. The numbers being
dropped off Thursday
and Friday
reflect big down-days. That will boost the Accumulation Index and
the
V-Indicator. It is not clear if it will be enough to avoid a sell signal.
Dummy
numbers
into the DATA.txt file using Peercomm and Edit towards the close tomorrow
to get a
preview of whether there is a Sell. (Thank you, Michael, for suggesting
this.)
Right now the DJI Futures would put the our key
index up 146 points tomorrow morning.
Since several key
Peerless internal strength indicators are negative, it is likely we will see
a Peerless Sell
S12 or S15 tomorrow. Don't rush to sell everything. We
probably
should wait to
see the signal clinched by more down than up on the NYSE. Secondary
stocks will hold
likely hold up a little longer, as happened in mid 1999. That the bearish
divergences now
in the Accumulation Index and ClosingPower have not lasted
a long time and
that we have not seen several Peerless S9s or S12s in the last 6 months
argue against
more of a retreat than back to the lower band, once there is a reversal.
Let's compile a
list of July Sell S12s from http://tigersoft.com/PeerInst-2012/--SellS12-.htm
since 1966 in
rising markets. There have only been 2 or 3 cases. In one case (1968),
the
DJI fell to the
lower band. The 1998 instance saw a much bigger decline. The 2000 case
brought a DJI
decline to the lower 2% band, then a 5% paper loss and then a 15%
DJI decline.
More tomorrow night if we get the signal...
3 July Sell S12s since 1965
...S12 #1      S7/S12    7/11/1968    922.82    Drop to next Buy = +4.3%
7/11/1968      922.82        la/ma=1.017   21dma.roc=.081
               la/65dma=1.022               65dma.roc=.35
               P= 36 Pchange=-18 IP21= -.052  V= 5  OP= -.008
-------------------------------------------------------------------------------------------------------------------------------------------------
...S12 #2      7/7/1998    9085.04        Drop to next Buy = +16.8%
7/7/1998       9085.04       la/ma=1.021    21dma.roc=.063
    la/65dma=1.009   65dma.roc=.042             P=-5 Pchange=-38
         IP21= -.047      V=-19        OP=  .056
------------------------------------------------------------------------------------
...S12 #3        7/ 17/ 2000   10804.27        +0.3%
     ( This has been dropped by new Peerless as a Sell S12.
       Not sure why.  Will have to check code tomorrow.)
7/17/0         10804.27      la/ma=1.023    21dma.roc=.101    la/65dma=1.016
             65dma.roc=-.117            P= 104 Pchange=-8
          IP21= -.046     V=-61        OP=  .202
------------------------------------------------------------------------------------
The Booming "Cats and Dogs"
Low Priced Speculative Boom. The shift of money from dividend
stocks to lesser known,
small companies
continued today. This theory explains why the Russell-2000.
the Value Line, IWM, URTY (3x leveraged IWM) and TNA (3x Leveraged Small cap ETF
are now moving to
new highs ahead of DIA, SPY.
These smaller cap ETFs show none
of the red
Distribution now seen in the Tiger charts of DIA, SPY and many individual high caps.
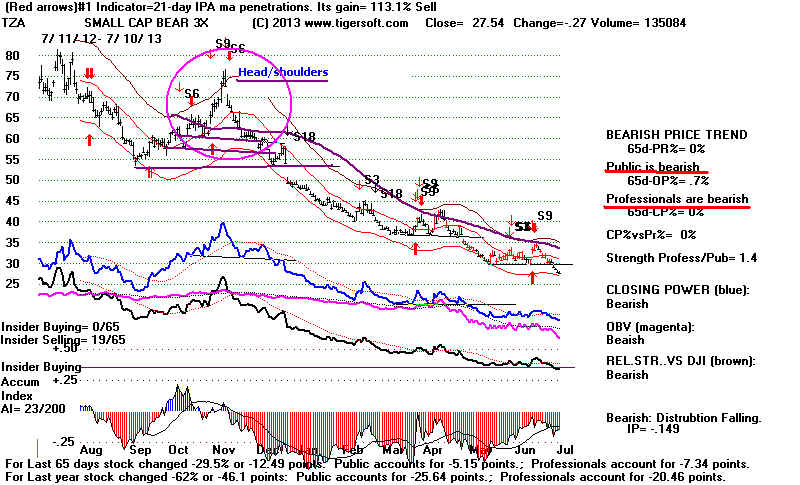
We should start
watching TZA, the very heavily traded, 3x leveraged Short
Small Caps
ETF.
Its chart below is a classic bearish one, complete with heavy red Distribution,
flat-bottomed
breakdowns, failed rallies to a falling 65-dma and a blue Closing Power
that regularly
confirmed new lows. See also TWM. (the Ultra
Short ETF on IWM.
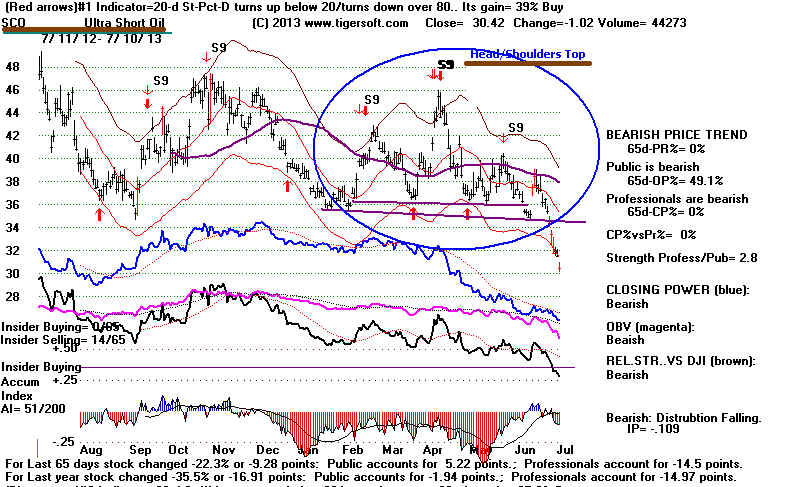
Oil prices jumped
still higher today, showing their recent Accumulation and Closing Power
confirmed
breakout was significant. Our Perpetual Crude Oil chart,
CL1600, shows a classic,
bullish breakout.
And if there are any doubts of this, see how classically bearish looking
the ETF shorts on
Crude Oil look, namely actively traded SCO and DTO.
We should
all remember how
$145 Crude Oil killed the stock market in mid 2008. Oil prices
this high are a
heavy tax on consumers and may cause more Fed Governors to
make fighting
inflation their highest priority.
South
America's economies are now being hit with a pair of triple whammies,
falling prices
for gold, silver and copper, rising interest rates, oil prices and public
expectations.
Accordingly, consider shorting LFL, Latin
American Airlines Group.
----> 228 MAXCP stocks Bullish MAXCP
Stocks (7/10/2013) Bullish plurality
---> 63 -2 MINCP stocks
Bearish MINCP Stocks (7/10/2013)
---> 120 New Highs on NASDAQ 7 new
lows. Bullish plurality
--->88 New Highs on NYSE 19
new lows. Bullish plurality
====================================================================================
OLDER HOTLINES
====================================================================================
7/9/2013 The Accumulation Index Shows Lots of Distribution on This Rally.
A July Top Seems Likely.
That would be consistent with the earlied Sell S9B marking
the start of a trading range.
I think we have to wait for a new Peerless Sell.
Tiger Sell S9s (Negative
Accumulation at the upper band) can be now displayed on a
number of important
stocks: WFC (Wells Fargo), UPS
(United Parcel), USB (US Bank Corp),
UTX (Unitied Tech), XOM (Exxon), V (Visa), ADBE and in SP-500: AMP,
FII, JNJ,
K, KLAC, ROP, SLB,
AFLAC, BBT, CAM, CERN (two days ago), CFN, CTAS,
FRX, GD, GME, HIG,
I{G, NTRS, RAI, TSS, WDC. You can also put Tiger S9
on the NASDAQ and DIA (below).
Another 1% rally higher
will most likely cause a comparable Peerless Sell S12 to appear
on the DJIA chart.
Remember the Peerless Sell S9 is different. The Tiger Sell S9 is
similar to, but usually
leads, the Peerless S12 and Sell S15. Only in 3 of the 14 cases of a
Tiger Sell S9 since
1998 did the DIA rally right afterwards. One case was in 1999 when
the market had become
very speculative, as I was discussing yesterday, In two of the
other 3 instances of a
rally following the S9, there had just been a long bear market.
How Well Do Past Tiger S9s Predict The DIA?
The 14 Earlier Cases since DIA's Inception.
BAD 4/7/99 DIA rallied from 101 to 112.93
on 8/24 and then fell to 100 on 10/15 and rallied
again.
A Peerless S12 did not occur until 6/8/1999 and on 8/23/1999 with DIA at 113.29. n
12/23/99 DIA fell from 114.48 to 109.76 on 1/4/2000 and then to 100.32 on 3/9/2000.
There soon followed Peerless S9s and S15s.
12/13/2000 DIA fell from 108.06 to 102.95 on 12/20/2000, rallied
4% and fell to 93.45 on 3/22/1001.
A Peerless S9 had occurred two days earlier. A Peerless Sell S8 stopped the recovery
rally.
BAD 4/23/2003 DIA rallied much higher as new bull
market began,
There was no Peerless Sell.
2/15/05 DIA fell from 108.48 to 100.05 on 4/28/2007
A Peerless Sell S15 on 3/4/2005 (109/54) marked the exact
top.
12/19/06 DIA fell from 108.21 to rising 65 day ma, 106.47 on 1/20/2--6)
and then rallied.
There was no Peerless Sell.
1/5/06 DIA fell from 108.88 to rising 65 day ma, 106.47 on 1/20/2--6)
and then rallied.
There was no Peerless Sell.
2/15/06 DJI fell only 2% and then rallied 6%.
There was no Peerless Sell.
6/18/07 DIA rallied first from 135.94 to 139.80 on 7/17/07 and then fell to 128.85 on 8/15/2000.
Peerless Sell S9 and Peerless Sell S12 marked the exact top
in July.
11/4/2008 DIA fell immediately from 96.21 to 80.54 on 11/21/2008.
This coincided with a Peerless Sell S12
BAD 3/19/2009 DIA rallied strongly into a new
bull market.
There was no Peerless Sell
10/14/2009 DIA fell only 3% to rising 65-dma and then
rallied for 3 months.
A Peerless Sell S12 followed a few days later.
12/7/2011 DIA fell only from 122.07 to 117.36 on 12/19 and then
rallied strongly.
Peerless gave a Buy B13 at bottom.
10/11/2012 DIA fell from 13313.13 to 125.06 on 11/16
Peerless had given a Sell S4 a few days earlier.
The Bearish MINCP stocks include a number of companies
from Chile, Argentina
and Brazil.
Experience suggests that their appearance in numbers is significantly
bearish. .
Current Peerless Key Values
Date
DJIA
La/MA
AnnRoc P-I P-I
ch P^ ^ IP21
V-I
Opct 65PctChange
7/9/2013
15300 +76 1.018 .041
+15 +14 +14 -.076
-71
+.111 .05
7/9//2013 ---> To Key Index and Leading Stock Charts
5-day
Pct-K Stochastic SPY Chart
----> 232 -8 MAXCP stocks Bullish MAXCP
Stocks (7/9/2013) Bullish plurality
---> 65 -21 MINCP stocks
Bearish MINCP Stocks (7/9/2013)
---> 179 New Highs on NASDAQ 9 new
lows. Bullish plurality
--->171 New Highs on NYSE 13
new lows. Bullish plurality
Let's watch to see if the Closing Power uptrend of the most bullish leveraged Sector
funds is
broken, suggesting an end to their rally. They have approached their upper
band
without a big improvement in their Closing Powers. For now, I would hold them,
but also
stay short some bearish MINCP stocks as a hedge.
====================================================================================
OLDER HOTLINES
====================================================================================
7/8/2013
A July Peak for SPY and DIA May Be Shaping
Up. IWM and
Value
Line are another story.
The DJI seems to be rallying on higher Openings up to the
upper band,
about 2% higher where it will generate a Sell S12 or Sell S9-V based on the
negative Accumulation Index and V-I Indicators. Meanwhile, secondary stocks are
getting some of the money that was previously invested in NYSE dividend stocks.
The
uptrend of IWM may continue for a while after a Peerless Sell signal. That,
at
least, is the lesson that 1999 offers.
Current Peerless Key Values
Date
DJIA
La/MA
AnnRoc P-I P-I
ch P^ ^ IP21
V-I
Opct 65PctChange
7/8/2013
15225 +89
1.013 .146
+1
-60 +1 -.053 -73 +.109 .042
There are many, many lesser known stocks breaking out with very hiigh
Accumulation. See tonight's Bullish MAXCPs.
Speculation has moved away from
dividend paying blue chips and SP-500 stocks. It's not clear that even a
retreat by the DJI
would curb the broad rise in lesser known stocks. I won't call them "cats and
dogs", but there are eerie similarities to 1968 and 1999 when many unfamiliar
symbols made very big advances. after a very long bull market. URTY is the ETF
I would use to trade this advance in secondary stocks. Since URTY;s Closing Power
has not confirmed the breakout, I would still be hedged some of the
Bearish MINCP stocks.
7/8//2013 ---> To
Key Index and Leading Stock Charts
5-day
Pct-K Stochastic SPY Chart
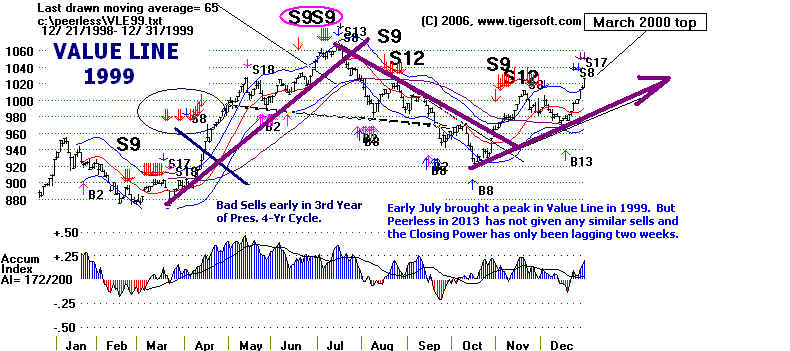
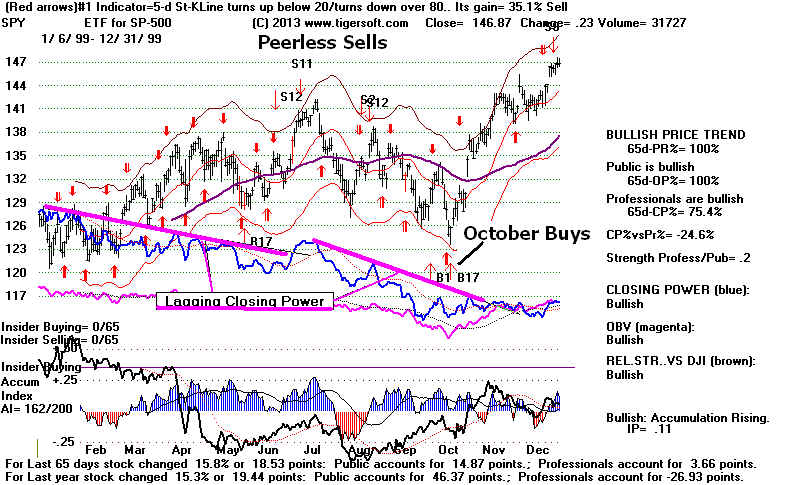
Similarities with the Summer of 1999
We
want now to watch the Russell-2000 and Value Line. Breakouts with
confirming Closing Power new highs would be quite bullish for a month or so
in
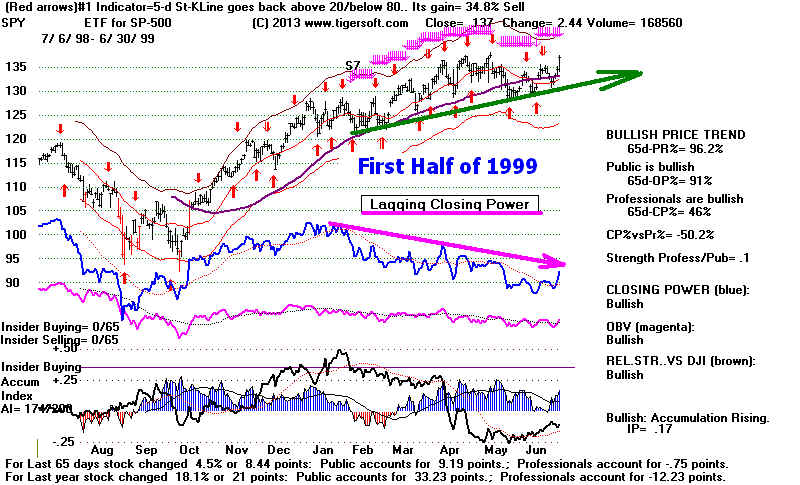
these secondary stocks. The lagging Closing Power on the DIA and SPY support
this
interpretation. The way the Closing Power is lagging now is starting to look
like
the way Closing Power lagged the SPY throughout 1999. In that year, there
was a
10% decline in the Value Line only after a second Sell S9. All we had to
then
was play the price-trend of the Value Line in 1999 to reap the bulk of
its
big gains. This is worth considering as a strategy for playing the lagging
Closing Powers and the lagging SPY and DIA. Because we have not had a similar
Peerless Sell and because the Closing Power has only recently started to lag
prices, I would think the Value Line and Russell-2000 has 10%+ more upside now.
Compare the way the Closing Power for SPY lagged prices throughout 1999.
SPY 1998-1999
 |
1999 SPY
 |
----> 250 +7 MAXCP stocks Bullish
MAXCP Stocks (7/8/2013) Bullish plurality
---> 86 +3 MINCP stocks
Bearish MINCP Stocks (7/8/2013)
---> 197 New Highs on NASDAQ 4 new
lows. Bullish plurality
--->147 New Highs on NYSE 20
new lows. Bullish plurality
=====================================================================================
OLDER HOTLINES
=====================================================================================
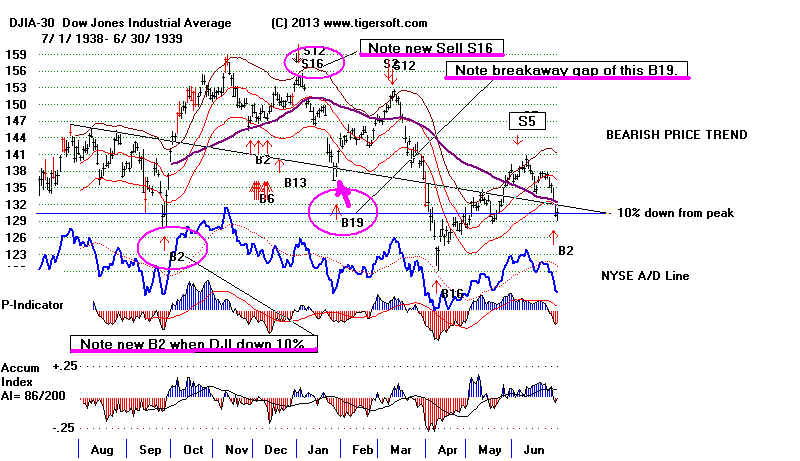
7/5/2013
Hedging with some short
sales among the Bearish MINCP Stocks
still
seems advisable. But a breakout by the Russell-2000 or
the Value Line
would
show that we may be entering a period of increased speculation in smaller
stocks. Such a phase often ends a long bull market. Note
the Buy B19
on
6/25/2013 using revised Peerless (7/4/2013). It is based on its "breakaway
gap" from previous day's close. See below the beakaway gap on the Buy
B19
early
in 1939.
!938-1939 Shows 3 New Peerless Signals.
The Closing Power's divergence from Prices and Openings in the DIA and
SPY
charts are not bearish unless the DJI falls back below the 65-dma. That
could
happen if the July 4th week's low volume gains prove to be only temporary.
Current Peerless Key Values
Date
DJIA
La/MA
AnnRoc P-I P-I
ch P^ ^ IP21
V-I
Opct 65PctChange
7/5/2013
15136 +147 1.008 .139 +60
+111 +60 -.021 -53 +.108 .04
----> 243 MAXCP stocks Bullish
MAXCP Stocks (7/5/2013) Bullish plurality
---> 83 +33 MINCP stocks Bearish MINCP Stocks (7/5/2013)
---> 250 New Highs on NASDAQ 10 new
lows. Bullish plurality
--->173 New Highs on NYSE 43
new lows. Bullish plurality
7/5//2013 ---> To Key Index and
Leading Stock Charts
5-day
Pct-K Stochastic SPY Chart
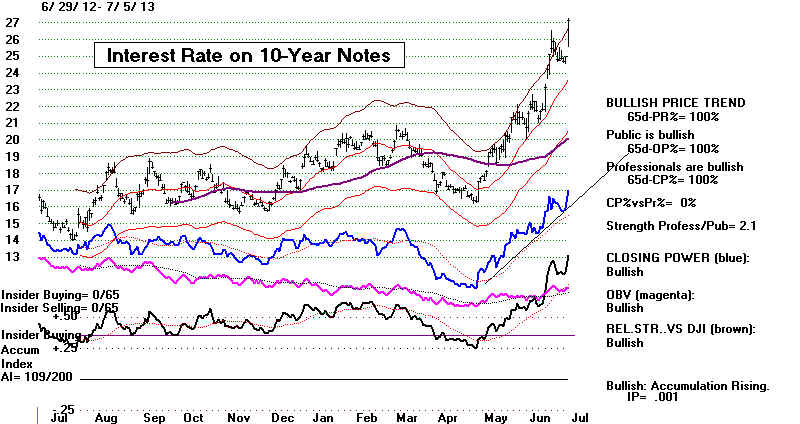
Interest Rates on The Rise
Interest rate worries? While the rise in interest rates may
bring another decline
to
the lower band, in the past, there have been many 1/4% rises in the Prime Rate
or
Discount Rate and as long as rates were very low, under 3 1/2%, the DJI seldom
fell
much below the lower band. There are two exceptions. The first was in
January
2003,
when Greenspan blundered
and raised rates while the DJI was still in a bear market.
The
second was on February 4, 1994 when the Federal Funds were raised from 3% to 3 1/4%.
That
immediately brought a 10% decline. Greenspan's first blunder, of course, was in
September 1987. which precipitated the DJI's 33% free-fall the next month. We do
have
to worry that the Fed will blunder. Or perhaps, Obama has decided NOT to reappoint
Bernanke because the Fed Chairman no longer wants to provide extremely low rates.
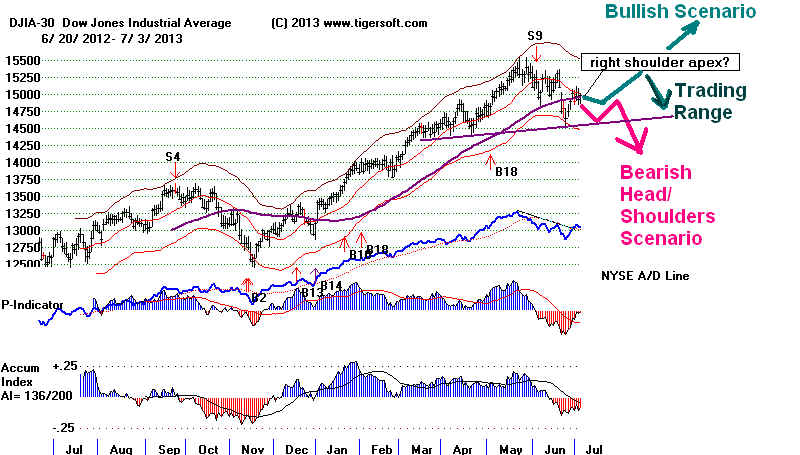
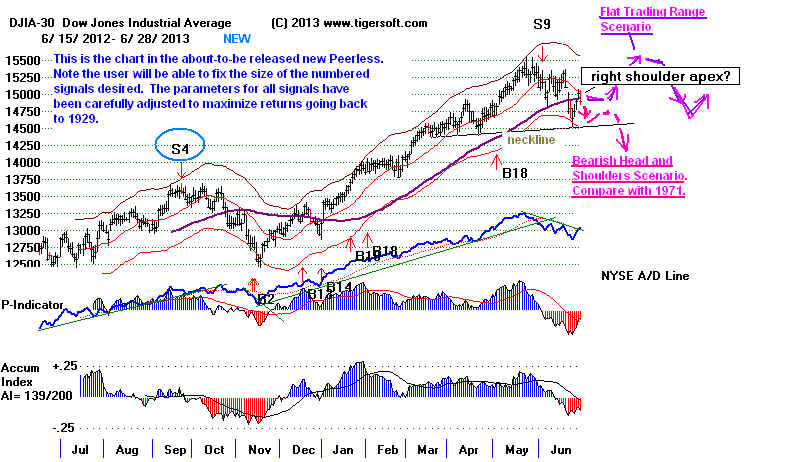
End of The Head/Shoulders Pattern
The
DJI rose above the apex of its potential right shoulder in head/shoulder pattern
on
Friday. This was on light holiday trading volume. So, we will have to
wait to see
whether the big market's players, banks and institutions, allow the breakout over 15500.
But,
at this time, it looks like the bearish head/shoulders pattern scenario, which I have been
mentioning here, has been destroyed.
Peerless Should Probably Be More Political
Peerless
does not require users to indicate who is in the White House. But maybe,
it should.
A Democrat in White House clearly favors more of a Summer Rally in
the
post-Presidential Election Year than a Republican in the White House does.
See
Thursday's Hotline.
Buy B19 - Reversal Up
New
research here shows that the reversal on June 25 should probably have been
treated as
a Buy B9 despite the earlier Sell S9-B. History shows that when a powerful
reversal
upwards takes place with a price gap between the previous day's close and
the low on
the reversal day, it is a reliable B19 reversal.
July 4, 2013 New Peerless
All
things considered, I now take the operative Peerless signal to be a Buy B19.
The
new Peerless release of today reflects that. I am posting links to all its charts
since 1965
above
for your reference. The signals have been changed in a number of places. The
July
2013 documentation still remains undone. That will be the highest priority now.
It
will be posted separately from the Documentation
for the last update, March 2013.
In
the new update, there are many more Buy B2s, much revised Sell S7s and Sell S8s
and a
new Sell S16 for year-end false rallies. The signals test very well back to 1929.
There
is a simpler procedure for using the Extreme Bearish Mode.
When the
new Program's documentation is done, it will be posted. My Peerless book
will
include documentation back to 1928. plus a lot more. Links to download this July
2013
update will
be sent to purchasers and Elite Subscribers later tonight. If
you want this update,
please send
a check for $75 to William Schmidt, 5970 Gullstrand Street, San Diego,
CA 92122.
I still can take CCs, but they are very time-consuming to enter, there is a delay
and the
bank takes too much money. So, I appreciate your help here.
Can The Market Really Rally with Rates Up So Much?
Technically, the odds favor a rally almost to the upper band at 15500 and then
another decline to the lower band since the V-Indicator remains quite negative.
Moreover, the DJI and SP-500
are in downtrends. So are the Closing Powers
for
the DIA and SPY.
Meanwhile, the Russell-2000 looks like it may breakout
above
its flat resistance and start a good advance made up mostly of non-dividend
paying stocks. Utilities, bonds, REITs and many
NYSE dividend favorites
will
probably not participte unless the FED eases off its plans to wean the market
off
of QE-III.
Bernanke and the Fed will have a lot to say about rates later this week. And that
will
have a big impact on whether there is much of a rally from here. If Bernanke
is
watching the prices of Crude Oil, which has run up to
$103, he may agree with the
"hawks" that inflation is now a problem. Or he may argue that, Crude Oil's
rally
reflects the turmoil in Egypt, where the Suez Canal is. Deflation seems more
in
evidence to me. Food prices remain in a decline, as is Gold, Silver, natural gas,
copper and coal. Since the Dollar and 10-year
Interest Rates jumped to new highs,
Bernanke may decide to try to calm the fears of bondholders in his next speech.
Friday's Job Report was ambiguous. Yes, more jobs were created than expected,
but
Unemployment here in the US and in Europe is way to high.
The
interest rate on 10-Yr Treasury Bonds has risen more than 1% in under
2
months. In the past, big jumps in the Discunt Rates, by
1/2% in one accouncement
were
very likely to bring a 10% DJI drop of more. This was true in the aftermath
of
the rate hikes of 8/23/1957, 2/26/1973, 4/25/1974, 4/9/1984, 9/4/1987, 8/16/1994
and
5/16/2000.
However, rises in interest rates from very low levels mostly do not seem to halt
market
rallies for very long. Consider how Prime Rate increases affected the stock
market between
August 1, 1948 (2% +1/4%) to August 6, 1957 (4.5% + 1/2%) and between 2002
and
2007 when Discount Rates were regularly raised. 4 of the 8 Prime rate increases
up to
3 1/2% brought significant advances. Rate increases did not
drop the DJI below
the
lower band until the Prime Rate rose over 3 1/2% and over 3 1/2% for Discount
Rate.
1 August 1, 1948
2% DJI declined from 181.3 to 176 (9/27/48)
Bigger move was up
and then rallied to upper band (189) on 10/27/1948
2 September
22, 1950 2.25%
DJI rallied to upper band two
weeks later,
Flat
and then fell to lower band.
3 January
8, 1951
2.5% DJI rallied
9% from 242 to 263 in five months.
Big move continued
4
October 17, 1951
2.75%
DJI fell 7%, from 273.5 to 257 on 11/23 and
First move was down.
then rallied back to 275 on 1/22/1952
5
December 19,
1951 3.0% DJI rallied 3% from 268 back to 275 on 1/22/1952
Big move was down.
and then fell 7% to 258.5 and lower band on 2/20/1952
6
April 27, 1953
3.25% DJI rallied 2+% from
272.7 to 278.8 on 5.11/1953
Big move was down.
and then fell 6% to 262.9 om 6/16/1953
March 17, 1954
3.0% This launches big bull
market.
7 August 4, 1955
3.25% DJI fell from 454.2 to 448.8 5 days later and then
Bigger move was up
broke out and rallied past the upper band.
to 486 on 9/22/1955
8
October 14, 1955
3.5%
DJI rallied from 445 back to old highs at 489 on 11/17/1955.
Bigger move was up
April 13, 1956
3.75% DJI rallied 2% and
then fell to 468.8 on 5/28/1956.
Big move was down.
August 21, 1956
4.0% DJI fell 505 to 466,1 on 11/28/1956.
Big move was down.
August 6, 1957
4.5% DJI started bear market,
fell 494 to 420 on 10/22/1957.
Big move was down.
Greenspan and Discount Rates
1/25/2003
1.75% to 2.00%
DJI fell below lower band m 8131to 6524 on
3/11/03
Bear market had not ended.
6/30/2004
2.25% DJI fell from 10435 to 9815 (lower band) on 8/6/2004
8/10/2004
2.5% 3rd rise did not bring a
decline.
DJI rallied from lower band almost to upper band.
9/21/2004
2.75% DJI fell from 10245 to 9755 (lower band) on 95/2005
11/10/2004
3.0% DJI rallied 5% from 10385 to 10941 on
3/4.2005.
12/14/2004
3.25% DJI went sidewise for 4 month before falling to lower band.
2/2/2005
3.5% DJI rallied 3% and then fell below lower bamd.
3/22/2005
3.75% DJI fell 5% from 19565 to 100012 a month later/
=====================================================================================
OLDER HOTLINES
=====================================================================================
7/3/2013
Peerless Sell S9B
While, the Key Values are mostly STILL Negative, a
Democrat in
the White House favors a Summer Rally this year. A decisive move
above 15050
would destroy the bearish-looking head/shoulders pattern.
Current Peerless Key Values
Date
DJIA
La/MA
AnnRoc P-I P-I
ch P^ ^ IP21
V-I
Opct 65PctChange
7/3/2013
14989 +56 .99 -.150 -52 6
-52
-.076 -88 +.03 .022
----> 160 MAXCP stocks Bullish
MAXCP Stocks (7/3/2013) Bullish plurality
---> 50 MINCP stocks Bearish MINCP Stocks (7/3/2013)
---> 63 New Highs on NASDAQ 9
new lows. Bullish plurality
---> 33 New Highs on NYSE 19
new lows. Bullish plurality
7/3//2013 ---> To Key Index and
Leading Stock Charts
5-day
Pct-K Stochastic SPY Chart
The DJI is
developing in the classic fashion that a potential head/shoulders does.
It is hesitating
as it traces out a potential right shoulder.
The bearish
scenario requires a penetration of the rising 14500-14600
neckline.
This only happened in 1971 Sell-S9B case.
More common is for the
DJI to enter an
extended trading range, as it did in 1986 and 2004 after a Sell S9-B.
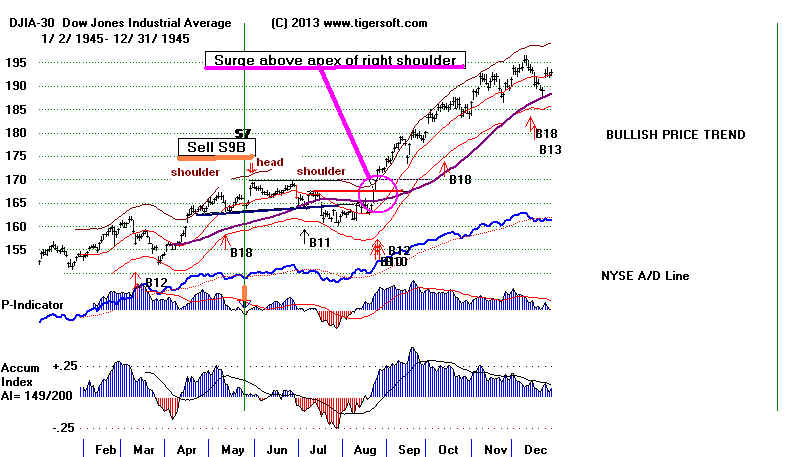
There is also a
chance that the DJI will surge upwards once it surpasses the 15000-15100
right shoulder
apex. This destroys the head/shoulders pattern and causes
a rush of
short-covering. This happened following a Sell S9-B in 1945. See
the second chart
below.
Wednesday's rally
did see an up-closing after a weak opening. This is what
caused the Closing Powers to turn up. Crude
Oil broke out further over resistance and
$100 barrier.
AAPLE is trying to turn around. Biotechs have held above the
neckline in their
own head/shoulders pattern. Auto stocks are doing well.
But on Wednesday,
there were more down than up on the NYSE as concerns about
rising interest
rates continued. Will the rally continue when more normal trading
starts next week?
A retreat back to 14500 would make the DJI's formation look
more like a
bearish head and shoulders. Our Stocks' Hotline is comfortably hedged.
I think a lot
depends on whether the 15000 resistance on the DJI is decisively
overcome.
An advance above that would destroy the potential head and
shoulders
pattern. Often as in 1945, this brings a strong advance.
1945 Sell S9-B Case
Be flexible.
There are enough high Accumulation stocks breaking out among the
Bullish MAXCP to
give us plenty more stocks to go long if this happens.
Obama - Wall Street's Ally.
The pattern of
Summer Rallies when a Democrat is in the White House should
also encourage us
to play the long side if the market rallies next week. See how
differently the
DJI generally behaved after July 4th in the Post-Presidential Election
Year when a
Democrat was in office as opposed to when a Republican was charge.
Since 1945, only
once was there a July decline when a Democrat was in control
in 8 cases.
August was almost as bullish.
Of course, one
could argue that Obama is less powerful because Austerity-minded
Republicans
control the House of Representaives. To the extent that is true,
Obama's case may
still bear more resemblance to Jummy Carter's Austerity
in 1977.
Rhetoric aside, I believe Obama has helped Wall Street and the bull market
repeatedly since
2009. He has, for example, not muttered a single word about a
tax on
computerized trading. Now he is backing down regarding businesses being
required to buy
Health Care insurance for all employees in 2014.
DJIA with Democrat in White House
7 of 8 brought gains for rest of year.
Red shows a down month.
July
Aug
Sept
Oct
Nov
Dec
7/3 7/31
8/31 9/31
10/31 11/30 12/30
-------------------------------------------------------------------------------------------------------------------------------
1945
165.7 162.9
174.3 180.1 186.6
191.5 192.9 Celebration- end of
WW-II
1949
168.1 175.9
178.7 182.5 189.5
191.6 200.5 Very
strong rally after June 14th,
1961
689.8
705.3 716.9 701.2 701.1 721.6
731.5 JFK and Camelot enchantment.
1965
875.2 881.7
893.1 930.6 960.8
946.7 969.3
LBJ and War reving up.
1977 912.65 890.1 851
847.1 818.4
829.7 831.2 Carter was
not a Keynesian
1993 3484
3539 3651
3555
3681 3684
3754 Clinton and Rubin start dereg.
1997
7896
8223 7622 7945 7442
7823 7908 Clinton and Rubin
dereg.
2009
8281
9172 9496 9712 6
9713 10345 10428 Recovery
---------------------------------------------------------------------------------------------------------------------------------
6 up 6 up 5
up 5 up 8 up
8 up
2 down 2 down 3 down 3 down 0
down 0 down |
DJIA with Republican in White
House
Red shows a down month. 5 of 9 brought declines for rest of year.
July
Aug
Sept
Oct
Nov
Dec
7/3 7/31
8/31 9/31
10/31 11/30 12/30
-------------------------------------------------------------------------------------------------------------------------------
1953
270.5
275.4 261.2 264.0
275.8 281.4 278.3 bottom was on Sept 15th
1957
513.3 508.5 484.4 456.3 441.0 446.0 435.7 bear market
-July S9.
1969
886.1 815.5 828.4 813.1 856.0 812.3
800.36
1973 886.0 926.4 891.0 947.1 957.0
822.3 848.02
1981 959.2 952.3 881.5
845/0 852.6 889.0 875.00
1985
1326.4 1347.5 1334 1329 1374 1472 1547
1989
2452.8 2660.7
2737 2693 2645 2706
2753
2001
10571 10523
9950 8848 9074 9852
10002 9/11 Attack
2005
10303 10641 10482 10569 10440 10806 10718
---------------------------------------------------------------------------------------------------------------------------------
5 up 2 up 3
up 6 up 7 up
4 up
4 down 7 down 6 down 3
down 2 down 5 down
|
====================================================================================
OLDER HOTLINES
====================================================================================
7/2/2013
Peerless Sell S9B
The Key Values are mostly STILL Negative.
The bearish head and shoulders pattern is more fully taking shape
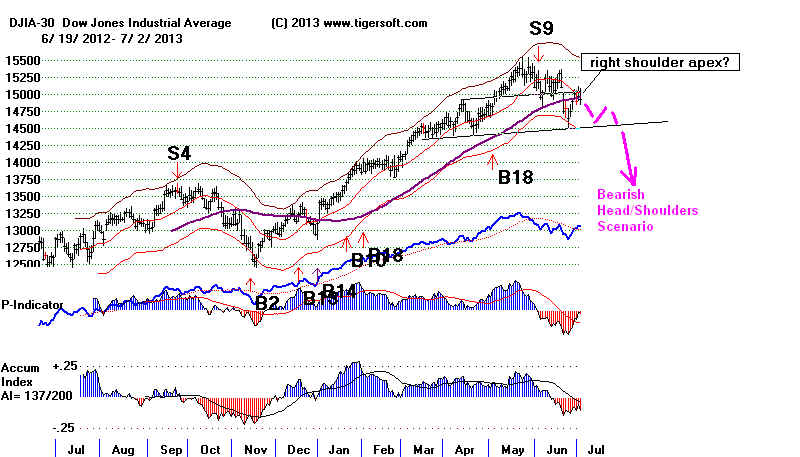
At best, a Trading Range between 14500 and 15000 is developing. But note
the DJI's emerging price pattern is a bearish head and shoulders formation.
If this pattern were to be completed with a DJI close below 14500, it would
look a lot like 1971 which produced a 17% DJI
decline. That the DIA and
Closing Powers have failed to rise over the last 5-days's advance is bearish.
New York Professionals are selling to hot money buyers from overseas,
who apparently are buying blue chips here because of the strong dollar. Much
now depends on interest rates and foreign markets.
 |
 |
Most of the Sell S9B-s merely bring declines which double-test
the lower band. However, a breaking of the neckline, here that
means 14500, completes a bearish head and shoulders pattern. That
would set up a minimum downside target 1000 DJI points lower.
If foreign markets go to new lows and the interest rate on 10-year
bonds make new highs, the dangers of a bigger decline in our
markets
will become obvious and acute. The 5-day Stochastic-K-Line told
us to sell into this rally. I would become hedged with some of the
bearish MINCP stocks. The seasonality right
after the July 4th
week has tended to be bearish. A 10%-15% decline following a
tightening shift in Fed policies would normally be expected. With Crude
Oil knocking on $100/bar, the hawks on the Fed may have
added
power even though Food Commodities are hitting new lows and
Deflation not Inflation is clearly the bigger danger.
Current Peerless Key Values
Date
DJIA
La/MA
AnnRoc P-I P-I
ch P^ ^ IP21
V-I
Opct 65PctChange
7/2/2013
14975 -42 .996 -.111 -41 +165
-41 -.057
-87
+.045 .026
----> 165 -28 MAXCP stocks Bullish
MAXCP Stocks (7/2/2013) Bullish plurality
---> 63 +28 MINCP stocks Bearish MINCP Stocks (7/2/2013)
Low Accumulation Stocks 7/1/2013
---> 84 New Highs on NASDAQ 13
new lows. Bullish plurality
---> 47 New Highs on NYSE 16
new lows. Bullish plurality
7/2//2013 ---> To Key Index and
Leading Stock Charts
5-day
Pct-K Stochastic SPY Chart
THE FOURTH OF JULY
On the eve of the Fourth of July, we should not underestimate popular discontent
with the status quo.
Eurozone unemployment rate: 12.2%
Eurozone youth
unemployment rate: 23.9%
Loan practices of China's banks raising concern
China
tightens bank credit to cool fast-growing economy

America's Declaration of Independence" created new standards by which rulers
everywhere would be judged. "We hold these truths to be self-evident, that
all men are created equal, that they are endowed by
their Creator with certain
unalienable Rights, that among these are Life, Liberty and the pursuit of
Happiness."
Thomas Jefferson, an avid reader of John Locke and a slave owner, too, aged
only 33, wrote these words as goals for a new nation. Abrham Lincloln believed
the constitution must be interpreted with these goals in mind and America should
in its deeds live up to its fine words. These goals are not handed to us. They have
required great sacrifice. 600,000 soldiers died in America's bloody Civil War.
American soldiers' deaths in World War I were 117,000 and 430,000 in World War
II.
Abraham Lincoln understood this well. The sacrifices were to keep alive the goal
that there should be new type of nation, with a "government of the people, by the
people
(and) for the people.”
=====================================================================================
OLDER HOTLINES
=====================================================================================
7/1/2013 Peerless Sell
S9B All the Key Values are STILL Negative.
A Trading Range between 14500 and
15000 seems to be developing.
If the DJI does breakout past the 15000 resistance, we will need to
see much more Professional buying to become bullish. Right now,
there is a good amount of short-covering in the lowest
Accumulation,
Bearish MINCP and gold/silver stocks.
Sometimes, this foreshadows a good rally.
But right now it looks like pre-July-Fourth reducing positions while waiting for
non-seasonal signs of a sustainable trend.
The comments from 6/28/2013 apply still. Especially notice how the
market is going up because of overseas buying. We should note that the correlation
between the Japanese stock market and the US stock market is the lowest
of all the foreign ETFs. This has to be viewed as a warning that just because
Japan's market and economy are improving because of their currency
devaluation, the US stock market is not made more bullish. I would argue
the contrary. Imports are cheaper and exports are harder to sell there.
Instead of buying ETFs right now that may fall back from the overhead selling,
such as we saw today, buy the highest Accumulation stocks breaking out with
confirming Closing Power strength.
Current Peerless Key Values
Date
DJIA
La/MA
AnnRoc P-I P-I
ch P^ ^ IP21
V-I
Opct 65PctChange
7/1/2013
14975 +65 .996 -.111 -41
+165 -41 -.057
-87
+.045 .026
big improvement
----> 192 +50 MAXCP stocks Bullish
MAXCP Stocks (7/1/2013) Bullish plurality
---> 35 -7 MINCP stocks Bearish MINCP Stocks (7/1/2013)
Low Accumulation Stocks 7/1/2013
---> 140 New Highs on NASDAQ 7 new lows. Bullish plurality
---> 98 New Highs on NYSE 6 new
lows. Bullish plurality
7/1//2013 ---> To Key Index and
Leading Stock Charts
5-day
Pct-K Stochastic SPY Chart
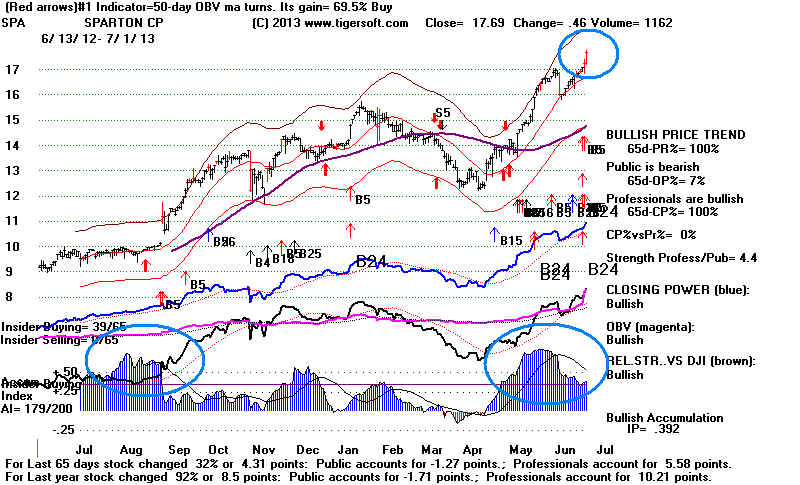
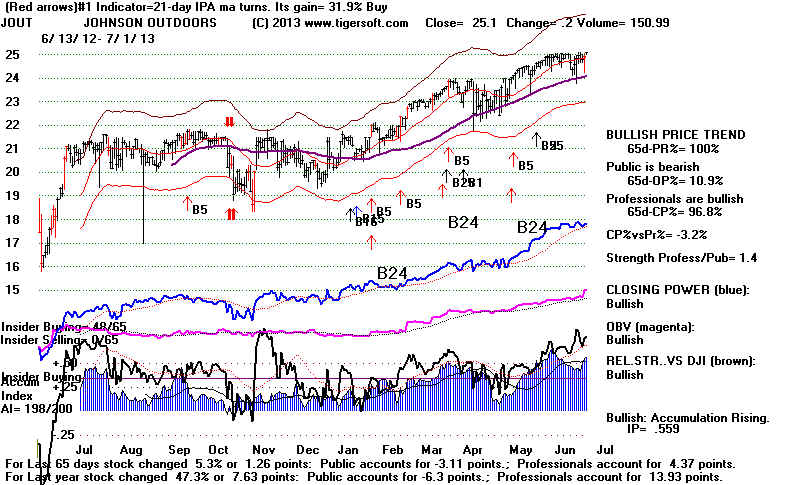
Insider Buying That Should Over-Power
Any Market Weakness
Buy SPA and JOUT.
I want to emphasize tonight the importance of intermediate and longer-
term investors looking for stocks with very intense Accumulation and
Insider Buying. Here we want to find stocks whose IP21 has risen
above not merely +.375 (where the horizontal line crosses in the Tiger charts,
but above +.45 or even +.5. We can buy these stocks on pullbacks when
their Closing Power turns up or when they make new highs on red high volume.
In the past, I have usually said sell these when the Closing Power uptrends are
violated. Instead, I now would recommend just holding them while they
stay above their 65-dma. This gives them ample chance to show why
insiders were so eager to buy them. Stocks that are under Accumulation
often have their best advances a full six months after the initial bulges
of insider buying. So, we have to give these stocks more chance to flower.
Run the Power Ranker against the ACCUMVER data download to get
some good ideas. ACCUMVER is regularly updated to show stocks that
have had significant bulges of Accumulation. See a sample of very high
Accumulation stocks today.
I would put much less faith in stocks under $10 that show high Accumulation
For a variety of possible reasons, the insiders in these stocks are often not as
adept or successful in their buying own stock. The major exception to this
is after a long bear market. Then such lower priced stocks are often the stars
of the show.
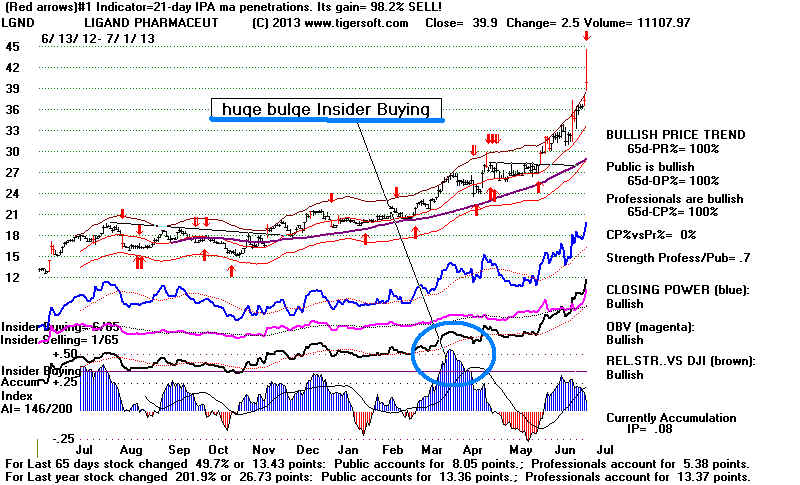
LGND Is An Example
See the article Monday on LGND showing "Insider
Cluster-Buying at LGND"
"A particularly strong insider buying signal is
what we call a "cluster-buy"
where three or more different insiders make open market purchases within a
short period of one another. At Ligand Pharmaceuticals Inc (NASDAQ:LGND),
3 different insiders purchased 2,043 shares at an average price of $17.36/share, for
a total of $35,466, with the most recent purchase on June 28, 2013. "
 .
.
Stocks Now Showing Intense Accumulation
SPA
| nsider Transactions Reported - Last Two Years |
| Date |
Insider |
Shares |
Type |
Transaction |
Value* |
| May 15, 2013 |
KORWIN
STEVEN M.Officer |
1,695 |
Indirect |
Purchase at $14.70 per share. |
24,916 |
| May 13, 2013 |
KORWIN
STEVEN M.Officer |
1,792 |
Indirect |
Purchase at $13.88 per share. |
24,872 |
| May 9, 2013 |
SWARTWOUT
JAMES RDirector |
1,000 |
Direct |
Purchase at $13.65 per share. |
13,650 |
| Mar 27, 2013 |
KUMMETH
CHARLES R.Director |
2,000 |
Direct |
Purchase at $13.34 per share. |
26,680 |
| Feb 20, 2013 |
GRIMM
ROBERT L. IIOfficer |
2,000 |
Direct |
Sale at $14.70 per share. |
29,400 |
| Feb 12, 2013 |
GRIMM
ROBERT L. IIOfficer |
1,000 |
Direct |
Sale at $14.75 per share. |
14,750 |
| Feb 6, 2013 |
SCHLEI
MARKOfficer |
5,300 |
Direct |
Purchase at $14.50 per share. |
76,850 |
| Jan 31, 2013 |
FAST
JAMES DDirector |
1,216 |
Direct |
Option Exercise at $6.52 per
share. |
|
Sparton Corporation, together with its subsidiaries, engages in the concept development,
industrial design, design and manufacturing engineering, production, distribution, and
field service of electromechanical devices. The company?s Medical Device segment is
involved in the contract development, design, production, and fulfillment of medical and
biotech devices, and sub-assemblies primarily for use the diagnostic, therapeutic, and
surgical applications of the medical device and biotech markets.
| % of Shares Held by All Insider and 5% Owners: |
15% |
| % of Shares Held by Institutional & Mutual
Fund Owners: |
54% |
| % of Float Held by Institutional & Mutual
Fund Owners: |
64% |
| Number of Institutions Holding Shares: |
52 |
=====================================================================================
JOUT
Johnson Outdoors Inc., together with its subsidiaries, designs, manufactures, and markets
seasonal outdoor recreation products used primarily for fishing, diving, paddling, hiking,
and camping. The company?s Marine Electronics segment offers battery powered fishing
motors for trolling or primary propulsion; sonar and GPS equipment for fish finding and
navigation; downriggers for controlled-depth fishing; and lake charts.
| nsider Transactions Reported - Last Two Years |
| Date |
Insider |
Shares |
Type |
Transaction |
Value* |
| Feb 28, 2013 |
LANG
EDWARD FDirector |
1,320 |
Direct |
Acquisition (Non Open Market) at
$0 per share. |
N/A |
| Feb 28, 2013 |
LONDON
TERRY EDirector |
1,320 |
Direct |
Acquisition (Non Open Market) at
$0 per share. |
N/A |
| Feb 28, 2013 |
FAHEY
JOHN M JRDirector |
1,000 |
Direct |
Sale at $22.61 per share. |
22,610 |
| Feb 28, 2013 |
PYLE
THOMAS F JRDirector |
1,320 |
Direct |
Acquisition (Non Open Market) at
$0 per share. |
N/A |
| Feb 28, 2013 |
FAHEY
JOHN M JRDirector |
1,320 |
Direct |
Acquisition (Non Open Market) at
$0 per share. |
N/A |
| Feb 28, 2013 |
MCCOLLUM
LEEDirector |
1,320 |
Direct |
Acquisition (Non Open Market) at
$0 per share. |
N/A |
|
|
|
|
|
| % of Shares Held by All Insider and 5% Owners: |
14% |
| % of Shares Held by Institutional & Mutual Fund Owners: |
71% |
| % of Float Held by Institutional & Mutual Fund Owners: |
82% |
| Number of Institutions Holding Shares: |
63 |
|
====================================================================================
OLDER HOTLINES
====================================================================================
6/28/2013 Peerless Sell
S9B All the Key Values are Negative.
A
Trading Range between 14500 and 15000 seems to be developing.
The
5-Day Stochastic-K-Line turned down Friday for DIA, SPY and IWM but not
for QQQ. Nevertheless, the Futures are up +63 at this
writing. We will need
to
see additional gains after the opening to be impressed.
A rally
right before July 4th is likely. Usually, these gains are given back by the 10th
After
that, Julys are a bullish month. The pre-holiday gains
have been quite muted recently.
6/30
7/3 7/10
7/31
2003
8995.44
9070.21 9036.04
9233.80 Rising
Market
2004
10435.40
10282.83
10213.22
10139.71
Slightly
Falling Trading Market
2005
10274.97
10303.44
10449.14
10640.91 Trading Range Market
2006
11150.22
11220.02
11103.55
11185.68
Recovering from May S9.
2007
13408.52 13577.30 13501.70
13211.99
Topping out.
2008
11350.01
11288.54
11229.02
11583.69 A month before big decline started,
2009
8447.00
8280.74
8146.52
9171.61 Bull
market.
2010
9774.02
9686.48 10138.99
10465.94
Trading Range
2011
12414.34
12582.77
12657.20 12143.24 DJI about to fall 16%
2012
12880.09
12943.82 12653.12
13073.01 DJI recovering to new high.
60% up 30% up
80% up.
The technical indicators are mostly weak for the major market. Watch to
see if the indexes can surpass their weakening 65-dma. A failure to do that in
this normally bullish week celebrating American Independence (July 4th)
would be quite bearish.
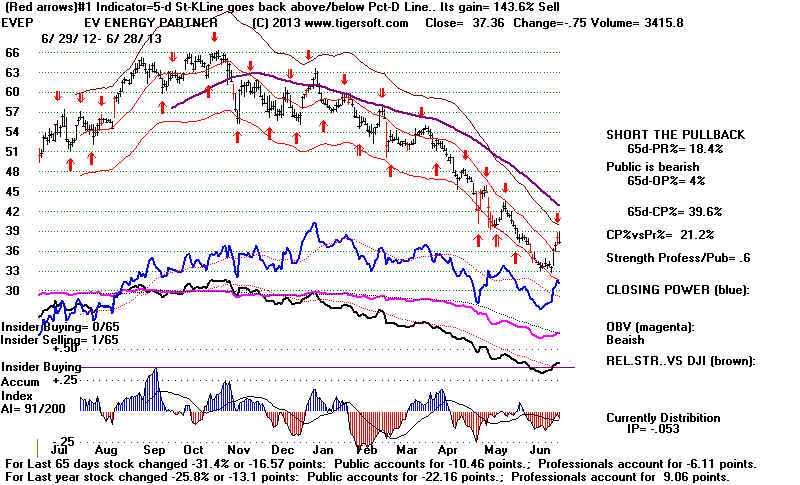
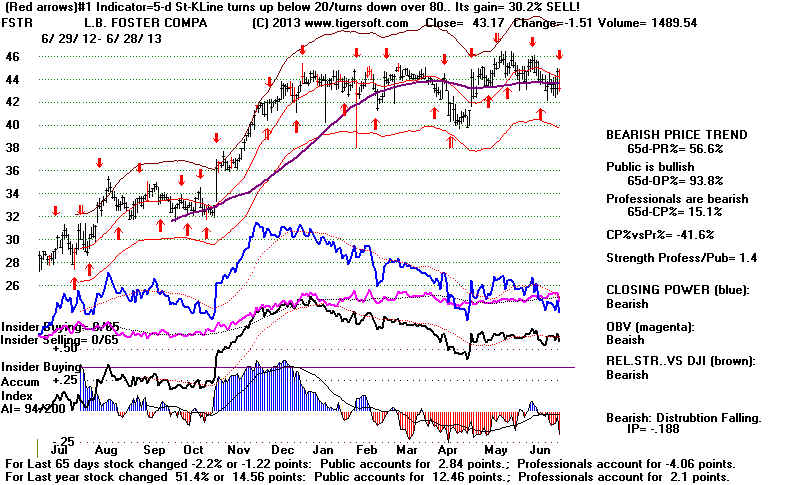
A Trading Range Market Is Most Likely
Usually Sell S9Bs start a trading range. Most likely that is what we are in now.
This is means the 5-day L-Line Stochastics should do well. Run the Power
against the STOCH5 download and short the New Red Sell, Bearish ranked
stocks. Example EVP and FSTR, shown below DJI chart.
But after a 52 month, 133% Bull Marlet
advance, a correction of 10%-15%
should not come as a big surprise, especially if the Fed is no longer guaranteeing
the market that it will not let a decline occur. The risk in any declne,
however,
is that it could get out of control. The US stock market has been stronger
than most other markets. Without the FED prop, there are real risks. And if
the
rich reduce their spending because of a bigger market decline, will not already
weak economic conditions get much worse?
I want to emphasize, however, that the internals of the market now appear vastly
stronger than they did in 1929, 1930, 1937, 1987, 2000 or 2007.
We do not
see an A/D Line that has been lagging for months, negative P-I and V-I
readings for months and multiple Peerless Sells.
The DJI fell back Friday and lost all that it had gained on Thursday. IBM's loss
accounted for about half the decline. The reversal brought a Sell from the (fast)
5-day Stochastic-K-line. It turned down from above 80. This is important
because my research shows this is indicator is overall the best short-term
signal for trading ranges, especially when Peerless is already on a Sell.
The bearish scenario for the Sell S9-B I've mentioned could still play out.
We have to be concerned that interest rates are likely to
keep rising. Though
food commodities are in a downtrend now, Crude Oil shows
lots of blue
Accumulation and could break out over $100/b. A breakout by Crude Oil and
a rally by Gold which is very oversold, would give ammunition
to the three "hawks"
on the Federal Reserve Board who want to bring QE-III to an end.
See http://static.reuters.com/resources/media/global/editorial/interactives/hawks_vs_doves_js/iframe_hawksVSdoves.html
Keep in mind how the DJI dropped 16% after a Sell S9-B
and a completed
head/shoulders pattern in 1971. This is when
Pres. Nixon decided officially to stop
backing Dollars with Gold. For the stock market, this a very big change of policy.
Some called it the "Nixon
Shock". Similarly now, the start of a new Fed set of policies that
bring a halt to its buying massive amounts of long-term debt would have similar sizeable
effects on stocks. So, the DJI's Friday decline keeps alive the potential head and
shoulders pattern there. (See the chart below).
Again Closing Power failed to rise. It is usually bearish when a rally occurs
only because of higher openings, as happened Monday, Tuesday and Wednesday
last week. So, all the key general market ETFs' Closing Powers are in falling
trends. This shows the Public and Overseas Buyers are still optimistic but
Professionals in New York are not.
Our Tiger Stocks' Hotline remains more short than long. And because of the new
Stochastic-K-Line sells, traders should have sold the ETFs I recommended
as long plays for last week's rally. Taking short positions if the opening is
not to weak seems reasonable.
Current Peerless Key Values
Date
DJIA
La/MA AnnRoc P-I
P-I ch P^ ^ IP21 V-I Opct
65PctChange
6/28/2013
14910 -115 ..991
-.328
-206 -26 -206 -.103 -138
-.051 .025
----> 142 +36 MAXCP stocks Bullish
MAXCP Stocks (6/28/2013) Bullish plurality
---> 42 -25 MINCP stocks Bearish MINCP Stocks (6/28/2013)
Bearish plurality
---> 67 New Highs on NASDAQ 19 new lows. Bullish plurality
---> 35 New Highs on NYSE 8 new
lows. Bullish plurality
6/28//2013 ---> To Key Index and
Leading Stock Charts
5-day
Pct-K Stochastic SPY Chart
New Peerless
Later this week, I will be releasing the new Peerless. It's almost done.
It has been extensively back-tested to 1929. Software users will see a new
Sell Signal. And all the signals will have been fine-tuned. Their trading
results will be shown on a different internet page than the one we are using
now. This update is $75 by check. Send check to William Schmidt,
5970 Gullstrand, San Diego 92122 California. I will be posting the new
Peerless on the Elite Stock Professional Page later this week. .
New Red Sells - 5-Day Stochastic-K-Line
 |
 |
=====================================================================================
OLDER HOTLINES
=====================================================================================
6/27/2013
Peerless Sell S9B
Three Straight Excellent Days. What's Up?
Current Peerless Key Values
Date
DJIA
La/MA AnnRoc P-I
P-I ch P^ ^ IP21 V-I Opct
65PctChange
6/27/2013
15024 +114
..998
-.22 -180 +189 -180 -.075 -115
.077 .031
----> 106 MAXCP stocks Bullish
MAXCP Stocks (6/27/2013) Bullish plurality
---> 67 -29 MINCP stocks Bearish MINCP Stocks (6/27/2013)
Bearish plurality
---> 90 New Highs on NASDAQ
19 new lows. Bullish plurality
---> 66 New Highs on NYSE 11 new
lows. Bullish plurality
6/27//2013 ---> To Key Index and
Leading Stock Charts
5-day
Pct-K Stochastic SPY Chart
We've just seen 3 straight
days with the DJI up more than 100 each day and with
the daily ratio of NYSE
advancers to decliners ranging between 3+ to 5+ each day.
This is impressive,
There is new hope because of weak economic news that the Fed
will delay its weaning the
market off of QE-III The yield on Ten-Yr Year Treasuries
has fallen back below 2.5%,
but the blue Closing Power uptrend is in tact.
Earlier this week, I
suggested using the short-term Stochastic-K-line Buys after the DJI
held up at its neckline,
14500, because of these signals' unusual reliability and because one
could make a case for a Buy
B19 on the first day up. It was the presence of an S9
in the previous 15 days which
denied it. But the S9 here was not the very bearish type based
on a phoney DJI rally to the
upper band with the P-Indicator negative, Instead, the most
recent S9 was based on the
P-Indicator finally turning negative after 105 straight days of being
positive.
S9Bs in the past have never
been reversed with a recovery rally that rises far
above the highs of the
previous month. That scenario just has not played out after
a Sell S9b without there
first being a Peerless Buy. Instead, we see THREE other
scanerios after a Sell S9B.
First, there is the bearish scenario where a head/shoulders
develops following the S9B
and the DJI falls significantly. This is what happened in 1971.
A reversal back DOWN tomorrow
would keep alive that possibility.
A continuation of the rally
to the upper band would set up the other tww scenarios.
If no new high is made and
the DJI turns back down near the upper band,
it will look like the 2004 scenario, in which the DJI fell back gradually
for 7 months.
But if the DJI makes a new
high, goes sidewise and then falls back, it will set up a flat
trading range as it did in 1986, which will eventually be broken out of quite
powerfully,
perhaps 6 months from now.
Negative Internals Still
The internals of the market
are still mostly negative and red. Unless breadth remains
as positive as it has been in
each of the last 3 trading days, a rally to the upper band will
almost certainly bring a Sell
S9, S12, S15, any one of which is powerful enough to drop
the DJI back to the lower
band.
The DJI has gotten back
above 15000 very quickly and easily. It is not Professionals
in New York that have
pushed prices up. Rather the gains have been made
at the openings mostly.
This makes the recovery less certain. I would suggest watching
the 5-day
Stochastic-L-Line now in the long trading positions I recommended earlier
this week. As you
can see in the DIA, SPY,
IWM and QQQ, the
K-Line is now above 80. If it
turns down, we will see
new red Sells, which I would trust because of their fine
track record.
Peerless + Stochastic K Buys and Sells
Let me suggest,
super-imposing the Peerless signals and then adding the 5-day
Stochastic K-Line
turning up below 20 (for buys) and turning down
below 80s (for Sells)
to your charts of the NASDAQ, VALUE LINE, SP-500, NYSE,
OEX or DJI-30. The
gains for the last year have been excellent when the two
systems are combined.
Keep in mind, that these red Buys and Sells are not
to be trusted when a
well-tested support has been violated or a well-tested resistance
has been broken.
Bearish MINCPs Make Good Hedges
Meanwhile, except for
the municipal bond shorts we have held for 3 months, the
shorts (coal, Latin
American companies, natural gas, basic materials) are showing
no ability to rally.
Some like WLT just keep falling, as have the
gold and silver stocks.
Clearly, heavy red
Tiger Distribution, a falling blue Closing Power and a declining
65-dma are a powerfully
bearish combination. Selling short some of the bearish
MINCP stocks is a strategy that works in all but
very bullish markets.
A number of readers
have said they like the list of Bullish Leveraged ETFs
I have been posting.
That probably owes to the huge surges in the 3x bearish
gold stocks (DUST) and
Silver (ZSL) this week. This is a mechanical screen
using the Power Ranker
to find the most "bullish" leveraged ETFs. Generally,
I would suggest doing
most of the buying when the optimum trading system is on
a red Buy and the IP21 is above +.25. But because, we can trust the blue
CLosing
Power to break its
uptrend when a move is over, it will also usually work well to
just buy them and hold
them until their Closign Power uptrends are broken.
Most Bullish Leveraged ETFs 6/27/2013
AI/200 IP21
#1 Long UWM 60.55 +1.84 157 .372
At 21-dma and shows Red St-5-Kline Buy
5-dSt-Kline system = + 84.9%
#2 ZSL 114.95 +.15 136
.441 Running
wild and above upper band.
#3 DUST 153.83 -11.87 136 .027 Running wild and
above upper band.
#4 SOXL 46.3 +,.60 137
-.132 Above 65-dma
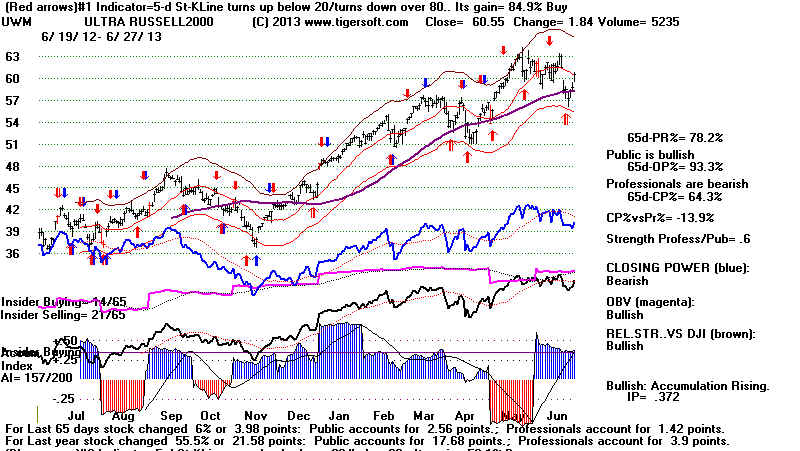 |
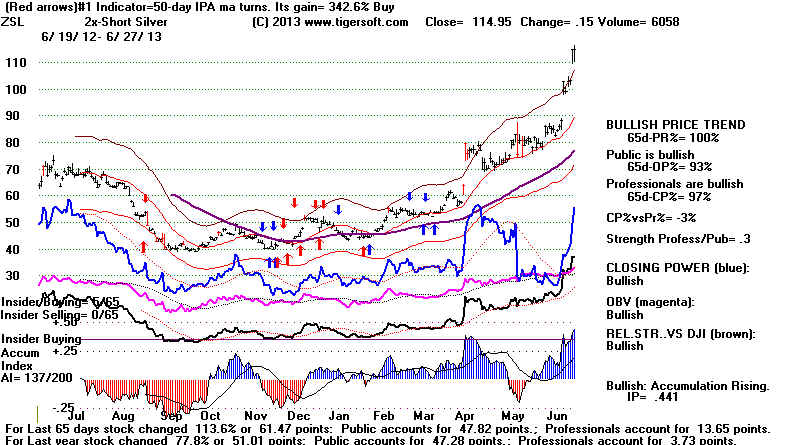 |
=====================================================================================
OLDER HOTLINES
=====================================================================================
6/26/2013
Peerless Sell S9B
The rally is nice but without a Buy signal from Peerless, we still have to be concerned
that there will be a further decline in July. Historically the last 10 days of June
have
brought only 8 bottoms and reversals upwards to the upper band since 1945,
while yielding 23 deeper decline in July.
It is true that when a Democrat has been in the White House since 1945 the year
after a Presidential Election, the June-July decline tendto be shallower than
7% below the previous peak, except in 1977. It is also true that in 3 cases of the 7
June declines, the bottom came before July. But since Obama sounds a lot like the
budget-balancing Carter in 1977, I would distrust these statistics. Of course,
Bernanke is a wild card. And the conservative Republican House majority
further
complicates the picture, .
1945 - Bottom on 7/27 5% below June peak. Big advance
followed. Buy B10/B12
June 13 1949 - Bottom with big advance following. Buy B14/B10
1963 - Bottom on 7/19 4% below May peak.
Buy B11
June 5 1967 - Bottom with 11% advance following. Buy B9
1977 - Bear market,
June 23 1993 - Bottom with 9% advance following. Buy B11
1997 no June pullbacks.
2009 - Bottom on 7/10 7% below June peak. Big advance
followed. Buy B14/B12
"
Current Peerless Key Values
Date
DJIA
La/MA AnnRoc P-I
P-I ch P^ ^ IP21 V-I Opct
65PctChange
6/26/2013
14910 +150
-..989 -.394 -369 +51 -369 -.090 -146
-.002 .031
----> 56 -9 MAXCP stocks Bullish MAXCP Stocks (6/26/2013)
---> 96 -26 MINCP stocks Bearish MINCP Stocks (6/26/2013)
Bearish plurality
---> 38 New Highs on NASDAQ
22 new lows. Bullish plurality
---> 28 New Highs on NYSE 40 new
lows.
Bearish plurality
6/26//2013 ---> To Key Index and
Leading Stock Charts
5-day
Pct-K Stochastic SPY Chart
The internals of the market are still negative, suggesting that any continuation
of the rally that reaches 15500 and the upper band will fail because we will probably
get a new Peerless Sells.
The 14950-15000 resistance has been suggested as a target for this rally
because that would set up a potential head/shoulders pattern like we
saw in 1971 also after a Sell S9b. If the current rally does stall out at
15000, a retest of the neckline at 14500 would become the next
likely target.
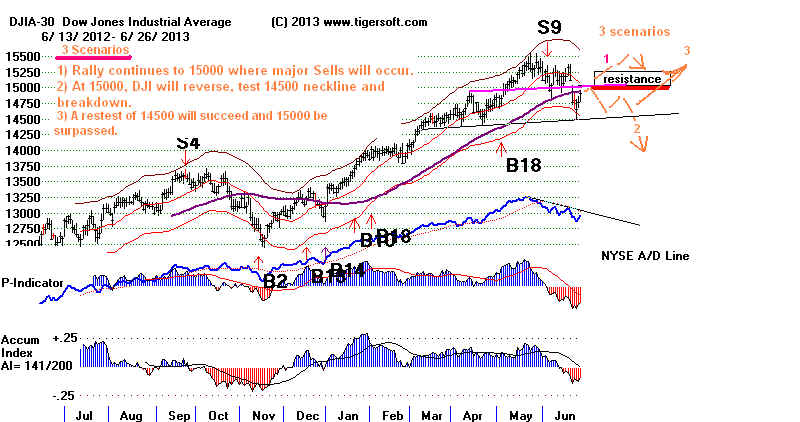
I suggested a brief rally to DJI 15000 was likely because
the DJI was at the lower
band and at a well-tested support level two nights ago when the
normally reliable 5-day Stochastic-KLine turned up. Another point,
on QQQ we saw the occurrence of both a Red
( #1 best system) and a
Blue (#2 best system) automatic Buys. The research I
have done on automatic
Buys suggests that allowing two buy/sell signals, one Red and one Blue,
helps in most cases get bigger gains. (It's easy to change the setting that
controls this with TigerSoft. Use Peercomm + Charts2012/2013 + Run/Setups
+ Set Initial Screen's Signals + 2
in second white area down on the right side
+ Click Save these parameters. )
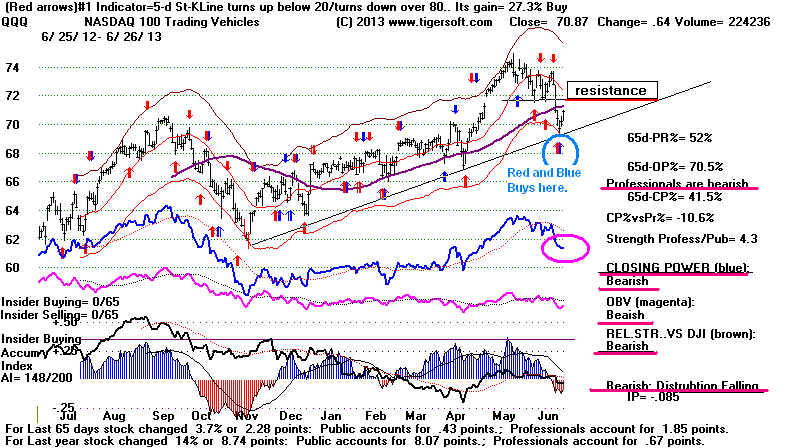
Today brought the second straight day, in which the DJI rose more than
100 points but the Closing Powers for SPY and QQQ have barely risen.
Sustained advances seldom occur on the basis of only higher openings.
Therefore, we have to be concerned the current rally may fizzle. The 5-day
Stochastic-KLine will probably need to rise above 80 and then tyurn down.
As you can see from the SPY's K-Line below, an over-bought condition
above 80 is probably two trading days away.
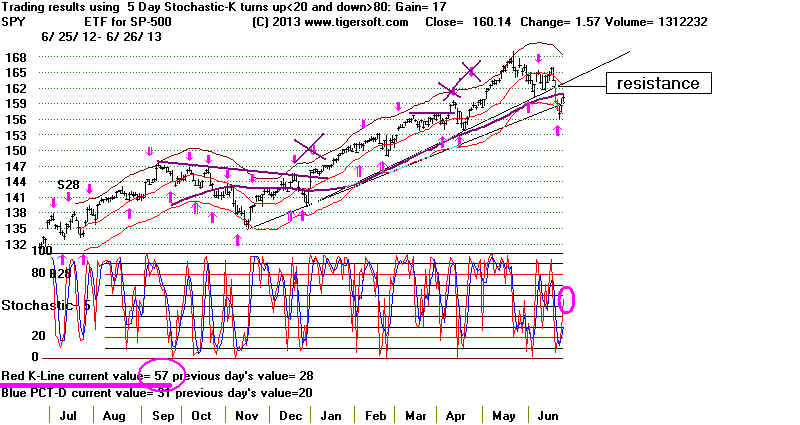
Most Bullish Leveraged ETFs
AI/200 IP21
#1 UWM 58,71 +.51 157 I
.364 Above 65-dma and shows Red St-5-Kline Buy
5-dSt-Kline system = + 79.3%
#2 UCO 29.45 + .12 149
.104 at 65-dma on Red St-5-Kline Buy
5-dSt-Kline system = + 130.1%
#3 SOXL 45.7 +,58 138
-,98 Above 65-dma
#4 ZSL 114.8 +11.56 136
.403 Running wild and above upper band.
#5 DUST 165.7 +24.51 136 -.011
Running wild and above upper band.
June Bottoms
Mid June bottoms can occur, There were 12 cases like this
between June 7th and June 20th,
There were 8 reversals upwards from June 21-June 30. However,
there were
23 cases where the DJI did not bottom until July or later. Below
is a list of the June
bottoms that brought rallies to the upper band and those cases where it did
not.
LA/MA LA/MA
at Bottom on immediate Rally
1 6/24/1930 .846
1.068
6/1/1931 .868
1.130
7/8/1932 .902
95%
rally to August 1932 peak.
6/16/1933 1.002 B5
1.082
6/1/1934 .969
1.049
6/3/1935 .98 B9
1.033
6/4/1936 .996
1.042
6/14/1937
.960 B8 1.045
5/27/1938 .943
1.149
2 6/30/1939 .958
1.06
6/10/1940 .960 earB16 1.06
5/26/1941 .993
1.04
3
6/25/1942 .992
1.042
6/22/1943 .988
1.025
7/26/1945 .977
1.048
7/23/1946 .958
1.018
5/20/1947 .965
1.04 and
much higher.
1948 June was weak all month
6/14/1949
.956 earB14 steadily much higher.
7/13/1950 .924
1.047 and
much higher
4 6/29/1951 .973
1.04 and
much higher
6/16/1953
.972 earB14 1.018
6/9/1954 .983
1.036 and
much higher
5/17/1955 .977
1.048
5/28/1956 .942
1.035
5
6/24/1957 .984
1.022
6/9/1959 .975 B11
1.044
1960 June was weak all month
6 6/26/1961 .982
1.037
7 6/26/1962 .925
1.041
1963 June was weak all month
6/8/1964 .978
1.017
8 6/28/1966 .953
steadily much
higher
6/5/1967 .966
1.037
1968 June was flat.
1969 June was very weak all month
7/7/1970 .965
1.053 and
much higher
1971 June was weak all month
1972 June was weak all month
1973 June was weak all month
1974 June was very weak after the 10th
6/13/1975 .992
1.039
6/7/1976 .974
1.025
1977 June was flat.
7/5/1978 .964
1.055
1979 June was flat.
1981 June was very weak after the 12th
9 6/21/1982
.975 1.026
1983 June was very weak after the 16th
1984 June was flat.
5/20/1988 .972
1.042
10 6/30/1989
.978
1.04 and
higher
11 6/25/1991
.977 1.02
6/18/1992 .972
1.02
1993 June was flat.
12 6/24/1994 .969
1.033
7/15/1996 .95
1.039
and much higher
6/16/1999 .969
1.034
6/22/2000 .981
1.027
2001 June was weak all month.
2002
June was very weak all month.
13
6/27/2003 .989
steadily
up.
7/23/2004 .974
1.039
7/6/2005 .982
1.022
6/13/2007 .964
1.022
2008
June was weak all month.
7/10/2009 .967
up strongly
6/7/2011 .951
B14 1.03
6/4/2012 .961
1.028
|
=====================================================================================
=====================================================================================
OLDER HOTLINES
=====================================================================================
6/25/2013 Peerless Sell
S9B
Interest rates continued to rise, but the DJI rose 100 and there were almost
4 times more up than down on the NYSE. A DJI recovery to 14900 is probably
under way. Bullishly, QQQ has not broken its uptrend
and the biotechs that
have been the leaders there have not conclusively broken down below there necklines.
Anytime the DJI falls to the lower band, without there having been first a completed
had and shoulders pattern or a normal S9, an S12 or S15, the odds favor a recovery.
In our case, I suspect the DJI will have trouble going back above 14950. The
internals
are still quite negative. And if the DJI does turn back down from there, a bearish
head and and shoulders will have started to take shape. In that case, we have the
case of the 1971 top to warn us of that pattern's bearish potential coupled with
a Sell S9B.
Watch the Closing Powers for the DIA and SPY. They did not rise today. The market
opened higher but were unable to move higher. A turning down by these CLosing
Powers will probably mean there will have to be a retest of Monday's lows and the
3.5% lower band.
Our Stocks' Hotline will continue to hold the short sales we have taken in
the Bearish MINCP stocks, but the four ETFs below should be able to eke
out some modest gains in the expected rally to 14900-14950.
The Most Bullish (Power Ranked) ETFs (leveraged and
unleveraged)
with New Red Buys and above 65-dma
Charts at bottom of this page.
#1
FDM AI/200=191 IP21 = .015 New Red 5-day Stoch K-Line Buy.
First
Trust Dow Jones Select Micro
#3
PRFZ AI/200=185 IP21= .198 Yesterday Red Buy 5-day Stoch K-Line
Buy.
PowerShares
FTSE RAFI US 1500 Small-Mid
#4
IWO AI/200=176 IP21= .097 Yesterday Red Buy 5-day Stoch
K-Line Buy.
iShares
Russell 2000 Growth Index
#5
IHF AI/200=171 IP21 = .147 Yesterday Red Buy 5-day Stoch K-Line
Buy.
iShares
Dow Jones US Healthcare Provider
Current Peerless Key Values
Date
DJIA
La/MA AnnRoc P-I
P-I ch P^ ^ IP21 V-I Opct
65PctChange
6/25/2013
14760 +100 -..978
-.427 -420 +104 -420 -.126 -153 -.004 .016
----> 65 +3 MAXCP stocks Bullish
MAXCP Stocks (6/25/2013)
---> 122 -75 MINCP stocks Bearish MINCP Stocks (6/25/2013)
Bearish plurality
---> 44 New Highs on NASDAQ
18 new lows. Bullish plurality
---> 19 New Highs on NYSE 20 new
lows.
Bearish plurality
6/25//2013 ---> To Key Index and
Leading Stock Charts
5-day
Pct-K Stochastic SPY Chart
=====================================================================================
OLDER HOTLINES
=====================================================================================
6/24/2013 Peerless Sell S9B
The DJI has fallen to the 14500 Support
and its Rising 100-day ma. Let's see how broad the rebound is?
The Futures are up nicely this moring. However, without a new Peerless Buy
signal,
the odds favor more of a decline when this rally fails. It's true, tough, that
quite a few
stocks showing bulges of Accumulation have held up well and rose today. They sure
look like they want to go higher. Some may be take-overs. With their numbers
smaller
than before, each will get more money oured into them. So, some of their jumps
could
be quite eye-catching.
I would not cover any of the short sales. The DJI has
rallied only
49% of the time over the 5 trading days following June 24th since 1965. A 10%
decline following the huge rise in interest rates we have just seen would be
consistent with past cases of this happening.
DJI Now and in 1971
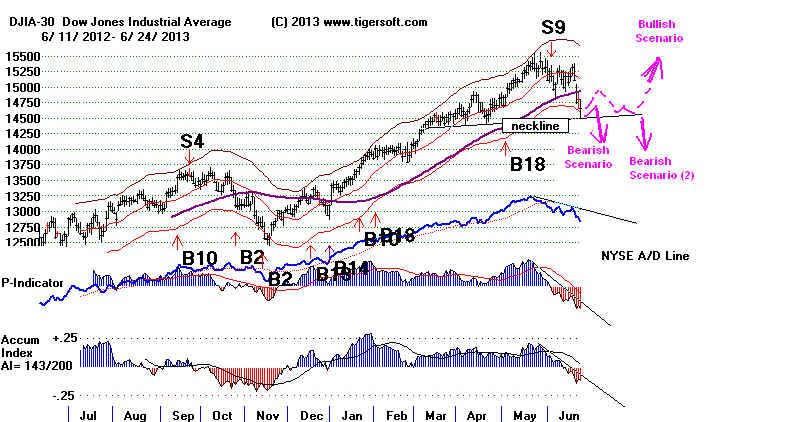
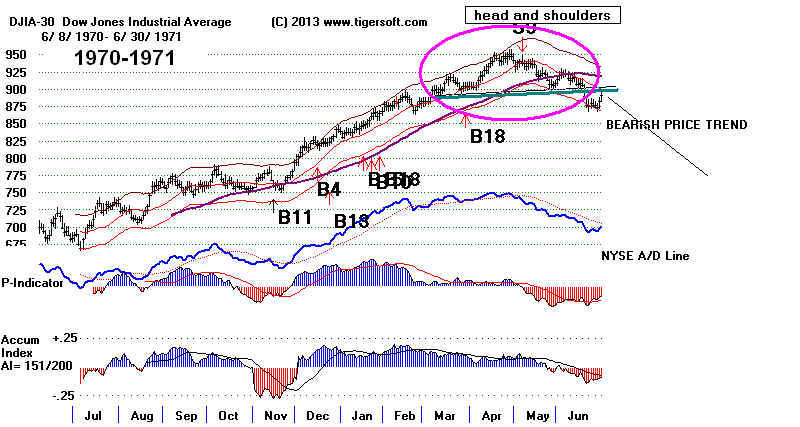
Scenarios
There are now 3 possible scenarios for the DJI. The most probable scenario
would be for the DJI next to recover back up to 14950-15000 and then turn down
again.
This would set up a potential right shoulder in a 4-5 months' wide head and shoulder
pattern. If after this rally, a DJI decline then penetrates its new neckline at
14500,
a minimum downside target at 13750. This would be somewhat like what happened after
the
Sell S9B in 1971.
Another bearish scenario would be for the "turn-around"Tueday rally tomorrow
to quickly fail. In this scernario, the DJI would knife through the 14500 support
later this week. This type of decline often brings a typical 10% DJI decline.
That would
set up a target near 13900. After this, a narrower bull market would resume.
Also possible, would be for the DJI to hesitate just below 15000 around the bullish 4th
of July period and than breakout above 15000 as part of a Summer Rally that would
last until September. This is what bulls should hope for. For this to
happen we will
need to see a marked improvement in the internal strength indicators. The
P-Indicator,
V-Indicator and Accumulation Index are too negative now to make this scenario seem
liekly. Rallies up past a rising 65-dma are bullish provided the P-Indicator and
Accumulation Index are positive. Otherwise, a rally back to 15500 will bring a new
Peerless Sell.
A Narrowing Market Is Normal
It is perfectly normal for different sectors to top out at different times.
But what happens at significant tops is that the number of new lows and the
number of completed head/shoulders patterns in stocks and in sectors
keeps increasing in numbers. Right now we see completed
head/shoulders
tops in BIGBANKS, BIGFIDEL (Fidelity's
biggest positions made into a
Tiger Index, DOW (DJI-30), ETFS
(non - US ETFs), HOME BUILDERS
and UTLITIES. Each is below its neckline and its
65-dma.
AUTOS and FINANCE are
at their 65-dma and TRANSPORTATION
is not yet completed. These groups will have to weaken further to make
a break in the DJI-30 chart's 14500 likely.
Have you noticed how big the declines have been in the weakest groups?
This is normal. This is why their stocks make better, safer short sales than do
stocks from the groups that have held up. The weakest industry groups
are those making new lows. These are also the groups with lots of
representatives
among the BEARISH MINCP stocks: Except
for China, you are by now
familiar with their names: BONDFUNDS, CHINA, COAL, NON-US ETFS,
GOLD, INDMATER, OIL. REIT and UTILITIES.
The sharply higher interest rates explain the weakness in bonds, Reits
and Utilities. Third world countries are being hit especially hard by the
falling prices for the minerals they mine and by the sharply higher interest rates.
GOLD stocks are being hurt by the massive amounts of
gold sold by needy everyday
people, by the decline in the retail Jewlery business and from the threat of
selling by countries like Cyprus,
Italy, Portugal and France. In addition, the threat
of nationalization in
South Africa,
Bolivia,
Peru and Ecuador of gold, silver and platinum
mines is on the rise. France
has recently banned the shipping of gold and silver by mail.
A Taste of Honey
While their Third World economies boomed, because of US outsourcing and
big investments from the US, Europe and China, millions of people there
got a taste of a much better life. Their expectations were raised. Now
with
their economies becoming very weak, they have taken to the streets to protest.
This is very un-nerving to foreign capital and to the big banks there that
US ETFs typically heavily invest in.
Over-Production and Under-Consumption
It is not clear that Wall Street and the big multinationals that make up
the SP-500 can escape this overseas downturn. Just who will buy their
goods? Without an industrial base, the middle class in the US has been
reduced in size dramatically. Maybe, the next few months' economic reports
will show otherwise, but this remains to be seen.
Leveraged ETFs
Traders mat want regularly run the Tiger Power Ranker against the Tiger
data download for Leveraged ETFs, LEVERAGE.
The most Bullish are:
UWM (Russell 2000) Below 65-dma and has bearish hands/above head top pattern),
ZSL (Silver Shirt.) IP21 = .334 and soaring
DUST (Bearish Dold Miniers) IP21 is
-.011.
(Time will not permit these to be posted regularly. Use TigerSoft to see them.
It's easy.(
Conclusion
In this environment, I think we have to expect more of a decline.
Buying some of Bullish MAXCP stocks makes some
sense, I suppose.
Bernanke may try to reinstate QE-III more clearly. But, will he be
believed?
I think we should be a alarmed at how quickly the mere mention of "tapering"
has dropped the markets and we should be very concerned that in an age of
Austerity and without QE-III, we could experience another 1937-like debacle
if the Fed becomes too traditional and sees Inflation as a bigger problem
than Deflation.
Current Peerless
Key Values
Date
DJIA
La/MA AnnRoc P-I
P-I ch P^ ^ IP21 V-I Opct
65PctChange
6/24/2013
14660 -140
-..969 -.499 -524 -85
-524 -.111 -184 -.018 .016
----> 62 -3 MAXCP stocks Bullish
MAXCP Stocks (6/24/2013)
---> 243 +14 MINCP stocks Bearish MINCP Stocks (6/24/2013)
Bearish plurality
---> 23 New Highs on NASDAQ 69
new lows. Bearish
plurality
---> 6 New Highs on NYSE 343 new
lows.
Bearish plurality
6/24//2013 ---> To Key Index and
Leading Stock Charts
5-day Pct-K Stochastic SPY Chart
=====================================================================================
OLDER HOTLINES
=====================================================================================
6/21/2013 Peerless Sell
S9B Stay Mostly Short. There was no Buy B2
Thursday because of how quickly the DJI fell to the lower band last week
and because of the S9.
The DJI is oversold, but will there be a worthwhile bounce? Without a new
Peerless Buy
signal, the answer for intermediate traders is probably "No".
Friday's bounce
was on high volume, due to options' expirations, but the rally was muted and ended
up less than 10% of what it had fallen in the two previous days.
Very quick traders will like the fact that the DJI held up last week at its lower band,
the 5-day Stochastic-Kline has turned up and has a good track record over the last 12
months.
And IF the market recovers, the
SP-500 could on a bounce get back above its rising
65-day ma. But there is a problem and it's very important to undertsand
it.
The best Short-Term Stochastic signals occur when prices are in a trading range.
Last week's break in the well-tested SP-500 uptrendline (shown below) is a warning that
the
SP-500 and the market may be seeing the end of its recent range of prices and
Thursday's low may not hold. Therefore, if you do trade long here, my suggestion
is to sell if this index fails to hold its lows of Thurday on a closing basis.
SP-500
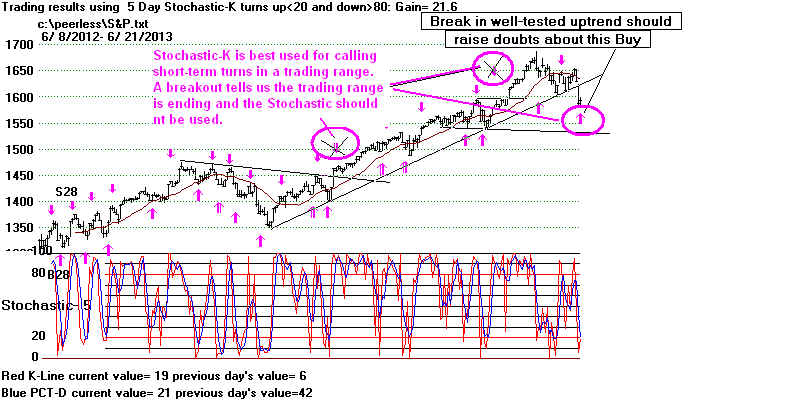
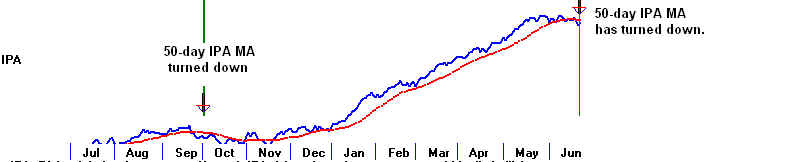 |
The Track Record of Steep Rises in Rates
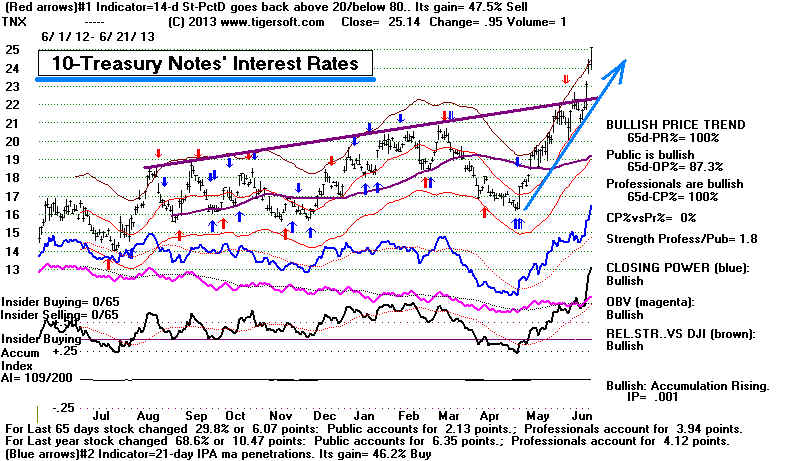
Big and Quick Jumps in Interest Rates
The sudden, very steep rise in interest rates has a distinctly bearish track record.
A 7%-8%
decline, such as we saw last Fall, would hardly come as a surprise. I have mentioned
how sharp rises in Federal Funds' rates spooked the market early in 1994 and how
Greenspan's panic set the stage for the October 1987 33% sell-off in three weeks..
Writing on The
Importance of The Fed to The Stock Market My Blog says:
Big jumps, by 1/2% to the Discount Rate, in one Fed
accouncement are
very likely to bring a 10%+ DJI drop of more, not immediately, but soon
afterwards. This was true in the aftermath of the rate hikes of
8/23/1957, 2/26/1973, 4/25/1974, 4/9/1984,
9/4/1987, 8/16/1994
and 5/16/2000.
The Divergence (Bubble) between the Stock Market Rally
and The Real Economy's Doldrums Remain The Biggest Risk
This divergence can last for a long time. In 1929, it had lasted for, at least,
three years
if we judge from when producer
prices turned down, 12/1/1926. But eventually
the market breaks down. The risk is that a much bigger decline may then follow
because of over-investment and under-consumption.
Weakness in overseas markets and in Main Street America (coal, steel, basic materials)
show real vulnerability in the economy and to the US stock market. Under-Consumption
and Austerity put the stock market at greater rish when stocks start turning down after
a big advance. With the DJI up nearly 9000 points since March 2009, we could be
in big trouble. I keep reminding readers of the 47% Crash of 1937.
Watch The Biotechs and Big Banks
Just as REITs, Utilities and Housing stocks have turned down, so too, may the Big Biotechs
and Big Banks. The neckline for the Big Biotechs is being tested and has not yet
been
closed below on weakness this week. The Big Banks' neckline has been violated
but prices have not closed below the 65-dma. Big Banks are
important to watch.
They best know what the Fed's intentions are.
Big Biotechs Note the short-term Buy. This should be immediately
reversed if the
support-line shown below is violated.
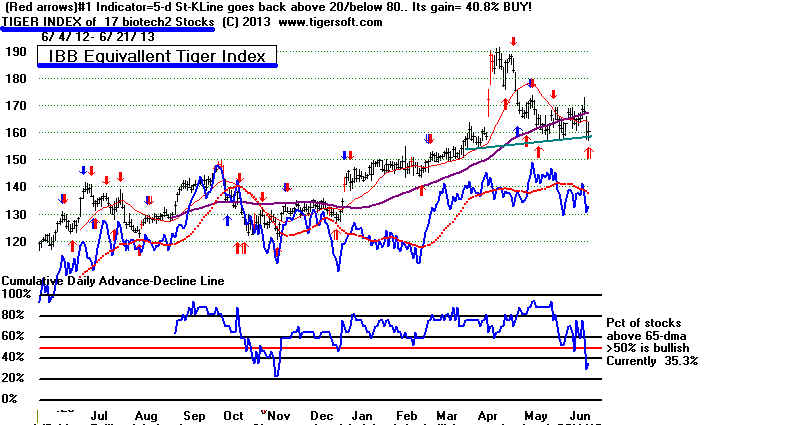 |
Big Banks
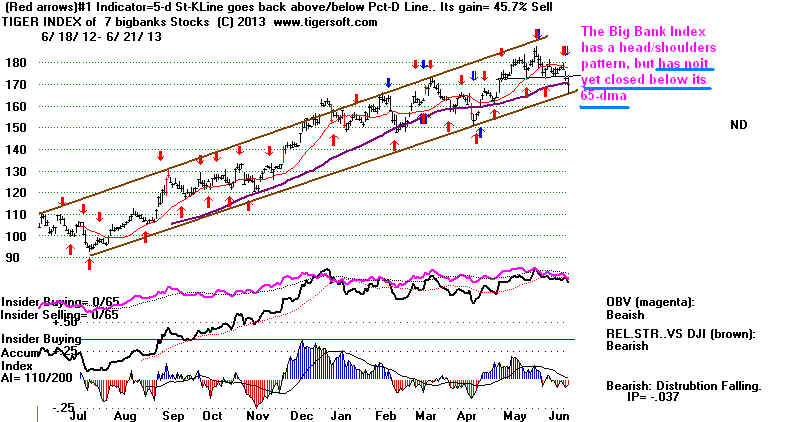 |
Current Peerless Key Values
Date
DJIA
La/MA AnnRoc P-I
P-I ch P^^ IP21 V-I Opct
65PctChange
6/21/2013
14799 +41
-..977 -398 -439 +82
-439 --099 -157 -.009 .019
----> 65 MAXCP stocks Bullish
MAXCP Stocks (6/21/2013)
---> 229 MINCP stocks Bearish MINCP Stocks (6/21/2013)
Bearish plurality
---> 35 New Highs on NASDAQ 35 new
lows.
---> 18 New Highs on NYSE 132 new
lows.
Bearish plurality
6/21//2013 ---> To Key Index and
Leading Stock Charts
5-day Pct-K Stochastic SPY Chart
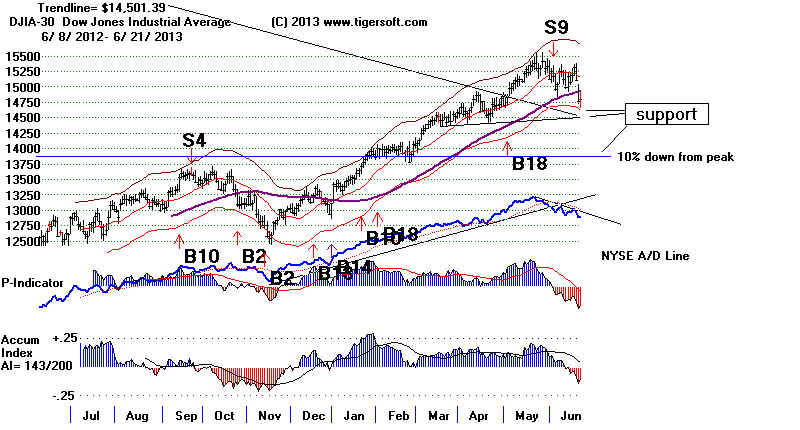
Stochastic-Ks and
Leveraged ETFs
Stochastic-5s now produced 29% of all the best trading systems for leveraged ETFs.
By far the best of these is the 5-day Kline turning up below 20 and turning down above 80
for Buys and Sells, respectively. While chance would suggest this would be the best
system
2% of the time, it was the best timing system for these leveraged ETFs 18.2% of the
time. The second and third best were also based on the K-Line. The Pct-D did
not
produce the ebst system in any of these. Interestingly, 21-day ma of IPA turns was
the
second best system in this group, at 10.6% versus 2% by chance.
New Buys! on Leveraged ETFs Using Stoch-K
URTY 178% Rusell-2000 #1 Power Ranked.
UYM 142% Basic Materials. Caution: Head/Shoulders top is in
place.
TNA 140% Small Cap 3x At rising 65-dma. heavily traded
TQQQ 94% Ultra QQQ just broek 65-dma heavily traded
SAA 86% Ultra Small - at rising 65-dma
Too thin.
MOST BULLISH LEVERAGED ETFS (N= 132)
#1) Ultra MSCI Japan 76.58 EZJ + 5.19 bounced up from rising
149-day ma
#2) Ultra Russell 2000 UWM 58.43 +.13 Stocj-5-Kline turned
up for short-term Buy.
#3) Ultra Semiconductor USD 40.84 +.04 Still above rising
65-d,a but falling CP and IP21<0
#4) 2x Short Silver ZSL 99 -3.99 Fell back from upper band.
#5) 3x Short Gold Miners DUST 123.05 -3.9 Mixed signals: #1 Sell vs #2 Buy.
MOST BEARISH LEVERAGED ETFS
#1) 2x Oil Bull/ S&P Bear FOL 6.48 -.18 volume = only 4!
#2) Ultra Commodity UCD 20.14 -.16 volume = only 14
#3) Silver AGQ 17/93 +.79 volume = 17508
Bounced up from lower band.
=====================================================================================
OLDER HOTLINES
=====================================================================================
6/20/2013
Stay Mostly Short. We Have No Buy B2.
Short-Term Traders, watch the Stochastic-K Line for SPY and QQQ.
A big turn-around today could give a Buy B19.
6/20/2013 Peerless Sell
S9B The DJI has now fallen back to the lower band.
Only a limited recovery is likely without a new Peerless Buy signal. Internals
are very negative. Staying short the weak coal stocks and ETFs
representing
the emerging markets is our Stocks' Hotline plan. Watch the big banks and
biotechs. They did not decisively break down today. That gives hope to
short-term
traders that watch the 5-day Stochastic on the SPY chart and will buy if it turns
up. Only very quick traders should use this approach now. Because the
65-dma is rising and because the QQQ did not break its 65-dma, a brief rebound
should occur. After all, the DJI is down more than 550 in just to days. Only
one
of the five earlier Sell S9Bs brought a DJI decline of more than 7%. But usually
the lower band had to tested more than once.
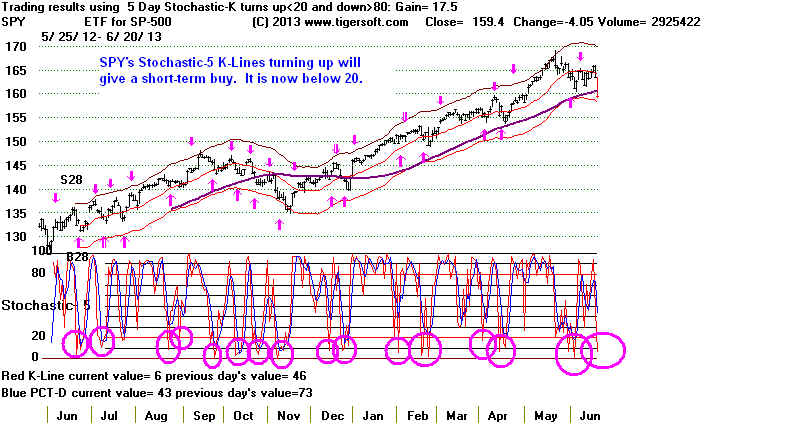
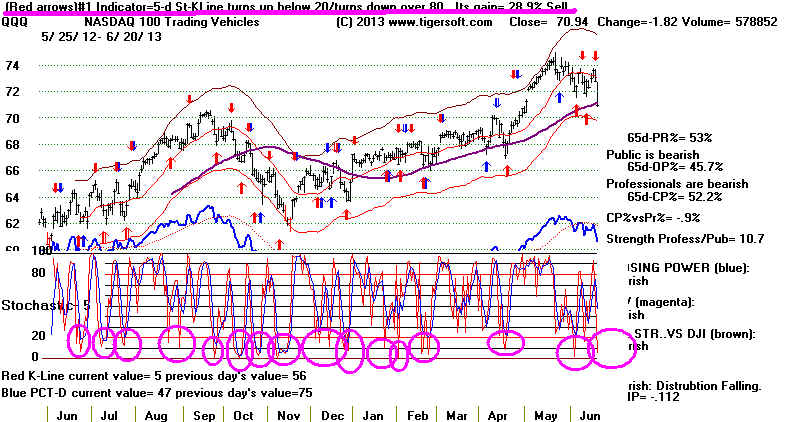
The 2006 version of Peerless would give this drop to the lower band
a Buy B2, provided we judged the market still to be in a strong uptrend.
I think the internals now are too negative to believe in the uptrend.
As I have emphasized, overseas markets are in big trouble. The losses today
in emerging markets prove yo my satisfaction that the head/shoulders
breakdown in non-US ETFs will not quickly reverse technically.
(Suggestion: Run the Power Ranker
against "LEVERAGE" ETFs on the Data Page.
View the most bearish looking of the leveraged 3x bearish ETFs and play
their Closing Power trends after a test of support or resistance or 5-Day
Stochastic-K buy or sell. The Bearish MINCP Stocks tonight offer more
stocks to sell short. Brazil has long been seen as a model of a boming
Democracy. The
protests there are worth reading about to understand the
pent-up
frustrations that are rattling investors in these countries.
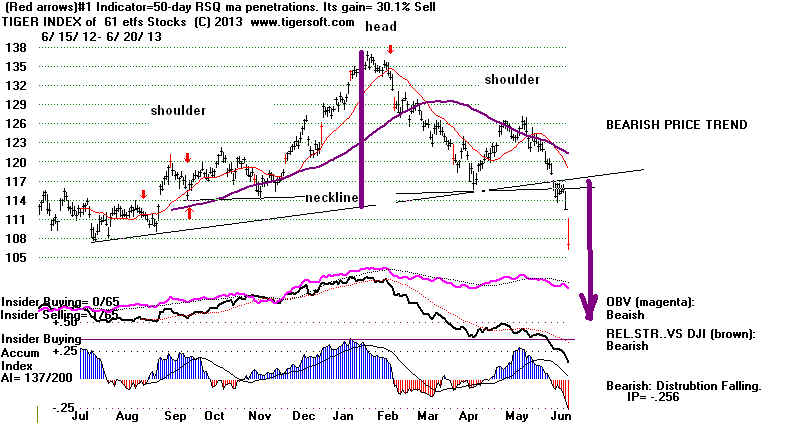
10-Year Rates jumped to another new high. Bernanke may
equivocate, but
these rising rates have spooked the bond markets, housing stocks, REITs
and Utilities. If the big bank stocks break their head/shoulders pattern
decisively and the Tiger Index of them closes below its 65-dma, we will
almost see a much deeper decline in US stocks. If we credit 1/2 of the
gains as owing to Bernank's QE-1, QE-2 and QE-3, then we should retrace
2000 more points by the time the stimulus is gone at the end of next year..
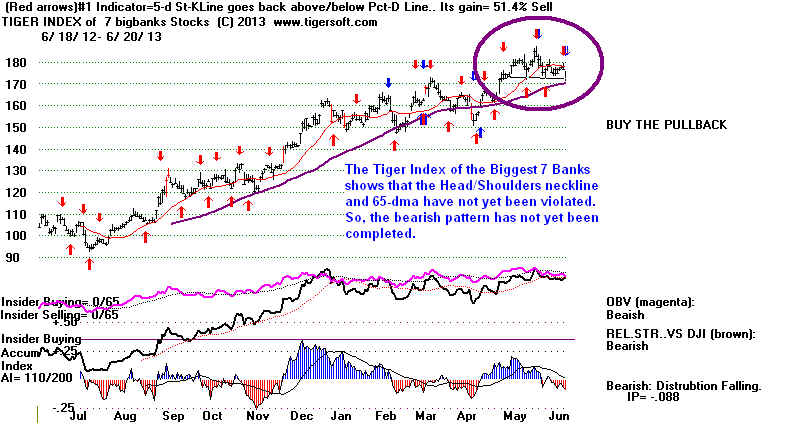
Even biotechs, which have been immune to worries about an economic slow-down,
now show lots of bearish head/shoulders. Further weakness in this sector would pull
out
one of the biggest supports for the NASDAQ, which has not yet decisively
violated its 65-dma. Right now, the FBIOX's Relative Strength Quotient has not
yet confirmed the head/shoulders breakdown.
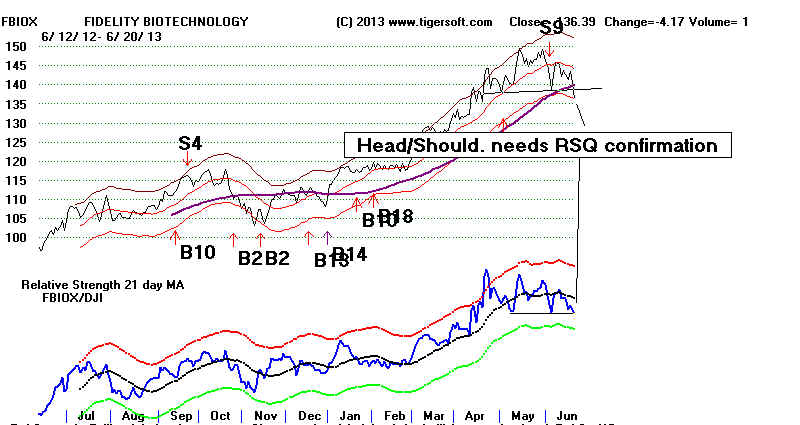
Can We Safely Buy at The Lower Band?
The Sell S9-B and the size of today's decline preclude a Buy B2 with the current
Peerless. These changes were only added to Peerless after studying June
pull-backs
to the lower band for the entire period since 1929.
I think it will help to look at past parallel cases, where the DJI first broke its 65-dma
from May to September following a strong advance for the first 5 months of the year.
My conclusion from this effort is that a big down day
vilation of the 65-dma
reliably brings a bigger decline than merely a retreat to the lower band. In
addition,
our adjusted P-Indicator and IP21 are very low now. While this shows
an oversold status, usually reliable bottoms occur only after a re-test
is made and there is an imporovment in the internals. .
A big down day when the DJI broke the 65-day ma has happened 4 times
before since 1945. In all 4 cases, the DJI fell at least 8% down from the
peak.
Past Cases Where DJI Fell More than 2%
on Day
It Broke below the 65-dma from May to September
after a big rally.
P^^ IP21
Mo/Yr
Outcome
----------------------------------------------------------------------------------------------------------
-185 -.024 June 1950 DJI fell 13.5% from peak H/S
-129 .109 Oct 1989 DJI Fell 8% from peak.
Then recovered back to upper band.
-36 .015 Aug 1997
DJI Fell 8% from peak. Then
recovered back to upper band.
-60 .071 May
2010 DJI Fell 13.5% from peak
If we leave out any other factors, there have been 32 clear DJI May-September
penetrations of the rising 65-dma since 1945 after a strong move up in the first part
of the year. In 16 cases the DJI recovered from the lower band and rose to the
upper band. In one other case, it rallied close to the upper 3%-3.5% band. In
15
cases, any recovery short-lived and the DJI fell to a point, at least 7%, down from
its peak. In 8 instances it fell more than 10%. So, just breaking the 65-dma
at this time is neither bullish or bearish, by itself.
Current Peerless Key Values
Date
DJIA
La/MA AnnRoc P-I
P-I ch P^^
IP21 V-I
Opct 65PctChange
6/20/2013 14759 -354 .972 -.493 -522 -147 -522 -.147 -177
-.187 .02
We need to break the data down to more closely match the current Peerless
key values.
Listed below are the 6 cases since 1945 where the DJI broke the 65-day ma
after a big rally in the first quarter 4-5 months of the year with an adjusted
P-I (PI^^) below -160 and Accumulation Index below -.10. Only in 1946,
when there a classic head/shoulders, did the DJI fall significantly below
the lower band. In 5 of 6 cases the DJI rallied from the lower
band to the upper
band. It should be noted that in 3 of these cases, a bear market was soon
to start. The problem here with being bullish is that the P-Indicator now
stands at an adjusted -522. This is far below the lowest level when the
IP21 was below -.10 on the break inthe 65-dma.
P^^ IP21 Mo/Yr
Outcome
----------------------------------------------------------------------------------------------------------
-454
-.124 June 1946 DJI fell 23% from peak. H/S
-
-299
-.108 Sept 1961 DJI recovered back almost
to upper band. But bear mkt followed in 6 mo.
-245
-.183 June 1964 Recovered back to upper band.
-401
-.137 May 1987 DJI fell to lower band and recovered
back above upper band.
bear mkt followed in 3 mo.
-451
-.111 June 1998 DJI recovered from lower
band back to upper band.
Bear mkt followed in 3 mo.
-168
-.119 July 2009 Recovered back above upper band. -168 -.119
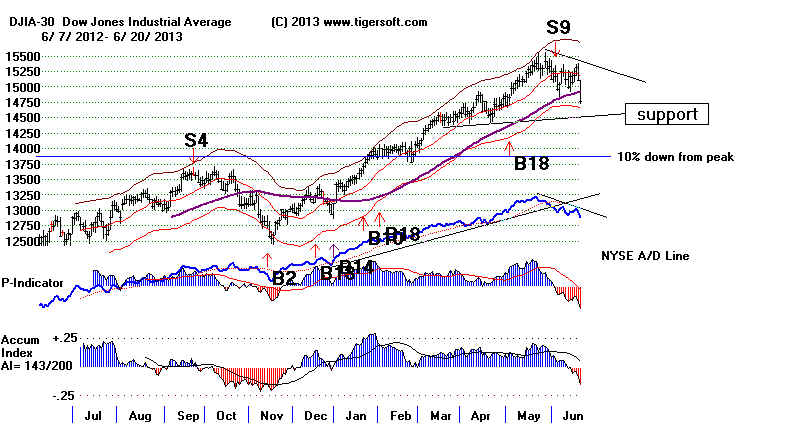
----> 44 MAXCP stocks Bullish
MAXCP Stocks (6/20/2013) Bullish plurality
---> 226 MINCP stocks Bearish MINCP Stocks (6/20/2013)
---> 11 New Highs on NASDAQ 19 new
lows. Bullish plurality
---> 5 New Highs on NYSE 286 new
lows.
Bearish plurality
6'20//2013 ---> To Key Index and
Leading Stock Charts
5-day Pct-K Stochastic SPY Chart
=====================================================================================
OLDER HOTLINES.
=====================================================================================
6/19/2013 Peerless Sell
S9B The DJI is headed lower. The lower band
at 14700 would seem to be the minimum target. There is also good support at
14300. But a typical 10% intermediate-term correction would take the DJI down
to 13900. The necklines of the Big Banks' and
Big Biotechs' Head/Shoulders
pattern may act as support. We want to watch these leading groups to see if they
falter.
Current Peerless Key Values
Date
DJIA
La/MA AnnRoc P-I
P-I ch P^^
IP21 V-I
Opct 65PctChange
6/19/2013
15112 -206 .994 -.175 -375
-123 -375 -.091 -131 -.075
.043
----> 114 MAXCP stocks Bullish
MAXCP Stocks (6/19/2013) Bullish plurality
---> 107 MINCP stocks Bearish MINCP Stocks (6/19/2013)
---> 37 New Highs on NASDAQ 22 new
lows. Bullish plurality
---> 27 New Highs on NYSE 63 new
lows.
Bearish plurality
6/17//2013 ---> To Key Index and
Leading Stock Charts
5-day Pct-K Stochastic SPY Chart
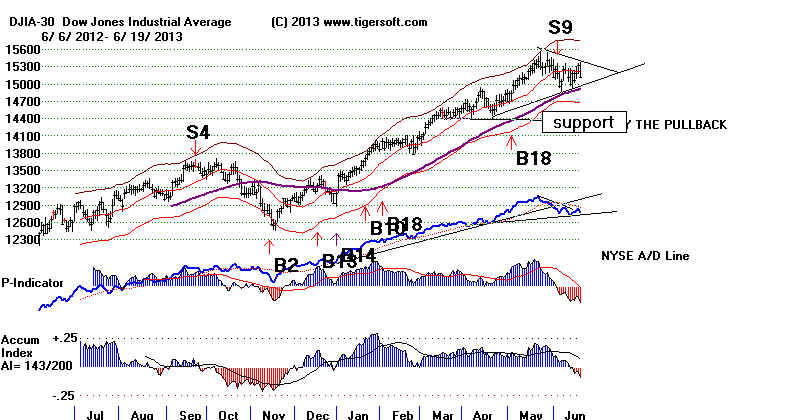
Rising interest rates
have killed many a rally. It is necessary to
do some selling of long stocks and add some more shorts. Our Stocks' Hotline
has sold about 2/3 the long positions, so that we are short more stocks than
we are long. Coal stocks continue to look miserable and heavily
populate the Bearish MINCPs. The Obama Administration will soon
announce new and higher CO2 emmssion standards.
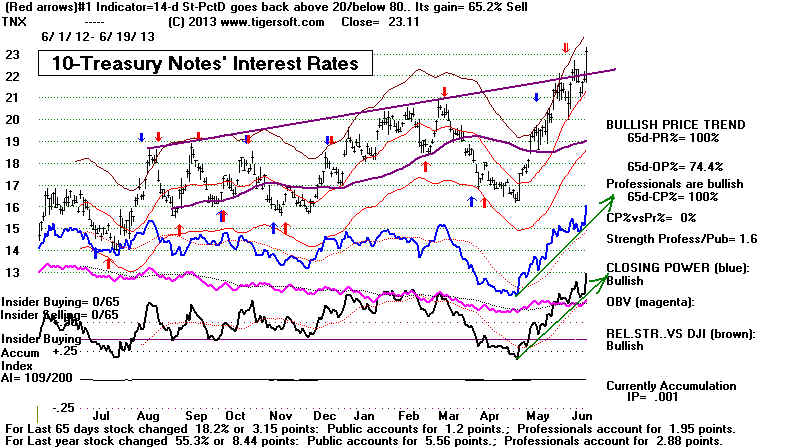
Bernanke Has Tried To Lift The Economy. That is
asking too much when Austerity is the main Fiscal Policy in the US
and Overseas,
Bernanke has given up. That's my reading, at least. He will not be
re-appointed.
The opposition to his policies has grown within the Fed. Most observers agree
that his policies have boosted Wall Street and made the rich much richer, but
have done little to bring a speedy recovery in Main Street. 6.5% unemployment,
he forecasts, will be reached late next year. Maybe, but maybe not.
Bernanke has changed his tune. That is disconcerting. He can no longer
straightforwardly simply declare that QE-III and low rates will last
until official Unemployment is 6.5%. That is a "target" now, not a
promise.
Now we are told that future inflation (meaning a stock market bubble) is a real
danger.
Today 10-Year Rates jumped to a new 12 month high. Wall Street's recovery
since October 2010 is as much a result of a cheap, unconditional supply of Fed money
to big banks who used it to trade stocks aggressively using lots of leverage, as it
stems from a solid economic recovery and a sustainable growth in profits.
Wealth is more unevenly distributed than it was in 2007-2008 or 1929. Just
who will be the buyers of all the goods and services offered? Deflation will
get worse in America and Europe.
So, cheap money is in doubt. It will be reduced and could be withdrawn at any time.
A month ago, Bernanke's words created confidence. Now they do not.
The bearish effects on overseas' markets of higher interest rates has been
predictably bearish and immediate.
When Wall Street Catches A Cold,
Emerging Markets Get Pneumonia
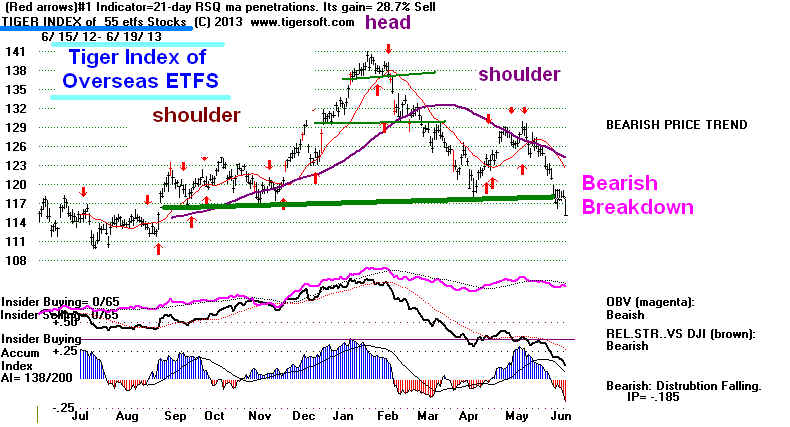
The Overseas Markets broke their key support today. Emerging markets, especially
in Latin America are in financial trouble. This is partly a result of the collapse
in gold
and silver prices, partly a result of the failures of a number of banks and partly a
result
of
mass protests against inflation and cuts in social services. And now high
interest
rates wll compound all these bearish factors.
Mexico's country fund (MXF) shows a head/shoulers pattern, Sell S7 warnings and
a Closing Power that is making new lows ahead of price. It should be shorted.
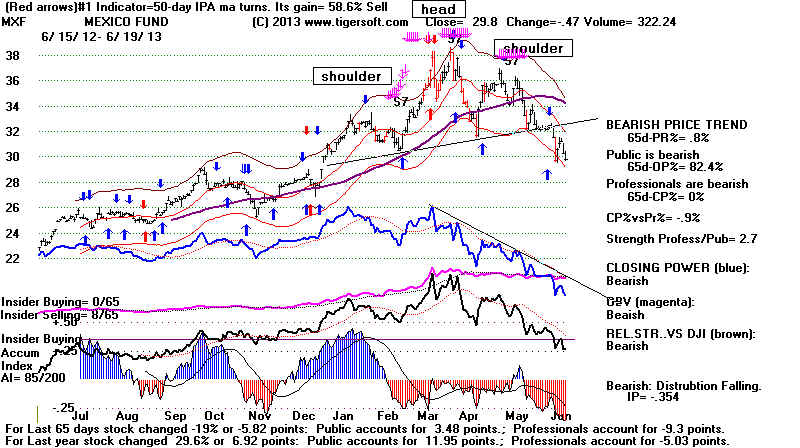
http://goldsilver.com/article/mass-protests-due-to-heavy-currency-printing-future-prophesy-for-gold/
EWZ,
the country fund for Brazil is down the most (19%) of any country fund this
year.
RSX (Russia) and FXI (China) are down 17%. ILF (Latin America) and IIF
(India)
are
down 16%
Braxil's
Ibovespa has falled 24% since January 3rd. Inflation soared in Latin America’s
biggest economy even as growth sputtered. Consumer prices jumped 6.5 percent in the
12 months through May, reaching the upper end of the country’s target range and
prompting
the central bank to raise benchmark interest rates from a record-low 7.25 percent.
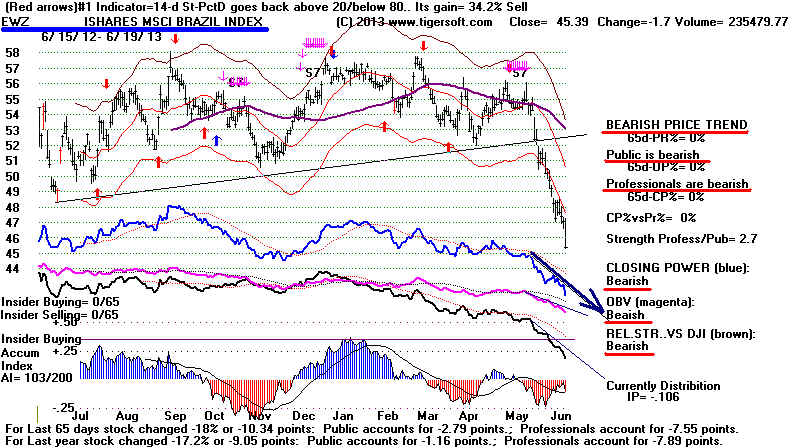
The 3x leveraged short ETFs for Brazil (BRZS), Emerging Markets (EDZ)
and FXP (China) could each be shorted. So could new Latin American country funds
listed below. But they are very thinly traded. It might be better just to sell
short ILF,
the non-leveraged ETF for Latin America's 40 biggest stocks or sell short the
ADRs in two of Brazil's most heavily distributed stocks with falling Clowing Power:
Bank Bradesco ADR (BBD) and Ecopetrol S.A ADR (EC)
ILF - Latin America
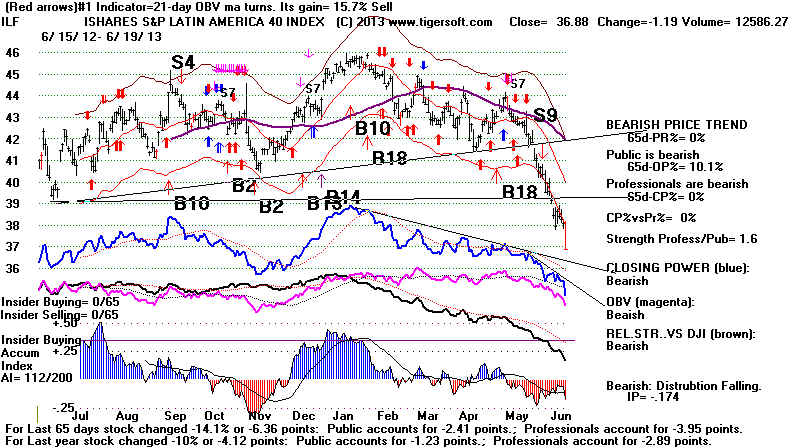 |
Bank Bradesco ADR (BBD)
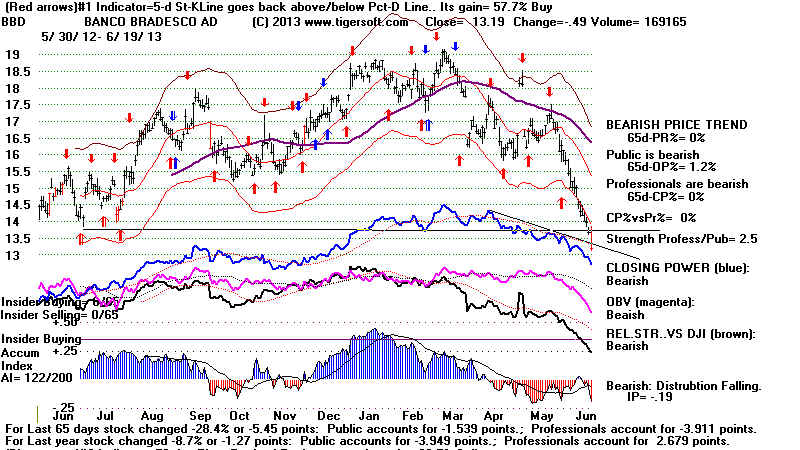 |
Ecopetrol S.A ADR (EC)
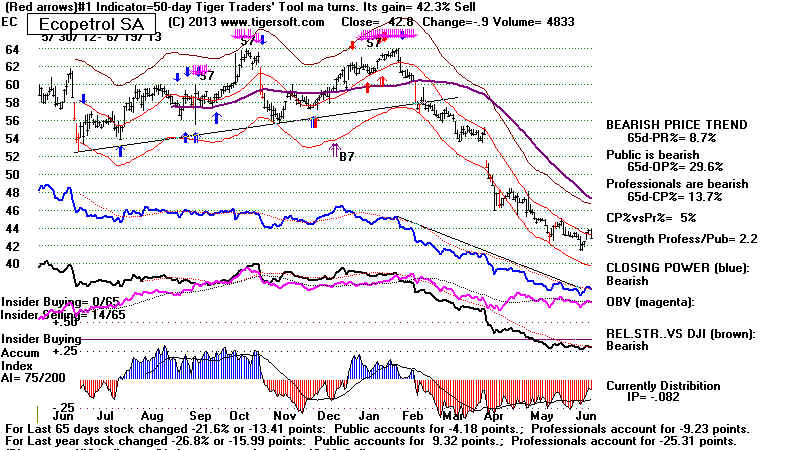 |
Thinly Traded South American Country Funds
Ticker
=====================================================================================
OLDER HOTLINES
=====================================================================================
6/18/2013 Note there have been
corrections made to the section, "The Best
of the Best" in last night's discussion of the efficiacy of (Fast) 5-Day
Stochastic
turning up below 20, turning down above 80 or crossing the (Slow) 5-d Pct.D line.
(What we need is an equivalent system for timing exits in trending stocks. At
present, I cannot report on any one system working best for this purpose.)
Peerless Sell S9B A
rebound to 15500-15700 would be in keeping with what
happened on the first rebound
after the signal in 3 of the 5 past cases. But the
Tiger Index for Non-US
Markets' Is Still Threatening A Serious Breakdown.
Look for Much More Volatility: Up and Down.
By creating 3x leveraged
ETFs, Wall Street has provided bears the shorting tools
and leverage needed to
destroy whole industries and currencies. Now they are
magnifying the bears' ability
to destroy financially the biggest country in South America.
Exactly, the same dangers
that were inherent in the creation of credit default swaps
are now becoming evident in
the 3x leveraged short ETFs, which can be margined
as day trades with 12x
leverage! Just like criminals should not be
allowed to buy insurance
on someone's house or life,
why should we shorts be allowed to use leverage to destroy
a whole industry or country? As a result of these leveraged short ETFs, volatility
is being greatly increased.
Wall Street may like bigger trends, bigger cycles, bigger booms
and bigger busts, but this is
exactly what the rest of the world does not need.
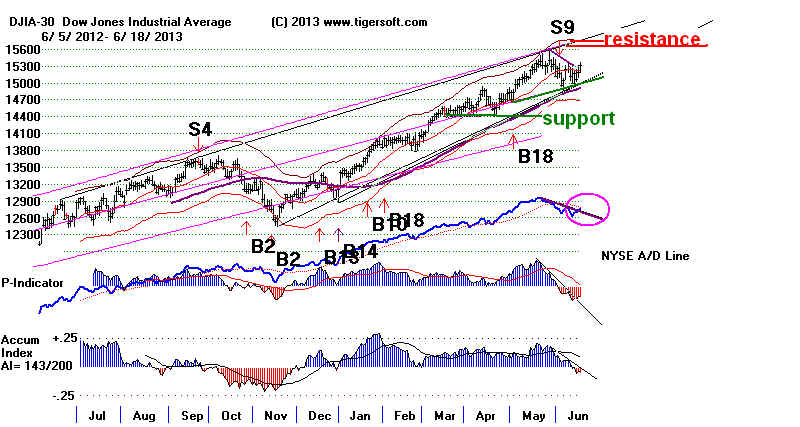
Current Peerless Key Values
Date
DJIA
La/MA AnnRoc P-I
P-I ch P^^
IP21 V-I
Opct 65PctChange
6/18/2013
15318 +138 1.007 -.028 -253 -13
-253 -.048 -97 -.073
.052
----> 222 MAXCP stocks Bullish
MAXCP Stocks (6/18/2013) Bullish
plurality
---> 49 MINCP stocks Bearish MINCP Stocks (6/18/2013)
---> 118 New Highs on NASDAQ 11 new
lows. Bullish plurality
---> 107 New Highs on NYSE 25 new
lows.
6/17//2013 ---> To Key Index and
Leading Stock Charts
5-day Pct-K Stochastic SPY Chart
Again the DJI opened up much higher and moved up still more at the
close.
The Closing Power for the DIA, SPY and QQQ broke their downtrend-lines.
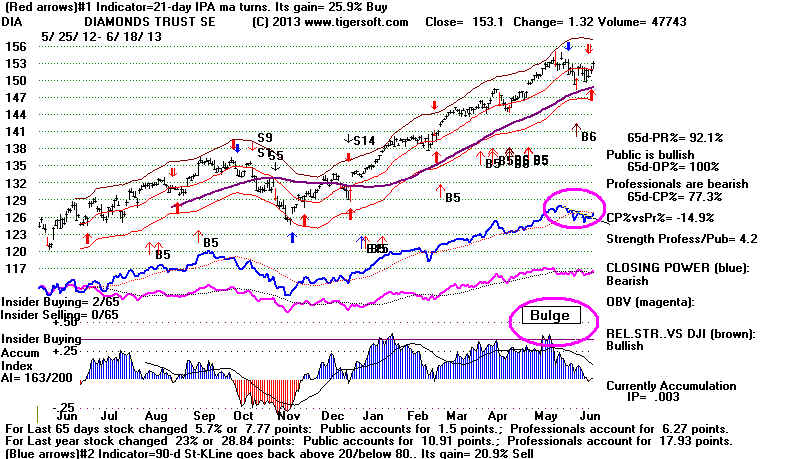
Given the bulge of Accumulation in May, this has to be construed bullishly by
traders. This was the second day in a row that NYSE advancers surpassed 2000.
Barring a bad surprise from the FED's Open Market Committee, the DJI seems
bound to make a run to 15500 and probably reach the upper 2.5%-3.5% band
zone of resistance.
If you look at three of the five earlier S9-B cases shown below, you will see
this type of rebound and a nominal new high has ample precedent. The DJI charts
of 1943 and 1986 below look similar to ours now.
I've mentioned, it's been hard find to good short sales and easy to find bullish
MAXCP stocks breaking out with very high Accumulation and Closing Power
strength. Momentum is definitely supporting the odds of high prices, too.
The breakout on high Accumulation by Crude Oil often helps
the DJI, too, because
it boosts high price CVX and XOM
in the DJI. Meanwhile, mining stocks
have turned down again. I think we can interpret their weakness to be
a sign that investors' confidence in the stock market is still high. Usually
rallies by gold stocks are a warning that a significant market top is coming.
That is certainly not true now.
The Global Economy
The biggest risk to the market now is the fragile global economy.
Despite the DJI gain, foreign ETFs as a whole are on the verge of
completing a bearish head/shoulders pattern. Clearly, there is a segment
on Wall Street that is hoping for a global economic meltdown and
they are creating the tools to bring such an event still closer. No
Federal regulator stands in the way. So, we have to stay on guard.
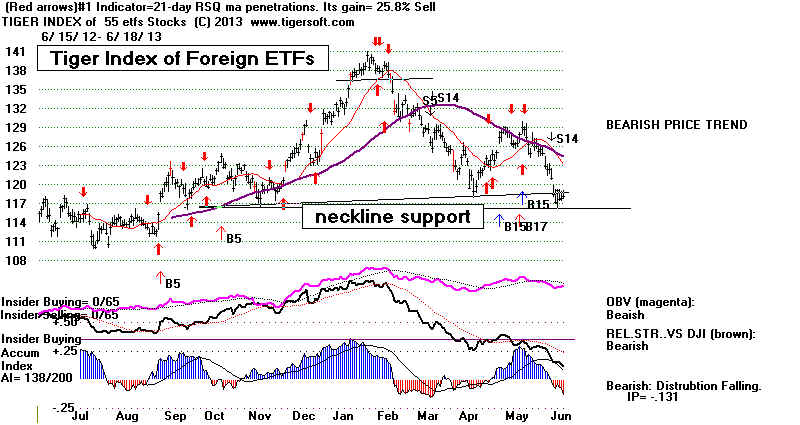
WALL STREET IS GETTING EVEN MORE MEAN AND RECKLESS
The Tail Can Wag The Dog:
Keep An Eye Out for New Leveraged Short ETFs
Wall Street is getting especially mean and dangerous again.
Without any real controls or regulations, their leveraged short ETFs
are running wild. These have no redeeming social value, yet they
are permitted to destroy whole industries (mining, for example) and
and now would destroy a whole country's finances.
The trading behavior of Professionals is very helpful to us in
predicting market sell-offs. Closing Power bearish divergences
and then CP uptrend-breaks I have emphasized. But there's
another approach we can use. We can note the creation of
new leveraged short ETFs. These are very handy to professionals
who want to sell short aggressively. A few months before the Crash
began for the market in 2007-2008, Wall Street created highly
leveraged vehicles to buy that were shorts on the overall market.
Wall Street did the same thing with mining stocks 3 months before
the major top in Silver at $48. The 3x leveraged short ETF DUST
started trading in January 2011.
The timing of the creation of the leveraged short ETFs and the
underlying entity collapsing is probably not so important, as is
the simple existence of these leveraged short ETFs. They are an
open invitation for a bear raid. The Japanese Yen's recent sell-off
meant big profits for someone looking at the classic bullish breakout
in YCS in December.
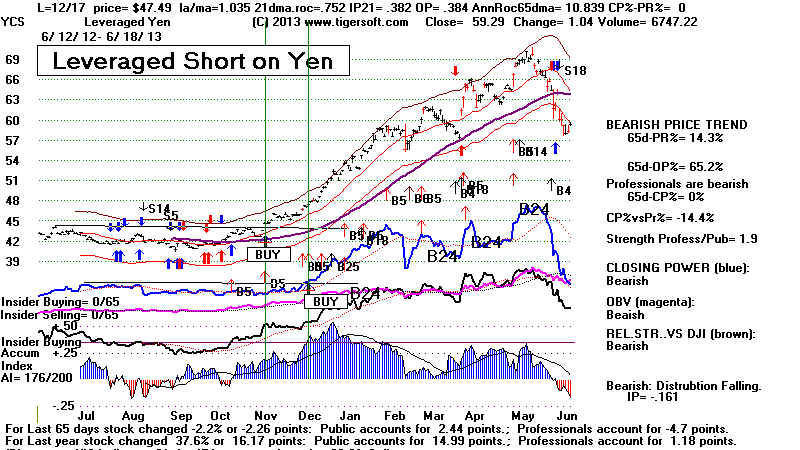
The most recently created bearish ETF is BRZS, the 3x Bearish Brazil ETF.
In it, Direxion has declared its own financial war on the largest country
in South America. This type of speculation cannot help but end
badly. For more information on these funds see www.direxionfunds.com
Rafferty
Asset Management regularly has to close some of the Direcion Funds
for
want of interest.
Unfortunately, the vehicles they create exaggerate
trends, cycles, booms and busts. This is exactly what the world does
not need.
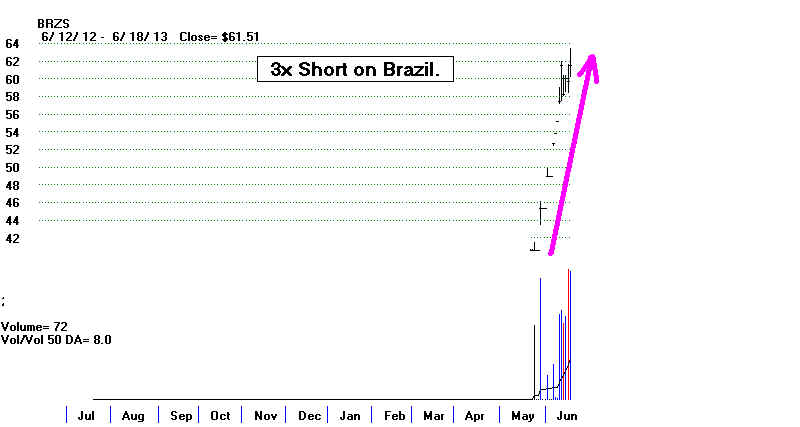 |
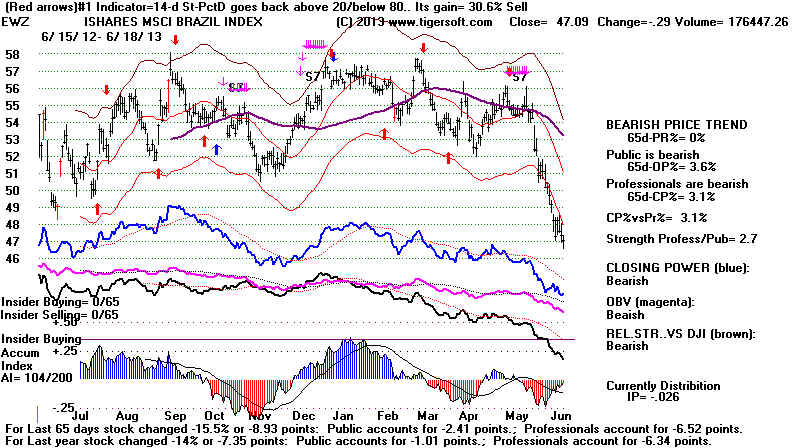 |
DJI Sell S9B Rebounds
To The Upper Band
before A Further Decline
====================================================================================
OLDER HOTLINES
===================================================================================
6/17/2013
The DJI jumped up more than 100 at the opening today as traders showed
that they fully expect the FED not to do much "tapering" off QE-III at their
June
Open Market meeting. In 3 of the 5 earlier Peerless Sell S9B
signals, the
DJI was able to recover from its imitial stumble and reach the 2% upper band
before falling again to a point nearer the lower band than we have so far
seen.
Current Peerless Key Values
Date
DJIA
La/MA AnnRoc P-I
P-I ch P^^
IP21 V-I
Opct 65PctChange
6/17/2013
15180 +110 .997 -.042 -241
-80 -241 -.041 -90 -.059
.042
----> 155 MAXCP stocks Bullish
MAXCP Stocks (6/17/2013) Bullish
plurality
---> 45 MINCP stocks
Bearish MINCP Stocks (6/17/2013)
---> 64 New Highs on NASDAQ 12 new
lows. Bullish plurality
---> 63 New Highs on NYSE 9 new
lows.
6/17//2013 ---> To Key Index and
Leading Stock Charts
5-day Pct-K Stochastic SPY Chart
There are many more Bullish MAXCP Stocks than Bearish
MINCP
Stocks.
This means that professional Gunslingers,
the high performance
funds, are still buying the high Accumulation, flat-topped breakouts. It also
means we have only a few stocks to short, except the beaten-down coal stocks
whose companies must now turn more and more to exports because of CO2 emission
standards
and competition from low priced natural gas. The muncipal bonds
may turn weak again, but I would wait to see if they won't rally some more
before re-shorting them.
Another failed rally to the DJI'a 21-day ma would strongly suggest mounting
instututional and professional distribution. The Closing Powers are
still declining, as is the A/D Line. But if the announcement from the Fed on QE-III
this week shows that they are clearly backing off from "tapering" any time
soon, then I would expect the market to run up to the upper band. Lastly, if
they fail to clarify their intentions, then I would think we will see a retreat to
the lower band very quickly. The market does not like uncertainty. Tonight
Obama
said that Bernanke wants to leave his post as Fed Chairman. That
cannot be something the market wants to hear.
The key internals of the DJI are mostly negative. So perhaps, the Fed will
disappoint. The big banks stocks are in a holding pattern, thus failing to
give us clues about what the Fed will do. We have to wait. Meanwhile,
our Stocks' Hotline is long a number of Bullish MINCP stocks and Crude
Oil and short a handful of Bearish MINCP stocks, KOL and UNG.
New Research on the Tiger Optimum Trading Systems' Arrows
In a blink, your computer calculates the best trading system for the stock
you are displaying with TigerSoft. The red arrows show the buy and sells
from the best trading system out of more than 50 the Tiger programs
test. New research shows that we probably should be display
the two
top trading systems' Buys and Sells, not just only the best. Taken together
they are apt to improve the trading results. The paper losses may even
be less when both Red and Blue arrowed signals are taken.
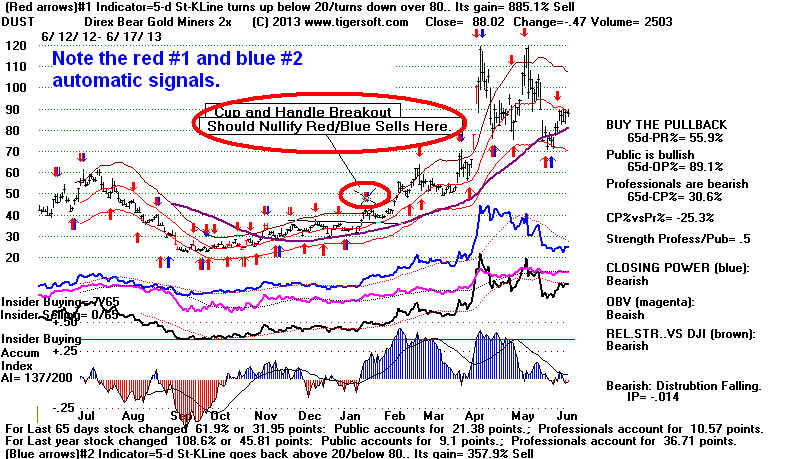
Of course, these signals are meant to be used in conjunction with Peerless,
internal strength indicators and important chart patterns. If one blindly followed
the automatic red Buys and Sells, it would eventually be quite profitable,
but there could be a number of paper losses before the signals caught
a really big move.
The
"Best of The Best"
Seven years or eight ago I mentioned that the 5-day Stochastics' Buys
and Sells were 2.5-3 times more likely to be the basis of the best trading
system's red Buys and Sells than pure chance would dictate.
New research here shows that was generally true for 1990, 1991, 1992, 1993,
1994, 2004, 2005, 2006, 2007, 2011, 2012 and 2012-2013.
2008 was the worst year by far for the Stochastic-5 systems. But as a whole,
even then, they occurred as often a chance would have suggested for a
large sample of mostly SP-500 stocks. Their record with SPY since 1994
I will present later this week. The Stochastic-5 Systems were not so
effective with SPY.
But now I would add that 3 specific 5-day Stochastic systems are
clearly the "best of the best" trading systems. These are:
1) The 5-day Stochastic K-Line turning up below
20 for a Buy and
turning down below 80 for a Sell. This was the best trading system
7.4% of the time. (Chance would yield only 2%) This was the
best system in more than 10% of the stocks sampled in 1993,
2004, 2006 and 2012-2103. Even in the strongly trend markets
of 2008 and 2009, this system still occurred more than chance
would suggest.
2) The 5-day Stochastic K-Line turning up from below 20 is a
Buy
and the K-Line turning down from above 80 is a Sell.
This is the best trading system 6.0% of the time.
3) The 5-day Stochastic K-Line crossing the 20
level to the
upside is a Buy and crossing to the downside the 80 level is
a Sell. This is the best trading system 4.6% of the time.
The K-Line simply shows how far up from the 5 day low to the 5 day high,
the stock is. This is sometimes called the FAST Stochastic. These K statistics
are smoothed by taking the 3 day average and this become the SLOW
or Pct-D Stochastic.
You can see the lengthy study here:
Documentation for
TigerSoft Automatic and Optimized Signals.
The Power of The Five-Day
Stochastic over Time.
I want to show here the power of the 5-day Stochastic systems over time.
I had to re-write the Peerless program to show the percentage of all cases
that each trading system was. As you look at the results below for a large
sample of mostly SP-500 stocks since 1990, understand hat pure chance
would present about a .02 probability for any particular system being
#1. In other words, if 300 stocks are sampled, then chance would suggest
6 instances on average, for any given Tiger trading system being #1.
Power of Each 5-day Stochastic Trading Systems Being #1
1 "K>20<80" =
Stoch-5-K rises above 20 for Buy and falls below 80 for a Sell
24 year .046 probability vs .02 by chance. 3RD BEST
2 "D>20<80" = Stoch-5-Pct-D rises above 20 for Buy and falls
below 80 for a Sell
24 year .027 probability vs .02 by chance. 3 "K><Pct-D" = Stoch-5-K rises above Stoch-5-Pct-D for Buy and
Stoch-5-Pct-K falls below Stoch-5-Pct-D for Sell.
24 year .060 probability vs .02 by chance 2ND BEST
4 "K Turns up Stoch-5-K turns up under 20 for buys
K Turns down" Stoch-5-K turns down over 80 for sells.
24 year .074 probability vs .02 by chance BEST
5 "Pct-D turns up Stoch-5-Pct-D turns up under 20 for buys
Pct D turns down" Stoch-5-Pct-D turns down over 80 for sells.
24 year .044 probability vs .02 by chance
--------------------------------------------------------------------------------
        1         2       3        4             5                 All 5
      K>20<80  D>20<80  K><Pct-D K turns up     Pct-D turns up     Five 5-Day

                                 K turns down  Pct-D turns down   Stochastics
-------------------------------------------------------------------------------
1990      .0647   .0359    .0539    .0647          .0359           .251
1991        .103    .0537    .0501    .0645          .025            .296
1992      .0535   .0357    .0785    .0892          .0464           .303
1993      .0486   .0277    .0625    .1006          .052            .291
1994      .0798   .0208    .0416    .0833          .0763            .302
1995      .0448   .0275    .0655    .0344          .0241           .196
1996      .0557   .036     .0295    .0491          .029            .199
1997      .0596   .0165    .043     .0629          .0298           .212
1998      .058    .0225    .0387    .0645          .0258           .210
1999      .0384   .016     .0737    .0769          .0448           .250
2000      .0353   .0289    .0578    .0868          .0385           .247
2001      .0218   .0249    .0498    .0747          .0623           .234
2002      .0471   .0188    .0471    .0817          .044            .239
2003      .0277   .0493    .0524    .0432          .0586           .231
2004      .0337   .0368    .046     .1104           .0398            .267
2005      .0335  .0243    .064      .0823         .0487            .256
2006      .0484  .0242    .0636     .1039           .0515            .292
2007      .0449  .0184    .1179    .087           .0646             .323
2008      .0174  .0116    .0203    .029 (low)     .0232            .103
2009      .033   .036     .051     .024 (low)     .0274            .171
2010      .0301  .018     .0572    .0873          .0271            .220
2011      .0398  .0644    .0889    .0889          .0797             .362
2012      .0414  .0118     .1035    .0828          .0355            .275
2012-3    .0483  .0210    .0903    .105             .0441             .309
===============================================================================
24Yr Avg. .046   .027     .060     .074           .044            .252
|
====================================================================================
OLDER HOTLINES
===================================================================================
6/14/2013 The Peerless Peerless Sell S9B still
stands as the DJI, DIA and SPY wait
to
see how much "tapering" the Fed decides to do. There are not many
Bearish
MINCP Stocks at the moment. I take that as a sign that Professionals
believe (or now know) that the Fed will back away from doing anything that
might alarm investors this week. Still, the internals below are nearly all
Red.
The market may rise tomorrow back to the now falling 21-day ma. But the
last few rallies up to that point have failed. So, I think we just have to wait
and see how things develop. Our Stocks' Hotline is still long a number of high
Accumulation Stocks. I think we have to wait for a rally 2% above the 21-day
to make SPY or DIA look like they have potential as shorts.
Current Peerless Key Values
Date
DJIA
La/MA AnnRoc P-I
P-I ch P^^
IP21 V-I
Opct 65PctChange
6/14/2013
15070 -106 .99 -.161 -321
-26 -321 -.05 -116 -.146
.04
----> 155 MAXCP stocks Bullish
MAXCP Stocks (6/14/2013) Bullish
plurality
---> 45 MINCP stocks Bearish MINCP Stocks (6/14/2013)
---> 24 New Highs on NASDAQ 13 new
lows. Bullish plurality
---> 40 New Highs on NYSE 18 new
lows.
6/14//2013 ---> To Key Index and
Leading Stock Charts
5-day Pct-K Stochastic SPY Chart
6/14/2013 Peerless Sell S9B
The A/D Line uptrend has been broken and
is falling back. That has to be viewed as bearish for now. The way the
DJI,
DIA, SP-500, SPY and QQQ have been falling back
repeatedly from their down-trending
resistance lines instead of continuing to rally is a sign of institutional
distribution
and is bearish becuase it is planned selling not haphazard. The Closing Powers
for DIA, SPY and QQQ are each falling. That is bearish, too. I think we
need to
give the SellS9Bs more chance to bring about a decline to the lower band. Without
a head/shoulders top in the DJI a deeper decline is unlikely.
The biggest risk now is not the Fed, which will act very cautiously, but that the
economy will show further signs of slowing down. This is sangerous because of how
over-extended the market looks. The DJI's weekly
chart seems to be begging
for its second 10%-17% correction in 51 months.
There is also a higher risk than normal now that overseas markets may tumble.
With 11% unemployment in Europe, the danger of a failed recovery there is high.
Overseas markets show considerable vulnerability. The Tiger Index of Foreign
(non-US)
ETFs shows a neckline-support which is becoming badly frayed. A sell-off overseas
would put US multinationals at much higher risk than the they now reflect.
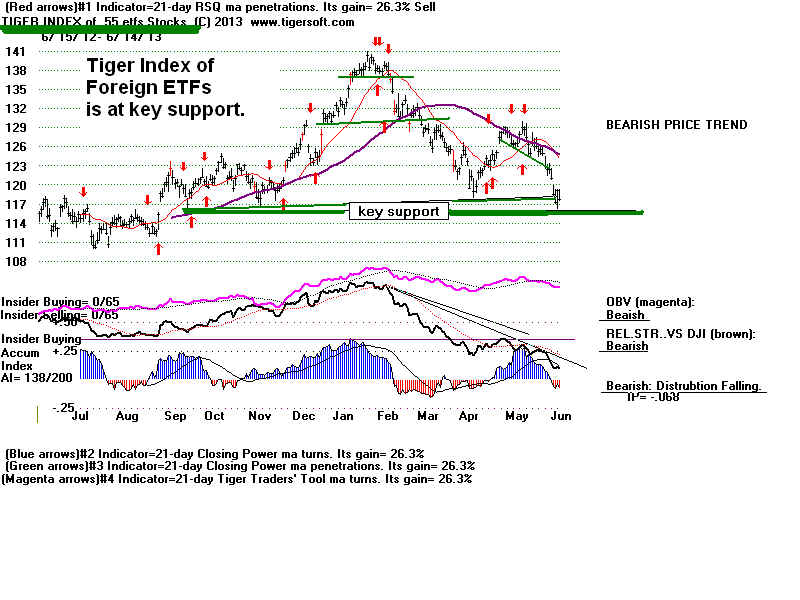
Wall Street seems to believe that the Fed will do what it can to keep interest rates
from rising too fast. 10-Year Treasury reates did decline on Friday. I noted
some
bulish divergences in the oversold Municipals. The Fed's Open Market Committee
meeting this coming week will get lots of attention. Buyers in Crude Oil, which has
broke
out
Friday with hefty Accumulation to back it, certainly must believe the Fed will
risk
inflation in whatever it does.
NEW - In the CrudeOil chart below, you see that the
TigerSoft automatic signals
do not recognize that a significant, red high volume, intense Accumulation
is occurring. This shows the limitations of the automatic, optimized signals.
I have spent some time recently re-writing the Documentation for these
Automatic and Optimized
Signals.
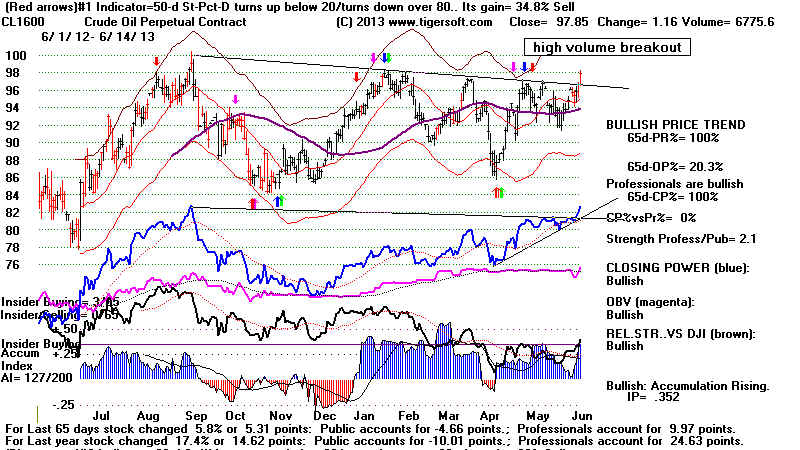
A rally in Crude Oil seems likely. But the TigerSoft
Index of Oil Stocks does
not look nearly so bullish. If Crude Oil keeps rising, the highest Power
Ranked
Oil stocks should do well. The others are probably being hurt by the
bearish H/S pattern shown by Natural Gas. Take a
look at GEL Genesis Energy,
WFT Weatherford Intl and SPH Suburban Propane (below).
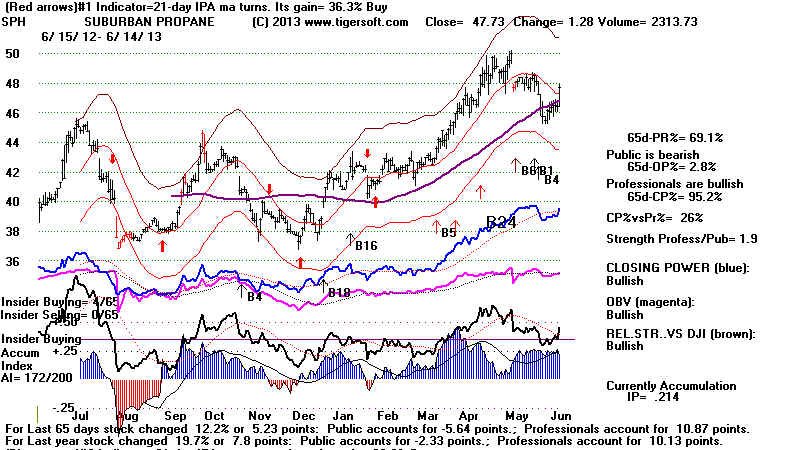
-----------------------------------------------------------------------------------------------------------------------------------------------------
OLDER HOTLINES
----------------------------------------------------------------------------------------------------------------------------------------------------
6/13/2013 Peerless
Sell S9B The DJI lept 181 today as the Fed sought to
limit the fear of bond holders that they would suddenly abandon QE-III. The rally
took the DJI and SP-500 back to their falling 21-day ma. The SPY and DIA Closing
Powers rose back to their falling 21-dma. The rally will have to continue to
convince
the bears.
A 2%-3% DJI rally back to 15500 next is certainly a good possibility if the Closing Power
and Price downtrends are violated. In 3 of the 5 earlier S9-V cases the DJI rose
about 3%
before falling down to the lower band, at least. For this reason, I have avoided
suggesting that shorts should be taken on DIA and SPY. Some of the municipal
bonds show new lows unconfirmed by Closing Power and the Accum. Index. Some
of these should probably be covered and shorted again if they recover.
Current Peerless Key Values
Date
DJIA
La/MA AnnRoc P-I
P-I ch P^^ IP21 V-I Opct
65PctChange
6/13/2013
15176 +180 .996 -.031 -295
+52 -295
-.006
-96 -.055
.038
----> 192 MAXCP stocks
Bullish
MAXCP Stocks (6/13/2013) Bullish
plurality
---> 72 MINCP stocks Bearish MINCP Stocks (6/13/2013)
---> 56 New Highs on NASDAQ 12new
lows. Bullish plurality
---> 48 New Highs on NYSE 40 new
lows.
6/13//2013 ---> To Key Index and
Leading Stock Charts
5-day Pct-K Stochastic SPY Chart
The rally today did a number of positive things technically. It confirmed that there
are still plenty of institutional buyers of "internally strong" stocks, those
making
price and Closing Power new highs also showing high Accumulation. This is why
our Stocks' Hotline is still long quite a few stocks.
The rally today also improved some of the Peerless key values so that now a decline
to the rising 65-dma may be able to yield a reversing Peerless Buy B11.
And bullishly the rally today shows the Fed will probably move cautiously
to try to wean the market off of its purchases of long-term mortgages. However,
many of the weakest Municipal Bonds continued to decline and the steep uptrendline
of the yield on 10-Year Treasuries has not been violated.
So, the sense that
interest rates can only continue to rise remains. The good news, of course, is that
if the Federal Reserve can and does move slowly in reducing its support of the
bond market, the adjustment process will probably be less jarring and the
bull market in equities can continue much longer.
June Bottoms
Mid June bottoms can occur, There were 12 cases like this
between June 7th and June 20th,
But there were 31 cases where the DJI did not bottom until after the
22nd of
June or kept falling throughout the month. Below is a list of the June
bottoms that brought
rallies to the upper band and those cases where it did not.
LA/MA LA/MA
at Bottom on immediate Rally
6/24/1930 .846
1.068
6/1/1931 .868
1.130
7/8/1932 .902
95%
rally to August 1932 peak.
6/16/1933 1.002 B5
1.082
6/1/1934 .969
1.049
6/3/1935 .98 B9
1.033
6/4/1936 .996
1.042
-->6/14/1937 .960 B8
1.045
5/27/1938 .943
1.149
6/30/1939 .958
1.06
6/10/1940 .960 earB16 1.06
5/26/1941 .993
1.04
6/25/1942 .992
1.042
6/22/1943 .988
1.025
7/26/1945 .977
1.048
7/23/1946 .958
1.018
5/20/1947 .965
1.04 and
much higher.
1948 June was weak all month
-->6/14/1949 .956 earB14 steadily much
higher.
7/13/1950 .924
1.047 and
much higher
6/29/1951 .973
1.04 and
much higher
-->
6/16/1953 .972 earB14 1.018
6/9/1954 .983
1.036 and
much higher
5/17/1955 .977
1.048
5/28/1956 .942
1.035
6/24/1957 .984
1.022
6/9/1959 .975 B11
1.044
1960 June was weak all month
6/26/1961 .982
1.037
6/26/1962 .925
1.041
1963 June was weak all month
6/8/1964 .978
1.017
6/28/1966 .953
steadily much
higher
6/5/1967 .966
1.037
1968 June was flat.
1969 June was very weak all month
7/7/1970 .965
1.053 and
much higher
1971 June was weak all month
1972 June was weak all month
1973 June was weak all month
1974 June was very weak after the 10th
6/13/1975 .992
1.039
6/7/1976 .974
1.025
1977 June was flat.
7/5/1978 .964
1.055
1979 June was flat.
1981 June was very weak after the 12th
6/21/1982 .975
1.026
1983 June was very weak after the 16th
1984 June was flat.
5/20/1988 .972
1.042
6/30/1989 .978
1.04 and
higher
6/25/1991 .977
1.02
6/18/1992 .972
1.02
1993 June was flat.
6/24/1994 .969
1.033
7/15/1996 .95
1.039
and much higher
6/16/1999 .969
1.034
6/22/2000 .981
1.027
2001 June was weak all month.
2002
June was very weak all month.
6/27/2003 .989
steadily
up.
7/23/2004 .974
1.039
7/6/2005 .982
1.022
6/13/2007 .964
1.022
2008
June was weak all month.
7/10/2009 .967
up strongly
6/7/2011 .951
B14 1.03
6/4/2012 .961
1.028
====================================================================================
OLDER HOTLINES
====================================================================================
A Bond Fund Crash Will Surely Impact Stocks Very Negatively.
If interest rates rise sharply, stocks will surely drop because their dividends
will seem so much smaller. A bond crash will wipe out a lot of savings.
This is deflationary. A bond crash will bring margin calls and force
selling of stocks. Some Wall Street institutions may disappear. China will be
hurt.
They will not soon buy US Treasuries like they have been. US Treasuries
will have to be offered at much higher intterest rate levels to overcome
the fear the crash has created in bond holders. That will increase the
US debt and create more demands for Austerity. These higher interest
rates will hurt businesses and consumers. So, a bond crash would not be a
pretty picture. I think we can assume the Fed understands all
this.|
If so, expect them to start soon trying to assuage the fears of bond holders.
But will that be enough to stop the growing panic?
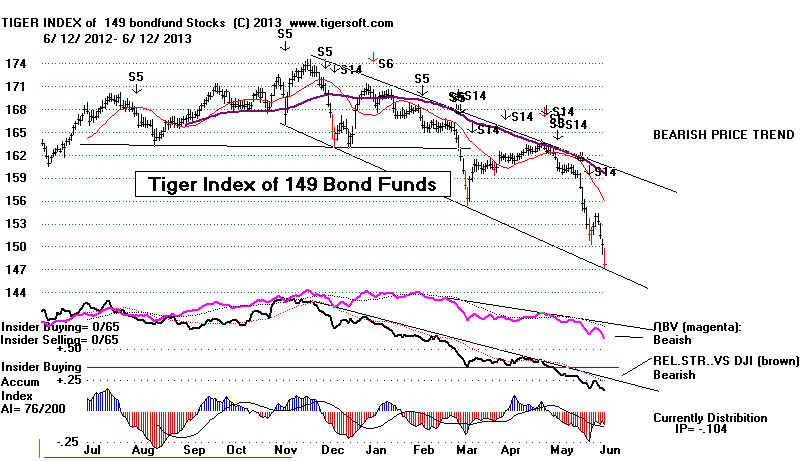
6/12/2013 Peerless
Sell S9B The Closing Powers broke their uptrends.
Volume and Breadth are worsening. The DJI will be lucky to hold up while
interest rates are rising and overseas markets are falling. The pattern of
Professional buying to support the long advance will be thoroughly tested
over the next week until the Fed clarifies their intentions for QE-III. The
P-Indicator and OPct are probably too low now for a Buy B11 at the rising
65-dma.
Add more short positions in the Bearish MINCP Stocks and sell stocks
whose Closing Powers have started their own downtrends.
Current Peerless Key Values
Date
DJIA
La/MA AnnRoc P-I
P-I ch P^^ IP21 V-I Opct
65PctChange
6/12/2013
14955 -127 .984
-.075
-247 -61 -347 -.012
-104 -.059
.036
----> 55 MAXCP stocks
Bullish
MAXCP Stocks (6/12/2013)
---> 166 +69 MINCP stocks Bearish MINCP Stocks (6/12/2013)
Bearish plurality
---> 28 New Highs on NASDAQ 20 new
lows. Bullish plurality
---> 10 New Highs on NYSE 318 new
lows. Bearish
plurality
6/12//2013 ---> To Key Index and
Leading Stock Charts
5-day Pct-K Stochastic SPY Chart
If we get another day like today and the DJI drops to the 65-dma, we will NOT
get a Buy B11. There have been 4 June B11s. All occurred in the bullish year
before the Presidential Election. But that is not the problem. Rather,
the market's
breadth and volume have deteriorated dramatically. Fear of rising
interest rates and
the withdrawl of Fed support to boost the market has dropped the P-Indicator
to a -347. This is a stunning reversal. It has occurred because the Fed has
apparently changed its criteria for continuiing its QE-III. Earlier this year,
Bernanke
said that the Fed would maintain very low rates until the official Uenmpoloyment
fell to 6.5%. Now they are saying this may begin as early as this month.
Small wonder the market has reversed course, especially since job creation
is lagging and the Unemployment level rose for May rose. What has caused
this change of thinking? What are they afraid of?
The P-Indicator is now far below any past case where there was a Buy B11.
(The Buy B11 is the buy-at-the-rising 65-dma signal I had hoped for on this decline.)
Note that I have adjusted the earlier P-Indicator readings to allow for the number
of shares on the NYSE. In addition, the OPct must not be below -.089. With
another
down-day like today, it will be. Below 14800, the next expected DJI support level
is at 14200. But a normal 10% correction would take the DJI down to 13800.
Such
a decline does not make it worth while to hold any stocks except those with very
high Accumulation and rising Closing Powers.
Without a head/shpulders pattern developing in the DJI, we should not expect a
bigger decline. Appeciate that we do not need a Sell S9 or S12 to start a big
decline,
but without a Sell S9 or S12, there is nearly always also a bearish ead/shoulders
top pattern: July 1941, June 1946, June 1950, 1962, April 1971, April 1981, May 2001
and April 2010. The only exception since 1929 was in May 1940. Nearly all these
cases occurred in the DANGER PERIOD from April to July. That should be of
concern. 3 of the 8 occurred in the year after a Presidential Election.
DJI and Rising 65-dma.
Will It hold?
And even if it does, how much will the DJI rally?
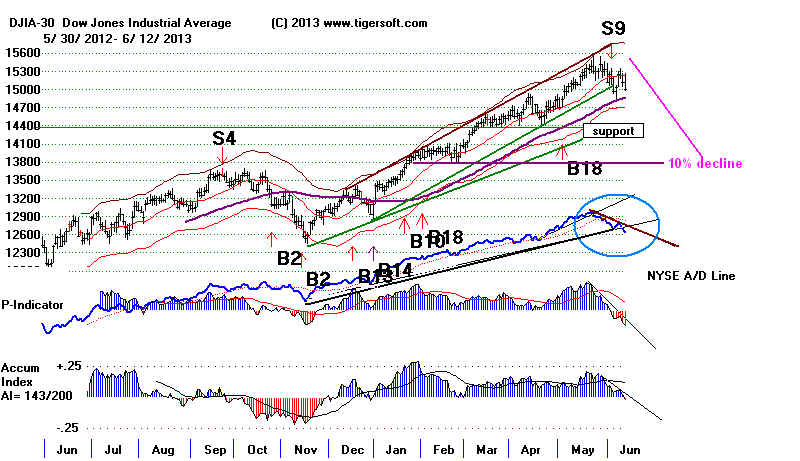
SP-500 and Well-Tested Uptrendline
A violation will cause another wave of technically based selling.
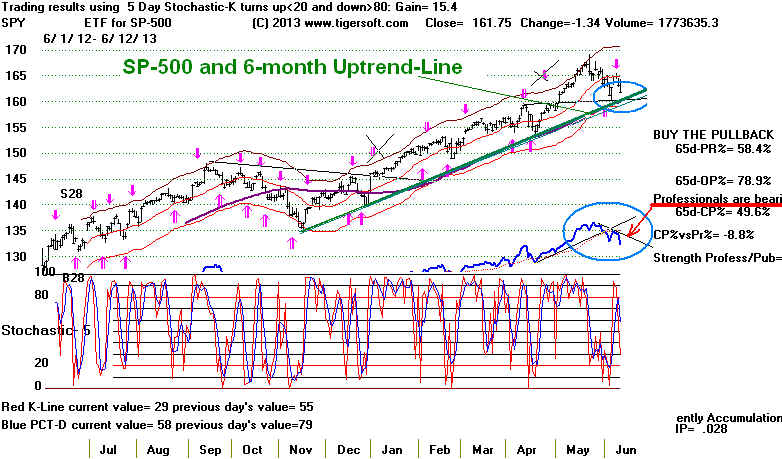
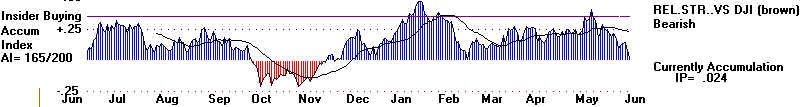
How much will the collapsing municipal bonds impact stocks.
Wall Street may be
able to hold up if the Fed offers further support. But I think we are right to be
scared
by the unchecked use of leverage there, how much cheap money has artificially boosted
stocks since the QE-I back in October 2010 and how inter-linked Wall Street
is with events overseas. A continued plunge in bond
funds, which is what TigerSoft
indicators suggest, and a breakdown in overseas markets below their support level
will drop the market a lot more. See the bearish pattern in the Tiger Index of
foreign
ETFs' chart below. Mexico and India ETFs have their own H/S patterns and should
be shorted is the close is decisively down tomorrow.
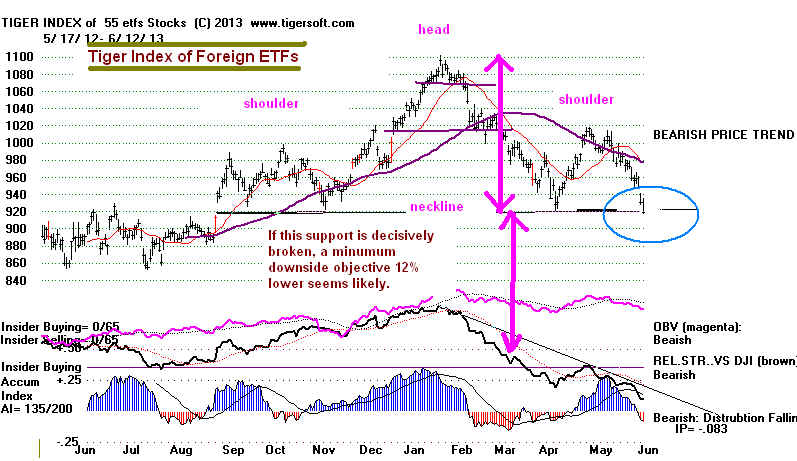

Read Pimco's William Gross and the "Credit
Supernova"
Both bonds and stocks have the same underlying problem. Wall Street is
vastly separated from Main Street. Gary
Shilling warns that investors have
been “paying little attention to weak and declining economies around the
world,
and concentrating on the flood of money being created by central banks.”
The result is way tiio many "junk bonds and other low-quality debt.”
William Gross, the
manager for PIMCO makes the same point. “Investment banking,
which only a decade ago promoted small business development and transition
to public markets, now is dominated by leveraged speculation and the Ponzi finance.”
====================================================================================
OLDER HOTLINES
====================================================================================
6/11/2013 Peerless
Sell S9B Expect Good Support at the Rising 65-dma.
Overseas Markets have fallen back to their key neckline
support. US Professionals
keep supporting the market judging from the still positive Accumulation Index
and the rising Closing Powers for the DJI and SPY. Expect upside resistance
to come in at the DJI's 21-dma at 15237, 115 points above today's closing price.
A DJI advance above that will probably allow an additional 2% rally. But more than
that should bring a Sell based on the negative V-Indicator readings now.
.
It sure looks the big banks have agreed to keep supporting the DJI and SP-500
as long as the Fed keeps the cheap money coming and the Administration keeps
appointing Wall Street people to powerful economic and financial posts.
Tuesday Obama
appointed Walmart's booster Jason Furman to head
his Council
of Economic
Advisors. He is a lover of free trade and outsourcing. He is also
a supporter of budget cuts and credits Walmart's anti-union policies as bringing
about big savings for American consumers.
A Steeply Rising 65-dma is usually very good support.
It is, however, starting to flatten. If it turns down, the
DJI will probably fall to 14400, its next support level.
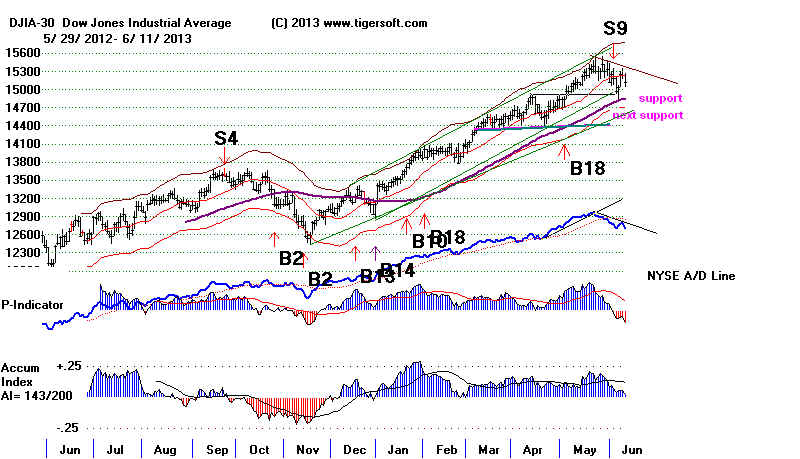
The Underlying Closing Power trend for SPY is still up.
SPY shows positive Accumulation going back over 110 days.
Institutions and Professionals are still buyers on weakness.
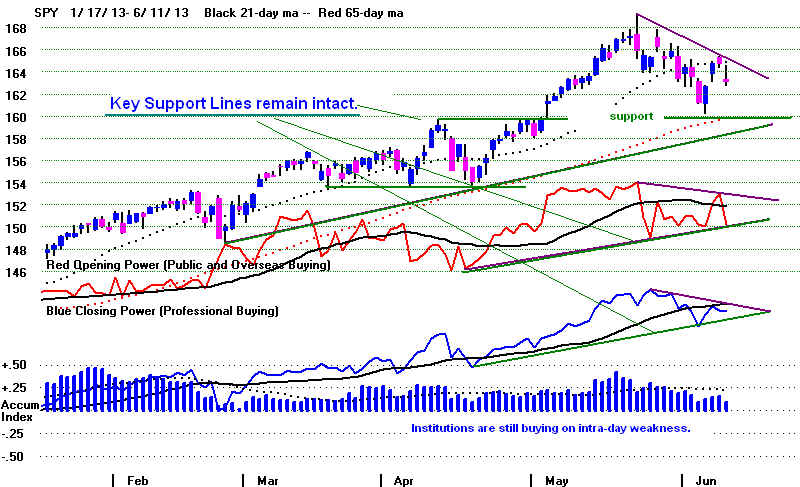
No Major Top Yet. But It's Getting Closer.
Eventually, the stock market
will break down. But we do not have Red Distribution,
multiple Peerless Sells or a
6-month top formation, as we usually see before a
big sell-off. For now,
the market is being hit with more than it can probably quickly shrug
off. The Fed can
not be counted on for as much aid to the big banks.
The likelihood of higher
interest rates is the most obvious American bearish
element. The negative
effects of these fears are plain to see. I have been mentioning
the weakness in Bond Funds, REITs and Utilities. The Tiger chart of the yield on the
10-Year
rates is probably the most direct way to watch the unfolding trend of higher rates.
This impacts most the NYSE because there are so many dividend-paying stocks and
other
investment vehicles there.
The current weakness in the A/D Line and the P-Indicator
result from this. And
now the number of NYSE new lows is 15 times the number of new highs.
Time and time again, numbers
like this have been quite bearish. so soon after the DJI
has made a new 12-month high.
Our response has been to go
short many of the lowest Power Ranked bond funds. These
are mostly municipal bond
funds. The President has proposed reducing the tax-exempt status
on these. I would also
go short some of the Bearish MINCP Stocks . But we remain long
many of the high Accumulation
and high Power Ranked stocks with strong CLosing
Powers. See Bullish MAXCP
Stocks. Why still be long? One reason is that it usually
takes a number of Peerless
Sells and a six-month long market top to bring on a bear market.
A second is that when you
look at past tops, like in 2000 or 2007-2008, you see that
not all stocks top out at
once. The most bullish keep rising longer, u\sually at least
until the DJI breaks major,
well-tested support or falls more than 13.5% from
its highs. And another
reason is the Professionals are still buying the ETFs for the DIA
and SPY, too. (As I
suggested, I think this means that the Big Banks, the Fed and the
Obama Administration are all
cooperating as much as possible to prevent a big US
stock market decline. It is a
very high priority. Some Republicans claim that Obama is
a socialist. This is patently
absurd. This rhetoric for their base just as Obama uses
populist, anti-big banker
rhetoric from time to time. )
A second threat to the bull
market comes from overseas. The Tiger Index of non-US
ETFS shows a massive head and shoulders top pattern. Prices
have now fallen down to the
neckline from the apex of a
symmetrical right shoulder. A breakdown would be quite
bearish. Such a
breakdown in Chinese stocks in late November 2007 was
one of factors turning me
quite bearish.
See Tiger
Blog - 11/22/2007 -World Bull Market Is Ending
But the neckline
here has not yet been broken. And prices are nowhere near as
overbought. Head and
shoulders patterns work best when prices are very over-extended.
The weakest foreign funds
over the last quarter are Chile (ECH), Russia (RSX), Brazil (EWA)
and Australia (EWA). These
are each down more than 1%. Declining predcious metals,
copper and now natural gas
prices bear much of the blame.
A third longer-range threat
comes from the less than sanguine outlook for profits
in the the big multinationals
that make up the DJI and SP-500. For twenty years,
they have boosted earnings by
cutting labor costs and sending jobs overseas.
It is not clear what they can
still do now, except cut the bloated pay of their own
executives, to achieve such
economies. There's just not much more outsourcing
and part-time hiring they can
do.
Fourthly, as in the late
1920s, wealth has become extremely concentrated. The middle
class in America has shrunk.
As a result, the buying power needed to consume
what has been produced is
just not here anymore. It is not clear that the "developing"
economies can continue to
make up for what is not sold in the US. The fall in
prices for natural resources
is htting them very hard. Europeon buying will probably remain
insufficient for some time.
Unemployment is above 11% in Europe. The dominant fiscal
and monetary policies there
are heavily influenced by the unrepentant believers in Austerity.
In the end, over-production
or under-consumption plus over-speculation brought
the collapse of 1929.
It seems unavoidable again.
Fortunately, the US markets
do NOT now look like they did in 1929, 1937, 1946, 1957,
1960, 1966, 1969, 1973, 1978,
1979, 1980, 1981, 1984, 1987, 1990, 1998, 2000 or
2007 when Sell S9s brough big
sell-offs. That gives us hope that the current decline
will be temporary.
---> 191 -31 MAXCP stocks Bullish MAXCP
Stocks (6/11/2013) Bullish plurality
---> 97 +28
MINCP stocks Bearish
MINCP Stocks (6/11/2013)
---> 30 New Highs on NASDAQ 26 new
lows. Bullish plurality
---> 13 New Highs on NYSE 198 new lows. Bearish
plurality
6/11//2013 ---> To Key Index and
Leading Stock Charts
5-day Pct-K Stochastic SPY Chart
Current Peerless Key Values
Date
DJIA
La/MA AnnRoc P-I
P-I ch P^^ IP21
V-I
Opct
65PctChange
6/10/2013
15122 -117 .992
.122 -287
-143
-287 .03
-90 -.057
.047
=====================================================================================
OLDER HOTLINES
=====================================================================================
6/10/2013 Peerless
Sell S9B The rally has stalled at the 21-day ma.
The Closing
Powers are still in minor uptrends but could not surpass their
21-dma.
Next week's Fed meeting is scaring many of the bulls. Short sales
in the
recent Bearish MINCP stocks have worked
out. There are more candidates
tonight.
That is a bearish sign. But so have new longs in most of the
recent Bullish MAXCP stocks. Hedging hedging is
still called for.
The Sell S9B
tells us to expect a lower DJI closing than we have so far seen on this
decline. But in 3 of the 5 cases, there was first a rally back to the 2%
upper band
or
higher. With the fear of a weakening economy overseas and the danger that the
Fed will
reduce its buying of long-term bonds, a closer test of the rising 65-dma seems
likely.
The biggest
risk here is Deflation, Austerity and the premature support of
very low
interest rates. That could be a very bearish combination given a
stagnant
world economy. Europeon Unemployment is 11%. FDR's experience
in 1937 shows that
Austerity in a week recovery can produce a savage Bear market.
It is still
not clear that the White House and Congressional Republicans will agree
on a Budget
to avoid the mindless fiscal austerity of the "Sequester".
Thursday's
near-B19 was problematic because of the Sell S9 and because it occurred
too close
to the 21-day ma. It would seem best to wait for a new Peerless Buy to
take a long
position in the DIA or SPY. Still, it is probably best to wait for a rally
to the 2%
upper band to go short SPY.
Natural gas
looks like a good short sale. Note the head/shoulders pattern in
UNG and the multiple Sell S7s signifying Closing Power is much
weaker than price.
The Japanese Yen has bearishly fallen back below its falling 65-dma.
but the Closing
Power is
still rising and the IP21 is positive. It is usually best for the CLosing Power
to break
its uptrend before going short again after the 65-dma has been breached.
We are apt
to get a good clue about what the FED will do next week from the big banks.
The Tiger
chart of them below shows them to be just below the apex of a potential right shoulder
in a
head/shoulders pattern. This means they are at a crucial, high inflection point.
Tiger Big Banks Index
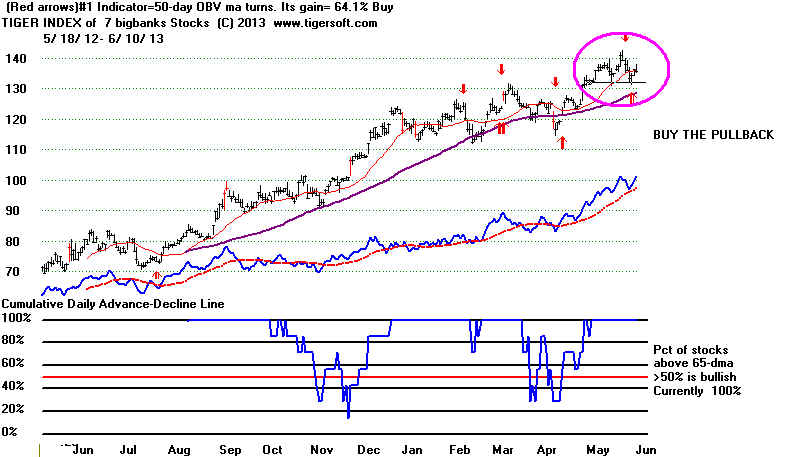
---> 222 MAXCP stocks Bullish MAXCP Stocks (6/10/2013) Bullish plurality
---> 69 +44 MINCP stocks
Bearish MINCP Stocks (6/10/2013)
---> 96 New Highs on NASDAQ 21 new
lows.
---> 61 New Highs on NYSE 64 new lows. Bearish plurality
6/10//2013 ---> To Key Index and
Leading Stock Charts
5-day Pct-D Stochastic SPY Charts will be shown
regularly.
Current Peerless Key Values
Date
DJIA
La/MA
AnnRoc P-I P-I
ch P^^
IP21 V-I
Opct
65PctChange
6/10/2013
15239 -10 1.00 .122
-144 +25
-144 .058 -59 .026 ..059
Higher Interest Rates Are Expected.
The DJI could not get past its 21-day ma. The number of new lows on the
NYSE overtook the number of
new highs there. This re-ignites fears of the bearish
Titanic
effect. The 10-year rates made a 12-month new highs and bond funds
weakened appreciably.
On June 18th-19th, the Federal Reserve's Open Market Committee meets.
They are quite capable of
inadvertently issuing a statement which could
drop the SP-500 by 10% if
they withdraw from QE-III or mark up the
very low Federal Funds' Rate
up. The experience of early 1994 (which is
discussed below) shows that.
Interestingly, the high Accumulation we now
see may not be enough support
to hold up the market. It was not enough
in February 1994 when Federal
Funds were raised merely by 1/4% and
that was in a growing
economy.
Ten Year Rates Make A New 12-Month High.
Meanwhile, the Federal Funds' Rate remains under 0.12%,
as it has for two years.
2013-06-01, 0.09
2013-06-02, 0.09
2013-06-03, 0.10
2013-06-04, 0.11
2013-06-05, 0.09
2013-06-06, 0.10
2013-06-07, 0.09
http://www.federalreserve.gov/releases/h15/data.htm
The last Federal
Reserve Open Market Committee meeting was on May 1.
They announced
that there would be no change to the Federal Funds Target
Rate. Since
then the 10-Yr Treasury Notes' interest rates have jumped
from 1.65% to
2.21%. This is clearly having a big impact on bonds. Its
effect on stocks
is less clear, because the Federal Funds rate remains a
historical lows,
beneath 0.10%. Historically, the SP-500 has been most
influenced by the
Federal Funds Rate. It is short-term bearish when the
Fed Funds Rate
rises, but it is a sign of a strengthening economy, too. See the
chart below.
"(T)he
data from January 1999 to March 2010 (show) the correlation
between
the Fed Funds Rate and the S&P 500 is 0.818". This is a strong positive
correlation.
Higher short-term rates in early 1994 sent the market down 10%
in a month, but
after going sidewise for the rest of the year, the bull market of
1995-2000
begam.
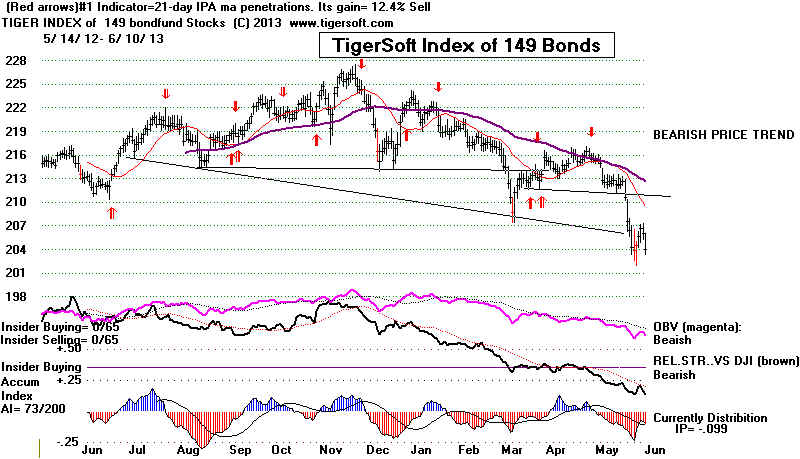
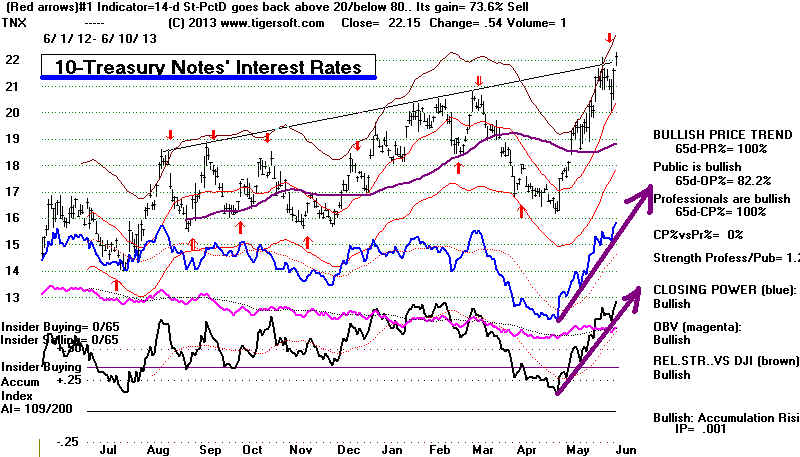
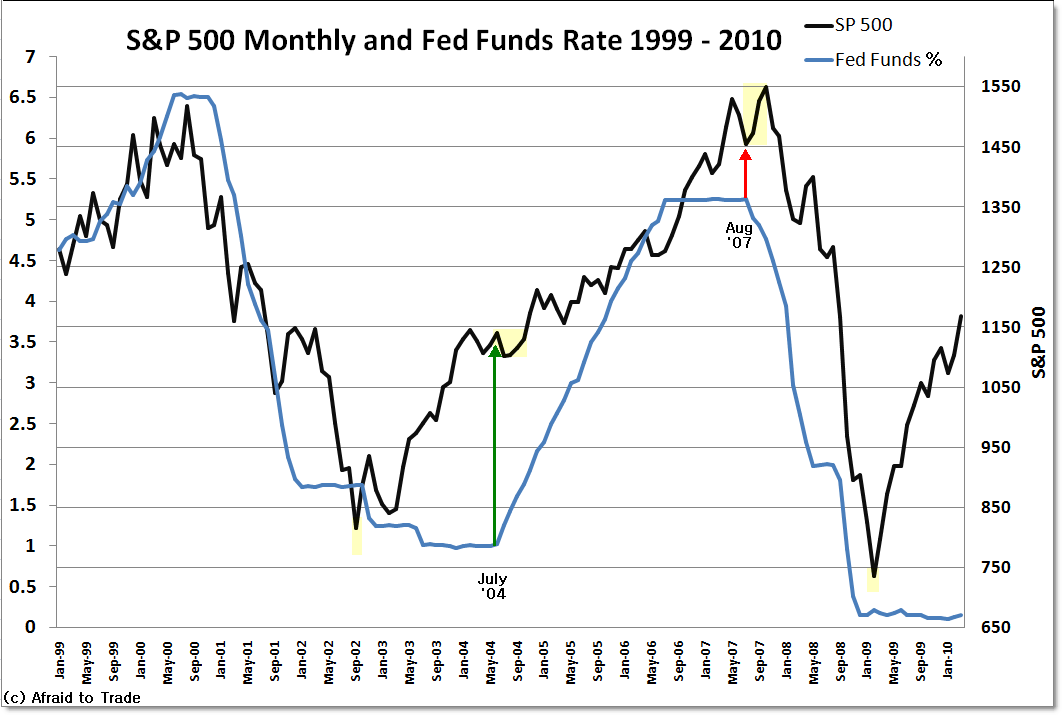
http://blog.afraidtotrade.com/the-10-year-relationship-between-the-sp500-and-fed-funds-rate/
Feb 1994: By Raising the Fed Funds' Rates, the Fed Stopped
a Rising Market For 10 Months. The DJI had been showing consisistently
positive Accumulation. The DJI dropped 10% in 2 months. But 1995
saw the market take off in a 5 year-long supe rbull market.
Background:
The Federal Funds Rate
is the rate that big banks trade funds over-night with
each other at the Fed
to meet liquidity requirements. It is determined by the
Federal Open Market
Committ. This affects money supply and the cost bank borrowing.
Presently the Fed Funds
rate is a record lows, around 0.09%. It has not been above
0.20% since 12/19/2010.
Between 10/23/2008 and 10/31/2008, the Federal Funds rate
dropped from 0.93% to
0.22%. (Source).
This is the of the most sensitive short-term
indication of interest
rates. The Fed's Discount Rate is the rate at which Fed member
banks can borrow from
the Fed. On 12/16/2008, the Fed lowed the Discount Rate from
1.25% to 0.50%.
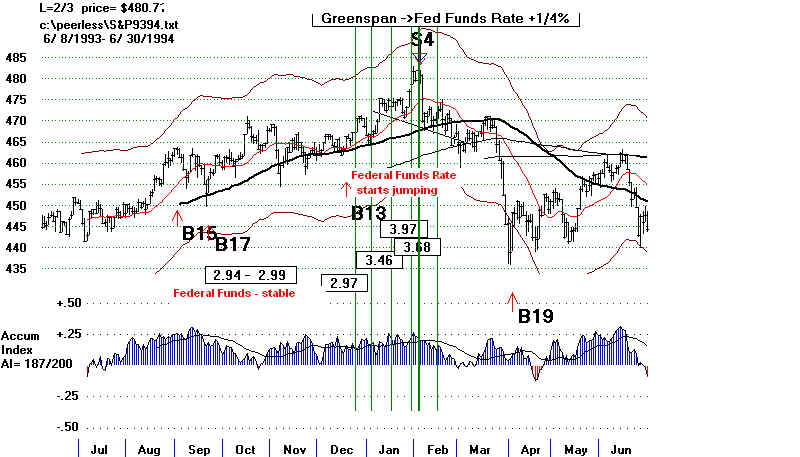
"A reconstruction of events leading up to the recent string of interest rate hikes
illustrates Greenspan's
ability to carry out a conservative, Republican-influenced
monetary policy without
running afoul of a relatively liberal Democratic Administration.
...In
interviews, Fed officials said they realized the turning point had arrived as they
gathered ...
on the eve of a
critical Feb. 4 meeting of the rate-setting Federal Open Market Committee.
Thanks to Greenspan,
the Fed had accommodated the Clinton White House throughout 1993
by keeping interest
rates near historic lows while the nation's economy picked up speed...
By early 1994, however,
Greenspan had convinced himself the time had come to change course.
At the dinner on the
night of Feb. 3, it was understood that the long-awaited policy turn would
come the next day.
"It was clear before the meeting that we were on the brink," recalled one (Fed)
source.
"Greenspan was
determined to get all the members of the Open Market Committee to endorse
what would be the
first interest rate increase imposed by the Fed in five years. A split vote, he feared,
would signal to
outsiders a lack of consensus within the central bank. By happy coincidence ...
the Labor
Department reported on the morning of Feb. 4 that the economy had created far more
jobs in January than
analysts had expected. Fast job growth meant only one thing to Fed officials:
Inflationary pressures
would soon begin building unless the Fed acted quickly to hit the brakes....
Greenspan got the unanimous
vote he was seeking to raise the benchmark federal funds interest rate
to 3.25% from 3.00%.
In fact, he had to rein in some committee members who wanted to approve a
larger rate hike of
half a percentage point. He convinced them that a half-point raise would give
too much of a jolt to
the nation's financial markets.
"Still, when
Greenspan took the unprecedented step of publicly announcing that first rate hike on Feb.
4,
he and his colleagues
were stunned by the reaction (the 10% plunge in the Dow Jones industrial average)..
...(S)gnificantly, the
policy shift proved far less popular among the nation's political leaders and opinion
setters than Greenspan
had anticipated. There was no evidence that prices had begun rising, the outsiders
said, and so the rate
hikes seemed premature."
http://articles.latimes.com/1994-05-11/business/fi-56439_1_rate-hike
====================================================================================
OLDER HOTLINES
====================================================================================
6/7/2013 Expect A Rally Back To 15400-15500 even though there is no new
Buy.
This
assumes that the Fed and Bernanke do not Scare the Market Again by talking
about
reducing QE-III as easly as this month.
There is no
new P\eerless Buy Signal. But The Reversal Thursday and Friday
can be
compared to a Buy B19. My comparable B19 study below suggests there is only
a 10%
chance of a significantly bigger decline. The 65-dma support has not been
eaten up so
far. Most likely the DJI will rally to a reversal 2%-3% higher now.
A
short-term reversal at the 21-dma is not likely. That only occurred in 1 of the
10 B19s
that seem comparable. A rally past the first tagging of the upper band
occurred in
4 of the 10 earlier B19s. Of course, we did not get a Buy B19. But
that was
because of the Sell S9B. When S9Bs are studied, the odds heavily favor
the DJI not
being able next to get past the 3.5% upper band without a retest of the
recent
lows. A nominal lower closing always occurred after each of the Sell S9B.
---> 207
MAXCP stocks Bullish MAXCP Stocks (6/7/2013) Bullish plurality
--->
25 MINCP stocks Bearish MINCP
Stocks (6/7/2013)
---> 74 New Highs on NASDAQ 14 new
lows. Bullish
plurality
---> 49 New Highs on NYSE 11 new lows. Bullish plurality
6/7//2013 ---> To Key Index and Leading Stock
Charts
5-day Pct-D Stochastic SPY Charts will be shown
regularly.
Current Peerless Key Values
Date
DJIA
La/MA
AnnRoc P-I P-I
ch P^^
IP21 V-I
Opct
65PctChange
6/7/2013
15248 +207 1.001 .112
-169 +7
-169 .06 -68 .022 ..063
The DJI Came Very Close to Getting A Buy on Thursday.
The
DJI did not end the day on Thursday near enough to the rising 65-dma for a Buy B11.
And
we would have gotten a Buy B19 on Thursday if the DJI had closed a little lower and
if
there had not been a Peerless Sell on Wednesday. The Accumulation Index has
stayed
steadily positive and the Closing Power downtrend was broken Friday. I would
think
the DJI will rally back to the 2% upper band, assuming it can get past its
21-day ma. Based on the near-Buy B19/near-B11 I cannot predict a breakout
run
to the 16000 level. More backing and filling are probably needed. I noticed
that
the 10-Year Treasury rates rose higher on Friday. That keeps Municipal
Bonds
under pressure.
Clearly, the highest Accumulation and high Power-Ranked blue chips and high
performance stocks were "Rar'in to Go". (I used to have a pal named
Micahel who
loved
playing the horses. He always wanted a horse owner to name a really fast one,
"Rare Indigo".)
We
did get a Buy B19 on Thursday with the older 2006 version,
but the current
version did not get it. There has been another Peerless
Sell the day before. And the
newer
version cancelled Buy B19s when that was true. The 1950 and 2004 examples
show
the risk of using the Buy B19 too close after another Sell.
But
what would be the bullish significance of the Buy B19 if it had occurred? To answer
that
we have to eliminate the Buy B19s that occurred in a bear market or when the
DJI
was down 8% or more in an intermediate-term correction. This eliminates more
than
half the cases. We also, I think, should eliminate those that take place between
October and March, because the seasonality now is so different. And occurrences
in a
Presidential Election year should not be considered as possible parallels. That leaves
the
following cases since 1945.
There are 10 parallels. In only one case,
1950, did the DJI continue to fall. There
had
been an earlier Sell S5 and S9. A head/shoulders pattern also formed. In the
9
other cases the B19 would have been reversed only after a gain. In only 1 of these
cases
did the DJI fall back from its 21-day ma. In this cases
the lower band held
and
the DJI then rallied. If the DJI can get past the
21-day ma, the odds are 5 to
3
that the DJI will reverse between the 1.8% and 2.8% upper band. Presently, the
Buy
B11 gives odds of 4 in 10 that the DJI will get pas the first tagging of the upper
band.
B19s That
Parallel the Denied Instance of 6/6/2012
Date LA/MA Result
----------------------------------------------------------------------------
6/6/2012 .988 ????
high
---------------------------------------------------------------------------
---------------------------------------------------------------------------
6/28/1950 .965 Big loss 214.7 to 197.5 on
7/13/1950
This not allowed because of the Sell S5 - P-NC at upper band
North Korea invaded South Korea to cause this DJI drop.
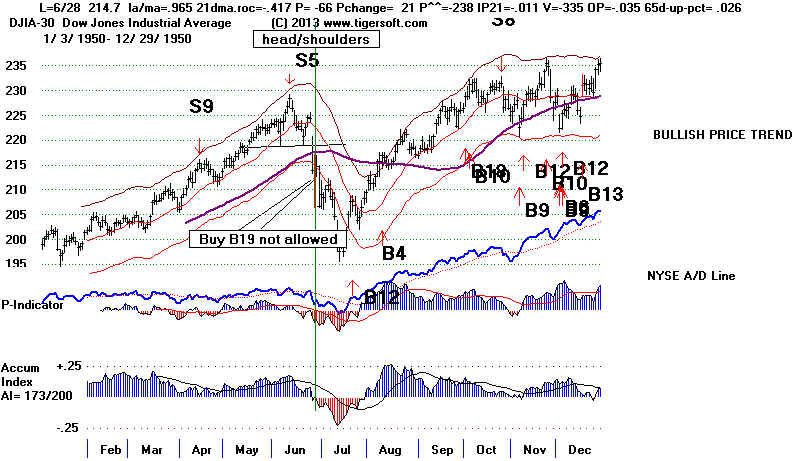
------------------------------------------------------------------------------------
4/11/1967 .983 4.7% gain DJI rose above upper
band.
-------------------------------------------------------------------------------------
6/6/1967 .985 7.5% gain DJI rose past the
first tagging of the upper
band.
-------------------------------------------------------------------------------------
9/30/1980 .985 DJI rallied to a reversal 1.9%
above 21-DMA
before having to re-test the previous low.
--------------------------------------------------------------------------------------
4/15/1987 .979 DJI rally stalled at 21-dma and
another
test of lows was required before rallying.
DJI then rallied to a reversal 2.6% above 21-DMA.
--------------------------------------------------------------------------------------
9/22/1987 .988 DJI rallied to a reversal 2.8%
above MA before crashing.
------------------------------------------------------------------------------------
3/12/2004 .97 DJI rallied to a reversal 2.7%
over 21-DMA
------------------------------------------------------------------------------------
4/21/2005 .985 DJI rallied to a reversal 2.2% over
21-DMA
--------------------------------------------------------------------------------------
3/6/2007 .974 Strong Rally followed.
Gain = 14.3%
---------------------------------------------------------------------------
4/11/2012 .976 DJI rallied to a reversal 1.8% over
21-DMA. Gain= 3.7%
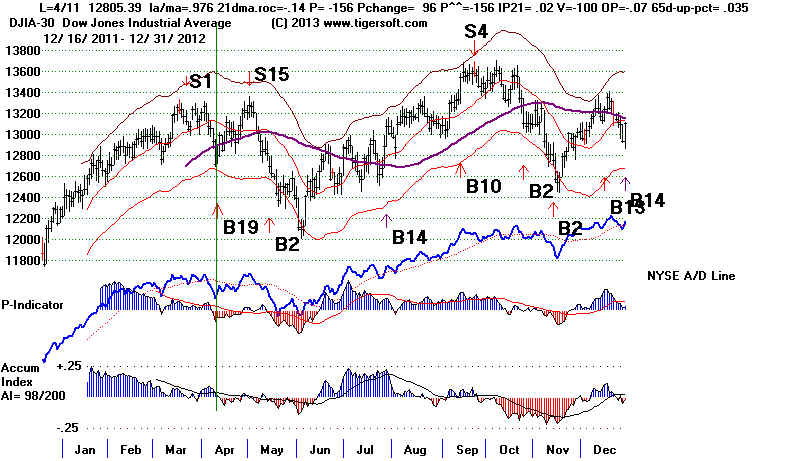
--------------------------------------------------------------------------------------
|
=====================================================================================
OLDER HOTLINES
=====================================================================================
6/6/2013
New Peerless Sell S9B
The DJI tagged the rising 65-dma.
Its close was too
far away from that ma for a Buy signal. The Unemployment/Jobs
Report tomorrow
is expected to be poor enough to cause the FED to continue QE-3.
That, at least,
is my interpretation of today's rally, big drop in the Dollar, the rise in Gold,
Crude Oil and the
Yen ( which has bullishly gotten back above its falling 65-dma.)
We see head and
shoulders patterns in some of the airlines stocks. This may be
signaling a rise
in Crude Oil, which is now back above its 65-dma.
If tomorrow,
DIA's Closing Power ends up cearly above its short-term downtrendline,
I would suggest
closing out the DIA short sale. But there are ample number of
Bearish
MINCP Stocks to short and thereby hedge with. Our Stocks'
Hotline
remains short a
number of municipal bond funds and long some of the highest
AI/200 stocks.
As you can see tonight, a number of the Bullish MAXCP Stocks
could hardly wait
to rally.
The DIA chart below shows very steadily positive Accumulation.
Usually this means that institutions stand ready to buy on weakness at the 65-dma.
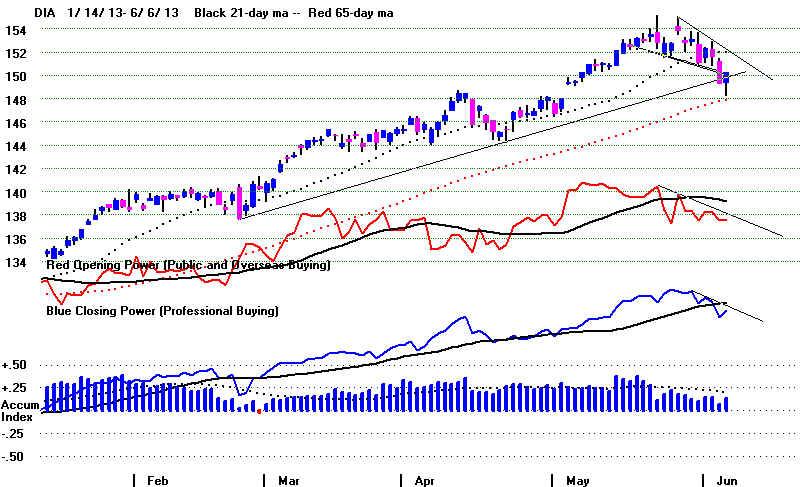
The search
for a June low will probably continue. But it is true that in 3 of the 5
earlier
cases of Special S9Bs the DJI rallied back about 4% from its first low
before late
in the month falling to a lower closing nearer the lower band. Only
in 1971
when there was a major shift in US economic policies did the DJI
break below
the lower band. In that case, a head/shoulders pattern developed
and served
as ample warning of the trouble ahead for 6 months.
---> 121 MAXCP stocks Bullish MAXCP Stocks (6/6/2013) Bullish plurality
---> 40
MINCP stocks Bearish MINCP
Stocks (6/6/2013)
---> 43 New Highs on NASDAQ 14 new
lows. Bullish
plurality
---> 16 New Highs on NYSE 17 new lows. Bearish plurality
6/6//2013 ---> To Key Index and Leading Stock
Charts
Current Peerless Key Values
Date
DJIA
La/MA
AnnRoc P-I P-I
ch P^^ IP21
V-I
Opct
65PctChange
6/6/2013
15041 +80 .988
-.012 -177 +10 -177
.059 -73
.024 ..052
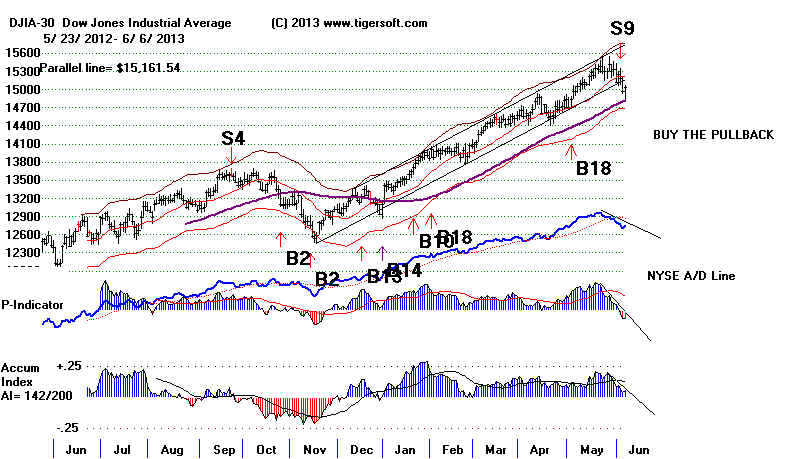
Will Yen Lead Gold Stocks Up
Just as It Lead Gold Stocks Down?
I suggested buying both
ANV and SSRI about 10 days ago when their Closing
Power broke their
downtrends. Now they must get back above their falling 65-dma
as FXY (Japanese Yen
EDT) has. Those new to TigerSoft will discover how
much Closing Power and
the Accumulation working together will determine
trends and trend
changes. A breakdown by CLosing Power coupled with heavy
distribution is very
reliably bearish. A breakout by CLosing Power above resistance
coupled with positive
Accumulation usually send prices higher. The intermediate-term
trends in the Yen and
Gold have probaby reversed. Getting back above the 65-day
ma and staying above it
are still needed to establish a reversal.
Yen is back above 65-dma.
It must stay above it. The break in the CP downtrend is bullish.
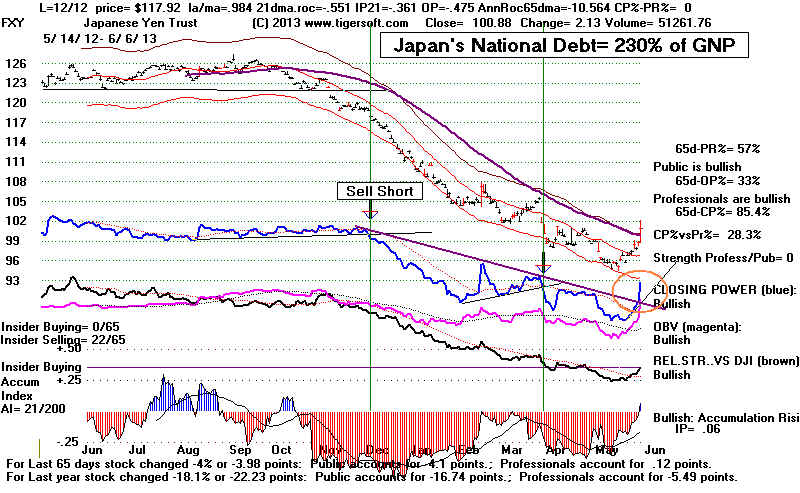
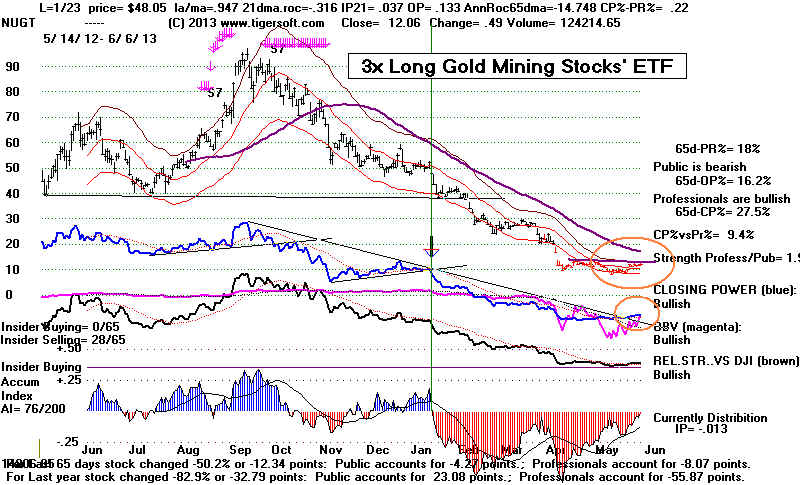
--------------------------------------------------------------------------------------------------------------------------------------------------------
OLDER HOTLINES
--------------------------------------------------------------------------------------------------------------------------------------------------------
6/5/2013
New Peerless Sell S9B
14800 Is The Initial Downside Target.
But Fed Silence will
continue to drop prices. The A/D Line trendbreak continues
to weaken the technical
underpinning of the market. There have only been
3 late May DJI peaks
like the current one. In two cases the DJI fell 5%
from the peak to the
lower band. A 5% decline here from the peak would
mean a decline to the
lower band and 14680. In the third case, 1946,
a big and perfectly
symmetrical head/shoulders pattern developed. The DJI
then fell 22% because
of labor unrest after the war. Our economic problems
now are completely
different.
Seasonality is mildly
bearish. Since 1965, the DJI has risen only 42.6% of the
time over the two weeks
follwing June 5th.
---> 62 MAXCP stocks Bullish MAXCP Stocks (6/5/2013)
--->
98 MINCP stocks Bearish MINCP
Stocks (6/5/2013) Bearish plurality
Note the many leveraged Bearish ETFs here and
how weak their Closing Powers are.
This shows Professionals are bullish. Definitely not bearish here.
---> 9 New Highs on NASDAQ 15 new
lows. Bearish plurality
---> 4 New Highs on NYSE 63 new lows. Bearish plurality
6/5//2013 ---> To Key Index and Leading Stock
Charts
Current Peerless Key Values
Date
DJIA
La/MA
AnnRoc P-I P-I
ch P^^ IP21
V-I
Opct
65PctChange
6/5/2013
14961 -217 .983 -.006 -187 -122 -187 .04
-84 .014 ..054
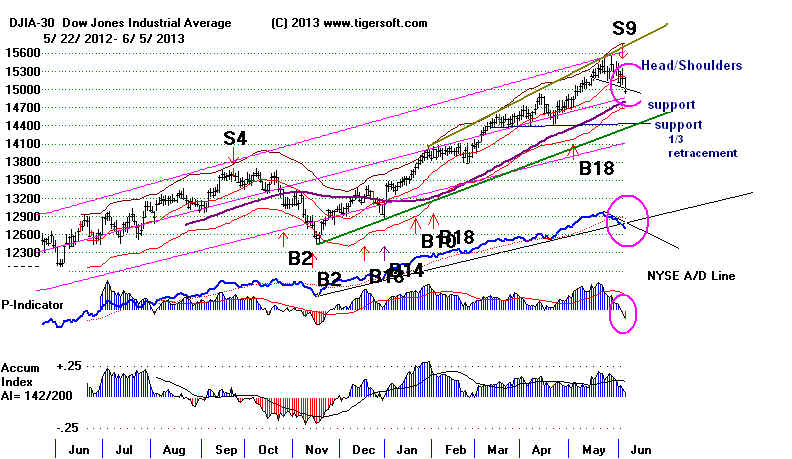
There is still probably more
downside risk. The average decline in the DJI after a
Special S9B is 5.6%.
The DJI fell about 1,5% today. This would suggest we have
600 points more decline ahead
of us. That would take the DJI down 14360
and represent a normal and
mild 33% retracement. On the other hand,
a rising 65-day ma
usually acts as support and Peerless may give a Buy
signal near it at 14800 if we
do not knife down right through it. There's
no way to know at this stage
how deep the present decline will go. I do have to
note several special
concerns:
First, the weekly
DJI charts shows that we are now on the fourth Wave Up. Elliot Wave
people say that this
suggests an extremely over-bought and risky market, in that
usually there is a
"stumble" after just three waves up. A much bigger decline follows
a fourth wave up.
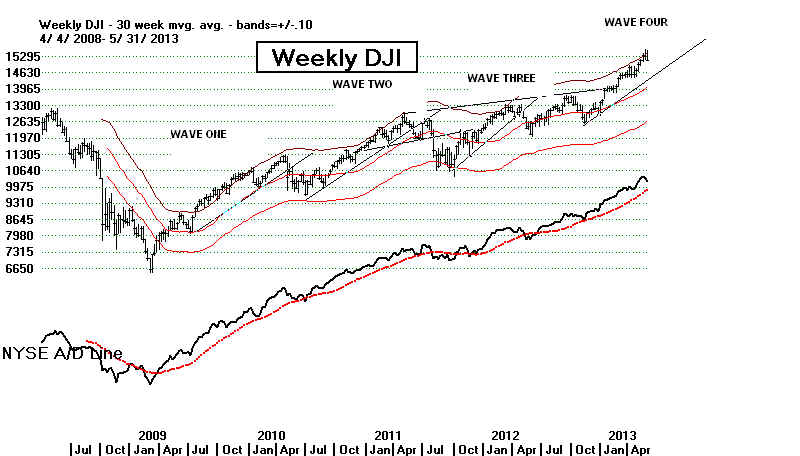
Second, the world stock
markets are generally quite weak. The Tiger Index of non-US
ETFs shows a big head and shoulders
pattern with prices falling down from the apex
of the right shoulder. The
multi-nationals that make up the DJI may not be able to
escape a slumping world economy.
Wall Street got what it wanted in free trade and the
free flow of capital. Now it
may be dragged down by its choice to end all protectionism
for the American market.
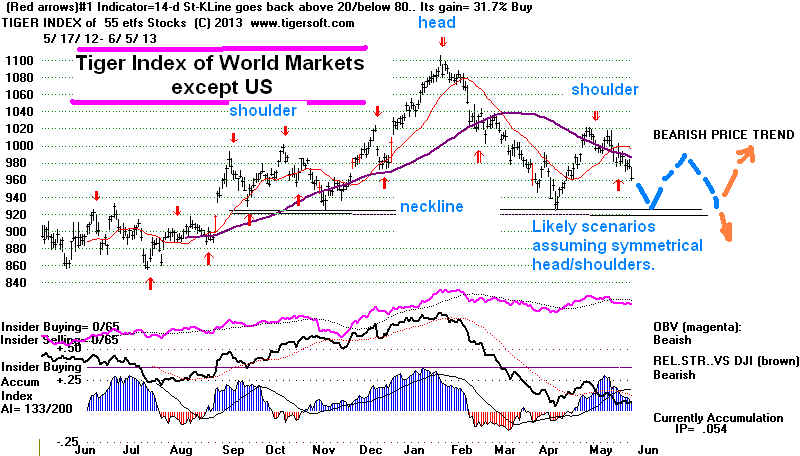
Third, the DIA's Closing Power did
complete today its own bearish looking head/shoulders
pattern to confirm the DJI's own
head/shoulders' price pattern. These are nasty patterns
if not reversed. A higher
opening may end up being overcome by another round of
Professional selling if Bernanke
and the Fed do not come to the rescue soon. They may
have been testing the market's
resiliance by releasing to the public their consideration of
of June plan to reduce QE-III.
If so, they have succeeded in scaring it. Economic news is
not good now. If they want to
prevent a relapse of the economy, they had better clarify
their intentions soon. If
they do not, it probably shows that Bernanke has lost his majority
and the easing will start ending in
June.
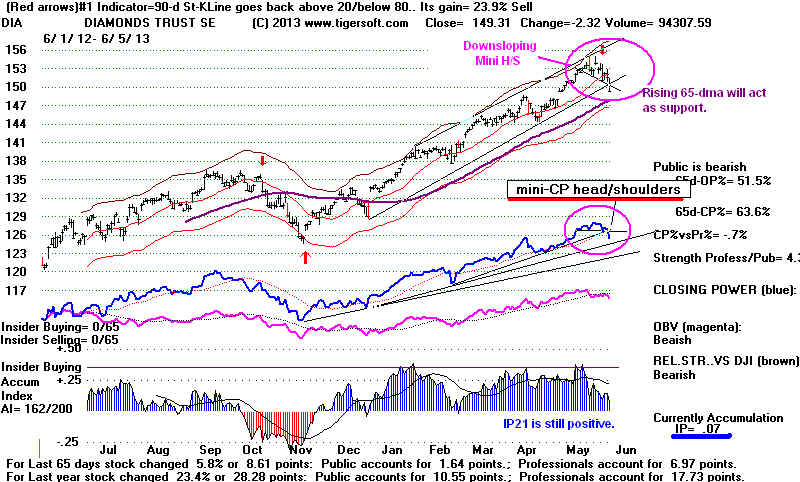
Fourth, the DJI could
not even advance past May 28th, its top. Usually there
is an influx of funds to buy
at the end of each month and the beginning of
the next month. Here
are the late May tops since 1945.
Late May Tops since 1945
Date
Result la/ma
21-dma-roc P-I P-ch
P^^ IP21 V-I
Opct
65-day la/65 dma
Pct Change
------------------------------------------------------------------------------------------------------------------------------------------------
5/28/1945 LB 1.018
.31
9 6
41
.031 -58
.156
.057
1.046
Sell S8 and S11 using March 2013 Peerless. 2.3% gain shorting - using new unreleased
Peerless
DJI fell 5% to the lower band It broke the rising 65-dma.
In August it shot up to 3 more months of new highs.
-------------------------------------------------------------------------------------------------------------------------------------------------
5/28/1946 LB 1.029 .329
64
-4
251
.269 43
.253
.142
1.053
Sell S5 and S4 using March 2013 Peerless.
A perfect head/shoulders pattern developed. The DJI dropped 22% to an October low.
22% gain shorting - using new unreleased Peerless
-------------------------------------------------------------------------------------------------------------------------------------------------
5/25/1972 LB 1.025 .279
-10
14
-20 ,004
-1 /222
/062
1.025
Earlier Sell S8 and S9 using March 2013 Peerless.
5.4% gain shorting - using new unreleased Peerless. DJI fell
only to the lower band and then
went tidewise until after Presidential Election, when it rose 10%.
====================================================================================
OLDER HOTLINES
====================================================================================
6/4/2013
New Peerless Sell S9B
There is still probably more
downside risk than upside potential. We will be lucky
if the DJI's rising 65-day ma
at 14900 holds up, given the lack of political leadership
in Washington and the fragile
state of the economic "recovery". What gives us some
hope is that the Accumulation
Index is still reasonably high and Bernanke may
act quickly to lower rates
again when the news of a further economic slow-down
next comes out. Today
"a Federal Reserve official said the U.S. economy
isn’t
strong enough to justify a reduction in stimulus measures." But what
if the
Fed is too slow to do this?
A further decline tomorrow would complete the
DJI's bearish head and
shoulders pattern of 18 days' length. It would also
complete the DIA's bearish
Closing Power head and shoulders. Head and shoulders
patterns in the DJI are often
the way the market adjusts to new, unexpected bearish news.
6/4//2013 ---> To Key Index and
Leading Stock Charts
Current Peerless Key Values
Date
DJIA
La/MA
AnnRoc P-I P-I ch
P^^
IP21 V-I
Opct
65PctChange
6/4/2013
15178 -76 .977 .159
-66 -104 -66 .076 -50 .022 ..071
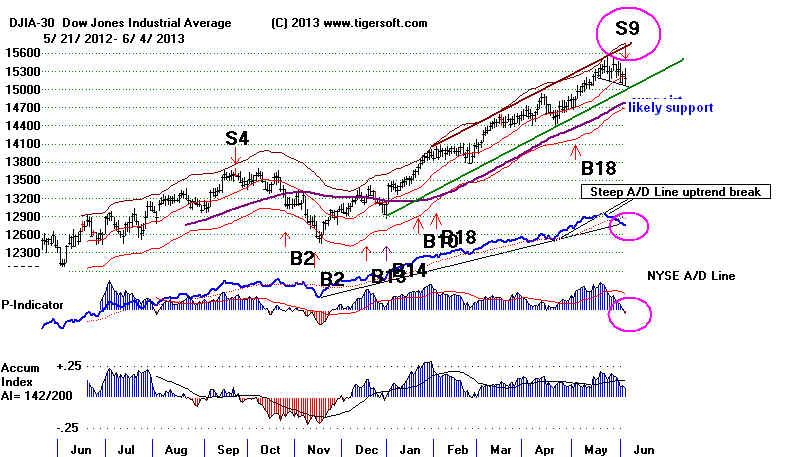
The P-Indicator has finally turned negative. Its turning negative after being
positive for more than 5 straight months produces this automatic signal.
"There have been 6
cases since 1929. The average DJI decline gain in the
five completed cases (of Sell S9b's) is 5.6% at the time of the next
Peerless Buy signal. In 3 of the 5 cases, there would have been a paper
loss between 2.8% and 3.1%." On average this would have meant
short
sellers of would suffer a 1.8% paper loss before there achieving a gain which would
have averaged 5.6%. This track record justifies Selling short DIA, I believe.
We do want to watch the Closing Power tomorrow for DIA to see if the
CP mini-head and shoulders pattern's neckline is broken. This would clearly be
a bearish development. The long-untested 65-dma is inviting a test. I have
to note, too, that Professionals are still bullish more stocks than they are bearish.
This causes me to adopt a wait-and-see policy regarding our long positions
of the very highest Accumulation stocks on our Tiger Stocks' Hotline. But
others should, I think, be sold. We can always rebuy positions when Peerless
next gives a Buy signal. Shorting DIA and some of the Bearish
MINCP Stocks
seems a good hedge right now.
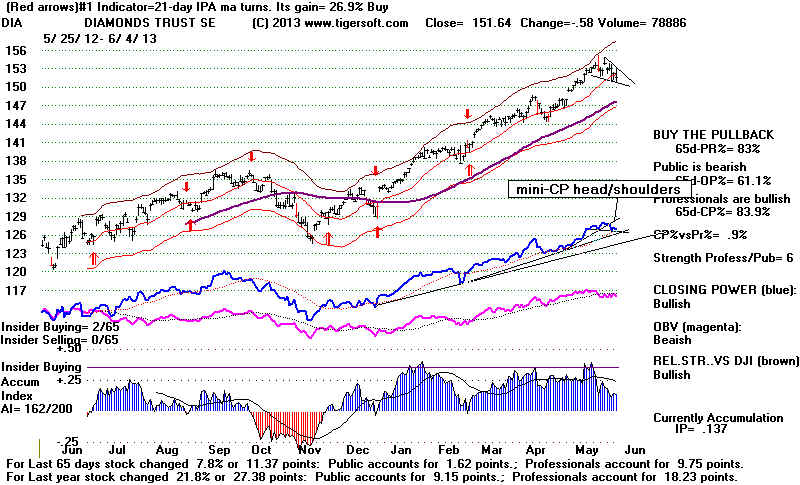
Besides Profit-Taking, What's Causing the
Decline?
The well-advertised decline here seemingly has resulted from fears that the Fed
may soon limit their buying of bonds and mortagages, which will result in a rise of
interest
rates. As a result many of the dividend paying stocks on the NYSE are much less
attractive.
If 10-year rates go up to 2.7%, which is my minimum target for 2013, a downward adjustment
in prices is needed simply to make them competitive again prospectively with Treasuries.
With prices declining, there is extra pressure now on dividend share owners to sell.
What Will Happen if The Economy Turns Down?
It is believed that the FED will see bad economic news in the weeks ahead
as reason to continue QE-III. But what if fiscal drag of automatic budget cuts
is greater than they expect. Premature budget
balancing caused the 47% crash
of 1937.
Can monetary policies alone overcome fiscal drag? Keynes showed
elementary Fear, "an animal spirit",
can be a more powerful economic force
than free-market promoters want to admit.
The real reason for the decline may go way past a rise in interest rates. With
Washington badly stalemated even when the weather is mild, when it gets
really hot and humid in DC this Summer because of global warming, I can easily
imagine tempers flaring. Political fighting and ideological stubborness could reach
new highs. With politicians strutting to make favorable impressions on their
bases
in preparation for the mid-term Elections next year, there may be no compromises,
only strident gridlock.
All of which could mean the US government will not have a planned budget for 2014.
Instead, many of the automatic spending cuts of "Sequestration"
will go into
effect. US
manufacturing is already in decline again. The $85 billion in government
spending cuts for the next 6 months will hit hard. If the economy weakens
further,
I doubt if there will be any changes in fiscal or trade policies to stimulate the economy.
The danger is that we could even find ourselves in another politically caused
Depression; the first being 1937-1938 when FDR
decided to start budget balancing
to head off
over-speculation and expected inflation right in the middle of what
was still a very
weak economic recovery. Bernanke and the Fed know of these
events. But monetary policy may
not be able to hold up the economy or the
stock market if
economic conditions worsen rapidly. As in 1928-1929 and in 2007,
the average person in the US still lacks enough buying power to buy what
is produced. Wealth
inequality in the US is well-known to be extreme. It is
largely
ignored by both parties. In this situation, over-production, lay-offs, deflation
and deficits may be entirely unavoidanle and only a matter of time. I've shown that
the
stock market can rise a long time when unemployment is high, but there ARE limits.
We may have reached them. Once the stock market's momentum turns down,
things could rapidly get out of hand and worsen much more quickly than the Fed
or the isolated DC politicians realize or are be able to prevent. This makes the
downside risk greater than upside potential now.
1937's Top and Plunge
The technical condition of the stock market now is much better than it was
at its August 1937 top. But we should be aware of the dangers of such a top
happening again given the fragile nature of the recovery and the failure
of political leadership in Washington.
1937 and The 47% DJI Free-Fall
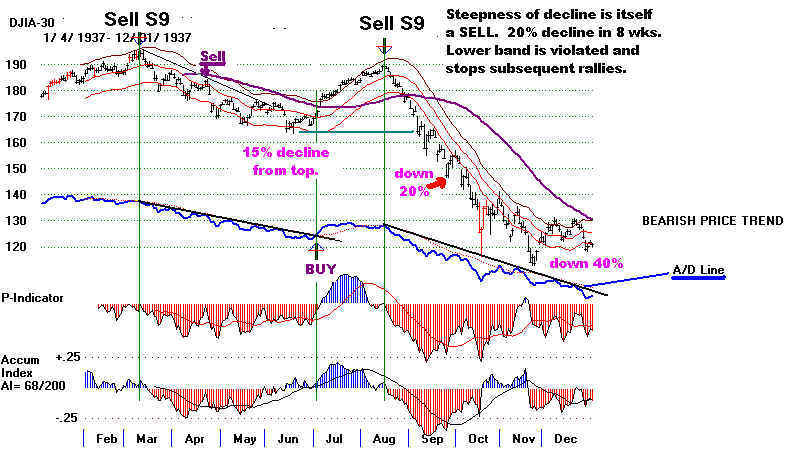
Watch The A/D Line and The V-Indicator Trends
The well-tesed NYSE A/D Line uptrends was broken today for the same reason.
This has its own bearishness. Such breaks have their own own followoers.
A/D Line trendbreaks used to be treated as Sell S6's by Peerless back in the
1980s before Windows made an automatic Peerless possible. Our special S9
signal
is not new. It has been used since 2003 or 2004. Below is the 2006
Peerless chart.
I placed the V-Indicator at the bottom of the chart to show another indicator
traders should watch.
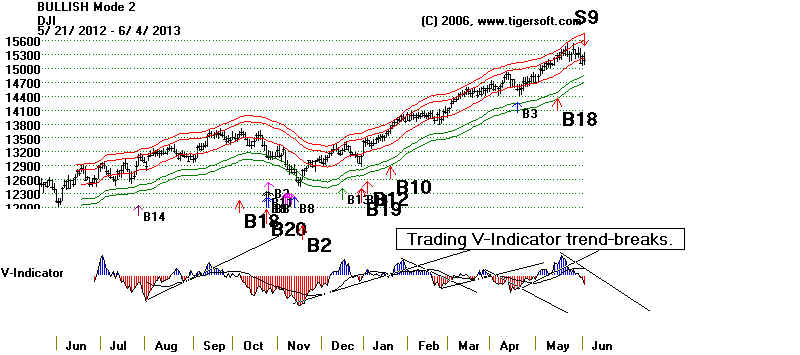
---> 278 MAXCP stocks Bullish MAXCP Stocks (6/4/2013) Bullish
plurality
---> 148 MINCP stocks Bearish
MINCP Stocks (6/4/2013)
Note the many leveraged Bearish ETFs here and
how weak their Closing Powers are.
This shows Professionals are bullish. Definitely not bearish here.
---> 98 New Highs on NASDAQ 6 new
lows. Bullish plurality
---> 38 New Highs on NYSE 169 new lows.
Bearish plurality
-------------------------------------------------------------------------------------------------------------------------------------------------------
OLDER HOTLINES
-------------------------------------------------------------------------------------------------------------------------------------------------------[
6/3/2013 Peerless Remains on A Second Buy B18
The Falling Closing Power Trend warns that a retreat back to 14800 may
be needed for the DJI.
In addition, now we have to be concerned that Peerless will give a Special S9 signal.
The P-Indicator stands at only +38 tonight. It fell 91 from Friday. Its
turning
negative tomorrow would likely bring a a Special Sell S9. That is likely to
happen because the data being dropped off in the creation of the P-Indicator,
the 21-day ma of advances-declines on NYSE, is +1392. If my math is
right, the P-Indicator will turn negative unless there are more than 574
up than down on NYSE. Usually these signals bring declines of 3% to 6%.
There is hope. Tuesdays have been up something like 17 straight weeks.
For DIA, they have been up 71.9% of the time for the last year.
Current Peerless Key Values
Date
DJIA
La/MA
AnnRoc P-I P-I ch
P^^
IP21 V-I Opct 65PctChange
6/3/2013
15254 +138 1.003 .331 +38 -91 +38
.098 -19
.12 ..079
The rising 65-dma at 14800 should be good support.
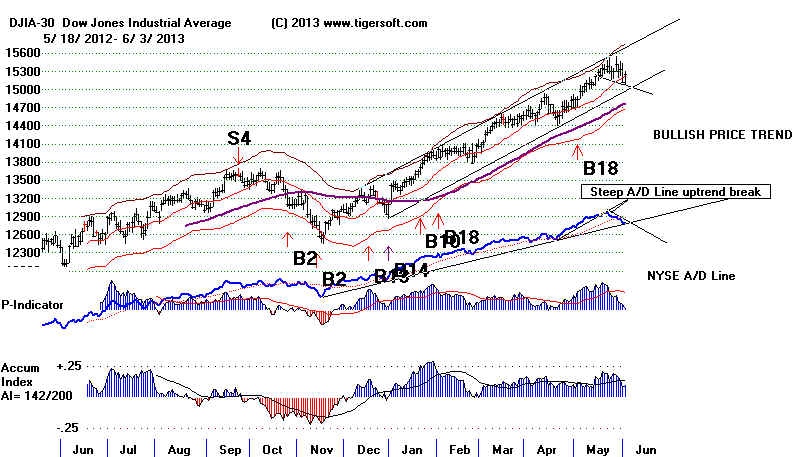
SPY's Accumulation Index shows underlying support.
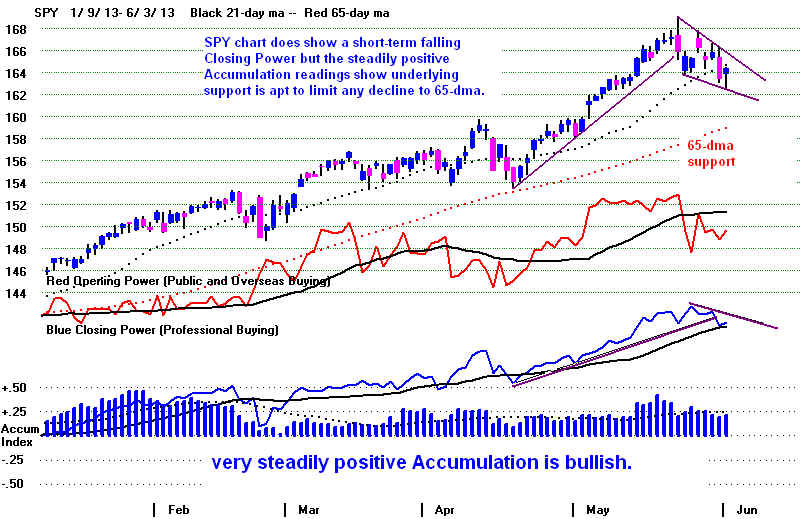
The DJI rose 138 points today and got back above the 21-day ma, but the
advance looked artificial and contrived in that there were 318 more stocks
down than up on the NYSE. Such internal weakness happens when the market
becomes defensive or when it is being rigged to give the appearance of normalcy.
The continued sharp drop in municipal bonds is not normal. Below is the
TigerSoft Bond Fund chart.
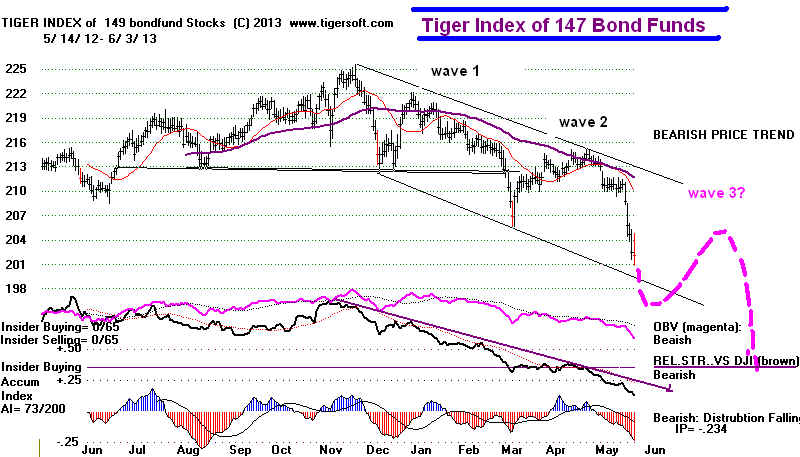
The adjustment to a less subsidized bond market is unavoidably painful. The
weakness in the municipal mond market is so pronounced, one has to wonder
if the tax-exempt status of their dividends may become an active political issue,
perhaps a bargaining chip the White House might use in budget talks with
the House Republican meat-cleaver crew. The question remains open whether and
how much the bearish adjustment in bonds will impact the equities' market.
(Reuters 4/10/2013) - U.S.
President Barack Obama
in his budget ... proposed capping
the value of the tax exemption for interest paid by municipal bonds,
suggesting
once again a way to raise revenues that has rattled the $3.7
trillion municipal bond market
for more than a year.
According to a summary released by the White House, in his budget
proposal for fiscal 2014 Obama would limit the value of tax benefits for the top 2 percent
of earners to 28 percent from the current 35 percent.
We came very close to having the P-Indicator turn negative after being positive
for six straight months. If that had happened, we would have gotten a Special Sell
S9
because the DJI did close back above its 21-day ma. Special Sell S9s can
only occur when the ratio of the DJI's close to the 21-day ma is above +.989.
Special S9s need to be documented separately from Sell S9s. Below are the
five cases. Mostly they bring a decline to the lower band. But in 1971 when
President Nixon was about to stop backing the Dollar with gold and declare
price and wage controls, we also got one of these signals. After a head/shoulders
pattern in the 1971 case, the DJI fell more than 11.9%. I mention this
because it is possible that there will be a change in Fed policies or there
may ne another budget stand-off between the President and the House Republicans.
Special S9s: 1929-2013
S9<B> #1 6/7/1943 141.8 Subsequent Decline = 3.9%
Paper loss = 2.8%
12/18/1942-6/7/1943 5 months and 2 weeks
LA/MA
ANNROC P
P^^
IP21 V-I
Opct
1.016 .248
-11 -34 -55
.012 -113
-.035
DJI declined to a poitt 1.5% below
21-dma, and then rallied to a nominal new high
and then declined below lower band.
No Paper loss.
 S9<B> #2  5/6/1971  937.39 Subsequent Decline= 11.9% No Paper loss.
  11/27/1970 - 5/7/1971  5 months and 2 weeks
    LA/MA     ANNROC     P          P^^      IP21     V-I         Opct
          .999         .313           -15  -34   -32      .076       -1           .279
         Head and shoulders breakdown followed this S9B.  DJi fell below the lower band. No Paper loss.
 S9<B> #3     4/29/1986  1825.89 Subsequent Decline= 3.6% No Paper Loss
   10/15/1986 - 4/29/1986  6 months and 2 weeks
    LA/MA     ANNROC          P         IP21       V-I         Opct
          1.01         .048              -1        .049       -9          .112
          Reversed:    1826.07 7/9/86
 S9<B> #4 S9    2/20/2004   10619.03 Subsequent Decline = 6.1% Paper loss = 2.8%
   8/18/2005 - 1/24/2005  5 months and 1 week
   LA/MA      ANNROC          P                    IP21         V-I         Opct
   1.028   .175     -9         .018   -148   .079
   Reversed:  9968.51  5/18/04   B2
 S9<B> #5 S9  1/5/2007 12398.01 Subsequent Decline = 2.3%     Paper loss = 3.1%
   7/19/2005 - 1/5/2007 5 months and 2 weeks
   LA/MA       ANNROC          P                    IP21         V-I         Opct
   1.021   .11      -8        .017   -119   .112
   Reversed:  12207.59  3/6/07    B19
---> 166 MAXCP stocks Bullish MAXCP Stocks (6/3/2013) Bullish
plurality
---> 115 MINCP stocks Bearish
MINCP Stocks (6/3/2013)
Note the many leveraged Bearish ETFs here and
how weak their Closing Powers are.
This shows Professionals are bullish. Definitely not bearish here.
---> 42 New Highs on NASDAQ 8 new
lows. Bullish plurality
---> 28 New Highs on NYSE 25 new lows. Bullish plurality
=====================================================================================
OLDER HOTLINES
=====================================================================================
5/31/2013 Peerless Remains on A Second Buy B18
The DJI futures were up over 60. Now just 15. With the SPY Closing Power in
a minor downtrend, we have to worry about what will happen after the opening.
The best support will likely be at the rising 65-dma. I doubt if interest rates
will be able to hold where they are now. A continued rise will continue to put more
pressure on dividend-paying stocks. However, I doubt if high Accumulation stocks
like GRA (AI/200=200!) will suffer much. The Closing Power up-trendbreak
and the now falling minor CP trendline are short-term bearish.
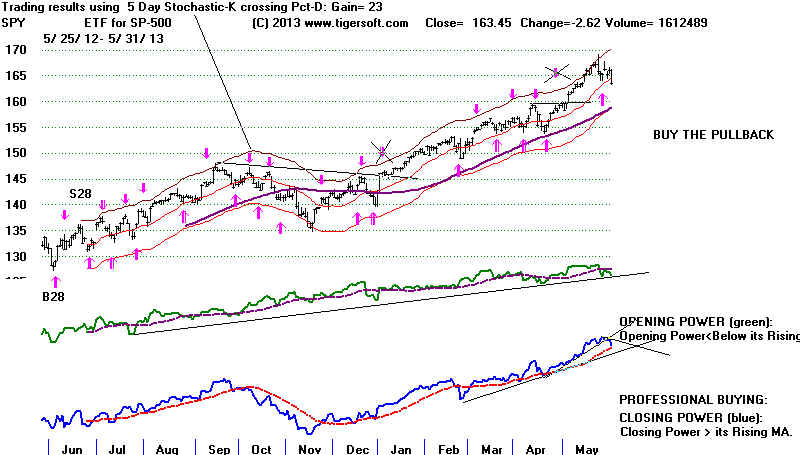
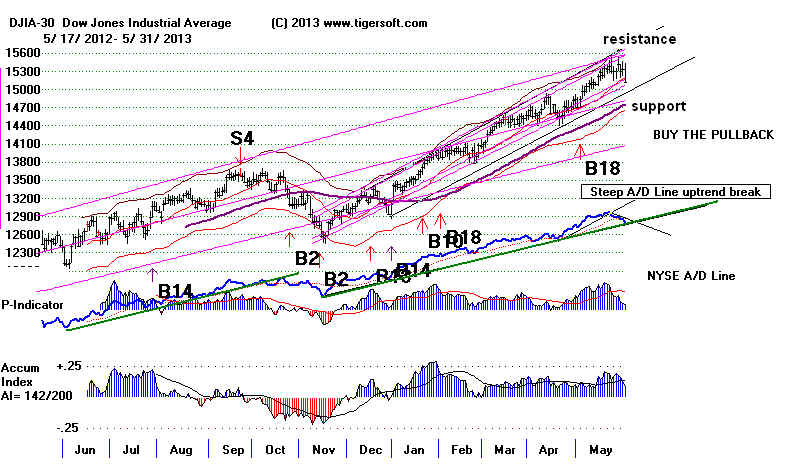
The second
Peerless buy B18 typically brings a gain of more than 10%. Here that
would mean
a DJI move past 16000. If there is a further decline, it will probably
be stopped
near the rising 65-dma near 14770. There have been 9 late May/June
tops since
1945 without a timely Peerless Sell from which the DJI fell down to the zone
between the
lower band and the 65-dma A deeper decline has always required
a Peerless
Sell and/or a head/shoulders pattern. More important, a continuing
DJI advance
is still likely after this decline is over. The DJI advanced in 33
of the
years since 1945 above its May-June highs.
So, it it
signifcant that there has been no Peerless Sell yet. There was no Sell S4
when last
week the DJI's Accumulation Index dropped below its ma. The reason
was that in
the year after a Presidential Election in April or May, it does not pay to sell
less than
2% above the 21-day ma even when the V-Indicator was as low as +8,
as it was
on 5/30/13. In fact, this would have failed in 1961 and 1989. What
happens
most times on a Sell S4 at this time, from April to June, is that the DJI
is 2% to
3.6% over the 21-day ma and the OBVPct is negative on a Sell S4.
The Next Peerless Sell
In the 68 years since 1945, there have been 24 tops from Mid May to
the end of June.
In 33 years the DJI kept tising. This makes the odds of a June top something like
24/(24 + 33) or 38.9%.
Of
course, we could still get a Sell S4 on the failure of a weak rally this month
if
the DJI's Accumulation drops below its 21-day ma, the DJI is 2% above the
21-day ma and the OBVPct is below 0. We could also get a Sell S15 if the
the
DJI were to rally above the upper 2.5% band and the V-ndicator is negative.
Another possibility would be a Special Sell S9 if the P-Indicator drops below 0
and
the DJI is above its 21-day ma provided the P-Indicator has stayed positive
105
or more straight days. As the the P-Indicator has been positive 6 straight months,
more
than 120 straight days, since late November, there would seem to be little
the
market can do to avoid another Sell, except to drop a little further and have the
P-Indicator turn negative with the DJI below the 21-day ma. .
Current Peerless Key
Values
Date
DJIA
La/MA
AnnRoc P-I
P-I ch P^^ IP21
V-I
Opct
65PctChange
5/31/2013 15116
-209 .995 .325
+1 28
-36 +128
.085 -11
.139 .094
5/31//2013 ---> To
Key Index and Leading Stock Charts
---> 234 MAXCP stocks Bullish MAXCP Stocks (5/31/2013) Bullish
plurality
---> 136 MINCP stocks Bearish MINCP Stocks
(5/31/2013)
Note the many leveraged Bearish ETFs here and
how weak their Closing Powers are.
This shows Professionals are bullish. Definitely not bearish here.
---> 43 New Highs on NASDAQ 14
new lows. Bullish plurality
---> 22 New Highs on NYSE 119 new lows.
Bearish plurality
The Rise in Interest
Rises Is Probably Far from Over.
2.7% on Ten Year Treasuries looks like a reasonable chart objective for this Summer.
This would be a 50 basis point rise and drop bond funds perhaps 8% more.
Professionals are not done selling bonds, I think. We can watch the rising trend
of the Closing Power in TNX to judge that. When we think back how far
gold and silver stocks fell, after they showed heavy red distribution, top patterns
and falling Closing Powers 4 months ago, I think we have to remain very
bearish now on bonds, especially municipal bonds. The most bearish
bond fund is NNJ. This should still be shorted, I believe.
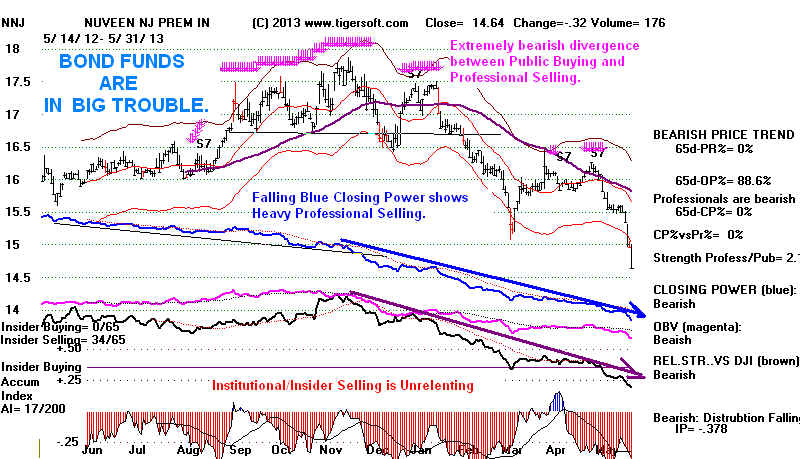
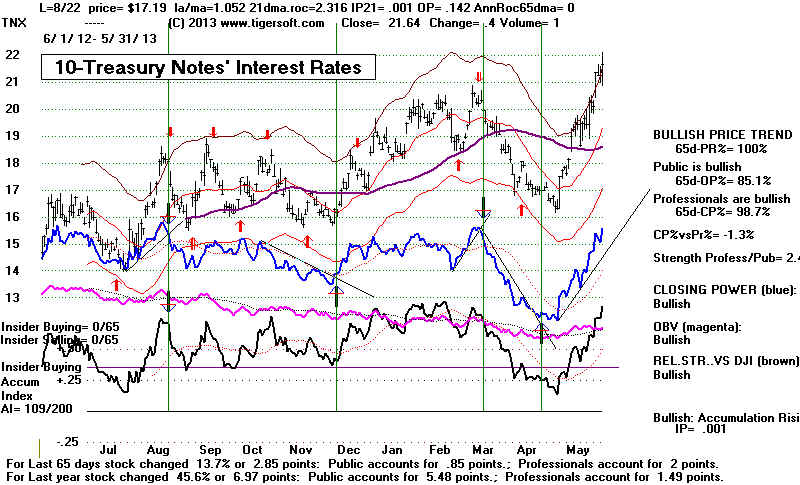
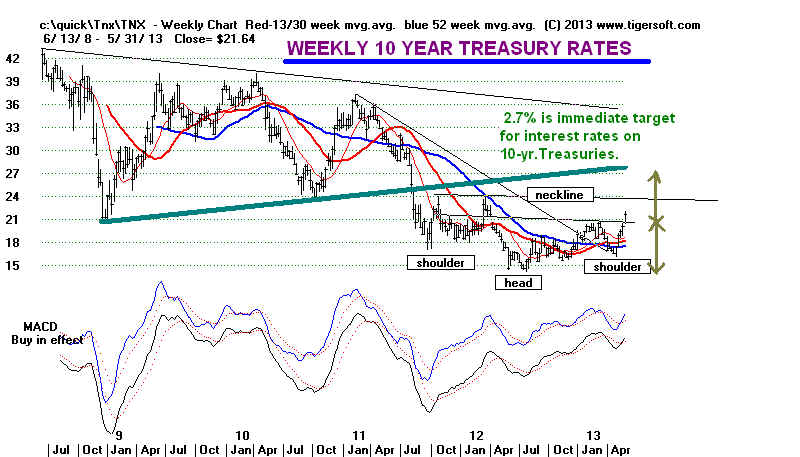
A Rise in Rates, above 3%, Seems Unlikely This Summer.
The rise in interest rates was inevitable
and even predictable, judging fron the heavily
red (negative) and falling Closing
Powers. But the big bank stocks keep rising. In
1987, when the stock market crashed in
the Fall as Greenspan slammed on the brakes
too hard, JPM was going sidewise in a
rising general market. JPM is today the
highest AI/200 stock in the DJI-30.
The financial elites on Wall Street are
not concerned that interest rates will suddenly run
upwards so much that it will wreck either
the recovery or the stock market's bullish run.
The Fed's Governors ARE
these same elites. They could be wrong, of course, like they
were in 2005 and 2006, but it seems
highly unlikely that the Fed will panic and push up
rates up too fast like Greenspan did in
1987 or when he talked the market down 10%
in the first quarter of 1994 out of a
misplaced fear of inflation.
The real problem is that the Fed may lose
control for either of two basic reasons. This could
happen if economic growth causes the
general demand for money to push up rates faster
than is epected. Most important
here will be new economic US reports and whether the
pace of the US economic receovery
quickens. In that case, rates will rise, regardless of
Fed wishes. Countering such
forces, the world economy is not exactly booming. Eurozone
unemployment stands at 12%. This
may cause Europen central bankers to relent and
lower rates, like Japan has done, which
would tend to hold back any rises in rates here.
A second possibility that would cause
rates to rise very fast would be if China or some other
country with a very large holding of US
Treasuries starts to do some significant selling.
Since such selling could get out of
control and wreck world trade which China depends upon,
I think this development is most
unlikely.
----------------------------------------------------------------------------------------------------------------------------------------------------------
OLDER HOTLINES
---------------------------------------------------------------------------------------------------------------------------------------------------------
5/30/2013 Peerless Remains on A Second Buy B18
Watch to see if the DIA/SPY/QQQ Closing Power uptrends are violated tomorrow. That
would suggest Professionals are becoming net-sellers of the major market
ETFs. The A/D Line has definitely weakened this week. A short-term
pullback
to 15000 does seem likely unless the FED says something to calm those who are
afraid of higher interest rates sooner than previouslyu expected. If 15000
does not hold,
the rising 65-dma at 14700 should be very good support and bring a Buy B11.
The study
here of the 6 May-June tops since 1945 that did bring a DJI decline below the lower
band
shows
that a Peerless Sell Signal should be expected first. In additon, the recent values
for
the P-Indicator, V-Indicator and IP21 on the highest closing of this rally,
yesterday,
were
all above the highest values at these 6 important earlier tops. So, while a
decline to the 65-dma cannot be ruled out even though Peerless has given no Sell,
a
bigger decline should not be considered likely.
The study below shows Peerless gave a Sell signal near the late-May-June
top in
14 cases where the DJI then declined to at leas the lower band.but in 9 cases it
did not. There were no cases of DJI declines from a late-May-June top without
there being a timely Peerless Sell. (Add 6/1/2013)
We do want to watch next week to see if the Accumulation Index violates its 21-day
ma.
May violations do not produce reliable Sell S4s on such breaks, but
Junes can.
More on this Sunday night.
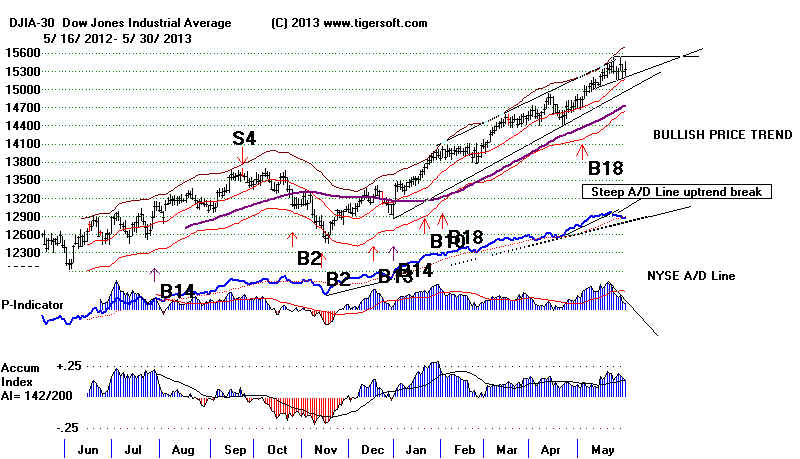
5/30//2013 ---> To Key Index and Leading Stock
Charts
---> 367 MAXCP stocks Bullish MAXCP Stocks (5/30/2013) Bullish
plurality
---> 91 MINCP stocks Bearish MINCP Stocks
(5/30/2013)
Note the many leveraged Bearish ETFs here and
how weak their Closing Powers are.
This shows Professionals are bullish. Definitely not bearish here.
---> 87 New Highs on NASDAQ 6
new lows. Bullish plurality
---> 96 New Highs on NYSE 48 new lows.
Bearish plurality
Any decline should be shallow. We have to remain bullish on an
intermediate-term
basis because the second Peerless Buy B18 in 84 days reliably forecasts an additional
10%+ advance on the DJI. That would take the DJI above
16000.
For now, the Closing Powers for DIA, QQQ
and SPY are still rising. This tells us that
Professionals are still net buyers. That there are still 4x more MAXCP stocks than
MINCP stocks shows that Professionals are having no trouble still deploying funds.
And if you look at the Bearish MINCP stocks, you again will see that it is mostly not
stocks which Professionals are selling or shorting among the most distributed investment
vehicles. Rather the Bearish MINCP stocks
tonight are mostly bearish ETFs on the
general market, financials and bond funds.
It's true the P-Indicator has slipped a lot, because dividend plays are now
less attractive than they were before the Fed's Minutes warned that QE-3 might
be reduced as early as June. But, the P-Indicator is not yet negative and the
DJI has not run to a false new high 2.5% over the 21-day ma with breadth lagging badly.
The Tiger Accumulation Index on the DJI stands at +.137. This is still high enough
allow
us to expect that 15000 on the DJI will hold up if tested.
Bears quoted in the news are making the mistake, I think, of saying that the stock market
has risen too far ahead of the economic recovery. I explained a few weeks ago that
history
shows that the stock market can get ahead of an economic recovery for two
or more years, if we consider the 1927-1929 as such a period. This is actually
normal.
When investment opportunities in business ventures are not plentiful, wealthy investors
naturally put their money into the more conservative stocks that make up the DJI and
SP-500. When American consumers aren't, or can't, buy what is produced,
multinationals
switch their whole operations overseas or buy out competitors in the stock market.
Current Peerless Key
Values
Date
DJIA
La/MA
AnnRoc P-I
P-I ch P^^ IP21
V-I
Opct
65PctChange
5/30/2013 15325
+22 1.01 .381
+166
-20 +166
.137 +8 .139
.094
The greatest risk now is that the Fed will hit the brakes too hard in quitting QE-III,
much like Greenspan did
in the late Summer of 1987. With computerized trading
even more dominant now, we do have to be vigilant. The first warning back then
was the 1/2%+ rise in the Federal Funds rate in July and August 1987. The second
was the Accumulation Index falling below its 21-day ma. The third was the failure of
banls
stocks then to stay above their flat or falling 65-dma. And the fourth, of course, was the
Sell S9/S12 Sells on a false rally to the upper band in October. The DJI then fell
33% in less than 3 weeks. How close are we to meeting these considtions again?
The DJI now, as in 1987, has rallied a long way. But in 1987, the DJI kept
rising until August. Gold stocks rallied steadily the first 9 months of 1987.
Clearly,
that is not true now. Another difference is this year, the bank stocks are among
the leaders. JPM is the highest AI/20 stock in the DJI. Thirdly, Bernanke is
now
much more experienced than Greenspan was in 1987. So, though the DJI's
Accumulation Index might break below its 21-day, I think the odds still favor
more new highs.
We do want to look ahead into the market's typical behavior in June. The DJI tends
to rally for the first 7 or 8 trading days of June, but then reverses course and
loses that gain.
As you can see below, in the 68 years since 1945, there have been 24
tops from Mid May to
the end of June. In 33 years, a rising DJI continued past June. This suggests
the odds
are about 4:3 of June not bringing a decline to the lower band.
Only 6 of the April-June tops brought declines below the lower band: 1948, 1960,
1969, 1974,
1981 and 2001. Here were the Peerless signals on these occasions.
P-I^^ IP21 V-I
6/14/1948 Sell S2. Sell S11. Head/Shoulders.
237
.106
62
6/12/1950 Sell S5
Head/Shoulders 120
.176 -50
6/9/1960 Sell S2
Head/Shoulders 211
.123 -36
5/15/1969 Sell S9 Sell S8
179 .111
0
6/7/1974 Sell S9 Sell S12
-137
-.074 -2
6/15/1981 Earlier S15
254
-.001
3
(5/28/2013
no sells
341 .180
33)
Gold Stocks Still Look Good.
Let's Watch DUST.
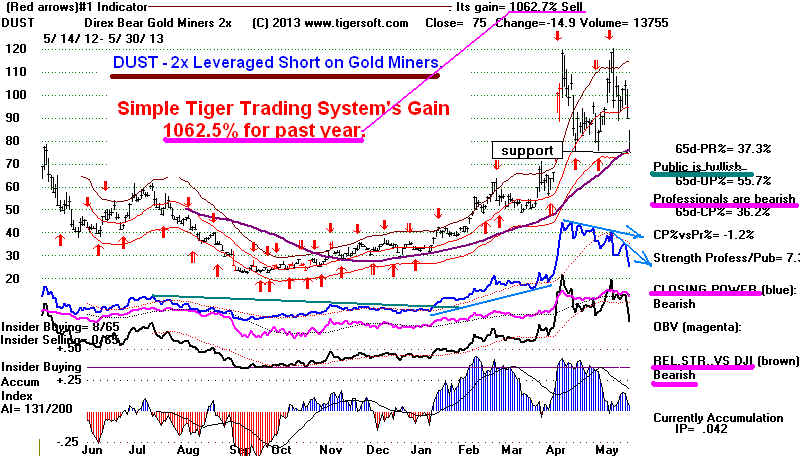
Late May
and June Tops since 1945
Date
Result la/ma
21-dma-roc P-I P-ch P^^
IP21 V-I Opct
65-day
la/65 dma
Pct Change
------------------------------------------------------------------------------------------------------------------------------------------------
5/28/1945 LB 1.018
.31
9
6
41
.031 -58 .156
.057
1.046
(Sell S8 and S11 using March 2013 Peerless.)
2.3% gain shorting - using new unreleased Peerless
-------------------------------------------------------------------------------------------------------------------------------------------------
5/28/1946 LB 1.029 .329
64
-4
251 .269
43 .253
.142
1.053
(Sell S5 and S4 using March 2013 Peerless.)
22% gain shorting - using new unreleased Peerless
-----------------------------------------------------------------------------------------------------------------------------------------------
6/14/1948 <LB 1.012
.507
55
-18 237
.106 62
.165
.153
1.058
(Sell S2 and S11 using March 2013 Peerless.)
5% gain shorting - using new unreleased Peerless
-------------------------------------------------------------------------------------------------------------------------------------------------
6/12/1950 -<LB 1.027
.520
33
-3
120 .176 -50
.33
.129
1.061
(Sell S5 and earlier S9 using March 2013 Peerless.)
9,1% gain shorting - using new unreleased Peerless
----------------------------------------------------------------------------------------------------------------------------------------------------
6/18./1951 LB 1.017 -.038
-42
-31 -128
-.014 -171 -.192
.036
1.006
(S9 using earlier using March 2013 Peerless.)
6.4% gain shorting - using new unreleased Peerless
-------------------------------------------------------------------------------------------------------------------------------------------------
6/1/1959 -to 65dma 1.019 .347 -57
-11 -167
-.012
-395 .138
.068
1.039
(No Peerless Sell using March 2013 Peerless)
2.4% gain shorting - using new unreleased Peerless
-------------------------------------------------------------------------------------------------------------------------------------------------
6/9/1960 <LB
1.048 .985
74
13
211
,123 -36 .617
.095
1.060
(Sell S2 and earlier S9 using March 2013 Peerless.)
5.8% gain shorting - using new unreleased Peerless
----------------------------------------------------------------------------------------------------------------------------------------------------
5/22/1961 LB 1,02 .298
56
-10
165
.005 -72 -.055
.077
1.035
(No Peerless Sell using March 2013 Peerless)
-------------------------------------------------------------------------------------------------------------------------------------------------
6/3/1963 LB 1.007 .085
59
-9
159 -.043
071 -.184
.095
1.035
(No Peerless Sell using March 2013 Peerless)
-------------------------------------------------------------------------------------------------------------------------------------------------
5/15/1969 <LB
1.022 .527
75 14
170
.111 0 .222
/018
1.039
17.5% gain shorting - using new unreleased Peerless
-------------------------------------------------------------------------------------------------------------------------------------------------
5/25/1972 LB 1.025 .279
-10
14 -20
,004 -1
/222
/062
1.025
(Earlier Sell S8 and S9 using March 2013 Peerless).
5.4% gain shorting - using new unreleased Peerless
--------------------------------------------------------------------------------------------------------------------------------------------------
6/7/1974 <LB
1.033 .039 -77
39 -137 -.074 -2
.030 -.030
1.006
(Sell S9 and earlier S12 using March 2013 Peerless.)
27.1% gain shorting - using new unreleased Peerless
--------------------------------------------------------------------------------------------------------------------------------------------------
6/7/1978 LB 1.02
.527 90
2
199
.06
3
.296 .160
1..082
(Sell S8 and S5 using March 2013 Peerless.)
5.4% gain shorting - using new unreleased Peerless
------------------------------------------------------------------------------------------------------------------------------------------------
6/15/1981 <LB 1.02
.469
146
0
254
-.001 3 .012
/022
1.018
(2 months' earlier Sell S15 using March 2013 Peerless)
-----------------------------------------------------------------------------------------------------------------------------------------------
6/21/1983 LB 1.025 .564
76
11
151
.115 4
.361
.116
1.049
(No Peerless Sell using March 2013 Peerless)
------------------------------------------------------------------------------------------------------------------------------------------------
6/24/1988 LB 1.028 1/042
191
-14
329 .177 30
.255
.036
1.033
(No Peerless Sell using March 2013 Peerless)
-----------------------------------------------------------------------------------------------------------------------------------------------
6/3/1991 LB 1.035 .383
80 -13 148
.135 1
.376
.053
1.037
(No Peerless Sell using March 2013 Peerless)
S3 on 5/31/1991 gained 4% using unreleased Peerless
---------------------------------------------------------------------------------------------------------------------------------------------
6/1/1992 LB 1.01 .191
39 -22
99
.022
-6 .002
.043
1.033
(2 months' earlier Sell S9 and S15 using March 2013 Peerless)
-----------------------------------------------------------------------------------------------------------------------------------------------
6/15/1994 LB 1.008 .377
191
-1
296 .147 12
.338
-.019
1.017
(Sell S15 a month earlier using March 2013 Peerless.)
-----------------------------------------------------------------------------------------------------------------------------------------------
5/22/1996 LB 1.036 .405
125
-1
150 -.058 25 .265
.058
1.034
(Sell S1 using March 2013 Peerless.)
-------------------------------------------------------------------------------------------------------------------------------------------------
5/21/2001 <LB
1.41 .932
410 91 400
.151 78
.092
.041
1.090
(Sell S4 and S11 using March 2013 Peerless.)
--------------------------------------------------------------------------------------------------------------------------------------------------
6/23/2004 LB 1.018 .594
444
9
416
.166 110
.179
.028
1.020
(No Peerless Sell using March 2013 Peerless)
--------------------------------------------------------------------------------------------------------------------------------------------------
6/12/2009 LB 1.028 .718
394 104 367
.079
-2 .145
.269
1.092
(Sell S9 and S8 using March 2013 Peerless.)
---------------------------------------------------------------------------------------------------------------------------------------------------
6/17/2010 LB 1.028 -.09
92 80
89 .038 -107 .115
-.024
.978
(Sell S9 and S12 using March 2013 Peerless.)
-----------------------------------------------------------------------------------------------------------------------------------------------------
4/24 6/24 12/24 |
There were many years where the market rallied past
June.
ALL YEARS' MAY and JUNE TOPS
la/ma 21-dma-roc
P-I P-ch P^^
IP21 V-I
Opct 65-day
la/65 dma
Pct Change
------------------------------------------------------------------------------------------------------------------------------------------------
5/28/1945 LB 1.018
.31
9
6
41
.031 -58 .156
.057
1.046
5/28/1946 LB 1.029 .329
64
-4
251 .269
43 .253
.142
1.053
1947 - rally until 7/24
6/14/1948 <LB 1.012
.507
55
-18 237
.106 62
.165
.153
1.058
1949 - rally from June low for 12 months
6/12/1950 -<LB 1.027
.520
33
-3
120 .176
-50 .33
.129
1.061
6/18./1951 LB 1.017 -.038
-42
-31 -128
-.014 -171 -.192
.036
1.006
1952 - rally until 8/11
1953 - falling until Sept.
1954 - rising all year
1955 - rally untul 7/6
1956 - rally until 8/3
1957 - rally until 7/12
1958 - rally all year
6/1/1959 -to 65dma 1.019 .347
-57 -11 -167
-.012 -395 .138
.068
1.039
6/9/1960 <LB
1.048 .985
74
13
211
,123 -36
.617 .095
1.060
5/22/1961 LB 1,02 .298
56
-10
165
.005 -72
-.055 .077
1.035
1962 bear market until October
6/3/1963 LB 1.007 .085
59
-9
159
-.043 071
-.184 .095
1.035
1964 rallied steadily until November
1965 rallied from June bottom for rest of year.
1966 bear market
1967 rally until Sept top
1968 rally until 7/11 top
5/15/1969 <LB
1.022 .527
75 14
170
.111
0 .222
/018
1.039
1970 from May bottom, DJI rallied for rest of year.
1971 bear market
5/25/1972 LB 1.025 .279
-10
14
-20
/004 -1
/222
/062
1.025
1973 bear market
6/7/1974 <LB
1.033 .039
-77
39 -137
-.074 -2
.030 -.030
1.006
1975 rally until 7/15
1976 rally until 7/12
1977 bear market
6/7/1978 LB 1.02
.527 90
2
199
.06
3
.296
.160
1..082
1979 - rally until September
1980 rally until September
6/15/1981 <LB 1.02
.469
146
0
254
-.001 3
.012
/022
1.018
1982 - rally until October peak.
6/21/1983 LB 1.025 .564
76
11
151
.115 4
.361
.116
1.049
1984 - rally until August peak
1985 - rally until July peak
1986 - rally until July peak
1987 - rally until August peak
6/24/1988 LB 1.028 1/042
191
-14
329 .177 30
.255
.036
1.033
1989 - rally until Oct peak
1990 - - rally until July peak
6/3/1991 LB 1.035 .383
80 -13 148
.135 1
.376
.053
1.037
6/1/1992 LB 1.01 .191
39 -22
99
.022 -6
.002
.043
1.033
1993 rallied all year
6/15/1994 LB 1.008 .377
191
-1
296 .147 12
.338
-.019
1.017
1995 - rallied all year
1996
5/22/1996 LB 1.036 .405
125
-1
150 -.058 25
.265
.058
1.034
1997 - rallied until July
1998 - rallied until July
1999 - - rallied until July
2000 - rallied until August
5/21/2001 <LB 1.41 .932
410 91 400
.151 78
.092
.041
1.090
2002 bear market
2003 - up all year after March bottom
6/23/2004 LB 1.018 .594
444
9
416
.166 110
.179 .028
1.020
2005 - rallied until July
2006 - rallied until December after May bottom
2007 - rallied until July bottom
2008 - bear market after April
6/12/2009 LB 1.028 .718
394 104 367
.079 -2
.145
.269
1.092
6/17/2010 LB 1.028 -.09
92 80
89 .038 -107
.115 -.024
.978
2011 - rallied until July
2012 - rallied until Sept.
===================================================================================}
--------------------------------------------------------------------------------------------------------------------------------------------------------
OLDER HOTLINES
-------------------------------------------------------------------------------------------------------------------------------------------------------
5/29/2013 Peerless Remains on A Second Buy B18
Consider Finanlly Buying Some Junior Gold Stocks.
15000 should be good support, provided the DJI does not break cleanly
below that level on this decline. The medium-up-sloping Closing Powers
for the DIA, SPY and QQQ are still rising, though a weak closing below
their openings would violate their uptrends.
The decline in interest-sensitive and dividend-paying investments worsened today.
So much so, that the number of new lows on the NYSE rose to 86 even though
the DJI is less than 4% below its all-time high. This is partly the result of the
FED's
weakening determination to keep on applying QE-3 and partly the result of clear
signs of an improving US economy. Auto and Semi-Conductors are in powerful
uptrends. So, are home-builders and brokerages.
But unless the FED issues a statement that QE-3 will continue past June, I would
think the selling in bond funds, utilities and REITs will continue. There is
just too
much risk to hold these tightly. No fewer than 38 bond funds fell 3%
today.
This is bound to unnerve some of the holders of these normally quiet, safe and
defensive investments.
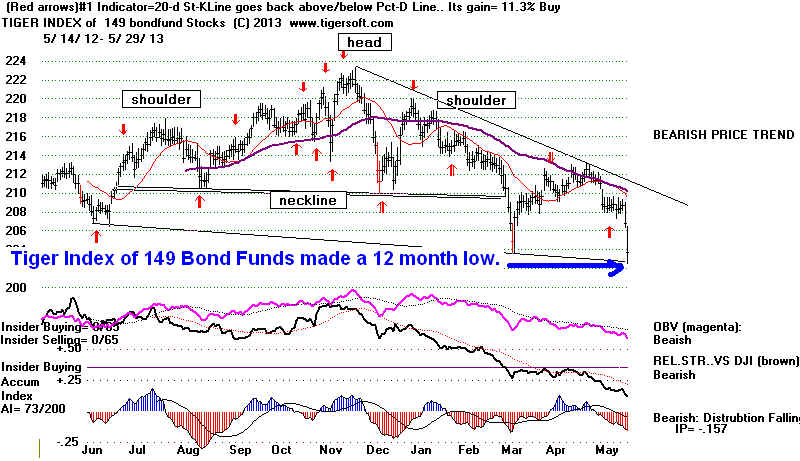
Gold Plays
A bond decliine is often caused by a rise in inflationary expectations, which
is what is normally needed to lift gold stocks. Sure enough, the beaten down
Gold and Silver mining stocks finally rebounded. After such a long decline,
it's hard not to believe there are not some very big bargains in this group. I
suggested
buying SSRI and ANV last
week. The biggest one-day gainers today deserve
attention, too: ARZ-T 4.09 +.42, TRX 3.00 + .31 and HL 3.80 +.37 (below).
Another way to play a junior hold stock rally is to sell short their leveraged short
ETF, DUST 89.9 -14.14. The 5-day stochastic signals have gained a whopping 935%
this past year on DUST. This is very volatile. So, be careful. A decline
by this
ETF below 75 would be quite bearish. The 65-dma there looks like it will be
quickly tested.
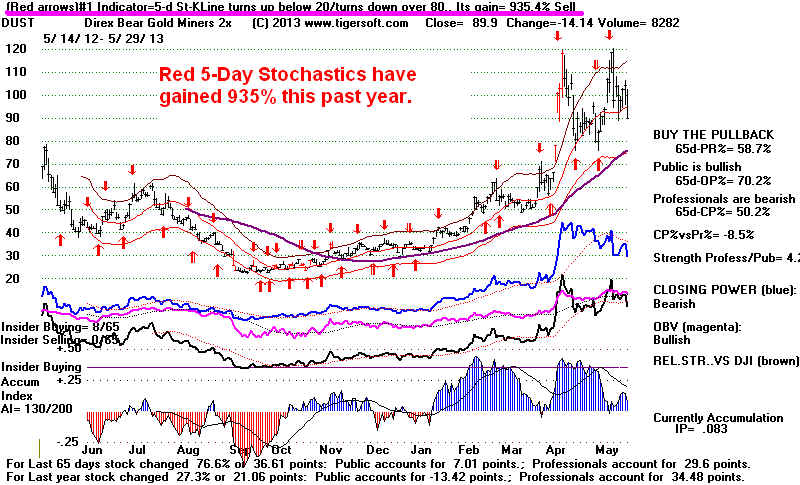
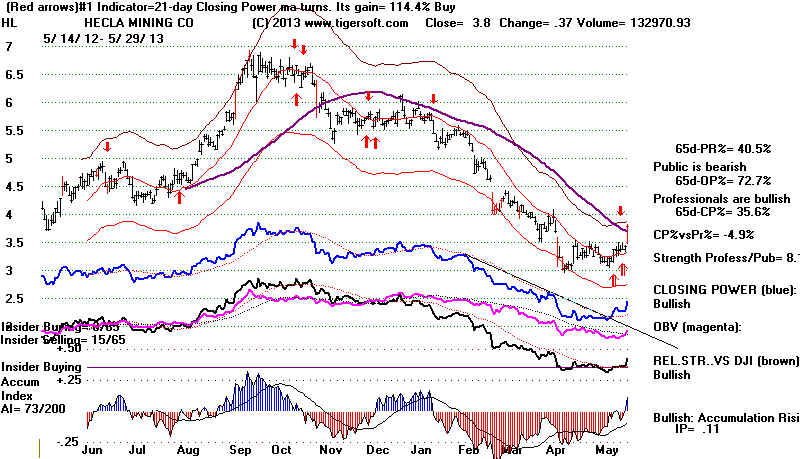
Warnings here about bond funds did not start this week. Our Stocks' Hotline
remains short some of the weakest Power Ranked bond funds.
The turns-downward
by Utilities and REITs
were hastened this week by their support levels being broken.
How much will this weakness hurt the major market ETFs? Without
a new Peerless
Sell signal I would think there will be ample support at 15000 where the DJI's
rising 65-dma crosses. A decline to it, that does not close below it, but tags it
will likely bring a Buy B11. When we study declines in the market at this time
of the year, we find that they tend to be shallow provided there is no Peerless
Sell signal, no head/shoulders pattern, the Accumulation Index is quite positive
and the 65-day rate of change is above -.042.
The decline in defensive, interest-sensitive stocks should not unduly effect
growth and take-over situations showing undimminished Accumulation and Professional
buying. As you can see from the Bullish MAXCP Stocks tonight, the end
result
of this decline may be that good growth stocks are left in stronger hands and they
will rise even faster as high performance funds focus more and more investment
sunds on fewer and fewer stocks.
Date DJIA
La/MA AnnRoc P-I
P-I ch
P^^
IP21 V-I
Opct
65PctChange
5/29/2013
15303 -107 1.01
.381 -156 +49
+185 .163 +8
.149
.092
high
5/29//2013 ---> To Key Index and Leading Stock
Charts
--->
258 MAXCP stocks
Bullish
MAXCP Stocks (5/29/2013) Bullish plurality
--->
112
MINCP stocks Bearish MINCP Stocks
(5/29/2013)
Note the many leveraged Bearish ETFs here and
how weak their Closing Powers are.
This shows Professionals are bullish. Definitely not bearish here.
---> 43 New Highs on NASDAQ 5
new lows. Bullish plurality
---> 32 New Highs on NYSE 86 new lows.
Bearish plurality
=====================================================================================
OLDER HOTLINES
=====================================================================================
5/28/2013 Peerless Remains on A Buy B18
The DJI and SP-500 lost a considerable part of their early gains. This
demonstrates resistance overhead. This makes an early pullback tomorrow
likely. But the Closing Powers are still rising. And in the past,
the DJI has tended to rise over the 10 trading days after
May 28th. It has risen 68.1% of the time since 1965. It is only after two
weeks
that it usually retreats. After the 7th of June, it falls 59.4% of the time over
the next two weeks.
Interest Rates are on the rise. Our view is that there is a lot more risk in bonds
than the low rates of return justify. Consider buying TNX (chart at bottom of
tonight's hotline), the short ETF on 20-year bonds.
The Opening Powers for SPY, QQQ
and DIA shot back up above their 21-day ma.
These ETFs' Opening Powers will need to stay above their moving averages
long enough to make these MA start rising if we are to enter Tiger's bullish "both
up"
modes.
The NYSE A/D Line may be a problem, too. It is starting to lag. Many advances
end in the Summer when the DJI makes a new high which is widely unconfirmed by
the A/ D Line. Clearly, it is the new selling wave in bond funds and other dividend
vehicles
on the NYSE which has caused the A/ D Line to lag. This will probably not
prevent another wave of speculative buying. Run the Power Ranker against
the
NewIssues data download for some ideas. The best of these stocks show very high
Accumulation (institutional and insider buying) and a steeply rising Closing Power.
See PFPT and FET below the Peerless DJI chart.
The best ways to time purchases of high Accumulation stocks in an uptrends are on:
1) trend-breaks of the trends of Relative Strength, Closing Power and Price;
2) Stochastic-5 Buys; 3) pullbacks to their rising 21-day ma, all so long as the more
gradual Closing Power is rising and the Accumulation Index recently was above +.375.
It did not take much to switch on the bulls' aggressive buying. Look at all the
high Accumulation Bullish MAXCP Stocks tonight.
Most of the Bearish MINCP Stocks
are leveraged short ETFs on the general market. All it took were generalized verbal
pledges by the Europeon and Japanese central bankers to economic expansion. The
suddenness of the move and way it faded at the end do suggest that there was a lot
of short-covering.
Date DJIA
La/MA
AnnRoc P-I
P-I ch P^^ IP21
V-I
Opct
65PctChange
5/28/2013
15409 +341 1.019 .55 +341
+49 +341
.180 +33
.24 .092
high
5/28//2013 ---> To Key Index and Leading Stock
Charts
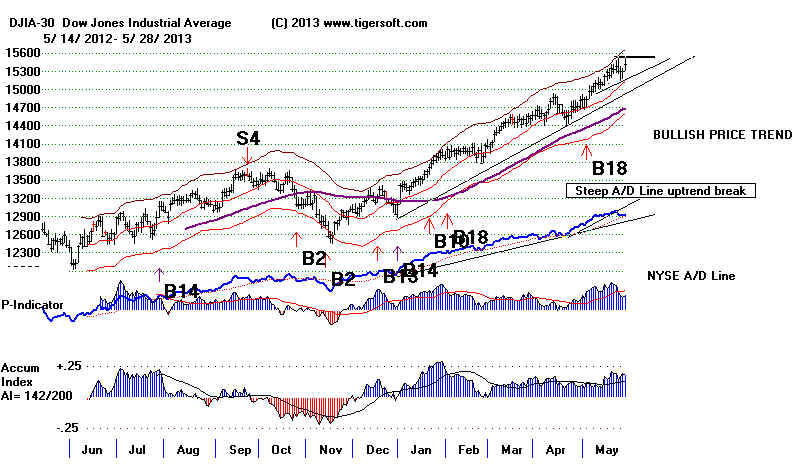
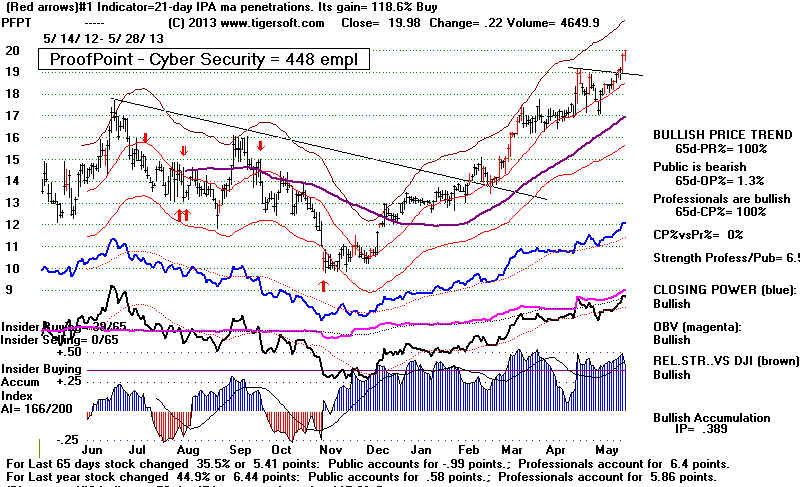 |
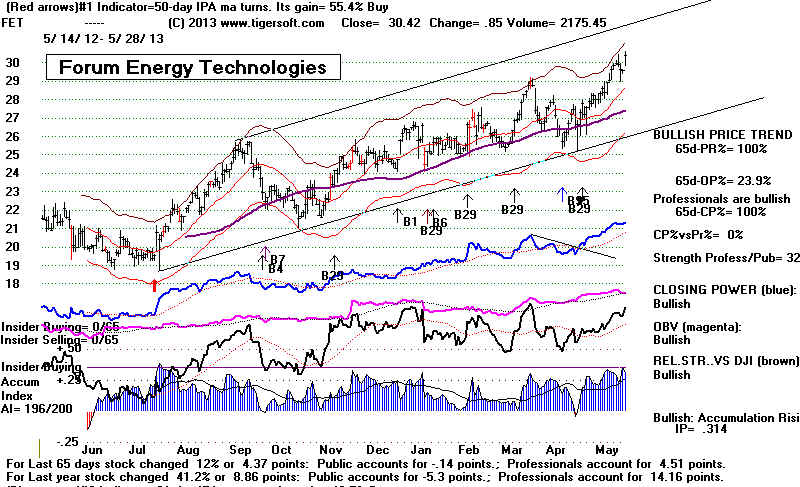 |
---> 350 MAXCP stocks Bullish MAXCP Stocks (5/28/2013) Bullish
plurality
---> 83 MINCP stocks Bearish MINCP
Stocks (5/28/2013)
Note the many leveraged Bearish ETFs here and
how weak their Closing Powers are.
This shows Professionals are bullish. Definitely not bearish here.
---> 129 New Highs on NASDAQ 11
new lows. Bullish plurality
---> 116 New Highs on NYSE
30 new lows. Bullish
plurality
Rising Interrest Rates Did Not Get Much Attention Today
Mortgage back securities have been selling off. More than usual.
Interest rates
are now higher than a year ago. Demand for money is growing. This is
only natural
when the world economies start to revover. No one knows where rates will go
when
the FED backs away from "Quantitative Easing". But certainly 10 year rates
could
rise to 3% and perhaps 4%. This will have a huge impact on bonds. But shorting
bond funds are not the only way to play the markets for the evenutal reversion to more
normal interest rates. See TMV below.
--------------------------------------------------------------------------------------------------------------------------------------------------------
OLDER HOTLINES
-------------------------------------------------------------------------------------------------------------------------------------------------------
5/24/2013 Peerless Remains on A Buy B18
Intermediate-Traders should appreciate that a second Peerless Buy
B18 signal
in 84 days like we saw three weeks ago typically brings an additonal DJI gain
of more than 10%. The short-term direction will be determined by
who wins the The Battle between Opening and Closing Power.
When Professionals Bulls defeat Public Bears, the stock market
is usually in for a big advance. A strong opening would likely
bring a challenge of the recent DJI and SP-500 highs. If the DIA and
SPY Opening Powers can rise back above their 21-dma, it should be
be very bullish.
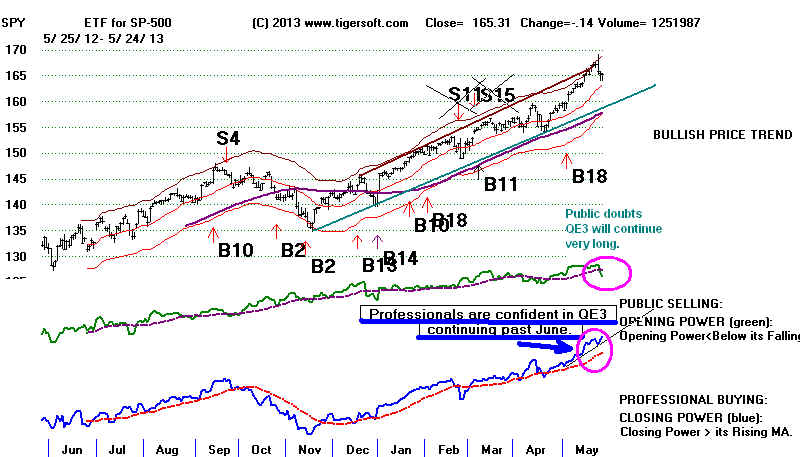
The Battle between Professionals and The Public
Professionals keep holding the DJI up and will not let it correct.
Even so, because of heavy Public/Overseas Selling at the
openings, the Professional buying has not been able to push the averages
back up to their recent highs in this normally bullish week before
Memorial Day. If the Public Selling remains heavy at the opening,
it will probably best to wait for a retreat to the 21-day ma to do new
buying on major market ETFs. At the bottom of tonight's Hotline
you will a number of cases where DIA's weak Opening Power eventually
did turn down the Index when Closing Power belatedly broke down.
In most of these cases, there had been a Peerless Sell.
However, waiting for the Closing Power to turn down is usually best
since there are many times when it is the Opening Power which turns
back up and rises back above its 21-day ma. This is especially true
when Peerless is on a Buy. When it is the Opening Power which changes
direction to get back into allignment with the rising Closing Power, we
have the very bullish condition in which both Openng and Closing power are rising.
Here, that might be bullish enough here for the DJI and SP-500 to crack through
their over-head resistance.
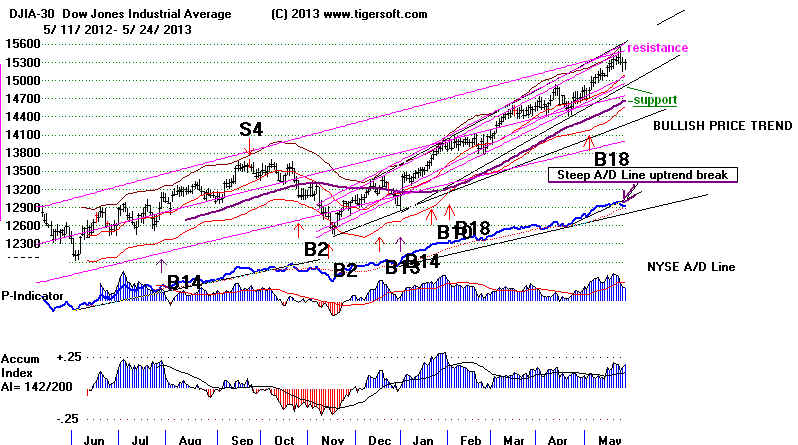
Date
DJIA
La/MA
AnnRoc P-I
P-I ch P^^ IP21
V-I
Opct
65PctChange
5/24/2013
15303 +9 1.013
.476 +291 -57 +291
.193 +14 -15
.224 .093
high
5/24//2013 ---> To Key Index and Leading Stock
Charts
---> 365 MAXCP stocks Bullish MAXCP Stocks (5/24/2013) Bullish
plurality
---> 37 MINCP stocks Bearish
MINCP Stocks (5/24/2013)
Note the many leveraged Bearish ETFs here and
how weak their Closing Powers are.
This shows Professionals are bullish. Definitely not bearish here.
---> 36 New Highs on NASDAQ 9
new lows. Bullish plurality
---> 40 New Highs on NYSE
9 new lows. Bullish
plurality
Realistically, we also understand how important the Fed's
record low interest rates have been to the market's extended advance.
A sudden change of Fed policy would have a very negative impact on
the stock market. Concerns of this been greatest Overseas and
among Public owners of dividend paying stocks. That is the reason the
NYSE has fallen back to its 21-day ma, while the DJI has not. The NYSE
has many dividend stocks and funds. This also accounts for the
weakness in the NYSE A/D Line and NYSE Down Volume since Tuesday.
The biggest contrast has been in how much Openings have differed from
Closings. Since the Fed's Minutes were released late Tuesday, in which
the Fed actively considered phasing out their "QE-III" debt purchases,
DIA (the ETF for the DJI) fell 1.1% at the openings.
But, on those two days,
Wednesday and Thursday, Professionals in the US were net buyers to the
extent that the Closings rose a total 1.1% above the Openings.
Weak Openings and Strong Closings:
Closing Power Wins in Battle with Opening Power:
In late December 2012, Opening Power's weakness did drop the
Closing Power briefly back below its 21-day ma. But as soon as
both got back above their 21-day, the market roared higher.
This was Tiger's "BOTH UP" condition.
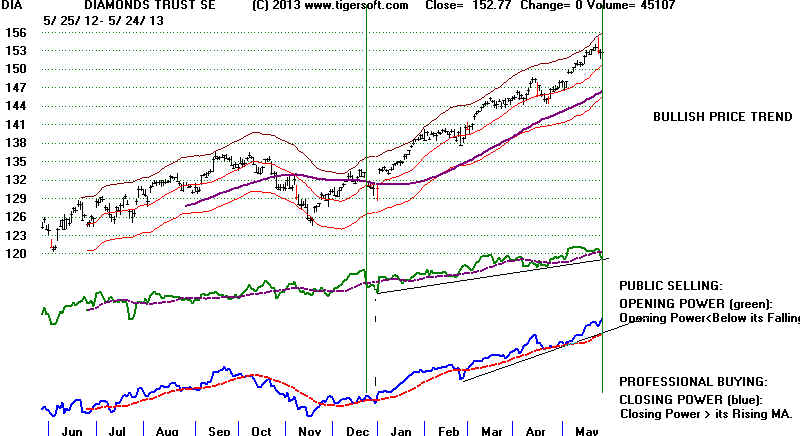
Ordinarlily, we should, I think, trust the Professionals. They have much
better information than the Public does or overseas investors do. Their
banks, after all, are the ones represented on the Federal Reserve Board.
Since the blue Closing Power for DIA and SPY made a new high on Friday,
we have to consider these uptrends rising. The steep uptrends that were
broken have now been replaced with somewhat less steep uptrends.
But, is that the end of the story? The Blue Closing Power for DIA has
fallen below its rising 21-day ma. How important is that? What if the
Openings remain very weak. Will Professionals keep buying? There
a few earlier cases where this happened. I think it will give us a better
understanding to look at these cases since 2003. More often, Opening
Power turns up.
Cases Where Opening Power
Rises back above Its 21-dma
to get into allignment with
an Uptrending Closing Power
Closing Power Wins
DIA 2009
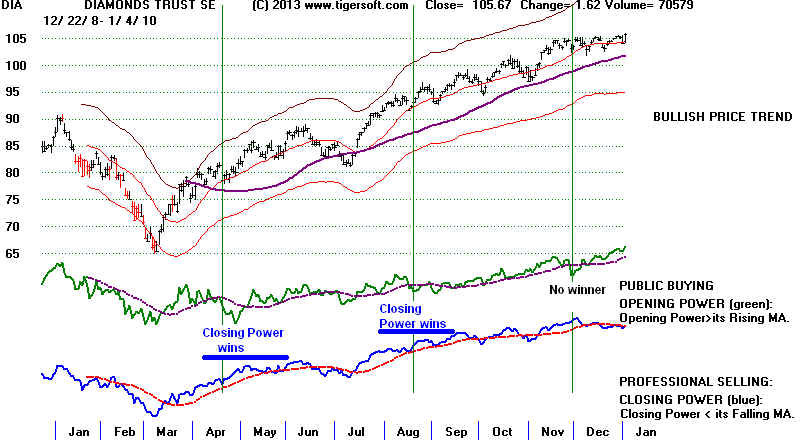
DIA 2006
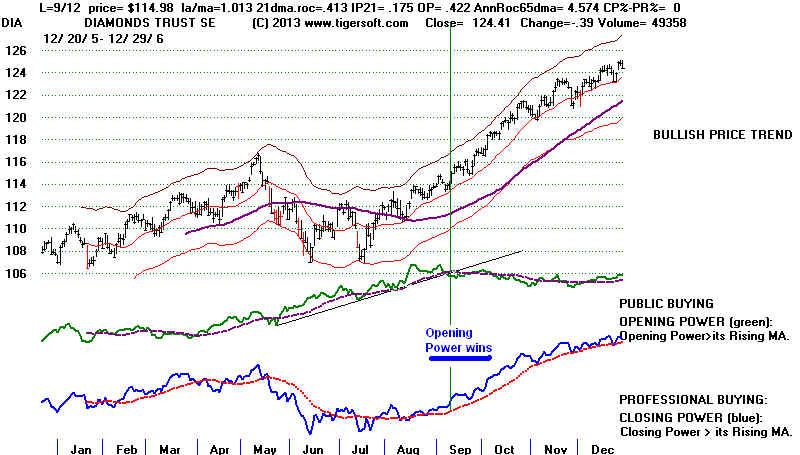
DIA 2006
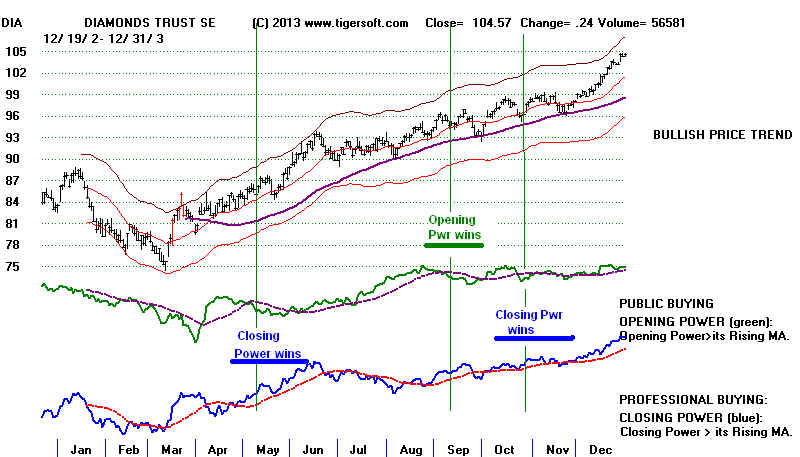
Cases Where Closing Power
Falls back below Its 21-dma
to get into allignment with
a Falling Opening Power.
Opening Power Wins
DIA-2011
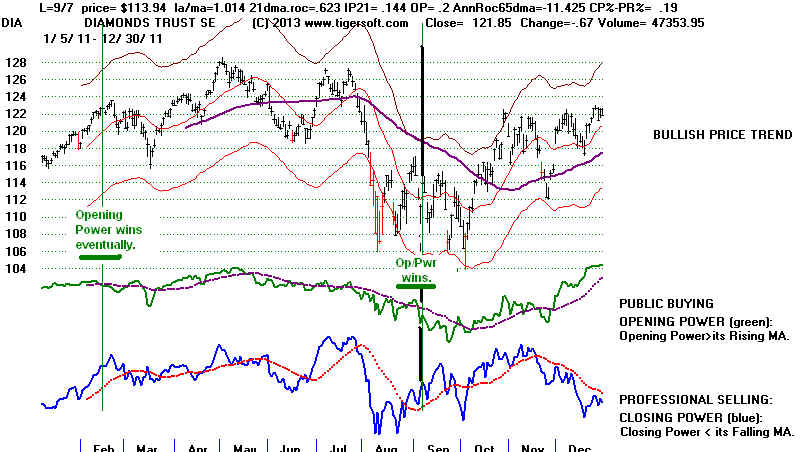
DIA-2011
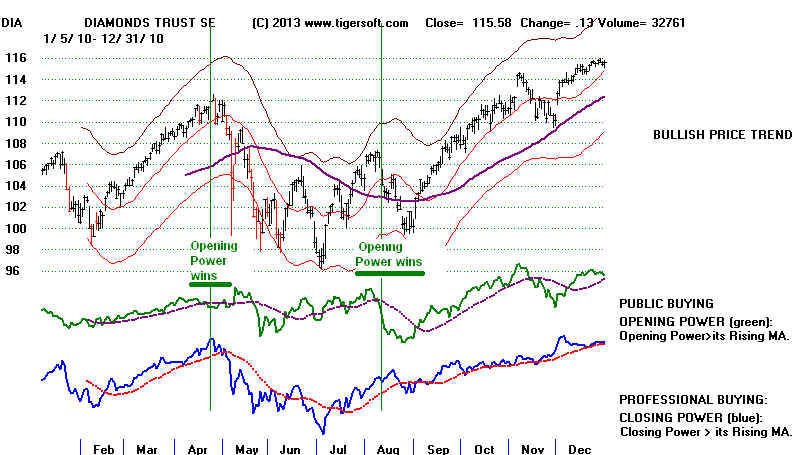
DIA-2008
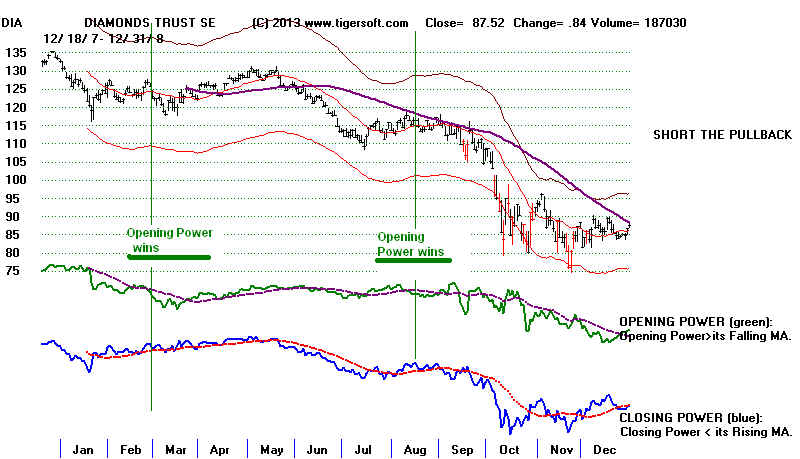
=====================================================================================
OLDER HOTLINES
=====================================================================================]
5/23/2013 Peerless Remains on A Buy B18
Date
DJIA
La/MA
AnnRoc P-I
P-I ch P^^ IP21
V-I
Opct
65PctChange
5/23/2013
15295 -13 1.015
.489 +347
-69 +347
.168 +29
.245 .089
bullish
bullish
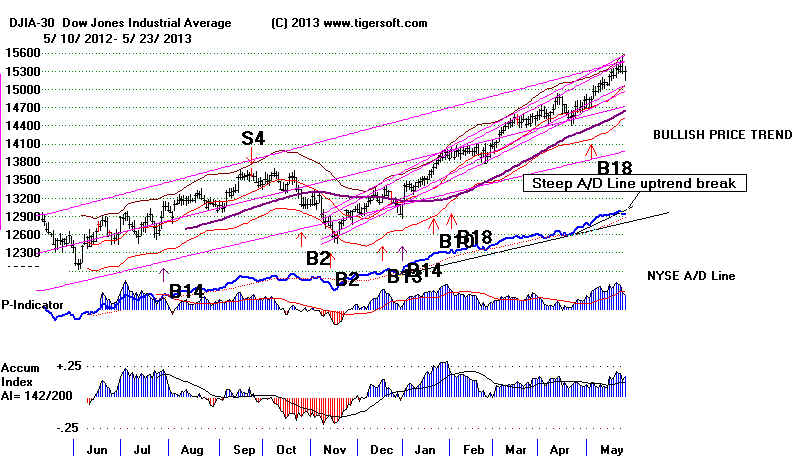
Fear of interest rates going back up is probably a more
powerful sentiment
now than eagerness to buy because business conditions and profits look
great. That should bring more profit-taking.
The 10-year rates are now above 2%. Besides our internal strength indicators,
I think TNX (below) should be watched most closely now. The market has benefitted
enormously from the very low rates. Each time it started to sell off, in the Fall of
2010, 2011, 2012 and again in January 2013, Bernanke and the FED have
come to its rescue.
As a result, it is not clear now, that the US stock market can hold up on its own,
without special treatment by the Fed. Perhaps, it will continue to climb
"a wall of worry".
But, first, it needs to prove itself by testing 15000 and holding up without new Fed help.
I think it probably will do this as long as rates do not rise much more than to 2.2%
or 2.3%.
If the DJI were to jump up too much this month or in June, not only might we get a
Sell,
but that action itself might become a factor in the mind of some of the Fed Governors.
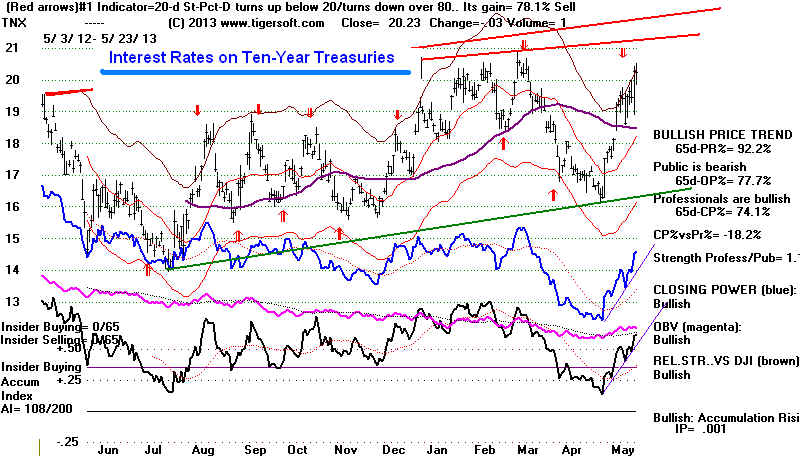
A DJI Decline to 15000 and the 21-dma seem likely. Whether there will be a bigger
decline will depend on whether the rising Closing Power 21-day MAs are violated
and whether we get a Major Peerless Sell S4. Short-term traders of the major
market ETFs should do some selling.
My view of what's happened in the last three days is that we are seeing a normal
pullback. This is normal because the indexes reached over-bought territory at the
top of their regression channels and near their upper bands. There were no
important divergences at the top. That helps limit the decline. There has been
no head/shoulders pattern. Bullishly, the Accumulation Index (IP21) turned
back up today and did not violate its 21-day ma, which might have brought a Sell S4.
That the V-Indicator has weakened again and now stands ar only +29, is a warning
that any narrow jump back up the upper 2.5% band, 153 points higher, could
bring a Sell S15 or Sell S9V.
The FED has succeeded in pouring some very cold water on the speculative
fevers that were developing. Now short-term traders have to wait for a decline
back to the DJI's 21-day ma. Trading before Memorial Day usually brings
a limited and tepid rally. I think we saw that today. Now we have to watch to
see if professionals and institutions are nervous enough to do some more
selling. They have some very nice profits. They will not want them to escape.
5/23//2013 ---> To Key Index and Leading Stock
Charts
---> 259 MAXCP stocks Bullish MAXCP Stocks (5/23/2013) Bullish
plurality
---> 47 MINCP stocks
Bearish MINCP Stocks (5/23/2013)
---> 27 New Highs on NASDAQ 14
new lows. Bullish plurality
---> 26 New Highs on NYSE
9 new lows. Bullish
plurality
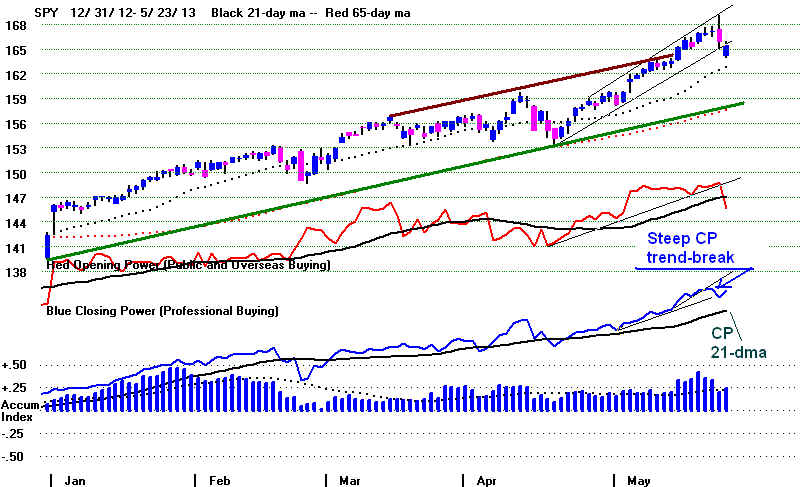
====================================================================================
OLDER HOTLINES
====================================================================================
5/22/2013
DJI 15388 + 52
Peerless Remains on A Buy B18
A DJI Decline to 15000 and the 21-dma seem likely. Whether there will be a bigger
decline will depend on whether the rising Closing Power 21-day MAs are violated
and whether we get a Major Peerless Sell S4. Short-term traders of the major
market ETFs should do some selling.
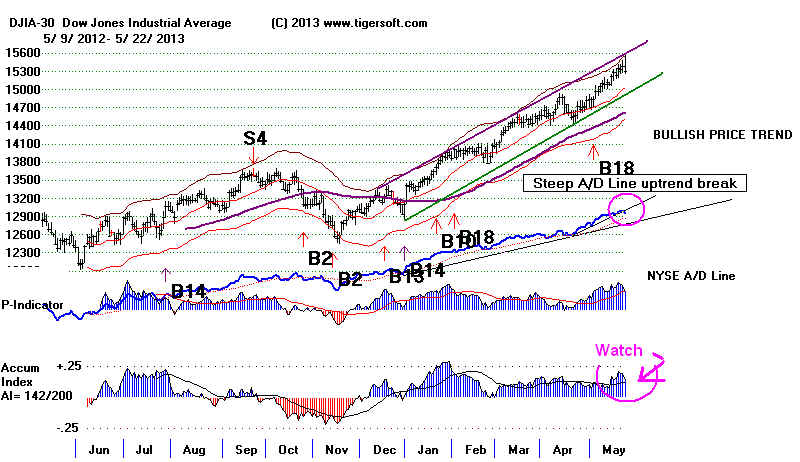
Fed
Minutes indicate that the Fed might cut back on
its program of buying
bonds and mortgages as easly as June. This was much earlier than was expected.
Bernanke may no longer be in control in this. Just this possibility is dropping
sharply the market's Futures.
All good things seem to have to come to an end.
Of course, Peerless is still operating on a Buy and momentum is strong. But, some
profit-taking by short-term traders seems reasonable given the steep Closing Power
uptrend breaks. They are way above their own Closing Power 21-day ma
If the opening is very weak, short-term traders may want to decide to wait for a
recovery, knowing it is always risky to sell into a weak opening and hoping
that the FED will say something re-assuring. But that is probably wishful
thinking. Taking some profits seems only prudent now. It may turn out that
we are witnessing the first signs of a revolt against Bernanke among the Fed Governors.
If that turns out to be true, there is much more downside risk than upside potential.
The Blue Line beneath the bar charts below
is the Tiger Closing Power in these "exploded" Tiger charts.
In each case, the steep CP uptrendlines were broken.
This usually brings a quick test of the rising 21-da ma
which is quite a ways down from the current level of the CP. .
Profit-taking, being what it is, I think we are going to see a retreat to the rising
21-day ma, now at 15000. But if we get a Sell S4, showing the IP21 has fallen
below its 21-day ma, I would think, the decline will take the DJI back to its 65-dma.
just above 14600
I was pretty bullish last night. But I did say that it was important for the
Fed to show that they would hold steady on their low interest rate
path. Bernanke's testimony was fine in this respect. It was the Minutes
of the last Fed Governors meeting which turned a good rally into a sell-off
that all happened after the minutes were released. The Fed is largely
responsible for the wonderful rally we have had since March 2009. If they
suddenly stop playing their pleasant tune, the dance may turn into a scramble for
an inadequate number of places to rest one's money safely.
Unfortunately,
there is ample precedent showing a sudden change of Fed policies can
do great harm to stock prices. See my History of the Fed
Discount Rate and
the Stock Market since
the 1950s.
Date
DJIA
La/MA
AnnRoc P-I
P-I ch
P^^
IP21 V-I
Opct
65PctChange
5/22/2013 15307
-80 1.018 .466 +415 -171
+415
.136 +49
.254 .082
high -057
5/22//2013 ---> To Key Index and Leading Stock
Charts
---> 132 - 415 MAXCP stocks Bullish MAXCP Stocks (5/22/2013) Bullish plurality
---> 52 +12
MINCP stocks Bearish MINCP
Stocks (5/22/2013)
---> 39 New Highs on NASDAQ 8
new lows. Bullish plurality
---> 46 New Highs on NYSE
15 new lows. Bullish
plurality
Might We Get A Sell S4?
The
key Indicator to watch in this is our Accumulation Index (IP21).
Now
that we have reached May, this signal can come into play.
It
fell a lot today but it is still above its rising 21-day ma. We should be
concerned
if
the IP21 were to fall below its ma. in the next day or two. In some some months
this
brings a Sell S4 in an over-extended market. The most dramatic case was in
the
Summer of 1987. The market had been rising steeply like now. But the
newly
appointed Fed Chairman Greenspan saw gold prices rising (which is not true now)
and,
fearing inflation (not a stock market bubble), pressed too hard on the
interest rate brakes. The Fed Funds rate suddenly rose more than 1/2%. The DJI
was
about to fall from 2722 to 1750 in less than two months! Might the Fed make
the
same mistake? Certainly the markets are more driven by rogue computers now
than
even in 1987. While Bernanke is much more seasoned, today we learned that
a
majority of Fed \Governors want to apply the breaks and taper off the Fed's buying
of
mortgages as early as June. This will certanly cause some more profit--taking/
Because, inflation is not present, we can hope that the Fed Governors apply a light
tough
to the breaks. Another point worth making: technically, the present A/D Line
has
been confirming the recent highs. The final DJI peak in 1987 was not confirmed.
in
1987. There's another problem with Sell S4s now.
May
Sell S4s in the Presidential Eclection year can work out. See the case of May 2001,
This
was also \the year after a Presidential Election .In this case, the DJI soon formed a
head/shoulders top. That clinched the bearishness of the situation. This
was also an era of
low
interest rates. But the high-tech bubble had just broken the year before.
(May 2009
also
saw a breaking of the IP21's 21-day ma, but this case is not allowed because the
DJI
was 5.4% over the 21-day.
1987 Summer Peak Occurred When IP21
Fell below Its 21-day ma
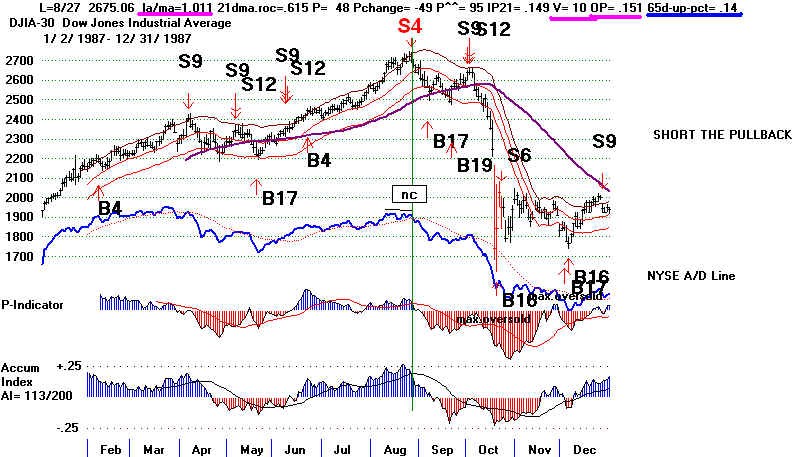
May 2001 Peak Also Occurred When IP21
Fell below Its 21-day ma
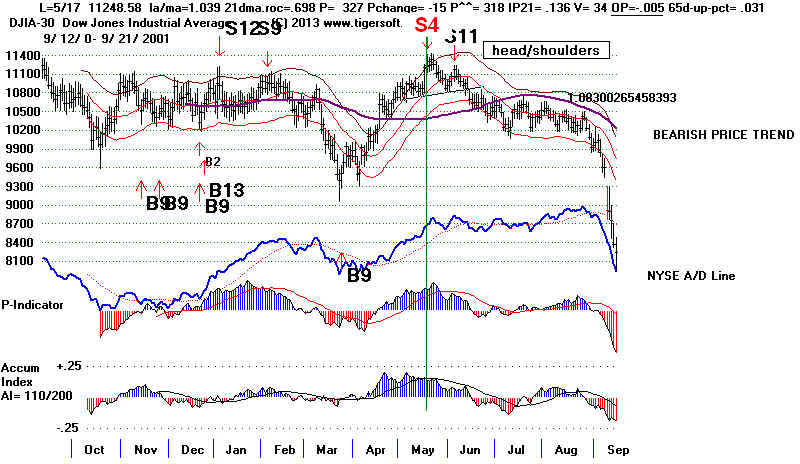
====================================================================================
OLDER HOTLINES
====================================================================================
5/21/2013 DJI 15388 + 52 Peerless Remains on A Buy
B15
Date
DJIA
La/MA
AnnRoc P-I
P-I ch
P^^
IP21 V-I
Opct
65PctChange
5/21/2013 15388
+52 1.025 .652
+586 -10
+586 .193
+89 .343
.091
high
high high high
5/21//2013 ---> To Key Index and Leading Stock
Charts
---> 547 MAXCP stocks Bullish MAXCP Stocks (5/21/2013) Bullish plurality
---> 40
MINCP stocks
Bearish MINCP Stocks (5/21/2013)
---> 103 New Highs on NASDAQ 3
new lows. Bullish plurality
---> 203 New Highs on NYSE
10 new lows. Bullish
plurality
Some well-known TV pundits are claiming the market is starting to look like
the over-speculated bubble of 1929. Peerless shows the contrast between 1929's
profoundly weak internals and rising prices, on the one hand, and the market's internally
confirmed strength now, on the other hand.
1929 Rot and Top
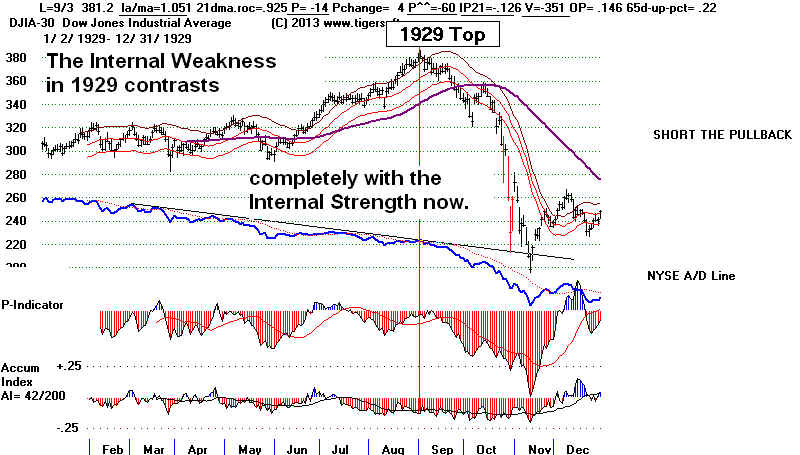
2013
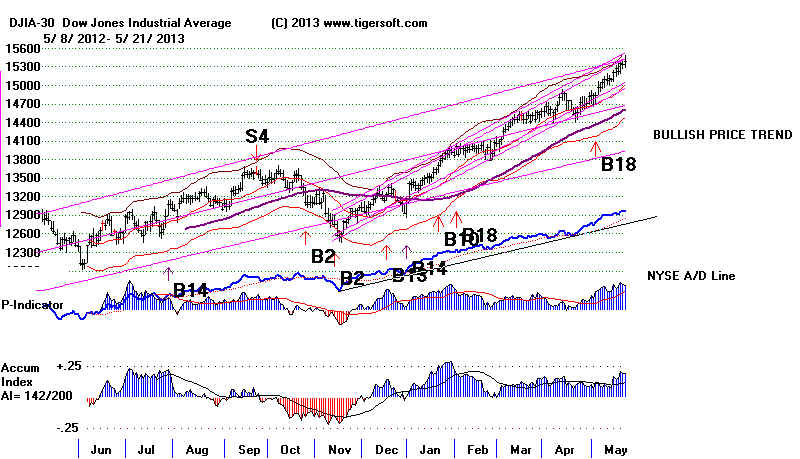
Hisotrical seasonality since 1965 for the five trading days after May 20th calls for
some weakness over the next 5 trading days. The DJI advances only in 42.6% of the
years over this period. It then rallies in 66% of the years since 1965 for the two weeks
after May 27th. But if Bernanle does not indicate any speeding up of his
"tapering off"
from "QE-III", I suspect the market will keep moving higher.
Tomorrow Bernanke will testify before Congress. The market's strength
and the recent comments from other voting Fed members does not suggest any
surprises are expected. While April added 165,000 jobs, most were not in
manufacturing. Home construction is on the rise. It will be interesting to
see if Bernanke
comments on the falling Yen and its impact on American manufacturing. Toyota
and Honda show lows of Accummulation and keep making new highs. F and GM
are also makign new highs, but their gains are more modest.
The DJI, SP-500 and NASDAQ
are all at the top of their least squares regression
channels. Normally, there would be a pull-back. But in promising rates will
remain
very low until Unemployment falls to 6 1/2% or lower, the Fed is clearly inviting stocks
to advance still more.
Tomorrow's testimony will be important. After tomorrow, traders will not have to
worry
about an unexpected rate hike. Traders understand full well that average
investors are
being forced to buy stocks because fixed income rates are so low. The Fed will, of
course, deny
tomorrow that it is not creating a stock market bubble. But history will be the real
judge.
For now, we know that blue chip stocks are rising with unusual steadiness.
Professionals
keep turning prices higher at the close. (The rising Closing Power tells us this.)
And institutions are supporting these stocks on all dips. The Accumulation Index
is still quite high for all the indexes and major market ETFs.
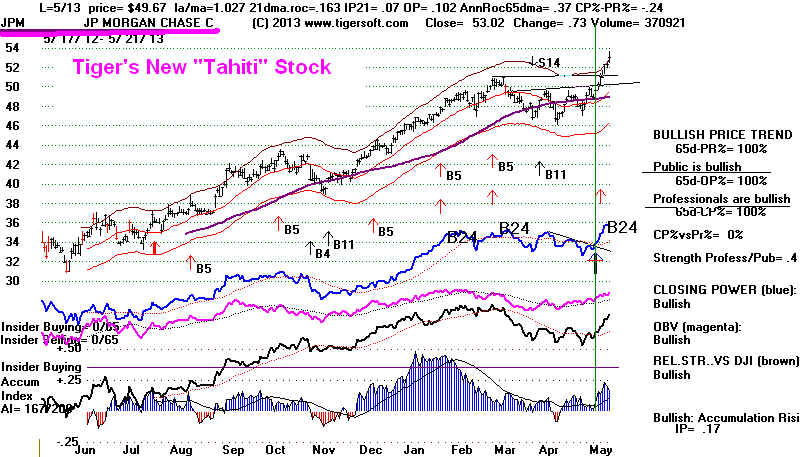
Very few stocks look like they would make good short sales now. Our Bearish
MINCP screening is mainly picking up
leveraged short funds. The most bearish
of all of them now is FAZ, the 3x leveraged short on Financials. This has fallen
75% since last June. In this context, we have to note that JPM is this most
consistently positive AI/200 stock in the DJI. This makes it our Tahiti stock.
Tahiti stocks normally can be held 21 months. The Tahiti system was
extensively back-tested to 1970. The average DJI gain is much better than 20%/year.
If you liked the rise in HD for the past 21 months, you have to think about
JPM as a good long-term Tahiti stock now.
Very high Power Ranked financial stocks are PRAA (which is a collection agency).
LYG (Lloyd's), SCHW (Schwab) and C(CitiGroup). I would think all dips by these
back to their rising 21-day ma can be invested in confidently for the next 3 months.
Trading with their rising Closing Power trends should be profitable.
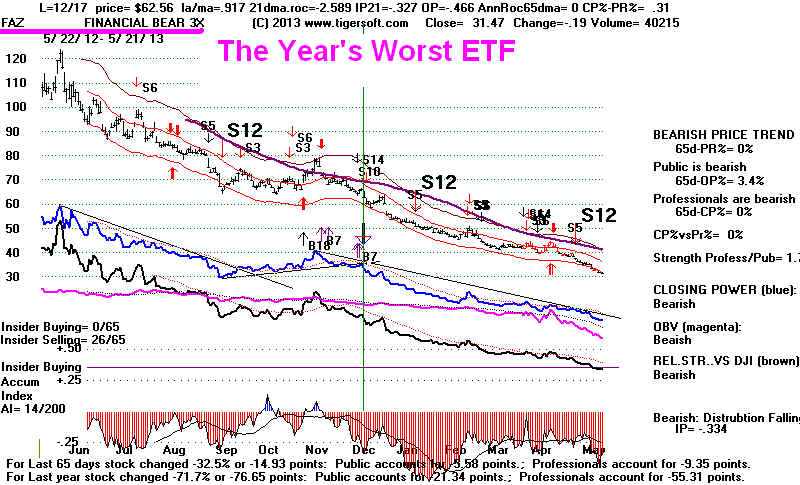
====================================================================================
===================================================
OLDER HOTLINES
====================================================
5/20/2013 DJI 15335 -19
Peerless Remains on A Buy B15
Gold and silver broke their steep Closing Power downtrends. That
should be bullish short-term for Gold, Silver and some of the deeply
depressed mining stocks if their Closing Powers also broke their downtrends.
SSRI and ANV
are particulalry oversold.
Crude Oil seems on the verge of a price
breakout. The Oil Stocks' group
already shows a rising A/D Line. The highest Power Ranked oil stocks
with rising Closing Power are:
AI/200 IP21
GEL 52.35 177
.15
MWE 68.84 164
.139
NBL 122.5 173
.317
fresh breakout.
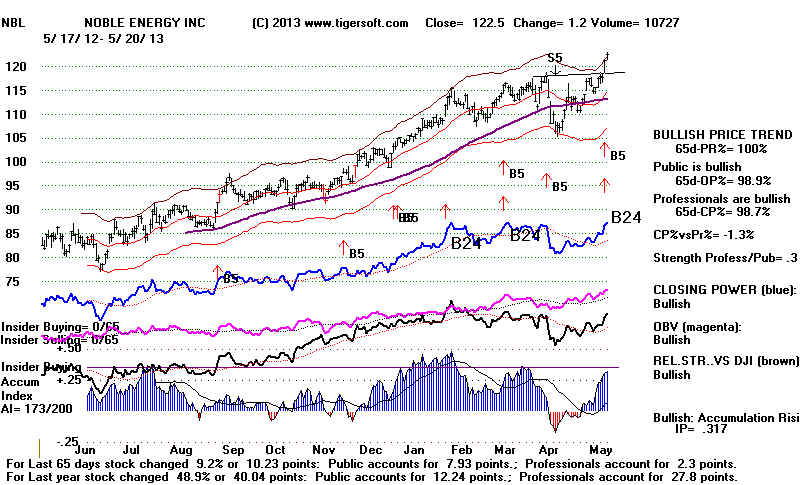
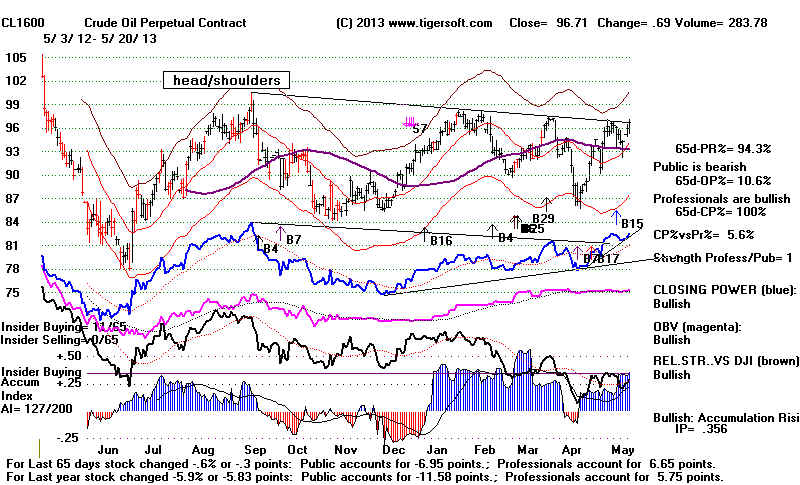
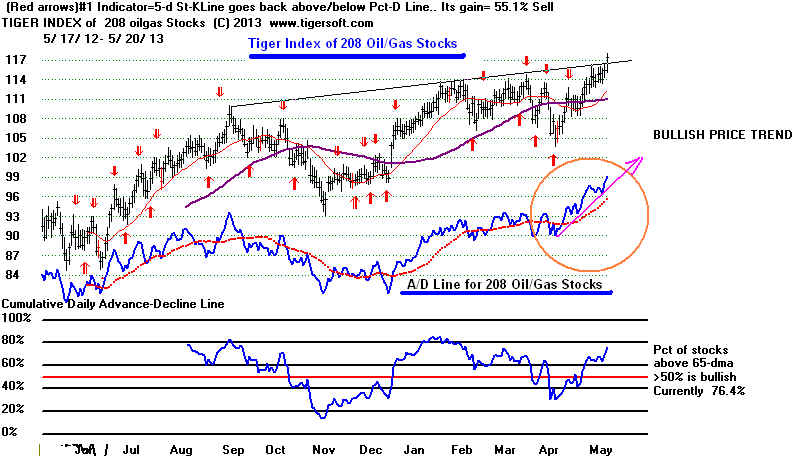
Until Peerless gives a new Sell, the A/D Line and Closing Power trendlines
are broken or until the DJI or SPY form and complete a bearish head/shoulders,
we have to expect higher prices. If SPY and the DJI accelerate up here,
a top will probably be reached sooner that if their uptrend is maintained within
the confines of the rising upper band and the rising 21-day ma.
Date
DJIA
La/MA
AnnRoc P-I
P-I ch
P^^
IP21 V-I
Opct
65PctChange
5/20/2013 15335 -19
1.024 .628
+596 -46
+696 .199
+93 .360 .088
high
high high high
Bullish 1995 Scenario
As I see it, the Peerless internals are too strong to allow much of a
decline. The rising 21-day ma will probably act as very good support,
much like it did in 1995 when the IP21 (Accum.Index) stayed very positive
for a long time, as it is doing now. In that case, the general market rose
steadily for the rest of the year but never got past the upper band.
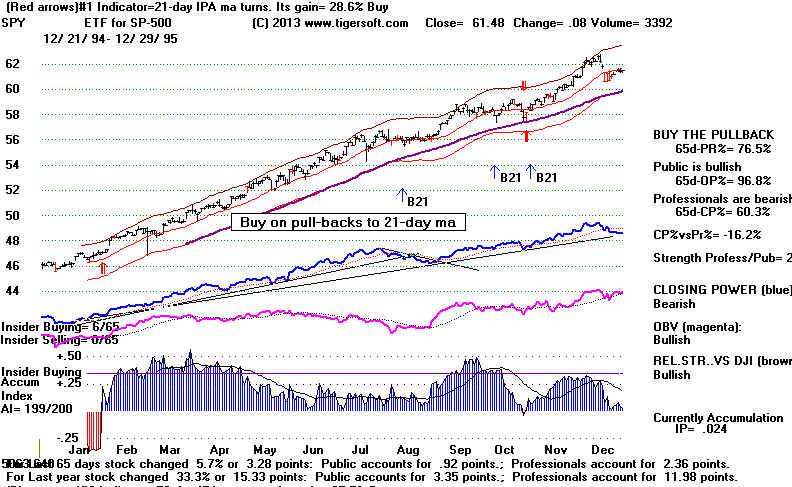
Bullish 2003-2004 Scenario
The second possible scenario - assuming the uptrend lines are not broken -
would be the wilder scenario where the upper band is breached and
the trend accelerates. This might be like SPY behaved back in the second half
of 2003. In that case, Peerless gave good sells at the top. But even if we did not
have
Peerless, all we had to do was watch for a break in the rising Closing Power.
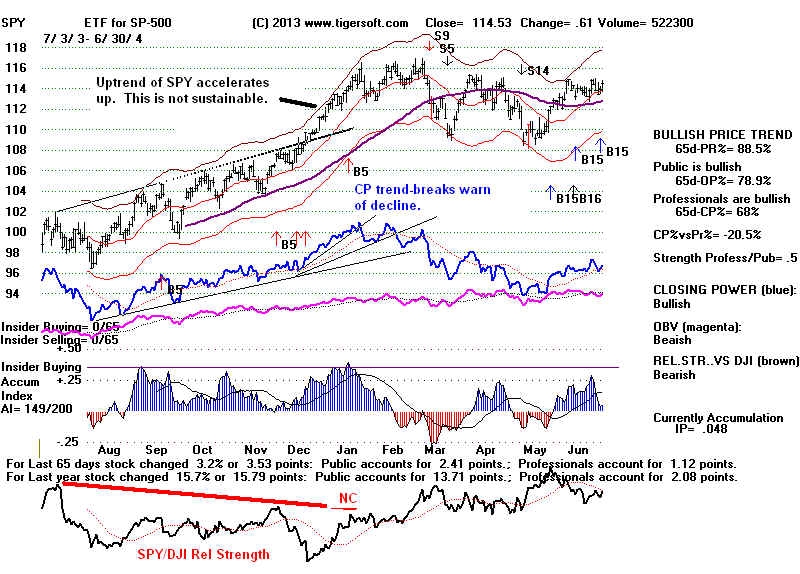
Bearish 2010 Scenario
Of course, sudden, bearish surprises are always a possibility. These typically
produce head/shoulder patterns in SPY (as well as the DJI). 2010's rally
was brough to an end by the unexpected, massive British Petroleum oil
spill in the Gulf.
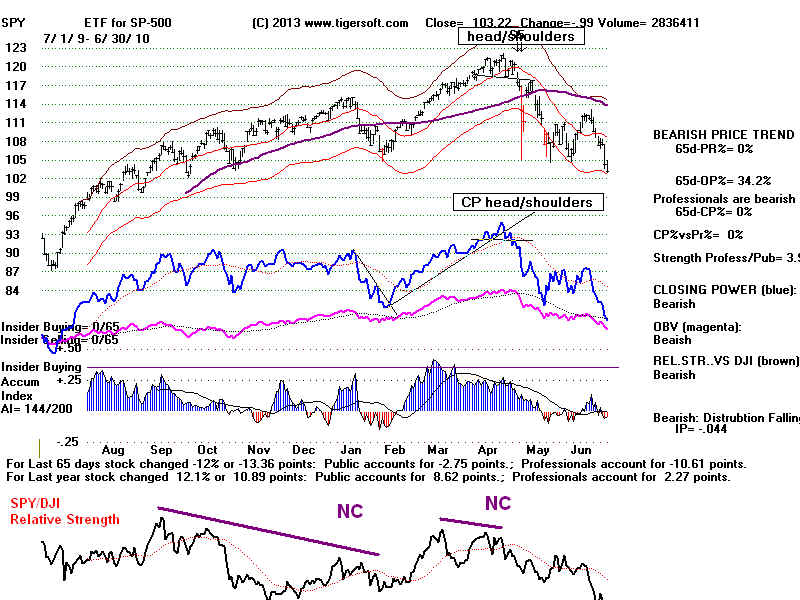
5/20//2013 ---> To Key Index and Leading Stock
Charts
---> 614 MAXCP stocks Bullish MAXCP Stocks (5/20/2013) Bullish plurality
---> 39
MINCP stocks
Bearish MINCP Stocks (5/20/2013)
---> 151 New Highs on NASDAQ 3
new lows. Bullish plurality
---> 268 New Highs on NYSE
4 new lows. Bullish
plurality
Is One Day of The Week More Bearish?
Monday declines, like today's, are normal according to Arthur
Merrill writng about the DJI
from 1886 to 1984. (Behavior
of Prices on Wall Street).
Merrill thought such statistics would help traders play the stock
market, much like someone
who knew the real odds, could play a warped roulette wheel.
TigerSoft lets you check this
tendency out for whatever you trade. Here are SPY's
percentages for a rise for each day of the
week. (Indic 3 + Days of the Week) In fact, Mondays
have been the worst day of the week
to be long in 6 of the last 7 years since 2007. But there
many years before that when Mondays
were never the worst day of the week. Tuesdays have been
the most consistenly up day since 2001,
which was a bear market year. When Tuesdays start to
fall more than they rise, it can be a warning
that a bear market is present or getting very close.
As you can see below, these patterns
break down every few years. So, this tendency is
hardly as pronounced as it was before 1984,
SPY - Percent of Days Up for Day
Market Trend
Monday Tuesday
Wednesday
Thursday
Friday
All
-----------------------------------------------------------------------------------------------------------------------------
1994 Falling
54.1%
52.8% 50.0%
41.5%
46.1% 48.8%
1995 Rising
57.4% 57.6%
52.8%
58.4%
60.3% 57.4%
1996 Rising
55.1%
46.2%
53.8%
50.0%
58.4% 52.7%
1997 Rising
62.7%
66.6%
40.3%
43.1%
58.8%
54.4%
1998 Rising
50.0% 59.2%
50.0%
39.2%
60.7% 51.9%
1999 Rising
54.1% 28.3%
62.9%
52.8% 52.0%
50.0%
2000 Falling
52.0% 42.3%
43..3%
56/6%
50.0%
48.8%
2001 Falling
53.0% 44.2%
46.1%
69.8%
37.7% 50.2%
2002 Falling
52.0% 34.6%
61.5%
43.1%
45.2% 47.3%
2003 Rising
57.9% 59.2%
46.1%
64.7%
55.7%
56.8%
2004 Rising
53.0% 62.9%
65.4%
50.0%
50.0% 56.5%
2005 Rising
55.3% 52.8%
58.4%
54.7% 50.0% 54.3%
2006 Rising
52.1% 53.8%
74.0%
47.1%
45.2% 54.7%
2007 Rising
43.7%
57.6%
66.0%
47.1%
56.6%
54.4%
2008 Falling
46.0%
51.9% 45.4%
59.6%
46/1% 49.8%
2009 Rising
47.9%
53.7%
55.5%
62.7% 52.9%
54.6%
2010 Rising
65.9%
57.4% 55.5%
52.8%
54.0% 57.0%
2011 Rising
46.6%
56.8%
52.9%
56.8%
49.0% 52.6%
2012 Rising
51.0%
54.9% 52.8%
60.3%
52.8% 54.5%
2013 Rising
44.8%
66.0%
61.5%
55.7% 63.4%
58.4%
====================================================================================
OLDER HOTLINES
====================================================================================
5/17/2013
DJI
15354 +121 Peerless Remains on A Buy B15
The second Buy B18's
bullish history make me think that the DJI will get past 16000.
I doubt if the
Fed's low interest rates will actually drop Unemployment to 6.5%.
So, the rates may
be low for a long time. Many stocks show high Accumulation.
Our Closing
Powers and the A/D Line are in uptrends. Counter-trend gold stocks
still look
bearish.
Our internal
strength indicators are all bullish. The V-Indicator is now above +100.
The P-Indicator
is very high. Research below shows that our IP21's reading now
of .21 is
probably much too high to permit a significant decline from the 2.8%
upper band.
That was true, at least, back to 1987, when the the V-Indicator
was abobe +60.
Bearish problems for the market start occurring if the IP21
dips below .10 or
is .140 or lower on a close at the 2.8% uper band.
(Example: Bear
market followed 5/22/2001 when the DJI was 3.1% over the 21-day ma
and the IP21 was
.137.)
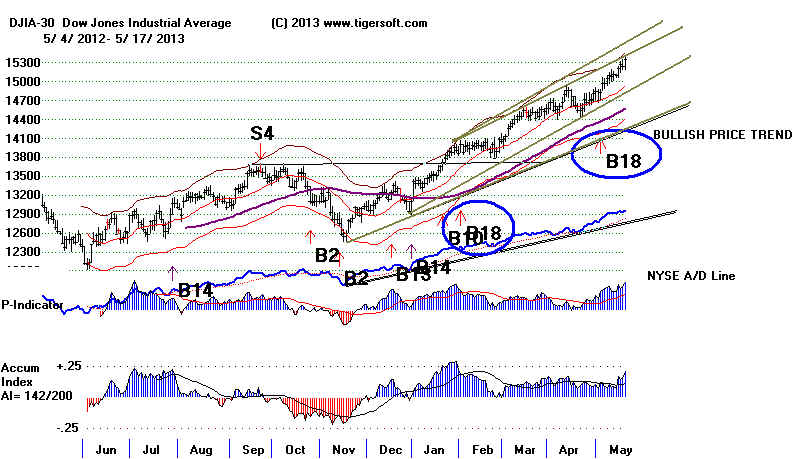
So Many Bullish Stocks
Many, many
stocks, especially high caps in the SP-500, show bulging
Accumulation and
rising Closing Power. It would be a surprise if they
all suddenly
reversed. Upwards momentum like this is very hard to
reverse.
93.5% of the SP-500 stocks are above their rising 65-dma.
The A/D Line uptrend for these stocks is rising at a
steep angle. The
Fed is forcing
investors to buy stocks if they want a significant return
on their
investment.
 Bullish
SP-500: LNC, PFG, SVU, ECL, SYK, TIF, CI, PCL, HCN, GRA
Bullish
SP-500: LNC, PFG, SVU, ECL, SYK, TIF, CI, PCL, HCN, GRA
Bullish High Accumulation (Speculative): FFKT, SILC, EXH, JOF, DXYN, SPNC, BBX, AMG
Bullish Explosive Super Stocks: SILC,
WIPC, SEIC, GME, KUB, TOY, JOF, SPNC, SEIC
Bullish Low Price Stocks: CERS,
DYXN, TELOZ, OSBC
Bullish New Issues: EAC, PFPT, TSRO. EPAM
Tiger
"approved" stocks show maximum Insider and Professional Buying,
based on our own Accumulation and Closing Power indicators. These are the
internal strength indicators beneath the bar charts. Hold them as long as
Professionals remain net Buyers and our Closing Power keeps rising,
using the gradual CP uptrendline.
When Should We Sell The Overall Market?
If there is going
to be a reversal in the current strong uptrend, I think that
it will most
likely take on the same appearance in our Tiger charts as when institutions
stopped buying
Oil stocks and Crude Oil futures in June 2008, after rushing into them
for the four
previous months. Just like then, for SPY, QQQ, IWM, MDY and DIA,
expect breaks in
the uptrends in price, Accumulation, Closing Power and OBV. This
will then be
followed by a rupture of the 65-day ma. After that, the internal strength
indicators will
turn down and the Accumulation Index will turn a bight red.
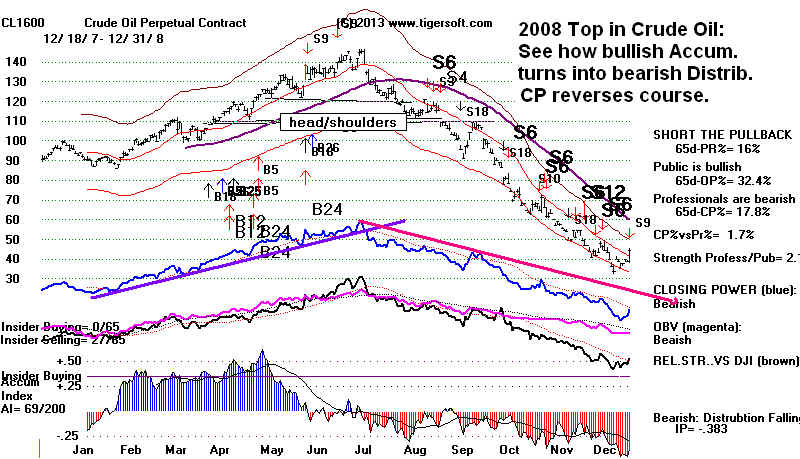
Peerless Remains Bullish
even as The DJI Approaches The Upper Band.
In the past, a
second Peerless B18 in 84 days, like we saw on May 2nd when
the DJI was
14831, have averaged a 13.5% gain from its level on the
second Buy B18.
This sets up a target above 16300.
The FED May Keep Rates Low into 2014.
The Fed seems
determined for its part to see the DJI reach 16000. It hopes that this will
lift the overall
economy. And if it doesn't? Well, they'll just keep the rates low
for even longer.
Inflation - apart from health insurance -is not a problem now,
the Fed Governor
readily points out. The Dollar just made a
12-month high.
Food commodities
made a new low and Crude Oil has not started a
Summer run.
Bernanke and
Obama have not explained how helping big banks and housing
will do much to
boost US manufacturing exports, encourage businesses to re-tool in America,
cause more hiring
here for good-paying jobs or reduce the imports of goods that
could otherwise
profitably be made in the US? If you go to Home Depot, you'll
be hard-pressed
to find anying there made in the US. Wall Street is happy
about that.
So are home-builders. But who will buy the homes if there
are not more
manufacturing jobs in the US? I'd predict that only if there is a
change in
monetary, fiscal and trade policies, can we avoid a dangerous stock
market bubble.
The 1950s show that this is possible. But everything after 2000
warns us that the
dangers may be unavoidable.
Riding The Upper Band Higher?
The DJI is now at 2.8%
over the 21-day ma. You can see from the DJI chart that
it was not been able to
get past the 3.5% upper band at any time this past
year. It has also
the reached the upper channel-line that parallels the most
basic rising resistance
line. If it is able to break past these barriers, I think that.
the speculative bubble
is growing out of control. I'd prefer the DJI keep rising,
but not get much past
the 3.5% band at any time and also not fall below the rising 21-day ma.
This type of rally has
more staying power.
As Long as the Tiger Acc.Index stays above +.10,
Being 2.8% over the Lower Band Should Not Be A Problem.
We can look in
the past to see when the DJI had similar internals to now. Only
when the Accum.
Index (IP21) was below .14 with the DJI at the upper 2.8%
was the market
close to a significant top. See recent cases cases below for
4/14/2013 IP21 = .063 8% DJI decline
4/10/2008 IP21 = .069 Bear Market about to start
9/27/2007 IP21 = .094 Bear Market about to start.
Date DJIA
La/MA AnnRoc
P-I P-I ch
P^^
IP21 V-I
Opc
65PctChange
5/17/2013 15354 +121
1.028 .653
+642 +80
+642 .210 +106
.425
.09
high
high high high
high
----------------------------------------------------------------------------------------------------------------------------------------------
5/14/2013 13593
1.029
.387 +420 +16
+420 .063
+70 .222 .081
..
low
DJI fell 8%
-----------------------------------------------------------------------------------------------------------------------------------------------
12/23/2013 12294
1.029
1.037 +334 +616
+333 .023 +80
.130
.128
..
low
DJI rose from 12294 to 13233 before falling to lower 3% band.
------------------------------------------------------------------------------------------------------------------------------------------------
9/27/2011 10812
1.031
.941 +464
+20 +451
.150 +114
.476
.06
..
DJI rose from 10812 to 12391 before falling to lower 3% band.
------------------------------------------------------------------------------------------------------------------------------------------------
3/5/2010 10566
1.029
.343 +535 +132
+520 .153
+68
.221 .021
..
DJI rose from 10566 to 11205 before falling sharply below lower band. Note H/S/. .
------------------------------------------------------------------------------------------------------------------------------------------------
8/12/2009 9362
1.03
1.319 +699
+9 +652
.231 +213
.325
.102
..
DJI rose from 9362 to 10711 before falling below lower band.
----------------------------------------------------------------------------------------------------------------------------------------------
4/29/2009 8186
1.028
.996 +660
+175 +615
.129 +222
.265
.008
..
DJI rose from 8186 to 9739 before falling below lower band.
----------------------------------------------------------------------------------------------------------------------------------------------
4/10/2008 12849
1.028
716 +372
+146 +335
.069
+67 .109 .027
..
low
low
DJI rose 2% more and then crashed below lower band.
Multiple Sells.
-----------------------------------------------------------------------------------------------------------------------------------------------
9/27/2007 13913
1.03
770 +332
+169 +299
.094
+80 .345 .041
..
low
low
DJI rose only 2% more and then crashed below lower band.
Multiple Sells.
-----------------------------------------------------------------------------------------------------------------------------------------------
5/1/2007 13136
1.028
731 +248
+11 +224
.180 +66
.673
.049
..
low
DJI rose from 13136 to 14000 before falling below lower band.
5/17//2013 ---> To Key Index and Leading Stock
Charts
---> 557 MAXCP stocks Bullish MAXCP Stocks (5/17/2013) Bullish plurality
---> 49 MINCP stocks Bearish MINCP Stocks
(5/17/2013)
---> 182 New Highs on NASDAQ
9 new lows. Bullish plurality
---> 335 New Highs on
NYSE 21 new lows. Bullish
plurality
====================================================================================
5/16/2013
DJI
15276 +60 Peerless Remains on A Buy.
The Surprise Will
Probably Be How Much Higher The Market Can Go.
More jobless claims and
deflation, as reported today, are actually bullish
in a world where the
Fed will use these numbers to justify keeping rates
low for a longer period
of time.
5/16//2013 ---> To Key Index and Leading Stock
Charts
---> 684 MAXCP stocks Bullish MAXCP Stocks (5/16/2013) Bullish plurality
---> 52 +9 MINCP stocks Bearish MINCP Stocks (5/16/2013)
---> 91 New Highs on NASDAQ
9 new lows. Bullish plurality
---> 122 New Highs on
NYSE 9 new lows. Bullish plurality
What I wrote last night applies still.
"After 2 successive Peerless B18s, like we have now, the DJI has
averaged a 13.5% gain from its level on the second occurrence.
This sets up a target above 16000.
"I realize that the DJI is getting very close to its electrified rail, the
upper 3.5%, but the Closing Powers are all still rising, as is the A/D Line
for the NYSE and for the stocks that make up the
SP-500. " In additon,
the OBVPct keeps moving up. It now stands at +.351. I mentioned
here that a reading from it above +.38 is closely associated with
a market that will rally much higher. If there is a May retreat, it
shpuld be very shallow.
Current DJI and Peerless Key Values compared with
Earlier 2nd Quarter Tops in Post Presidential Election year.
Date
DJIA La/MA
AnnRoc P-I
P-I ch
P^^
IP21 V-I
Opc
65PctChange
5/16/2013 15233 -42
1.023 .492
+561 +50
+561 .157
+78 .351
.085
high
high high
high
---------------------------------------------------------------------------------------------------------------------------------------------
5/29/1945 169
1.022
.267 +14
+5 +67
.022 -59
.158 .063
Sell S8... DJI
fell to lower band on 7/27/1945
7/8/1957
518 1.022
.324 -27
+4 -86 .038
-188
.331 .077
Sell S9 and 19% bear markt until
October.
5/17/1961 707.5
1.028 .259
+64 +19
+187 .04 -57 -.062 .098
No signal. DJI
tagged lower band on 6/19/1945
5/6/1965 933.5
1.021 .543
+83 +7
+229 .143 -10 .513
.031
Sell S8... DJI fell 11% to bottom on 6/28/1965
6/2/1989 2517.8
1.027 .604
+176 +34 +302
.142 +21
.308 .11
No signal. DJI
tagged lower band on 6/20/1945
5/14/2002 10298
1.024 .242
+107 +75 +107
-.024 -110
-.004 .054
Sell S9/S8 and DJI fell to
lower band on 7/27/1945
6/12/2009 8799
1.028 .718
+394 +104 +367
.079 -2
.146 .213
QQQ remains the major market I like the most. If it were to experience
another bubble of speculation like it saw in 1999 and 2000, QQQ could
rise to 120! The longer the DJI and SP-500 keep rising, the more
the speculative confidence returns to the market, so I like QQQ.
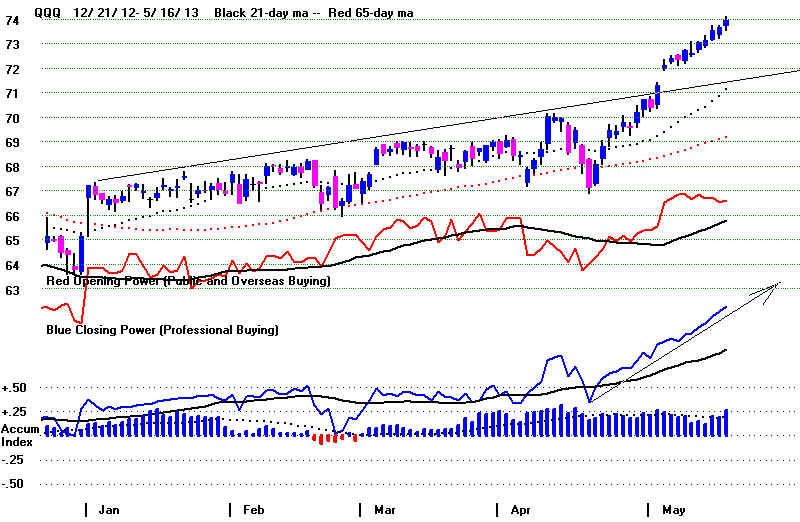
More on Bubbles and Black Holes
I feel it is especially important to understand all the things that bring
about a stock market bubble BECAUSE we are far away from having
a full employment economy. In this way, Bubbles can take the market
much higher and much longer than most people would ever think possible.
See the points I made about this last night.
The opposite is also true. Sectors, stocks and currencies can get into a downward
spiral that last longer and is much more lethal than folks generally think.
For the longs in them, it is like being in a black hole. There seems no
escape, yet one cannot get oneself to sell to escape its vortex.
In this vein, consider the Tiger charts of the leveraged Short ETFs.
They look about as weak and bearish as anything can be. As our
indicators most often lead prices, this means they can go a lot lower..
That certainly confirms the bullishness of Peerless.
See their Intense and steadyily red distribution below. With the Closing Powers
falling every day, we know that Professionals are still selling or shorting them.
These charts also show the a stock or an ETF can be internally weak for a lot
longer than most might. On this basis, I still would not be a buyer of
ANV.
And if domestic Gold miner ANV is still not a buy, why take a chance with
any of the foreign Gold Stocks or even Gold.
Viewed with TigerSoft, ANV looks like the bearish major market ETFs
did a month or two ago! The Japanese Yen ETF (FXY) also looks very
vulnerable.
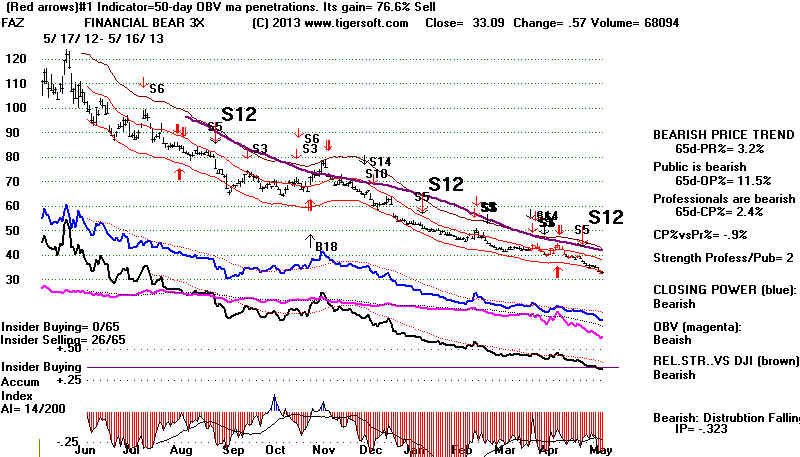 |
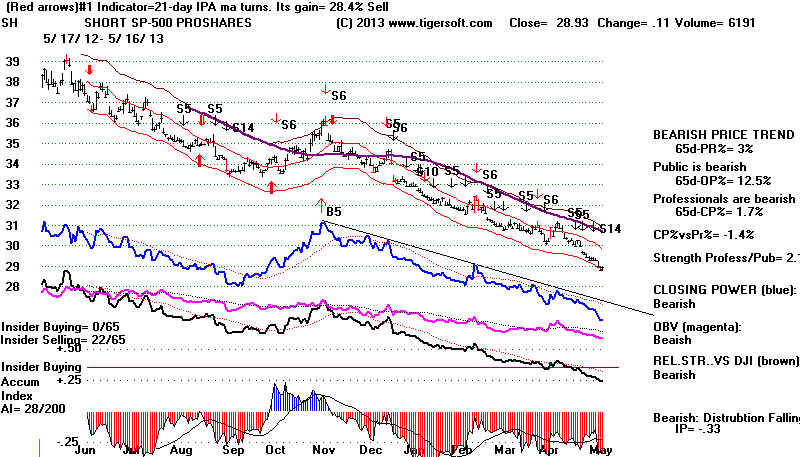 |
Weak Gold Stock -
ANV
and Weak Currency ETF (Yen) - FXY
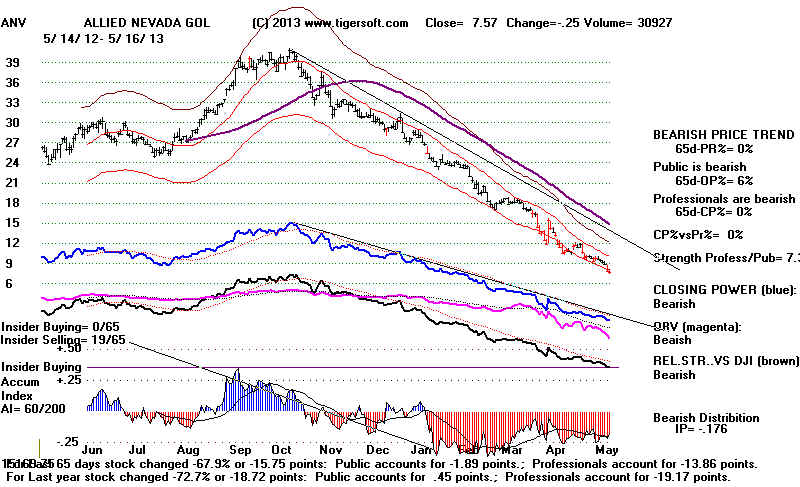
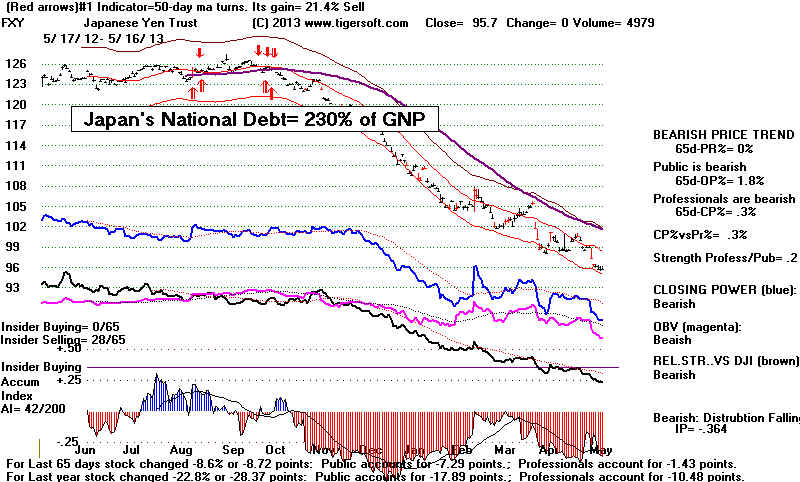 |
====================================================================================
OLDER HOTLINES
====================================================================================
5/15/2013
DJI
15276 +60 Peerless Remains on A Buy.
After 2 successive Peerless B18s, like we have now, the DJI has
averaged a 13.5% gain from its level on the second occurrence.
This sets up a target above 16000.
I realize that the DJI is getting very close to its electrified rail, the
upper 3.5%, but the Closing Powers are all still rising, as is the A/D Line
for the NYSE and for the stocks that make up the
SP-500.
AAPL broke again below its 65-dma. But
Only a shallow retreat seems likely.
May reversals are common. But not all bring declines to the lower band.
The P-Indicator, IP21 and V-I are way above the levels associated
with earlier May peaks. So, a big decline seems unliklely.
Still, a retreat is likely for seasonal reasons. And in that vein, note the
many
leading biotechs getting Tiger Sell S9s in tonight's charts.
5/15/2013 ---> To Key Index and Leading Stock
Charts
---> 684 MAXCP stocks Bullish
MAXCP Stocks (5/15/2013) Bullish plurality
---> 52 +9 MINCP stocks Bearish MINCP Stocks (5/15/2013)
---> 200 -6 New Highs on NASDAQ 8 new
lows. Bullish plurality
---> 381 -1 New Highs on
NYSE 16 new lows. Bullish plurality
Why Stock Bubbles Can Get Very Big.
They tend to last longer than most people expect.
And sometimes, like now,
the Fed is afraid to take the Punch Bowl away from the party. After a May
decline, there should be more highs and the angle of the ascent
may very well get even steeper.
Most folks are uncomfortable with stocks up this much. They get vertigo.
But the truth is that the DJI's steep uptrend now is quite normal in many ways.
Hyperbolic uptrends - and we are not at the top yet, I want to
emphasize - are
common in the late stages of an advance. This is not merely a reflection
of arithmetic scaling.
Late stage uptrends are also based on a lot more than simply excessive
exuberance, envy (as when cocktail party bragging induces a timid person
to decide to find a stock broker) or even greed (where one cannot stand to be out of
the rising market for even a week.).
I don't even think that excessive stock broker hype, professional manipulation,
boiler rooms or even TV shows promising huge returns (as the silver and gold shils
on TV did in 2012) can be blamed for the developing stock market bubble we are
probably in.
There are many basic political and economic conditions that produce stock market
bubbles. In many ways they are built into the system. They are hard to avoid.
1) Very often the DJI becomes particularly strong late in a bull market, or in the
third or fourth Elliot major (multi-month) wave up. Professionals know this pattern.
They therefore use this information ahead of others.
2) Politicians are mesmerized by the Wall Street Elite in good times. Thus
Clinton gave Rubin authority to allow banks to become brokerages, permit
much greater leverage and legalize credit default swaps. Obama was very
careful to appoint a Treasury Secretary and a Chief Economic Advisor
that Wall Street would like. (Of course, a President may lose control
and make a big mistake. In July 2007, Bush gave his SEC Chairman Chief
a free hand to allow short sales on down-ticks again after it had been banned for
71 years. Three weeks later the DJI began its long 54% crash.) Up to a
point,
until the Crash comes, big bankers are trusted more and more. Their way of
thinking is accepted by the political elites of both parties. "What's good for
Wall Street,
is good for America".
3) It is customary for there to be a superb bull market when gold collapses,
I have mentioned this was the case after 1982 and particularly from 1996 to 1999.
Gold feeds on fear and inflation. Stock rise when the Dollar is strong, as
now,
Stocks rise when traders do not have to fear the Fed will suddenly raise rates.
Our Fed Chairman has promised very, very low interest rates for months and months.
4) Another factor explains how markets can go up sharply when business
conditions are poor. At these times, big corporations may not be
able to find new places to invest. A weak world-economy like we have now
is actually a good environment for a wave of mergers and buyouts.
If the governments will let them, the heads of big corporations
may choose to deploy their "idle" cash in buying out rising competitors.
When interest rates are low, creative book-keeping being what it is,
such a strategy may be a cheaper way to keep the company's profits and its
stock rising. Since the 1980s, Federal anti-trust actions have become less and
less common. So, the conditions have been excellent for such mergers.
Wall Street, of course, loves the finders' fee that buyouts bring. But higher
stock prices based solely on mergers and the hopes of being bought out
do not mean economic growth or more jobs. In the end, there actually may be
fewer jobs and less advertising as a result.
5) Often in a fast rising stocks market, like now, inflation (apart from health care
costs)
is under control. Producer prices, basic materials costs and wages are all
falling or flat. Jobs in 2013 are still going overseas where labor is cheaper,
The mantras of free trade and freedom of capital to go overseas dominate both parties'
elites and Wall Street. (The President has said nothing much about the
25%
drop in the Yen and says he want to encourage free trade with Japan, if
it
keeps its markets open.)
6) It is normal for stock prices to go up months before there is a substanial improvement
in the US economy. In fact, the economy need not even improve much for many years.
British unemployment in the 1920s never fell much below 8% from 1920 to 1929, yet
the Brisih stock market rose 73.2% from October 1921 to September 1929. True, this
was a modest gain compared to the 394% DJI gain from August 1921 to September 1929.
7)
In many ways, the DJI goes up the most when economic conditions are not robust.
This is not much appreciated. But when business is good and everyone is working
and has money, there are lots of ways to invest in new businesses. In good times,
like the 1950s. investors will certainly keep buying stocks, but not so exclusively.
People do not need to keep pushing stocks up and up because it is "the only
game in town". If economic conditions were sunny, they could also choose
to
start, expand or improve a business.
Our Accumulation Index rises to high levels and stays there for a long period
often when institutions and private investors (rich and not so rich) are forced by
rising equity prices, low bond yields and the absence of viable alternative investments
to keep pushing stock prices high. This is a powerful factor now, just as it
was in 2008,
when many more conservative Funds (like the California Teachers) took to buying
lots and lots of Crude Oil futures and ETFs..
8) And don't forget how Unemployment disciplines Labor. Low wages help
the bottom line. The opposite often helps unions start organizing. The 1946
25%
Stock Market decline took place in a tight labor market when Labor could afford
to go out on strike.
9)
Good earnings can be reported even without higher revenue if most
costs go down. Thus, the DJI was very strong from 1927 to 1929, in part
because commodity prices fell sharply in the late 1920s.
10) Even without a large pool of well-off consumers, many items eventually have to be
replaced. Air-conditioners, refrigerators and cars wear out. They are
necessities. Did you see that Ford's stock made a new high today?
But, eventually there is over-production and profits must start to fall
because there is not enough consumer buying power. Large numbers of
Unemployed and low-pay workers put defnite limits on any bull market.
It is no accident that wealth concentration in 2007 matched its pervious peak
Policies which promote excessive wealth concentration should be viewed, I think,
as very short-sighted. When enough Insiders see that the future does not
look good, their selling is noticed by Professionals. That is why we watch the
Closing Power. After it fails to confirm a new high and instead breaks its uptrend,
the market will become very dangerous if there has been an "artificial" stock
bubble like I have just described. Usually, too, the A/D Line has failed to
confirm the DJI's final advance by a wide margin. Only the very biggest companies,
the ones most completely in control of their markets, keep advancing at the
end of a long and hyberbolic advance.
Current DJI and Peerless Key Values compared with
Earlier 2nd Quarter Tops in Post Presidential Election year.
Date
DJIA La/MA
AnnRoc P-I
P-I ch
P^^
IP21 V-I
Opct
65PctChange
5/14/2013 15276 1.028
.416 +511
-79
+511 .145
+58 .314
.085
high
high high high
---------------------------------------------------------------------------------------------------------------------------------------------
5/29/1945 169
1.022
.267 +14
+5 +67
.022 -59
.158 .063
Sell S8... DJI
fell to lower band on 7/27/1945
7/8/1957
518 1.022
.324 -27
+4 -86 .038
-188
.331 .077
Sell S9 and 19% bear markt until
October.
5/17/1961 707.5
1.028 .259
+64 +19
+187 .04 -57 -.062 .098
No signal. DJI
tagged lower band on 6/19/1945
5/6/1965 933.5
1.021 .543
+83 +7
+229 .143 -10 .513
.031
Sell S8... DJI fell 11% to bottom on 6/28/1965
6/2/1989 2517.8
1.027 .604
+176 +34 +302
.142 +21
.308 .11
No signal. DJI
tagged lower band on 6/20/1945
5/14/2002 10298
1.024 .242
+107 +75 +107
-.024 -110
-.004 .054
Sell S9/S8 and DJI fell to
lower band on 7/27/1945
6/12/2009 8799
1.028 .718
+394 +104 +367
.079 -2
.146 .213
--------------------------------------------------------------------------------------------------------------------------------------------
==================================================================================
5/14/2013 DJI 15215 +124 Peerless
Remains on A Buy.
The Peerless key values improved so much today, a Peerless Sell may be
avoidable.
But
that will depend on good breadth continuing and down-day volume not suddenly
running up. The latter could drop the V-Indicator enough to bring a Sell later in
the
month.
The Japanese Yen fell further today while 10-Year interest rates rose again.
The
Tiger Index of Bonds fell further away from its falling 65-dma. .
Biotechs have turned up and jumped briskly today. I suspect they are anticipating
the
Supreme Court giving them the right to copyright genes.
Mays
do often bring declines. We have to be alert to that possibility. See the new
figures at the
bottom of today's Hotline. It shows there were 31 drops from a May peak to the lower
3%
band, or below. A little additional June strength was allowed. By contrast,
there were
only
9 cases where the DJI kept rising after what might have looked like a May peak.
This
might seem to suggest the DJI is 3.5x more likely to reach a peak in May and soon decline
to
the lower 3% band than keep on rallying for another month or more.
But
this is not the whole story.
Why
does the adage "Come May, Go Away" work so well? It has a lot to do with
professional traders locking in profits and going away for vacation. Probably the
pattern has now been widely noticed, it becomes self-fulfilling, up to a point.
But
when a pattern becomes too well know, smarter folks start to anticipate it
and
plan to take advantage of those following it to simplistically.
The Internals Now Are Very Good.
I
suggested last night that when the OBVPct is below .382, as now,
a May
decline is more likely. That was not as true for the period 1961-2012
as it
was for the earlier period 1935-1960. Below are the cases where
the
OBVPct was between +.260 and +.375 when it might have seemed
a
peak was being made in May. In 5 instances the DJI rallies for more
than
one more month. In 7 cases it soon declined to the lower 3.0% band.
There
are also other considerations, of course, now.
1) When the Adjusted P-Indicator (P^^) was above 300 in thse cases, the DJI rose
in 3 of 4 these cases.
2) When the IP21 was above >.134 in these cases, the DJI rose in 4 of 5 cases.
There was only one case there the P^^ was above +300 AND the IP21
above +.134. That was in May 1997. The DJI rose more than 1000 more
points (12%) and did not top out until July 30th. All 3 key values are higher
now than in this cases. So, I think we have to be optimistic.
Color Codes:
Peak Date in Blue indicates DJI kept rallying.
Peak Date in Purple indicates DJI declined to at least 3%
lower band.
Peak
LA/MA
AnnRoc P^^ IP21
V-I OBVPct 65-day
Date
Pct Change
--------------------------------------------------------------------------------------------------------
5/16/1978
1.03 .636
302
.006
5 .300
.092
5/7/1982
1.023
.454
236
.092
4 .294
.028
5/22/1985 1.03
.361
315
.039
11
.291
.013
5/3/1988 1.009
.455
101 .094
9 .315 .049
5/9/1991
1.011 .392
124
..057
5 .35
.062
5/271993 1.024
.486
168
.135
15
.303
.056
5/15/1995
1.026 .633
255
.136
15
.31
.113
5/23/1996 1.031
.444
140 .085
20
.271 .042
5/15/1997
1.048 1.117
384 .144
52
.264
.065
5/13/1999 1.028 .769
319
.07
35
.323 .179
5/10/2006 1.025
.527 108
.091 -10 .334
.072
5/3/2011 1.027
.412
113
.154 -47 ..332
.076
--------------------------------------------------------------------------------------------------------
5/14/2013 1.025
.495
590
.168
71 .315
.08
highest highest highest
5/14/2013 ---> To Key Index and Leading Stock
Charts
---> 546 +205 MAXCP stocks Bullish
MAXCP Stocks (5/14/2013) Bullish plurality
---> 41
MINCP stocks Bearish MINCP Stocks
(5/14/2013)
---> 206 New Highs on NASDAQ 9
new lows. Bullish plurality
---> 382 New Highs on
NYSE 8 new lows. Bullish plurality -
I
doubt if Peerless will give a Sell signal this month. The Adjusted
Pvv-Indicator (+590)
is
now higher than any of the earlier years where a 2ndQTR top was made that
dropped the DJI to at least the 3% lower band. The difference between it now
and
its high in the cases where there was a reversal is a whopping +223. The
IP21 reading now is +.168. This is substantially above the
+.143 level that was the
highest reading for this indicator on a 2nd QTR reversal in a Post Pres.Election year.
Significantly, because this is what the S9V and S15s pay attention to,
the V-Indicator jumped to +71 today. This is way above the
highest reading
in
the cases below. The high for the the V-Indicator among these tops was a mere +21.
Current DJI and Peerless Key Values compared with
Earlier 2nd Quarter Tops in Post Presidential Election year.
Date
DJIA La/MA
AnnRoc P-I
P-I ch
P^^
IP21 V-I
Opct
65PctChange
5/14/2013 15215
1.025 .495 +590 +162 +590 .168
+71 .316
.08
high high
high high high
---------------------------------------------------------------------------------------------------------------------------------------------
5/29/1945 169
1.022
.267 +14
+5 +67
.022 -59
.158 .063
Sell S8... DJI
fell to lower band on 7/27/1945
7/8/1957
518 1.022
.324 -27
+4 -86 .038
-188
.331 .077
Sell S9 and 19% bear markt until
October.
5/17/1961 707.5
1.028 .259
+64 +19
+187 .04 -57 -.062 .098
No signal. DJI
tagged lower band on 6/19/1945
5/6/1965 933.5
1.021 .543
+83 +7
+229 .143 -10 .513
.031
Sell S8... DJI fell 11% to bottom on 6/28/1965
6/2/1989 2517.8
1.027 .604
+176 +34 +302
.142 +21
.308 .11
No signal. DJI
tagged lower band on 6/20/1945
5/14/2002 10298
1.024 .242
+107 +75 +107
-.024 -110
-.004 .054
Sell S9/S8 and DJI fell to
lower band on 7/27/1945
6/12/2009 8799
1.028 .718
+394 +104 +367
.079 -2
.146 .213
--------------------------------------------------------------------------------------------------------------------------------------------
Key Values at
May Tops: 1960-1990
Color Codes:
May Peaks immediately before DJI Declines to at least 3%
Lower Band
Mays That Did Not Bring A Peak.
Red LA/MA means DJI is overbought, above +1.026
Blue OBVPct means the vakue here is above +.365
Red OBVPct means the value here is below +.362
Peak LA/MA
AnnRoc P^^ IP21
V-I OBVPct 65-day
Pct Change
--------------------------------------------------------------------------------------------------------
5/19/1961 1.026
.376 192
.033 -43 .027
.081
5/14/1965 1.017
.346
50
.097 -291 .250 .049
^^^
5/9/1967 1.02
.777
307
.132 11 .517
.046
5/14/1969 1.028
.467
138
.097 0 .346
.023
5/30/1972 1.025
.214
-40
-.005
-1 .228
.049
5/8/1973 1.01
.321
-95 .135 -2 .007
.026
5/9/1974 1.021
.266 -245 -.061 -2
.123
.053
5/15/1975 1.024
.476 201 -.034
+1 .257 .165
5/10/1976 1.014
.365 33 .162 0
.166
.042
5/5/1977 1.017
.147 263
.065
+1 .468
-.021
5/16/1978 1.03
.636 302
.006
5 .300
.092
xxxx
5/22/1980 1.043
.636
502
.147
4 .484
.092
5/7/1982
1.023
.454
236
.092
4 .294
.028
5/1/1984 1.025 .186
-65
-.004
-2 .117
-.041
5/22/1985 1.03
.361
315
.039
11
.291
.013
xxxx
5/28/1986
1.047 .229 -35
.052 -2 -.111
.097
5/6/1987
1.021 .328 -364
-.079
-15 -.150
.069
5/3/1988 1.009
.455
101 .094
9 .315
.049
5/22/1989 1.034
.456
173 .100
12 .033
.076
5/22/1990 1.04
.808
294
.128
23 .525
.076
5/9/1991
1.011 .392
124
..057
5 .35
.062
5/19/1992 1.012
.219
123
..052
-2
.139
.045
5/271993 1.024
.486
168
.135
15
.303
.056
xxxx
5/20/1994 1.022
.543
103
.114
8 .247 -.044
5/15/1995
1.026 .633
255
.136
15
.31
.113
xxxx
5/23/1996 1.031
.444
140 .085
20
.271 .042
5/15/1997
1.048 1.117
384 .144
52
.264
.065
xxxx
5/4/1998
1.015 .271 -162
.004 -36 .017 .133
5/13/1999 1.028
.769 319
.07
35
.323 .179
5/16/2000 1.021
.699
47
.075
14
.121 .047
5/21/2001 1.041 .832
400
.151
78
.082 .039
5/17/2002 1.028 .175
51 -.014 -.149
.078 .035
5/12/2003 1.032
.713 634
.157 +177
.061
.092
xxxx
5/31/2005 1.009
.316 481
.124
43
.221 - .036
5/10/2006 1.025
.527 108
.091 -10 .334
.072
5/18/2007 1.025
.675 141
.143
+44 .512
.06
5/5/2008
1.020
.338 124
.025 -37 ..083
.024
5/8/2009
1.053 1.083
629
.077 219 ..151 .073
5/3/2011 1.027
.412
113
.154 -47 ..332
.076
5/1/2012 1.018
.061 78
-.003 -87 ..035
.046
====================================================================================
OLDER HOTLINES
====================================================================================
5/13/2013
DJI 15118
Peerless Remains on A Buy.
A shallow retreat now would probably be constructive and
avoid the new
Peerless sell, which would occur if the DJI were to rally 3/4 percent higher
with no improvement from the V-Indicator. The P-Indicator is positive.
That is bullish, but the OPct is below +.22. After a run-up
into
May, in the past this low a level for the OPct has been a warning sign that a peak will
be made this month and a decline is coming that will take the DJI to the lower band.
I don't have time this evening to show all the data since 1935, but looking
at the cases between 1935 and 1960, we see 8 cases where the DJI kept
rising after May. The dates of the May peaks in these cases are colored blue.
In all 8 cases the OBVPct was above +.366. In 11 years, the May peak brought
a DJI decline to the lower band or lower. At 9 of
the 11 May peaks, the OBVPct
was below .361. Right now the highest the OBVPct has
been this month
is only +.280 (on 5/8/2013). OBVPct measures aggressive buying. It
appears that the aggressive buying is no longer high enough for enough
stocks on the NYSE to prevent a May decline. (There are still a good many
very
bullish looking stocks. They will probably not decline much in a 4%-5%
DJI decline.)
Color Codes:
May Peaks immediately before DJI Declines to at least 3%
Lower Band
Mays That Did Not Bring A Peak.
Red LA/MA means DJI is overbought, above +1.026
Blue OBVPct means the vakue here is above +.365
Red OBVPct means the value here is below +.362
Peak LA/MA
AnnRoc P^^ IP21
V-I OBVPct 65-day
Pct Change
------------------------------------------------------------------------------------------------------
5/23/1935 1.036 .774
399
.095 78
.36 .093
5/31/1939 1.041 .936
446
.077 71
.391 -.061
5/9/1940
1.000 -.112
-255 -.164 -135
.026
.021
5/28/1942 1.028
.766
204 .124
8 .457
-.046
5/20/1943 1.014
.497
308
.112 40
.367
.075
5/26/1944 1.011
.361
638
.215 72
.440
.026
5/28/1945 1.018
.310
41 -.164 -68
.165
.055
5/29/1946 1.029 .329
251
.269
43 .345
125
5/5/1947
1.021 -.160
-392 -.176 -172
.143 -.032
5/26/1948 1.031
.657
484 .167
140 .458
.122
5/4/1949 1.006
.000
-344 .269 -148 .194
-.015
5/19/1950 1.026
.463
257 .141
6 .411
.091
5/3/1951 1.031 .739
232
.228 47
.511
.055
5/4/1953 1.012 -.078
87
-.053 -16 .056
-.034
5/21/1954
1.031 .545
268
.110 23
.53
.111
5/17/1957 1.019
.495
137
.064 -64
.435
.086
5/6/1958 1.029
.625 568
.197 263
.474
.021
5/29/1959
1.021 .378
-135
.006 -370 .267
.065
5/19/1960
1.026 .376
192
.033 -43 .027
.081
to be continued....
Right now, without a new Peerless Sell, such a decline should be limited
to a testing of the rising 65-day ma at 14500.
Breadth was not good today but the DJI did not decline
much. I take
this as a sign that the market does not want to go down much for the next two weeks.
This is important because the DJI has declined more often than it has risen
from 5/13 to 5/28.
The decline in the Japanese Yen could accelerate
and the rise in 10-year interest
rates has started to spook the bond market again. These developments could easily
worsen and provide stock traders reasonsto take some nice profits more quickly and
more clumsily than carefully and politely. So this is a Warning: Do not expect
the financial press or Washington to tell you that a currency war has started
because Japan's financial solvency is in doubt. Washingon and Wall Street
are deeply committed to Free Trade and No Limits to Foreign Investments.
Merely to admit the possibility of a Currency War would make it more likely.
Likewise, I don't believe the Fed is not going to tell the public as soon as they
tell the big banks that they are going to stop their program of 'Quantitative
Easing".
We will be better served watch closely the charts for FXY,
TNX, the Tiger Index of Bonds
and the Tiger Index of Big Bank Stocks.
Presently, the Tiger Big Banks' chart provide us the same message that the
rising Tiger Closing Powers do, name professionals still believe the general market
will go higher. That is also what Peerless is saying. And the continuing
weakness
of the gold and silver stocks like ANV and SSRI also communicate the same message.
Usually precious metals' stocks start to rise when investor confidence is
turning bearish.
Further more, if you look at some of hyperbolic moves in our Bullish MAXCP stocks,
you can see there is no shortage of speculation where insiders and Professionals
have taken controling positions in a stock. The very high levels of
Accumulation mean the stock is tightly held at this point and the insiders
believe really good news is due about 6 months to a year from the highest bulge
in the Accumulation Index.
Current
DJI and Peerless Key Values compared with
Earlier 2nd Quarter Tops in Post Presidential Election year.
Date
DJIA La/MA
AnnRoc P-I
P-I ch
P^^
IP21 V-I
Opct
65PctChange
5/13/2013 15092 -27
1.019 .182 +427
-1 +427
.075 +16 +7 .217 .075
high
high
5/29/1945 169
1.022
.267 +14
+5 +67
.022 -59
.158 .063
Sell S8... DJI
fell to lower band on 7/27/1945
7/8/1957
518 1.022
.324 -27
+4 -86 .038
-188
.331 .077
Sell S9 and 19% bear markt until
October.
5/17/1961 707.5
1.028 .259
+64 +19
+187 .04 -57 -.062 .098
No signal. DJI
tagged lower band on 6/19/1945
5/6/1965 933.5
1.021 .543
+83 +7
+229 .143 -10 .513
.031
Sell S8... DJI fell 11% to bottom on 6/28/1965
6/2/1989 2517.8
1.027 .604
+176 +34 +302
.142 +21
.308 .11
No signal. DJI
tagged lower band on 6/20/1945
5/14/2002 10298
1.024 .242
+107 +75 +107
-.024 -110
-.004 .054
Sell S9/S8 and DJI fell to
lower band on 7/27/1945
6/12/2009 8799
1.028 .718
+394 +104 +367
.079 -2
.146 .213
FXY - ETN for Japanese Yen.
This is the most bearish chart I can presently find.
I doubt if the lower band will hold.
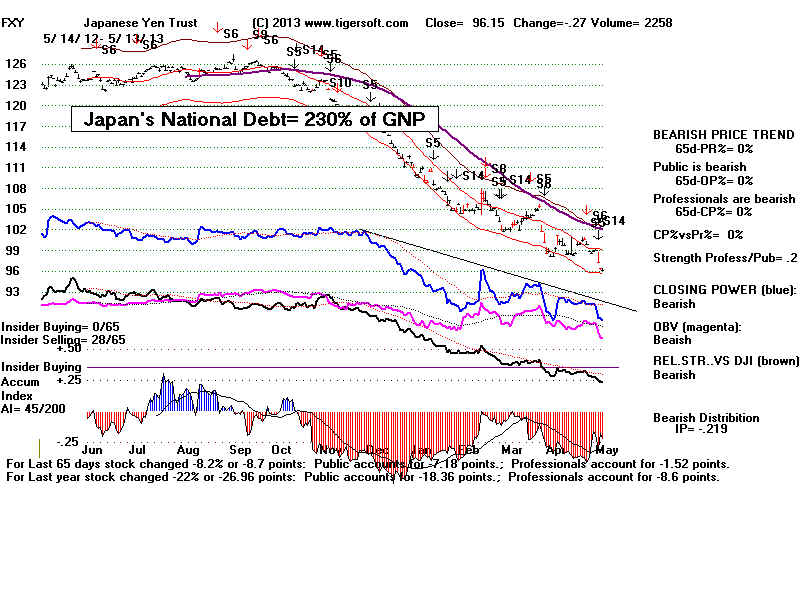 |
ETN = Interest Rate on 10-Year Bomds
Its Least Squares trendline is rising. That puts bonds
at significant risk given how very low interest rates are
now compared to the any time in the past.
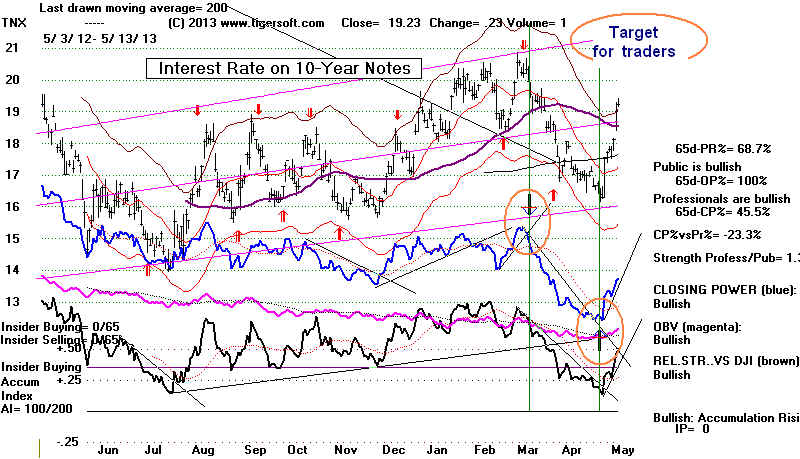 |
Tiger Index of Bonds
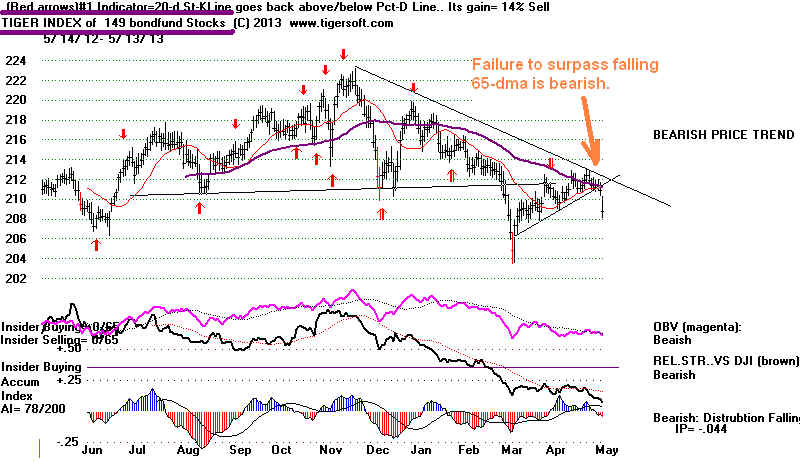 |
Tiger Index of Big Banks
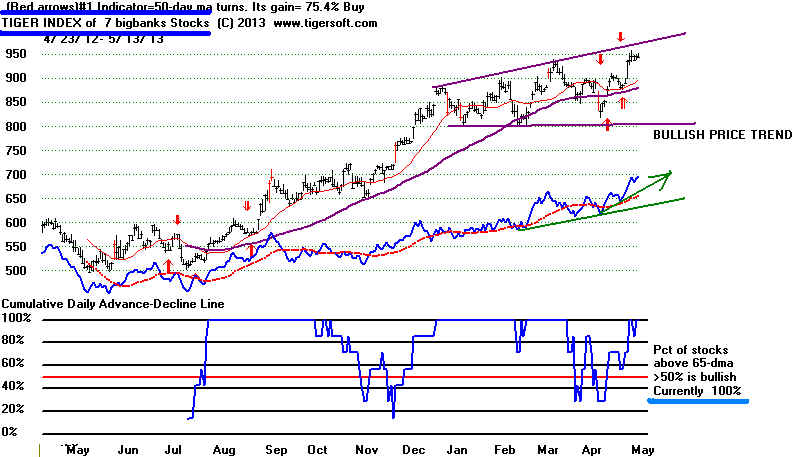 |
5/13/2013 ---> To Key Index and Leading Stock
Charts
---> 341 MAXCP stocks
Bullish MAXCP Stocks (5/10/2013) Bullish plurality
---> 41
MINCP stocks Bearish MINCP Stocks
(5/10/2013)
---> 131 New Highs on
NASDAQ 6 new lows. Bullish
plurality
---> 203 New Highs on
NYSE 6 new lows. Bullish plurality -
===================================================================================
OLDER HOTLINES
===================================================================================
5/10/2013
DJI 15118
Peerless Remains on A Buy
.
A Shallow Retreat This Week Would Probably Be Healthy,
and Prevent A Peerless Sell Signal for A While Longer.
Without A Peerless Sell Signal, a decline below the rising 65-dma
at 14500 seems very unlikely.
At 2% over the 21-day ma, the DJI is always
susceptible to a retreat in May when
the V-Indicator drops so close to zero. A 1/2% rally from here with only
a
slight decline in the V-Indicator would probably bring a Sell S9V or Sell S15.
Since 1965, the DJI has fallen 1/2% on average over the next 5 trading days.
It has risen only 40.4% of the time in this period. SPY is 2.8% over the 21-day ma.
A retreat usually ensues. SPY's CCI has failed to confirm by a the same amount
that it did last Summer. But back then Peerless gave a Sell Signal. It has not
here. Since in 2011 SPY reached a point 7.5% over the 21-day ma, I think it
is
better to rely in Peerless, the A/D Line and the Closing Power uptrends.
Watch The 10-year Interest Rates and The Yen
When the market reaches an over-bought status like we now see, it becomes
much more likely to fall back from any bearish news. Such bearish news could
be a continuation higher of short term interest rates. It could be a steepening
in the decline of the Yen, which would rattle trade among the Pacific rim nations.
We can take some profits in a few of the stocks that have run up. But there
are not many bearish MINCP stocks to choose from to go short with as
hedges.
Current DJI and Peerless Key Values compared with
Earlier 2nd Quarter Tops in Post Presidential Election year.
Date
DJIA La/MA
AnnRoc P-I
P-I ch
P^^
IP21 V-I
Opct
65PctChange
5/10/2013 15118
1.022 .204
+428 +1
+428 .088 +9 +2
.198 .075
high
high
5/29/1945 169
1.022
.267 +14
+5 +67
.022 -59
.158 .063
Sell S8... DJI
fell to lower band on 7/27/1945
7/8/1957
518 1.022
.324 -27
+4 -86 .038
-188
.331 .077
Sell S9 and 19% bear markt until
October.
5/17/1961 707.5
1.028 .259
+64 +19
+187 .04 -57 -.062 .098
No signal. DJI
tagged lower band on 6/19/1945
5/6/1965 933.5
1.021 .543
+83 +7
+229 .143 -10 .513
.031
Sell S8... DJI fell 11% to bottom on 6/28/1965
6/2/1989 2517.8
1.027 .604
+176 +34 +302
.142 +21
.308 .11
No signal. DJI
tagged lower band on 6/20/1945
5/14/2002 10298
1.024 .242
+107 +75 +107
-.024 -110
-.004 .054
Sell S9/S8 and DJI fell to
lower band on 7/27/1945
6/12/2009 8799
1.028 .718
+394 +104 +367
.079 -2
.146 .213
Other than the DJI, the broader market still should go
higher
unless we get a new Peerless Sell or the A/D Line Breaks Its Uptrend..
I take it as bullish for the Summer that so many new highs still
show very high Accumulation. Big institutions and insiders are not intimidated
by the DJI being at an all-time high. Bullish, too, are the rising Closing Powers
of the major market ETFs. Strikingly, the most bearish looking
stocks, are leveraged short ETFs on the major market indices.
Short Term Rates Jumped Friday
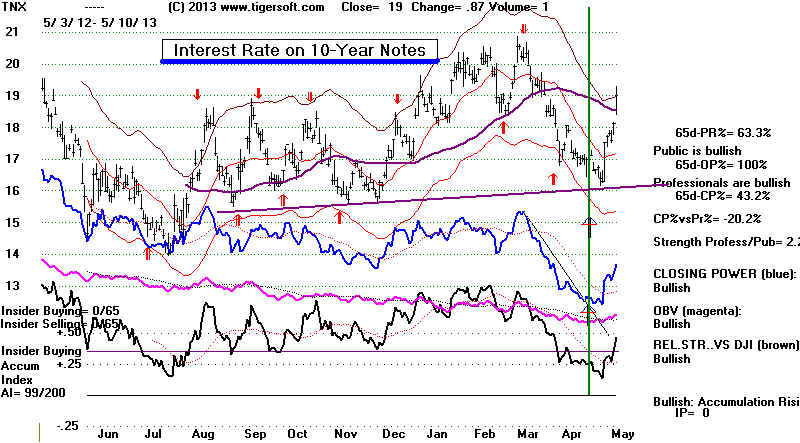
That ran a scare through the Bond Market. A rise in short-term interest
rates might also unnerve aggressive holders of stocks, who think that
Bernanke may back off from his QE-III policies.
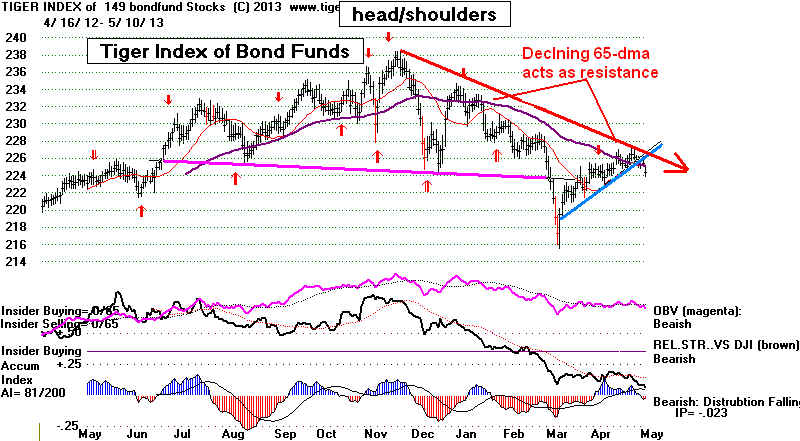
Will The Japanese Yen's Decline
Worsen?
Will It Be Compared To The Collapse of The
Argentine Peso?
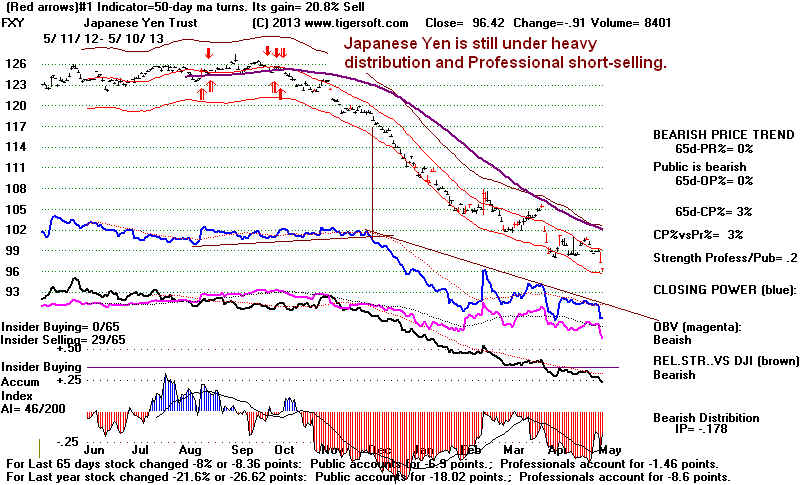
Japan Has Put Pride Aside and Lets It Currency Fall
For Now This Has Boosted Exports and |Japanese Stocks.
If Japan's Experiment Succeeds, Others Will Try It.
But Will It Succeed?
The Japanese Yen keeps
falling. It is now down 21% in the past six months.
The conservative and
nationalist Japanese Prime Minister Shinza-Abe claims
that he deliberately
put his country's exports above such things as national pride
and safeguarding his
large elderly country against inflation. He says that he
has chosen to have the
Bank of Japan lower the Yen as part of an aggressive
pro-Inflation policy.

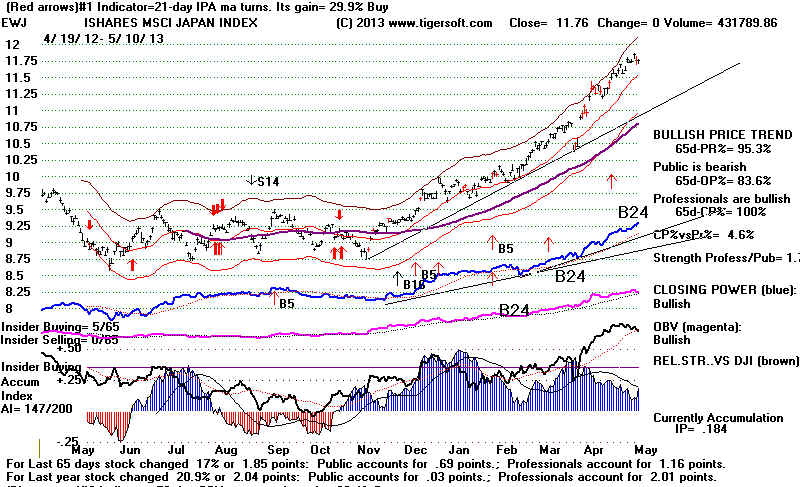
His policies have
boosted the Japan's Stock Index (TPX) by 51% since November 15th.
So, perhaps, he did
chose a Japanese version of QEIII. Perhaps.
But this would be a
first! It would be highly unusual, especially for a conservative
nationalist.
Usually conservative and nominally progressive political leaders
choose to enhance their
currency and risk deflation <1>
Rather than accept the
Japanese PM at his word, I think a more likely explanation
is that Japan's economy
was and is in such dire shape that that the Japanese PM had no
other choice. If
I am right, the Japanese Yen will break below its lower band
and drop much further.
The risk in currency devaluations is that they cannot
always be controlled.
Once speculators see they have a currency "on the ropes",
they usually do not
relent until there has been a much bigger decline. Credit
Default Swaps that
insure Japan's debt from non-payment have risen from
57 basis points on
March 11th to April 12th. George Soros will not say how
much he is short the
Yen. But he must be.
George
Soros says the Japanese policy is "dangerous". Japan's quantitative
easing is
proportionately 3x more
than in America. Japan's debt to GNP ratio is expected
to grow to 245% of the
nation's output.
"They may not be able to stop
it. If the Japanese yen starts
to fall in value
and the people of Japan lose faith and don’t want to invest their money
in the Yen, they may put their money abroad, which could cause the Yen’s fall
to become an avalanche."
What happens to the
Japanese Yen will have lots of financial and economic
ramifications Do
American banks hold much Japanese debt? Who does?
Right now, only the
American car industry and auto workers seems aware of
the risks for them if
the Yen goes into an even bigger dive. Meanwhile,
Japanese companies like
Toyota have gained a huge advantage vis-a-vis GM
and Ford in the US.
While Currency Wars are a lot better than shooting wars or
tariff wars, they do
require a response by injured trading partners. So
far, the Obama
Administration has said little. Clearly, he is heavily influenced
by Wall Street
free-traders.
So far, in the US only
Detroit auto-makers and auto-workers seem to see the
Japanese currency
decline for what it is, namely, the start of a currency war with
America and other
manufacturing countries.
5/10/2013 ---> To Key Index and Leading Stock
Charts
---> 319 MAXCP stocks
Bullish MAXCP Stocks (5/10/2013) Bullish plurality
---> 31
MINCP stocks Bearish MINCP Stocks
(5/10/2013)
---> 131 New Highs on
NASDAQ 6 new lows. Bullish
plurality
---> 203 New Highs on
NYSE 6 new lows. Bullish plurality -
<1>
Normally, conservatives
and nationalists nearly always seek to enhance their country's
currency in
international dealings. The classic case was the ever Flag waving
Tory, Winston
Churchill. In 1926, as Chancellor of the Exchequer, he gladly did
the bidding of London's
financial elite and took the Pound Sterling back to pre-World War
I levels, $4.80/Pound,
in an effort symbolically to restore early English international
pre-emminence.
The economic consequences of going back on the Gold Standard
were quick and severe.
Defending the Pound required high interest rates to attract
foreign capital.
That hurt the domestic economy, consumption, home-building and
investing in new plants
and equipment. The higher Pound brought a sharp drop in
exports of manufactures
goods like textiles and coal, another key export. Imports
increased and the
wealthy British invested overseas rather than in England. Naturally,
unemplopyment rose
sharply thereby causing still less consumption of British
manufactured goods.
=====================================================================================
OLDER HOTLINES
=====================================================================================
5/9/2013 DJI 15,000+ Peerless Remains on A Buy. The 5 1/2 month
long DJI
advance is showing some weakening by the Peerless internal strength
indicators. But they have probably not reached the point where a decline
much below the 21-day ma is likely. I say this based on the absence of
a new Peerless signal and because the degree of deterioration needed
to produce such a decline are absent from the two key Peerless indicators,
the P-I and the V-I. The current Accumulation Index (IP21) could be
more robustly bullish, but its current level is not by itself bearish enough
to produce a Sell.
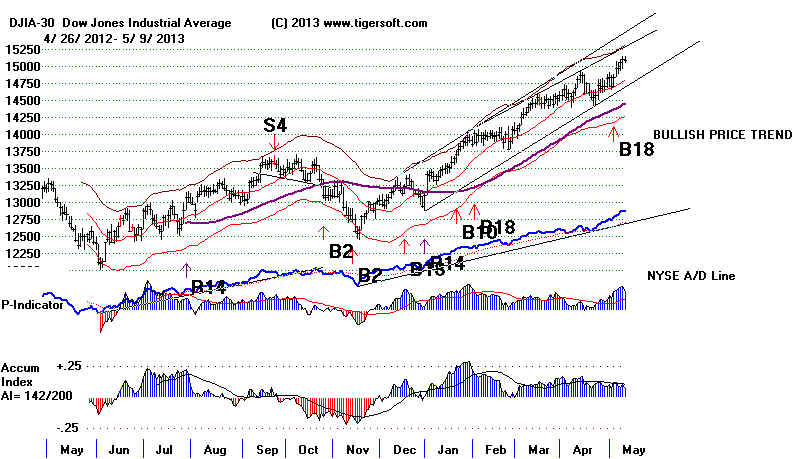
Compare the current chart with others with a rising DJI in the Post-Presidential
Election year. The key indicators are the P-Indicator, the V-Indicator, the
Accumulation Index (IP21) and the Opct. See how much more weakness
was needed after April in 1945, 1957, 1961,
1965, 1989, 1993,
and 2009
to bring about a decline from above the 2% upper band to the lower 3.5%
decline.
If you study these key values, I think you will see that the current P-Indicator
is too high to match the cases below that brought a decline to the lower band.
In all but one case (189) was the V-Indicator much above its current
readings now. In additon, there were only two cases (1965s) when a top
was made this early in May. The IP21 level now is lower than 4 of the
cases below.
So now we must watch the V-Indicator I would conclude. And
even if it does
deteriorate, and turn negative, when the DJI closes 2% over the 21-day ma,
the very positive P-Indicator will probbaly save the DJI from a decline
to the lwer band.
Current DJI and Peerless Key Values compared with
Earlier 2nd Quarter Tops in Post Presidential Election year.
Date
DJIA La/MA
AnnRoc P-I
P-I ch
P^^ IP21
V-I
Opct 65PctChange
5/9/2013 15083 -22 1.02
.226 +427 -117
+427 .076 +7 -24
.210 .073
high
high
5/29/1945 169
1.022
.267 +14
+5 +67
.022 -59 .158
.063
7/8/1957
518 1.022
.324 -27
+4 -86 .038
-188
.331 .077
5/17/1961 707.5
1.028 .259
+64 +19
+187 .04
-57
-.062 .098
5/6/1965 933.5
1.021 .543
+83 +7
+229 .143 -10 .513
.031
5/13/1965 938.9
1.018 .399
+24 +3
+68 .11
-262
.254 .04
6/2/1989 2517.8
1.027 .604
+176 +34 +302
.142 +21
.308 .11
8/2/1993 3652
1.02
.288 +153
+21 +262
.088 +8
.33
/039
5/14/2002 10298
1.024 .242
+107 +75 +107
-.024 -110
-.004 .054
6/12/2009 8799
1.028 .718
+394 +104 +367
.079 -2
.146 .213
5/9/2013 ---> To
Key Index and Leading Stock Charts
---> 350 +77 MAXCP stocks
Bullish MAXCP Stocks (5/9/2013) Bullish plurality
---> 39 +2 MINCP stocks Bearish MINCP Stocks
(5/9/2013)
---> 171 +66 New Highs on
NASDAQ 6 new lows. Bullish
plurality
---> 349 New Highs on NYSE 5
new lows. Bullish plurality
-
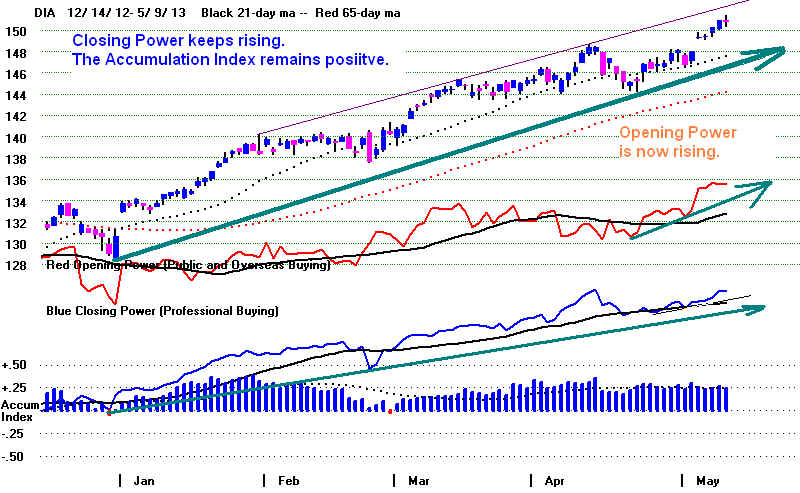
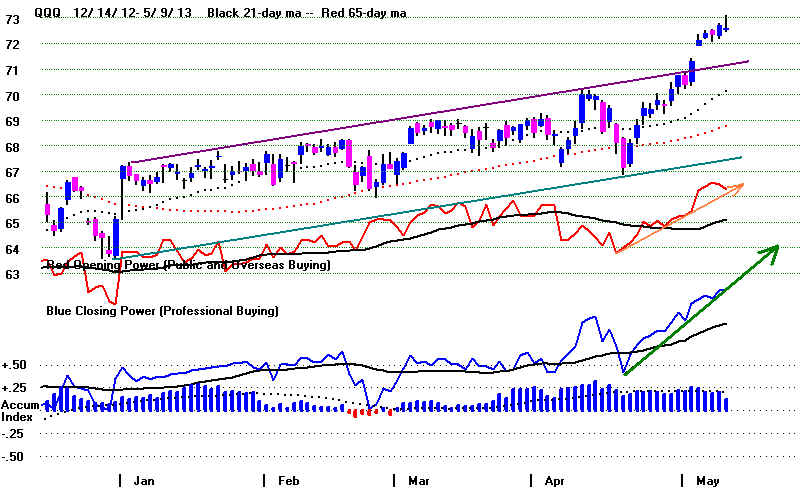
====================================================================================
OLDER HOTLINES
===================================================================================
DJI 15,000+ The
V-Indicator Is Too Positive for a Peerless Sell.
But with the DJI 2.2% over the 21-day ma, a pullback is becoming
more and more likely. Without a Peerless Sell signal, the decline
will probably be shallow. Seasonality has turned bearish. If the
market does pull-back, beaten-down gold stocks like ANV should
bounce a long ways up. Watch ANV's Closing Power.
DJI and Peerless Key Values
Date
DJIA La/MA
AnnRoc P-I
P-I ch
P^^ IP21
V-I
Opct 65PctChange
5/8/2013 15105
+49 1.022 .348 +544
+23 +544 .104 +34
+2 .299 .081
high
5/8/2013 16800
on the DJI would be a typical goal after a second Peerless
Buy B18 in
84 trading days. Right now, the DJI must deal with the nearby upper band,
which is
fast approaching. Again
tonight, I can report that breadth is bullish and the Closing Power
numbers are overwhelmlingly bullish
and CP uptrends are still rising. At an all-time high,
the path of least resistance is
still up, I would judge, until we actually tag the 3.5% upper band.
5/8/2013 ---> To Key Index and Leading Stock
Charts
---> 435 +85 MAXCP stocks
Bullish MAXCP Stocks (5/82013) Bullish plurality
---> 32 -7 MINCP stocks Bearish MINCP Stocks
(5/8/2013)
---> 153 -18 New Highs on
NASDAQ 8 new lows. Bullish
plurality
---> 369 +20 New Highs on NYSE 3
new lows. Bullish plurality
-
Despite these uptrends, we have to
be careful. The DJI has declined 55.3% of the time
over the two weeks following May
8th since 1965. The average decline was 0.6%.
In additon, caution is needed
in view of the fact that the DJI has now closed 2.2%
over the 21-day ma and the
V-Indicator is only +34. While a Peerless Sell signal
is unlikely today or tomorrow,
the rush to buy with the DJI over 15000 may have to
give way to a pause and some more
profit-taking.
Below are the cases when the
DJI was 2.1% or more above the 21-day ma and
the V-Indicator was positive,
but ranged only from +15 to +60. These are the
May or June cases in the last
20 years. They roughly parallel the key values now.
.
In 3 of the 12 cases, with the DJI
up between 2.1% and 3.0% above the 21-day ma
and the V-Indicator between
+12 and +29, there were 4 significant, immediate declines.
In two cases, 2011 and 2009, the
DJI fell 7%. In the 1996 case, it fell 8%. In the 1999
instance, the DJI fell about 5%.
This suggests a 33% chance for a decline to the
lower band. But each of
these cases first brought a Peerless Sell. We have none
yet. By contrast, there were only 2 cases where the DJI continued to advance
strongly without some kind of
hesitation: 1995 and 1997. There were 3 other
cases where the DJI continued to
rally between 1.5% and 3.0%: 2001, 2004 and 2005.
Two of these three small rally
cases then brought significant reversals.
All of this suggests that a
pull-back soon might actually be better for the market.
So, watch the Closing Powers for
the key ETFs. It would take a close 1.33 points
below the opening for SPY's Closing
Power to break its steep uptrend.
May and June Case Where DJI was between 2.1% to 3.3% over
the 21-day ma with the V-Indicator between +15 and +60.
La/MA
AnnRoc P-I
P-I ch
P^^ IP21
V-I
Opct 65PctChange
6/19/2012 1.028
.447 415
+172 +415 .14
+ 39
.046 -.032
DJI pulled back only to 21-dma and rallied
again to new highs.
==> 6/21/2011 1.027
.439 303
+110 +294 .08
+12
.021
-.033
DJI immediately declined 7% and then rallied to
new highs.
===> 6/1/2009 1.03
.785
399 +79 +372
.042 + 18
.07
.181
A week later the DJI began a decline of 7%.
5/18/2007 1.025
.675 157
+82 +141 .143
+ 44 .512
.06
DJI fell back 2.5% and then advanced
to peak 6% higher.
5/19/2005 1.022
.559 317
+115 +429 .150
+ 19 .305
-.033
DJI rose 1.5% more and then fell
back 3% and then rose to a new highs.
6/8/2004 1.033
.372 477 +125
+ 447 .10
+ 35
.12 -.016
DJI rose 1.5% more and then fell back
6.5%.
5/10/2001 1.026
.907 265
-22 + 258 .147
+ 43 .074
-.005
DJI rose 3% and then
plunged 26% in aftermath of 9/11.
====> 5/12/1999 1.021 .671
312 -16 +
311 .057 + 29
.327
.155
DJI fell to lower band and then rallied
to a new highs.
5/19/1997
1.025 .89
277 -12
+ 338 .107
+ 45 .256
.028
DJI advanced 1000 more points before reversing.
====> 5/17/1996 1.025 .291
163 +14 + 208
.039 + 27
.264
.019
DJI
peaked a few days later and then fell 8%.
5/10/1995 1.026
.574 173
+ 6 + 239 .103
+ 11 .219
.106
DJI rallied strongly and much higher.
5/27/1993 1.024 .486
98 -7 168 .136 15 .298 .056
DJI fell back 3% and then rallied
strongly.
Is It Time To Buy A Gold Stock?
My
favorite would be ANV if it could break its Closing Power
downtrend.
The
Closing price would have to be about a point over the opening to accomplish
that.
It has not had a significant rally going all the way down from over 40.
That
means it ought to bounce back to $12 very quickly if it can achieve
a
reversal soon. Discipline has correctly kept us from buying in this
brutal decline. That is still needed. Wait for the blue Closing Power
to
break its downtrend, before playing it on the long side. I like ANV
because its main interests are in Nevada and Mexico. Nationalization
is
not a threat to shareholders. Usually before a bottom is reached,
the
broader Public shareholders must panic. We haven't seen its Opening
Power
turn down sharply yet in this decline. But with it now below
$10,
there must have been a lot of distressed, dismayed selling. To make
it worth
trading for a rally back to $12, I would like to buy it between $8 and $9.
ANV
was a $4 stock only 4 years ago. Thinner stocks offer more
potential to traders, but we can't fall in love with them. See in the
second ANV chart below how good it looked in 2009.
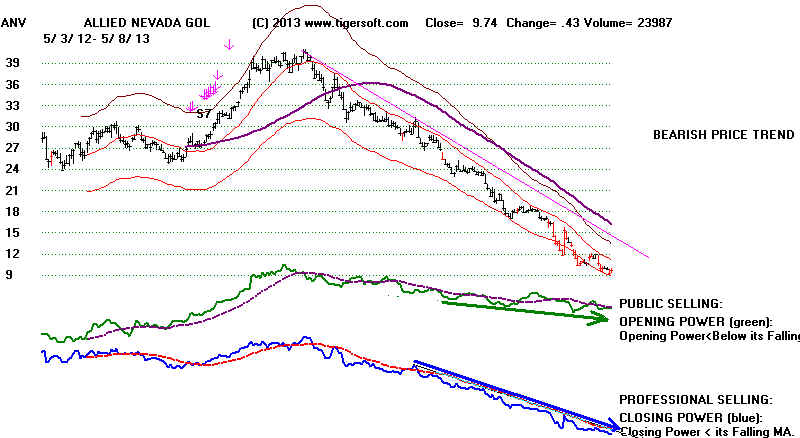
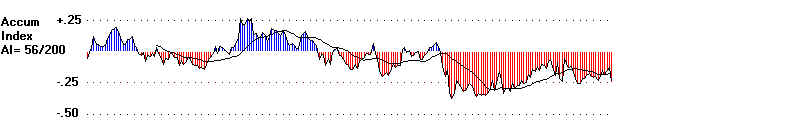
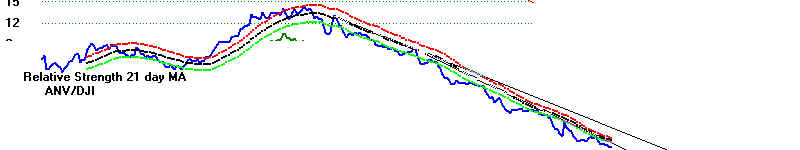
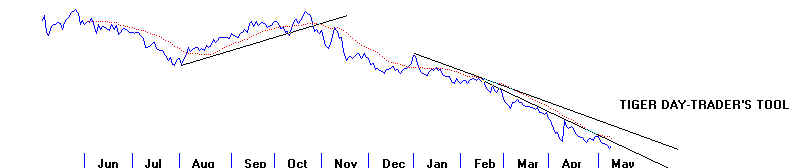
ANV 2009
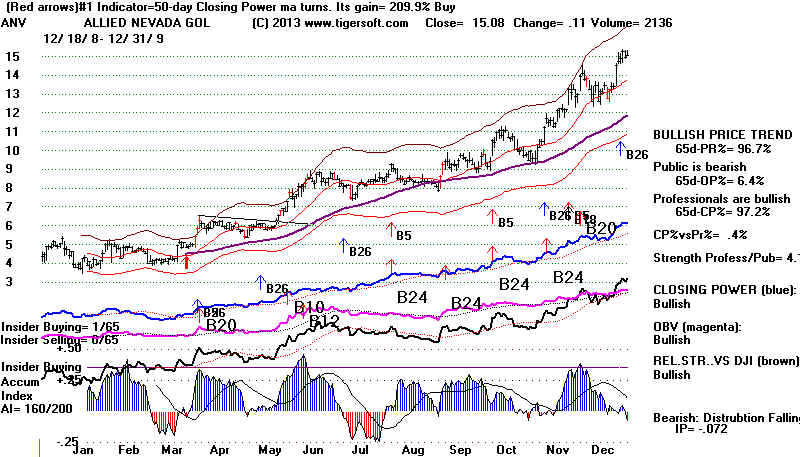
=====================================================================================
OLDER HOTLINES
=====================================================================================
15,000 - What's Wall Street Smokin'?
Date
DJIA La/MA
AnnRoc P-I
P-I ch
P^^ IP21
V-I
Opct 65PctChange
5/7/2013 15056
+87 1.02 .358 +521
+17 +521 .086 +32
-1 .278 .089
high
slipping
5/7/2013 16800
on the DJI would by typical of a second Peerless Buy B18 in
84 trading days. Right now, the DJI must deal with the nearby upper band.
But
breadth and the Closing Power
numbers remain strong. Even the V-Indicator is too positive
to bring a Sell if the DJI
does tag the upper 3.5% band, 225 points above today's close.
That defensive biotech AMGN shows an uncompleted head and shoulders
pattern can
be interpreted as normal
rotation given the ample number of stocks making new highs
with high Accumulation
readings and confirming Closing Powers. Let's see if AAPL
\can
resume its reversal back
upwards and IBM can back above its 65-dma.
Low inflation
numbers (apart from health
insurance, home renting and foods, which the Fed does not
seem to consider important
enough to include in its calculations) keep sending Gold lower.
If I am right that the
President, the Federal Reserve and Wall Street Big Banks
have made an unholy alliance,
each for different reasons, to boost stock prices,
then we have to remain
bullish, at least as long as Professionals do and for as
long as the Big Banks' Tiger
Chart is in an uptrend. It also must be considered
bullish that JP Morgan is now
the highest Accumulation stock in the DJI-30.
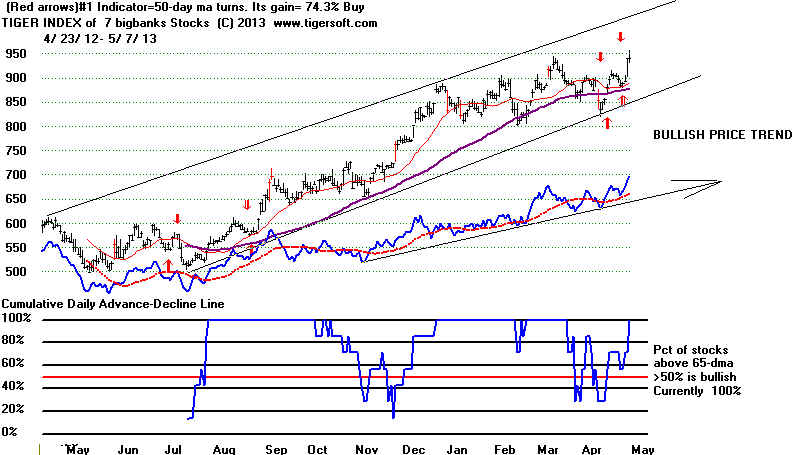
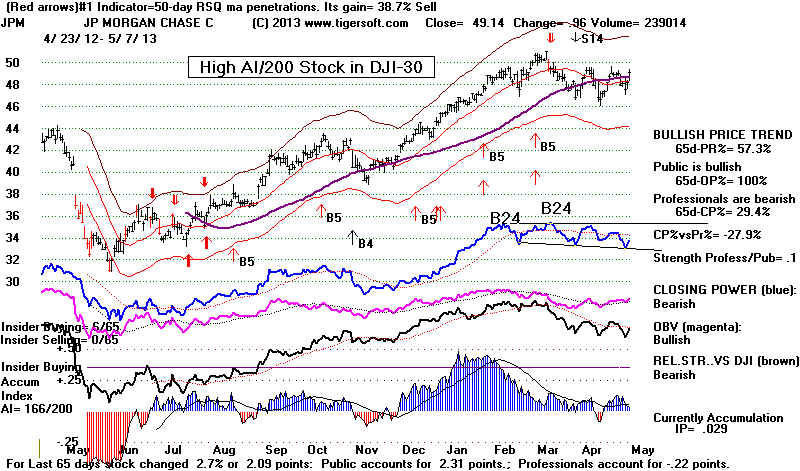
5/7/2013 ---> To Key Index and Leading Stock
Charts
---> 350 +77 MAXCP stocks
Bullish MAXCP Stocks (5/72013) Bullish plurality
---> 39 +2 MINCP stocks Bearish MINCP Stocks
(5/7/2013)
---> 171 +66 New Highs on
NASDAQ 6 new lows. Bullish
plurality
---> 349 New Highs on NYSE 5
new lows. Bullish plurality
-
Like Keynes, Bernanke Sees Deflation
As A Greater Danger Than Inflation
I'm not sure what else the
Fed can do to boost the economy, other than require banks
to make loans again.
Money supply must be multiplied by "velocity of money movement"
to gauge its effects on the
economy. But at least, the moderate 1.5% inflation rate gives
hope to those who own
stocks that the Fed will not soon raise interest rates or back away from its
purchasing of debt
instruments and long-term mortgages.
It took 40 Year, but
My Ph.D. Dissertation Finally Has Found A Wider Audience
This should not be
surprising. The UK's "Locust Years" between 1919 and 1937
bear more and more
resemblance to the sputtering American economy now. The failure of
policy makers then parallels
in many ways the failures of ours now, I would argue.
Keynes would approve of
Bernanke's polcies I think, but almost no one else's.
A Canadian economist
made inquiry about my 1972 dissertation "The Role of
The Chancellor of the
Exchequer in British Cabinet Politics." Sunday, he said he would
put its conclusions on
his own website. As a result, I have touched up the synopsis I
I wrote earlier on my
own Blog. See August 3, 2011 TigerSoft
Blog - Keynes Revisited

One of the
interesting things I have just "re-learned" in this effort was how truly
prescient Keynes had
been, not only in 1919 about the disastrous consequences
of the Allies trying to
extract huge war reparations from Weimar Germany, but also
in 1924, when he
predicted a depression if England deliberately courted deflation
by raising interest
rates and by going back on the Gold Standard in the middle of an
already severe and
long-lasting recession. In 1925, Churchill as Chancellor, did
put England back on the
Gold Standard. Exports fell even faster. Unemployment rose
to new highs.
Wages fell. A general strike ensured. But speculators and the financial
"City" were
happy for a while, though Keynes predicted a market collapse and a full-
scale Depression in a
few years.
DJI-1929-1930
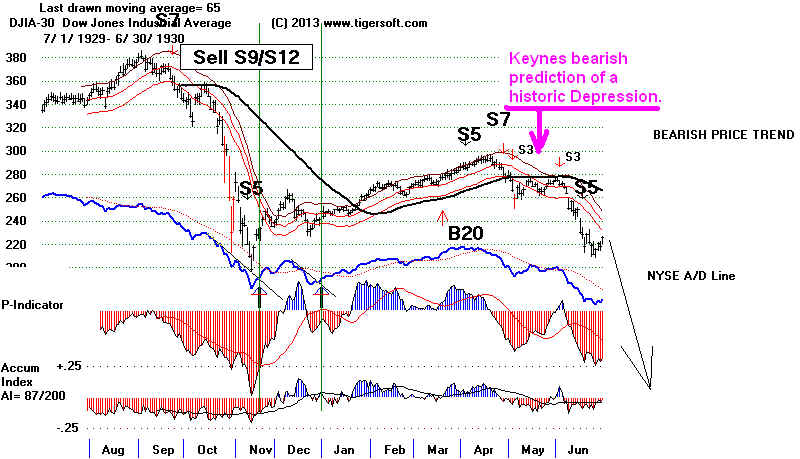
.
Keynes made
another extraordinary prediction in May 1930, when the stock market
still seemed to
be recovering from the 1929 Crash. Keynes wrote:
"The fact is - a fact not yet recognized by the
great public -
that we are now in the depths of a very severe international slump,
a slump which will take its place in history amongst the most acute
ever experienced. It will require not merely passive
movements of
bank rates to lift us out of a depression of this order, but a very active
and determined policy."
He was referring, of course, to his
favorite mechanism for improving the economy
when investors would
not invest and consumers could no longer consume, a massive
public works
program. Keynes had been advocating this since early 1924.
In February 1929,
it was he who penned the Liberal Party's 1929 Election Platform,
"We Can Cure
Unemployment".

. Liberals had a long tradition of
seeking government public works programs, starting
with Asquith in 1909.
The growth of the Labour Party, however, cut into their support
and they never again were
able to form their own government. Interestingly, Labour
when it was in office between
1929 and 1931, refused to adopt Keynesian Public
Works' ideas. Their
leaders (the PM and the Chancellor) wanted to prove that they
could be trusted with
political power. So MacDonald and Snowden bought "hook, line
and sinker" the
prevailing financial orthodoxy that government spending, just like
a household's budget, had to
be balanced each year, the the British Pound must be
protected at all costs, that
private banks and stock brokers should fund all major domestic
investments and that the
financial community's counsel should always be accepted
and heeded about what would
damage and what would restore business and investor
"confidence". These
same Labour leaders (MacDonald and Snowden) who had
so diligently sought the
approval and confidence of the British financial establishment
ended up being ousted from
their very own party in 1932. Their orthodox policies
failed. The Depression
worsened, their were mutinies in the Royal Navy and
Britain was ignominiously
forced to devalue the Pound and go off the Gold Standard.
It is in the first half of
the second year of a Presidential 4-Year cycle that the
stock market typically gets
weakest when a Democrat is in the White House. I
can't help but wonder if the
President will not eventually pay a big political,
because of his great desire
to win the confidence of Wall Street and his choice
not to campaign for an
FDR-like set of public works programs. He may thereby
thereby fail to bring about a
real economic recovery, and as a consequence,
will end up hurting his own
party politically for years, just as Snowden and
MacDonald hurt their party
for more than 14 years until a very different set of
Labour leaders were voted
into office in 1946.
====================================================================================
OLDER HOTLINES
====================================================================================
5/6/2013 Thursday's
Peerless Buy B18 was the second
Buy B18 in 4 months,
The track record of these second
B18s is quite bullish. The biggest paper loss of the
5 cases was only 1.7%.
Based on their past results, a DJI target of 16813 can be
calculated. Of course, this
assumes that the internals we look at daily for Peerless
do not deteriorate and there is no
weak rally to the upper band.
Peerless Key Values
LA/MA
AnnRoc
P-I P-I ch
P^^
IP21
V-I
Opct 65PctChange
5/3/2013 1.016
.327
+503 +36
+503
.092
+33 +10
.292 .074
The DJI Chart shows now shows the Peerless signals
using the mid March update.
The NASDAQ, SP-500, OEX, NYSE
and Value Line Charts show the mistaken S11
and S15 of late February and early
March. One key mistake was made.
Volume was incorrectly allowed to
over-rule excellent breadth and a high IP21 before May.
Now May has arrived and we could
get a Sell S9v or Sell S15. As I showed a few
hotlines ago, there a plenty of May
reversals downward. These often occur when the
the V-Indicator is negative at the
upper band. Fortunately for the Bulls now, the
V-Indicator has become more
positive today and at its current levels, the DJI could
advance 1% and there would be no
Sell signal..
The only problem now is that the
DJI's daily change was a mere -.03% from
Friday's close. Another day
where the DJI is so little changed would probably be
a new Sell S8, if we decide to heed
this unusual "No-DJI-change-for-three-days" signal.
See http://tigersoft.com/PeerInst-2012/-Sell%20S8.htm
If it should occur we will
want to compare the current key
Peerless values with the past cases' key values
when the S8 would have occurred, to
be sure that the present values are within
normal parameters for the signal.
Leaders
The number of new highs shrunk today
compared to Friday. That probably is a result
of Friday's exciting economic news.
Housing and Bank stocks were still advancing
today. Usually the market cannot
reverse until financial stocks top out or, at least,
look more vulnerable. Oil stocks are on the verge of a surge. That
will require
Crude
Oil to move past its resistance line. AAPL
and GOOG did very well today,
making the QQQ look good. Study its
candle-stick chart below. The Blue Bars that show very
big daily jumps in Closing Power indicate
that QQQ had become much more bullish
looking now that AAPL is back above its
65-dma.
Buy QQQ
The QQQ is still 50 points below its
all-time high. If speculation was like what was
seen in 1999, the QQQ could rise 70%!
It behooves us to compare the current
candle-stick QQQ chart with its chart
just after its peak in March 2000. Notice
how many big red bars there were then.
These indicate Professional Selling.
In 2000's top, the QQQ's blue Closing
Power was widely lagging its red Opening Power.
That is bullishly not so now. QQQ would
seem to be a better trade now than DIA,
for at least as long as its Closing Power
is rising.
QQQ - 2013
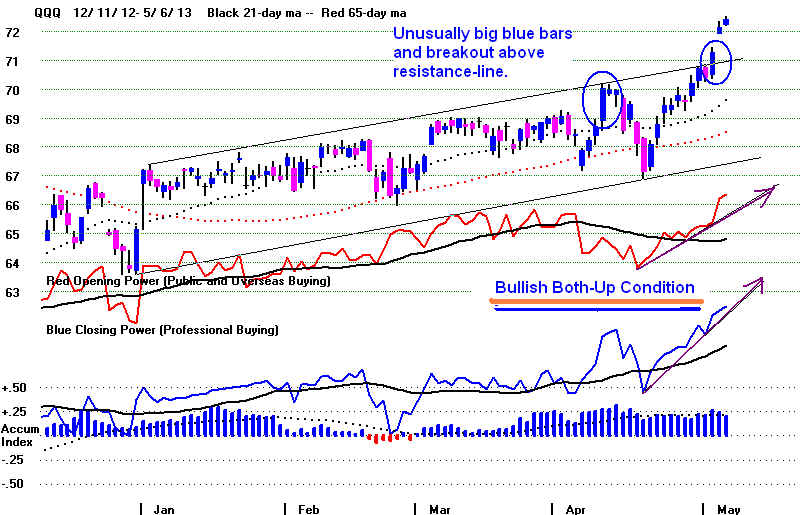
QQQ - 2000
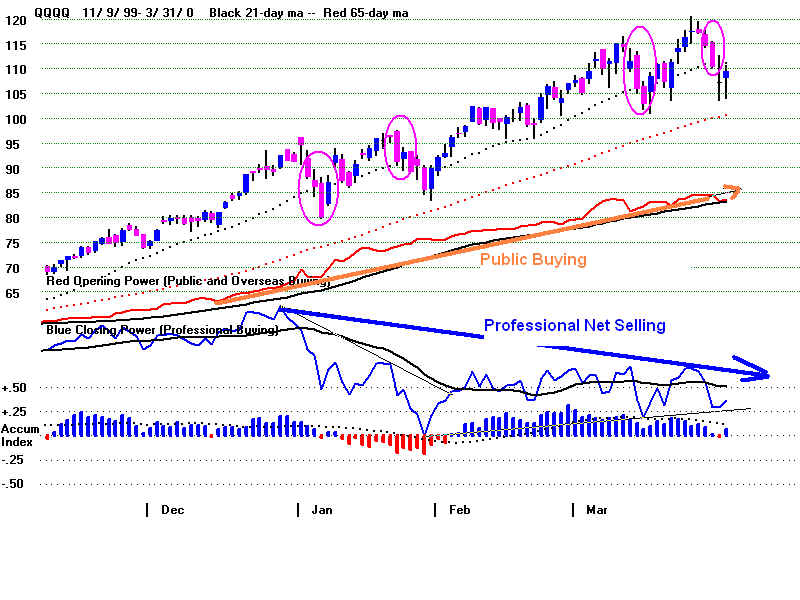
IBM has stalled out in its recovery at its
65-dma. That will hold back the DJI while SPY
and QQQ try assume the leadership role.
Meanwhile, Gold Stocks remain in
downtrends.
This should be bullish for
the general market.
5/6/2013 ---> To Key Index and Leading Stock
Charts
---> 273 +18 MAXCP stocks
Bullish MAXCP Stocks (5/6/2013) Bullish plurality
---> 37 -3 MINCP stocks Bearish MINCP Stocks
(5/6/2013)
---> 105 -53 New Highs on
NASDAQ 6 new lows. Bullish
plurality
---> 176 -13 New Highs on
NYSE 7 new lows. Bullish
plurality -
====================================================================================
OLDER HOTLINES
====================================================================================
5/3/2013 Thursday's
Peerless Buy B18 was the second
Buy B18 in 4 months,
The track record of these second
B18s is quite bullish. The biggest paper loss of the
5 cases was only 1.7%.
Based on their past results,
a DJI target of 16813 can be calculated. The current rate of
change of the 21-day ma for
the DJI is lower than any of the five earlier B18s.
That could mean the DJI will
have trouble surpassing 15000 on the current run.
But the paper losses for
these were only 1.7%. With the current IP21 +.123, I
would think that the rising
21-day ma will birng about a reversal back upwards.
The DJI Chart (below) shows the Peerless signals as of mid March.
The NASDAQ, SP-500, OEX, NYSE and Value Line Charts
at this link
5/3/2013 ---> To
Key Index and Leading Stock Charts
show the mistaken S11 and S15 of late February and early March.
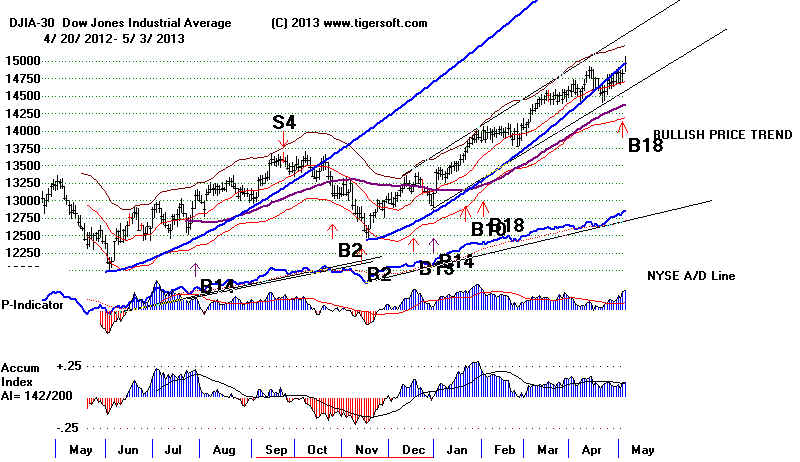
2nd in Series of Sell S18s.
84 straight days of positive P-Indicator
(Special S9 if P-goes negative after 105 straight days.)
Peerless Key Values
LA/MA
AnnRoc P-I
P-I ch
P^^
IP21
V-I
Opct 65PctChange
5/2/2013
1.009
.228 +435
+158
+435
.127 +17
.279 .059
low high
high
(5/3/2013 1.018
.298 +466
+31
+466 .123
+23
.283 .071)
-------------------------------------------------------------------------------------------------------------------------------
Previous 2nd Bu y B18s
2/19/1943
+11.6% No Paper Loss
LA/MA
AnnRoc P-I
P-I ch
P^^
IP21
V-I
Opct 65PctChange
1.008 .579
110
-5
557
.215
106
.377
.081
2/5/1944
+5.5%
Paper Loss = 1.7%
LA/MA
AnnRoc P-I
P-I ch
P^^
IP21
V-I
Opct 65PctChange
1.009 .108
73
16
334
.140
27
.264
.057
1/10/1951
+14.4% No Paper Loss
LA/MA
AnnRoc P-I
P-I ch
P^^
IP21
V-I
Opct 65PctChange
1.027 .699
131
-45
399
.075
198
.255 .037
10/3/1958
+21.8% No Paper Loss
LA/MA
AnnRoc P-I
P-I ch
P^^
IP21
V-I
Opct 65PctChange
1.017 .462
79
21
251
.064
15
.150 .100
5/25/1995
+23.7%
Paper Loss = 1%
LA/MA
AnnRoc P-I
P-I ch
P^^
IP21
V-I
Opct 65PctChange
1.007 .306
133
-10
184
.127
10
.299 .098
1/2/2004
+3.1%
No Paper Loss
LA/MA
AnnRoc P-I
P-I ch
P^^
IP21
V-I
Opct 65PctChange
1.024 .653
425
13
398
.107
44
.343 .108
================================================
+13.5% Avg Gain
Target based on Second B18s
... 16833.
There are other reasons for being
optimistic about the market. Getting past the
14000-14200 resistance a month ago
took about 6 years, from 2007 to 2013. When
the DJI got past 18000 in October
2006, which had held for 6 years, from 2000-2006,
there were also 2 B18s.
It ultimately rose for 9 more months and 2000 more points.
If these gains were to be repeated
now the DJI would reach 16000 by the end of the
year.
There were two B18s with a Sell S15
in between the two B18s in early 2006, The
second B19 gained only 3.3% at the
time of the next sell, a Sell S9 on 5/5/2006.
This case shows that a Sell signal
can more quickly than usual occur if breadth
dramatically deteriorates on
a rally to the 2.5% upper band. Our P-Indicator
readings are better now.
(This paragraph was added mid morning on 5/6)
4/4/2006
+3.3%
No Paper Loss
LA/MA
AnnRoc P-I
P-I ch
P^^
IP21
V-I
Opct 65PctChange
1.003 .262
204
88
188
-.02 4
.172 .037
Unemployment's Drop
Unemployment's drop
officially to 7.5% from a high of 10.0% is welcome news.
It is also a bullish
stimulant. In the past Recessions of the 1973-1977 and 1981-1984,
when the official
unemployment level fell to 7.5% or below, the DJI either went sidewise (1976)
or rose very strongly.
More good economic news would make investors believe the
turn-around is real.
As long as the NYSE A/D Line
uptrend continues and the key ETF's
Closing Powers are rising,
the general market should stay strong. SPY
and QQQ look a little better
than DIA, IWM or MDY. The Closing Powers
for SPY and QQQ have
bullishly made 6 month highs and the IP21 is above +.25.
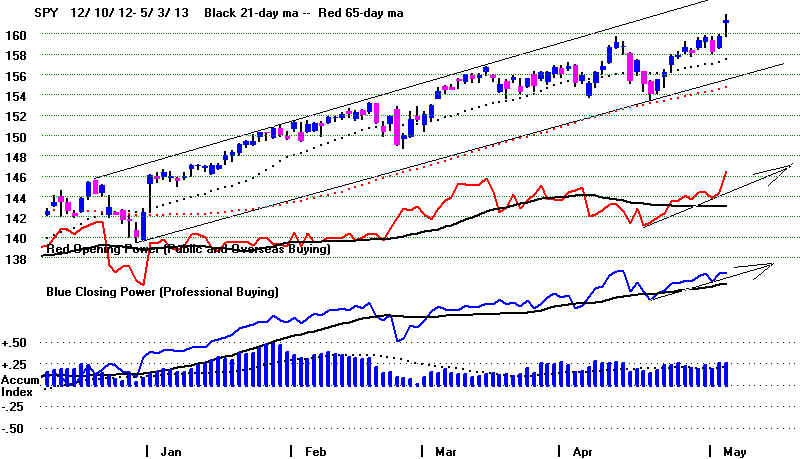
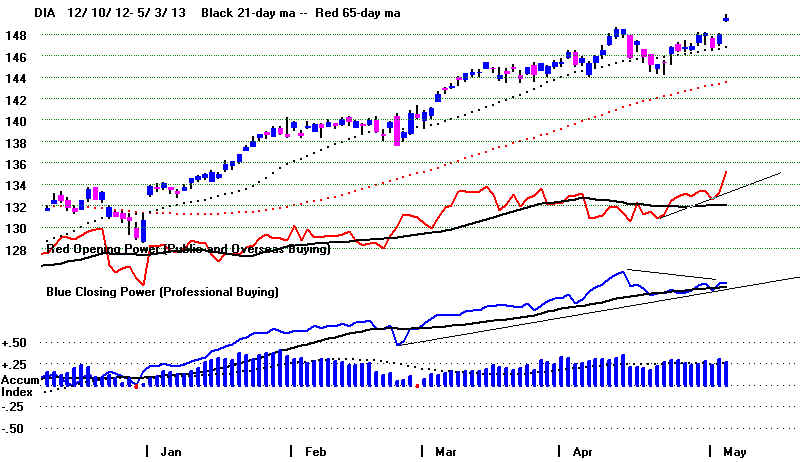
BUY AAPL
AAPL seems to have turned around.
Professionals are starting to
be net buyers; its Closing Power downtrendline has been broken. Buying
it with a sell stop underneath the 65-day ma looks like a reasonable trade.
Among computers, watch IBM. It has risen
back to falling 65-dma.
Its advance will also need to continue.
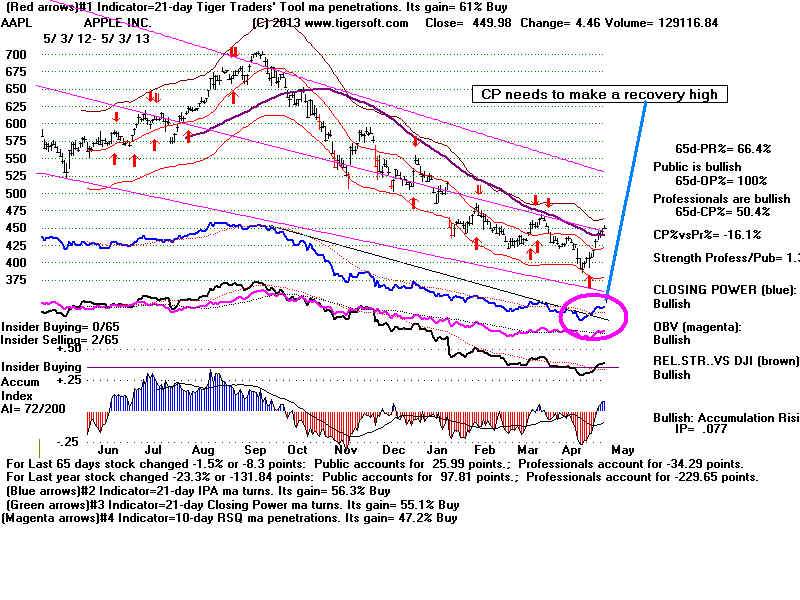

MORE POT HOLES
When both Opening
and Closing Power are rising, the stock often
rises very
quickly. But be more careful, too. The Public is now in
the stock.
When Professionals change their mind on the stock, it
is apt to become
quite vulnerable. A break in the CP uptrend,
especially after
a CP NC, must be taken seriously. Believe the
bearishness of a
head/shoulders pattern in these curcumstances.
CRAY has suddenly
fallen nearly 30%. It may have suffered from too
much (green)
public buying. Sell when the CP breaks its uptrend.
See the bearish
head/shoulders pattern it formed, too. CACC
showed a CP
head/shoulders pattern at its top.
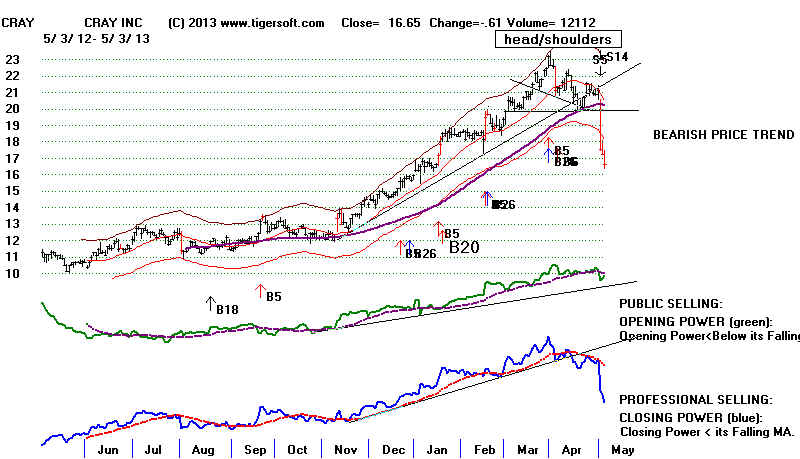
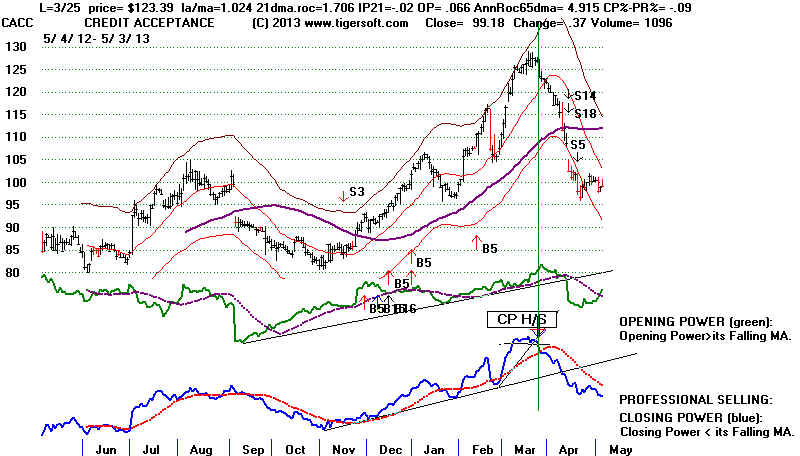
Multiple Sell S7s Divergence Signals should tell you to avoid the stock. They
can become very weak, very quickly when the stock breaks the 65-dma. See ACTG
and ANCX below as examples.
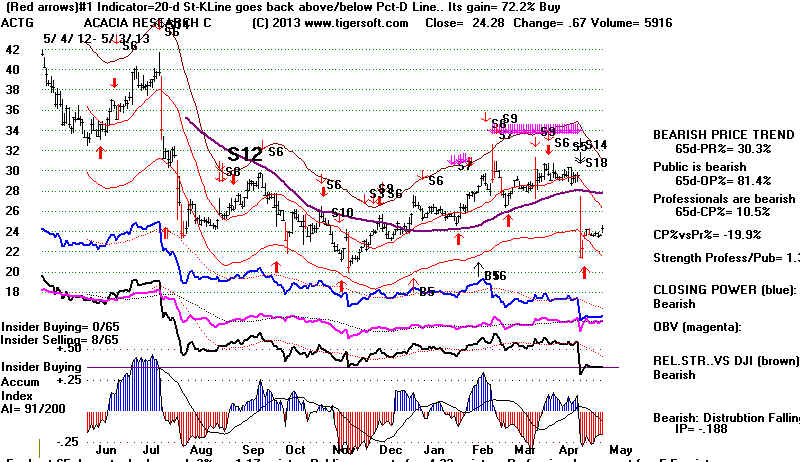
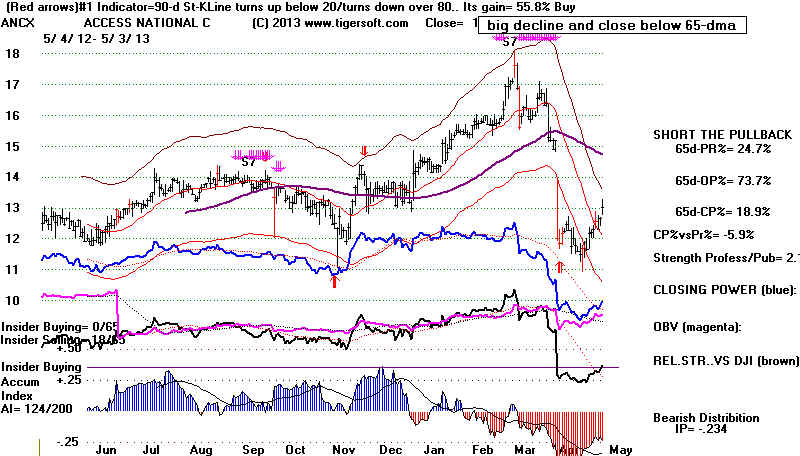
---> 255 +58 MAXCP
stocks Bullish
MAXCP Stocks (5/3/2013) Bullish plurality
---> 40 -16 MINCP stocks Bearish MINCP Stocks (5/3/2013)
---> 159 +12 New Highs on NASDAQ 15
new lows. Bullish plurality
---> 289 New Highs on NYSE 7
new lows. Bullish plurality
-
====================================================================================
OLDER HOTLINES
====================================================================================
5/2/2013
New Peerless Buy B18. As
the second Buy B18 in 4 months,
this has a
surprisingly bullish track record.
The A/D Line and
Closing Powers are still rising. SPY and
DIA are working
on the
overhead resistance from their recent highs. The broader based IWM
and Value Line need to rise more to get back to their
highs. It is not clear to me
that the DJI will be able soon to crack through it round
number resistance
at 15000
even if it makes a new high here.
The Buy B18
is based on the P-Indicator being positive for 41 straight days or 82
straight
days if there has already been a Buy B18 on the advance. The notes I have
published on B18s suggest B18s
are more bullish when a Democrat is in the
White
House, but all 3 of the listed B18sthat produced a loss had a Democratic
President.
More
important, I think, is the track record of second Buy B18s in a four month period:
5 of the 11
brought DJI gains of more than 10%, 5 brought gains of between +3.1% and
+6.5%.
Only 2 brought insignificant gains. And most important, the 4 paper losses
were
under 2%.
This condition is surprisingly bullish. And it has not been noted
before tonight.
You can see
that in 4 instances there was a third B18 in the same advance.
-------> There were five true Second B18s.
The gains
with these were impressive: +11.6%, +5.5%, +14.4%, +21.8%, +23.7% and +3.1%.
Second B18 Signals in 4 Months.
------->
2/19/1943 +11.6% No Paper Loss (This was the second B18 in its
series.)
(4/20/1943 +6.5% No Paper Loss (This was
the third B18 in the series.) )
------->
2/5/1944 +5.5% Paper Loss = 1.7% (This was the second B18 in its series.)
(4/25/1945 +0.1% Paper Loss <1%
(This was the third B18 in the series.) )
------->
1/10/1951 +14.4% No Paper Loss
------->10/3/1958
+21.8% No Paper Loss (This was the second B18 in its
series.)
12/3/1958 +16.4% No Paper Loss (This was the third B18
in the series.)
-------> 5/25/1995
+23.7% Paper Loss = 1%
-------> 1/2/2004
+3.1% No Paper Loss (This was
the second B18 in its series.)
4/4/2006 +3.3% Paper Loss = 1.2% (This was the third B18 in the series.)
12/4/2006 +0.9% No Paper Loss
There
have been only two previous May Buy B18s.
5/12/1978
840.7
+3.1% No Paper Loss
LA/MA
ROC
P-I
P-ch
P^^
IP21
V-I
OPct 65-d-pct
change
1.02 .949
182 -6
+377 - .001
7 .324
+.069
DJI rallied to upper band sell.
5/25/1995
4412.23
+23.7% Paper Loss
= 1.0%
LA/MA
ROC
P-I
P-ch
P^^
IP21
V-I
OPct 65-d-pct
change
1.007 .306
133 -10 +84
.127 10
.299 +.098
Fell to 4369.00 at rising 21-dma and then rallied.
New Bullish Signs
It is certainly bullish that the V-Indicator has turned positive.
This means a 2%
DJI advance
will not easily bring a Sell S9V or Sell S12. The new high by the
Semi-Conductor Index (SOX) and QQQ are important signs of new life and
energy in
the market now.
5/2/2013 ---> To Key Index and Leading Stock
Charts
Peerless Key Values
LA/MA
AnnRoc P-I
P-I ch
P^^ IP21
V-I
Opct 65PctChange
5/2/2013 1.009 .228
+435 +158 +435
.127
+17
.279 .059
big jump up positive!
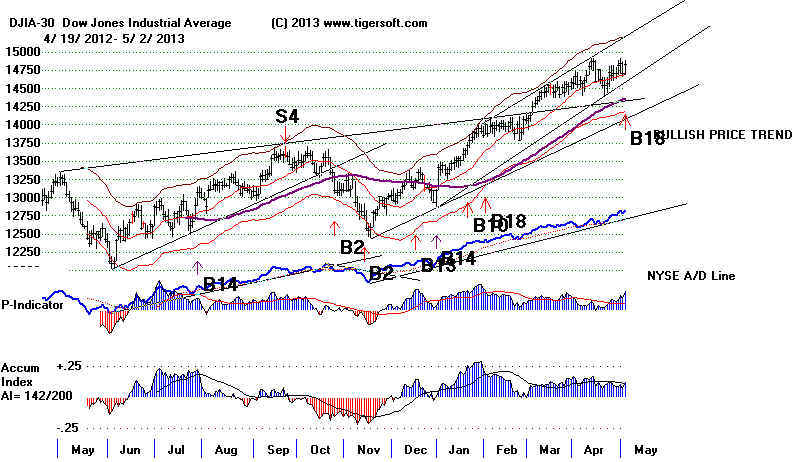
QQQ, AAPL and Semi-Conductors Look Like Buys.
But
look at QQQ. With AAPL back above its
65-day ma, it is moving higher more easily.
The
QQQ is also being boosted by other big gainers of thei last month: VRTX (+47%,
AKAM
+22%, NFLX +16% and MSFT + 15%. The
highest AI/200 stocks in
the
NASDAQ-100 are SIAL and ADBE. AAPL does
look cheap and traders who
place
a stop just a little below the 65-dma risk very little buying it now. Professionals
have
switch from selling to buying. To be surer, I would want the blue Closing Power
to
make a new recovery high.
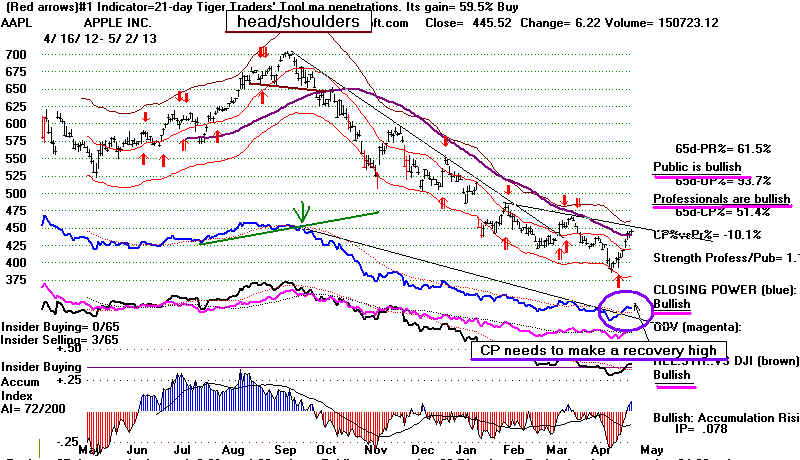
Bullish Semi-Conductors
And maybe
the economy is improving. It has to be bullish that a number of semi-conductor
stocks,
TXN, AMAT,
WDC, SGAT and INTC are all up more than 12% in the last month.
The
semi-conductor group is very sensitive to changes in the business technology outlook.
TXN's
AI/200 score is a solid 170. TXN just broke out above 36.5. I take
it as
more
bullish that TXN's Public Buying is limited. In fact, the Public is bearish on TXN.
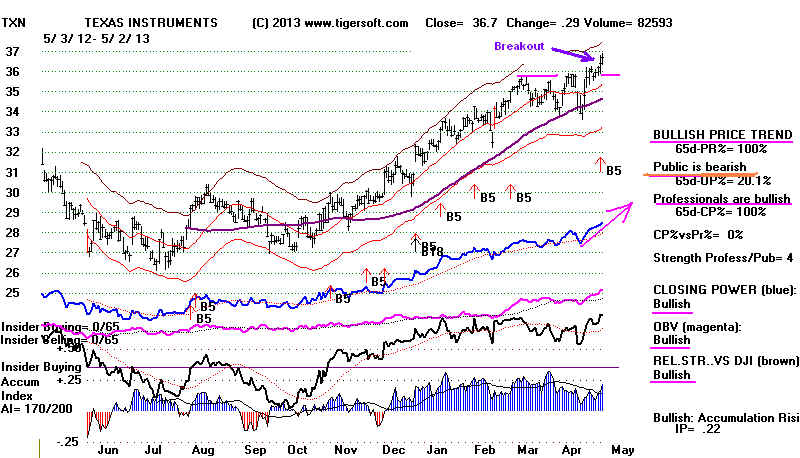
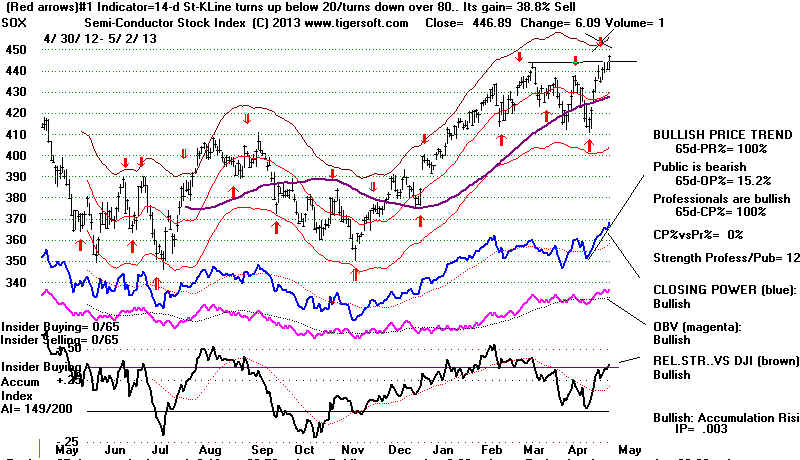
---> 197 +55 MAXCP
stocks Bullish
MAXCP Stocks (5/2/2013) Bullish plurality
---> 56 -23 MINCP stocks Bearish MINCP Stocks (5/2/2013)
---> 71 +25 New Highs on NASDAQ 15
new lows. Bullish plurality
---> 158 New Highs on NYSE 4
new lows. Bullish plurality
-
=====================================================================================
OLDER HOTLINES
=====================================================================================
5/1/2013
No New Peerless Sell. The A/D Line and
Closing Powers
are still
rising. The DJI, SPY and IWM reversed from flat resistance
after red (yearly
optimized as the best) Stochastic Sell signals. Flat resistance
is usually
overcome. But first, the now reliable red short term sell signals
call for a
re-testing of their recent support levels. With the Accumulation Indexes
all quite
positive, any decline should be limited. In fact, first the DJI, SPY and
IWM will need to
crack the support of their still rising 21-day ma. Since the
rate of change of
these 21-day ma is no longer steeply up, there is a good chance
it will be
broken.
5/1/2013 ---> To Key Index and Leading Stock
Charts
Peerless Key Values
LA/MA
AnnRoc P-I
P-I ch
P^^ IP21
V-I
Opct 65PctChange
5/1/2013 1.001 .032
+276
-60 +276
.072 -24
.171 .055
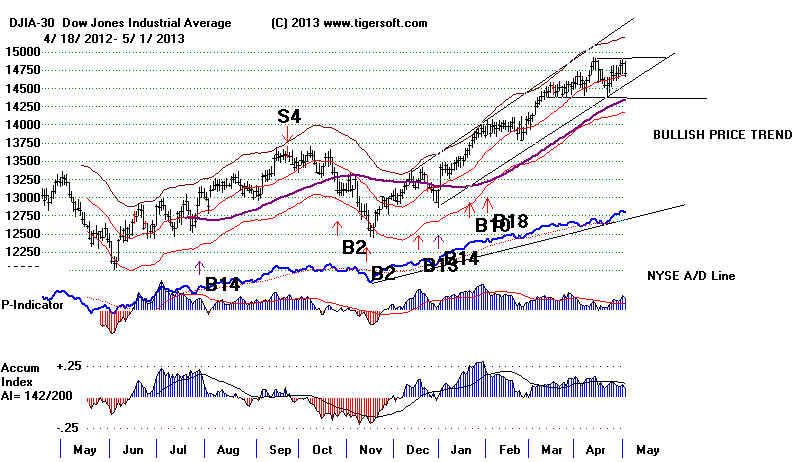
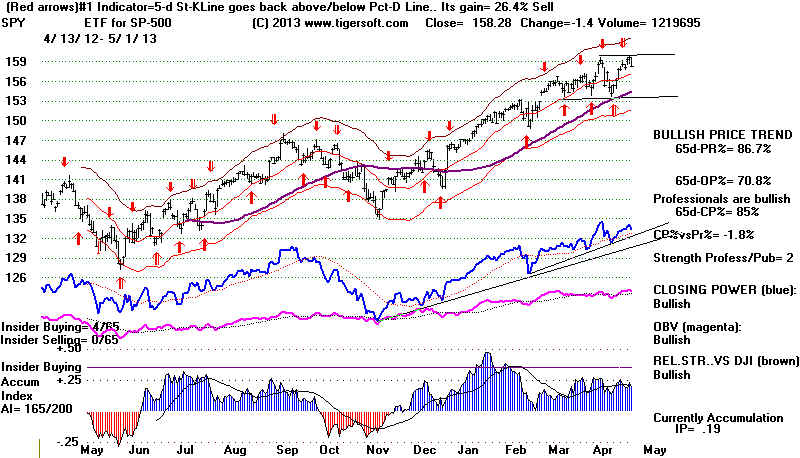
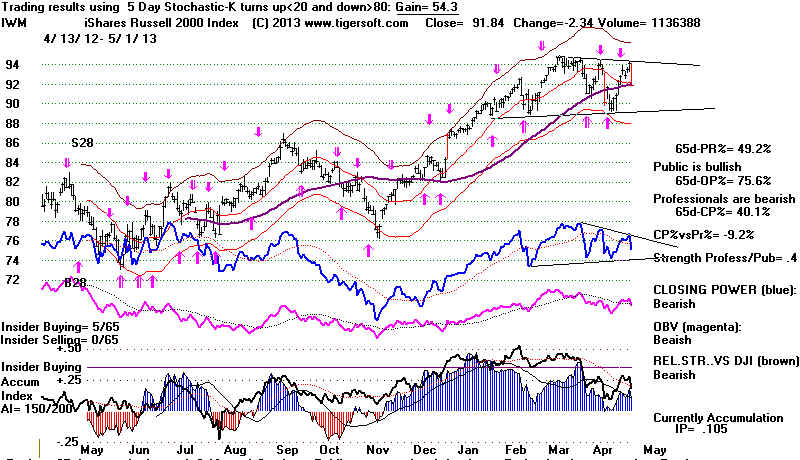
Why Has May 1st Become A Day For A Market Top?
The sell-off
today shows just how much of a problem there is for the DJI trying
to get past the
stiff resistance at the round number 15000. That remains a problem.
The upside for
the DJI would seem to be strictly limited and if the DJI cannot go up,
why take a chance
and hold big positions? This thought was not lost on the
"May, Go
Away" folks. And in their defense, I wrote 48 hours ago:
"Early Mays, until the 10th, have brought DJI peaks in 5 of the
last seven years: 2006, 2008, 2010, 2011 and 2012. The only significant
differences between now and then from the point of view of Peerless
are that's it's not yet May and the DJI closed today only 1.0% above
the 21-day ma. Usually, it takes a rally and close at or above the 2.5%
band above the 21-day ma to bring a Sell S9V or Sell S15 if the IP21
is positive, as now. "
I've gone over the data since 1915 several times regarding "the May
Problem".
The first conclusion I draw from it is that May 1st only recently has started to
"hit"
as the date of a significant top. See tables 1 and 2 of this date just below
our hotlines' usual daily links. Just like in roulette, a number can get hot.
I've seen 5 straight "0" and "00"s in Las Vegas. In roulette,
the wheel may
be out of balance or the skilled croupier may be aiming the ball successfully.
In our case, I know of nothing that would explain the recent 5 out of 7
May 1st tops. But something is causing it. My guess is
that the recent
past does affect the players' perceptions and their trading,
where in roulette
each spin is a completely new trial and past outcomes should not matter.
If you study Table 3 below, you see that there have been 28 significant DJI
tops between April 17th and May 22nd in the last 98 years. A quarter of these
tops have occurred in only the last 12 years. Something is different about the
market now. If you have any ideas how to explain this, please share them.
Otherwise, the key ideas that I derive are that:
1) the P-Indicator is too high and the Close vs the 21-day ma (LA/MA)
is too low to make this a reliable May top. A close nearer 15000 will
probably be needed to bring a Peerless Sell. In Table 3, you will
see that there are many tops a little later in May.
2) Since Mays have brought many intermediate declines, we must remain vigilant,
and a little selling on strength, "wouldn't hurt, just in case."
 High Diving Board Patterns
And, there is another matter, which is bearish. Recall a few nights ago,
I mentioned that the new Peerless Sell S8 I am proposing would be issued
when the DJI closes 3 days in a row with only a very, very small percentage change.
Well, look at the how the close to each other the closings were from 4/23/1913
to 4/26/1913. The differences in these DJI closings were only a small amount
outside the range I mentioned as needed to produce a Sell S8.
DJI Daily
Change
4/23/2013 14719.46
4/24/2013 14676.30 -43.16 - 0.2932%
4/25/2013 14700.80 +24.5 +0.1669%
4/26/2013 14712.55 +11.75 +0.0799%
Such small percent changes after a 6 month advance show churning and
distribution.
There could still be a breakout, but the flat trading shows heavy profit-taking.
This action also suggests market manipulation to accommodate the selling,
much like underwriters will maintain prices when a stock has a secondary
distribution. The 15,000 resistance on the DJI helps account for some
of
the profit-taking. But I think it comes back to the basic issue of what news
is out there that will stimulate a bigger move for the stocks of the very
biggest corporations.
The world's stock markets are suffering from years of Austerity, as I see
it and the US is bound by that economic dogma, too.
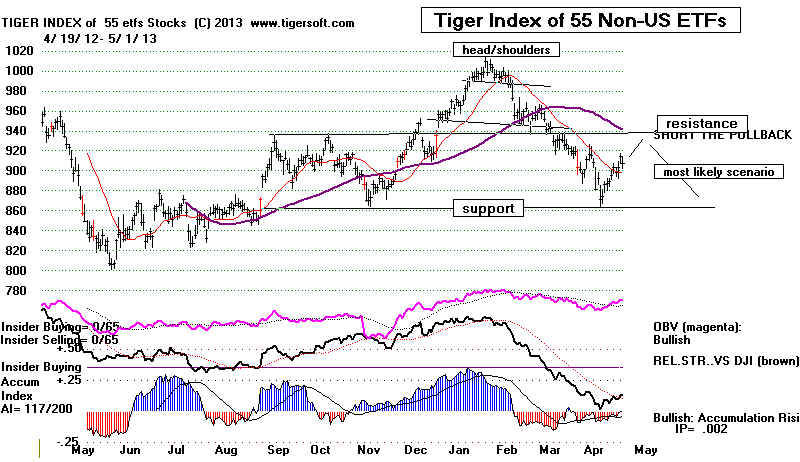
While the Democrats may be more inclined to approach government
fiscal matters in an expansionist way and that would help the stock market rises,
in 1949, 1961, 1965, 1993, 1997 and 2009 after May, realistically there appears no
chance that the Dems will get their way this year or the next. The Republicans
are dead-set against public works programs to lower the Unemployment rate
and they fervently oppose a higher rate of taxation on those whose marginal
consumption rates versus their income are the lowest, i.e. the wealthiest.
Conclusion
My conclusion is that a shallow retreat to recent support is likely for the
indexes. That would then set up another flat topped breakout. Meanwhile,
stock selection is vital; trading rather than investing will probably be more lucrative;
and watch out for stock potholes as I discussed last night. Specifically,
note the number of head/shoulders patterns in appearing in biotechs.
---> 144 MAXCP
stocks Bullish
MAXCP Stocks (5/1/2013) Bullish plurality
---> 79 +48 MINCP stocks Bearish MINCP Stocks (5/1/2013)
---> 46 -64 New Highs on NASDAQ 26
new lows. Bullish plurality
---> 80 -157 New Highs on
NYSE 7 new lows. Bullish
plurality -
Table 1 Selling the DJI on May 1st: 1980-2012
In 17 cases of 33 the first big
(>3% move) was down.
In 16 cases of 33 the
first big move was up.
2012 DJI declined 9%.
Peerless S4
2011 DJI declined 7%. Also S9V
2010 DJI declined 13.5%. Also head/shoulders and new S11
2009 DJI rallied 3% and then fell
slightly below lower band.
2008 DJI fell FAR below lower band. Also S9, S15
2007 DJI rallied from 13136.14 to 13950.98
2006 DJI rallied 2% and then fell
8%.
2005 DJI rallied from 10252 to 10609 and fell to LB.
2004 DJI fell from 10314 to 10012 on 5/14.
2003 DJI kept rallying for months without falling to LB.
2002 DJI rallied 2% and then started a bear market.
2001 DJI rose from 10898 to 11302 and then began bear market.
2000 DJI fell from 10812 to 10299 on 5/26.
1999 DJI rallied from 11015 to 11107 on 5/13 and then declined to
LB.
1998 DJI declined from 9147 to 8628.
1997 DJI rallied from 6976 to 8223 on 7/31
1996 DJI fell to LB from ma and then rallied.
1995 DJI rallied a long ways.
1994 DJI fell from 3701 to 3629 on 5/9 and then rallied.
1993 DJI rallied for 8 months before falling to LB.
1992 DJI rallied from 3336 to 3413 on 6/1 and then fell to LB. .
1991 DJI fell to LB and then rallied to
UB.
1990 DJI rallied from 1.4% LB and 2668.92 to 2999.75
1989 DJI fell to 21-dma and then rallied for 4 1/2 months.
1988 DJI fell from ma to LB.
1987 DJI rallied from just below ma to upper band and then fell LB
1986 DJI went sidewise 3 week s and then rallied above upper band.
1985 DJI went sidewise 2 weeks and then rallied above upper band.
1984 DJI rose 1% and then fell 9%.
1983 DJI rose 1% and then fell 4%.
1982 DJI rose 2% and then fell below LB
1981 DJI fell to LB.
1980 DJI rose for 5 more months before falling to LB.
|
Table 2 Selling the DJI on May 1st
in The Post Presidential Election Year: 1917-2013
In 9 cases
of 23 the first big move (>3%) was down.
In 14 cases
of 23 the first big move (>3%) was up.
2009 DJI rallied 3% and then fell slightly below lower band.
2005 DJI rallied from 10252 to 10609 and fell to LB.
2001 DJI rose from 10898 to 11302 and then began bear market.
1997 DJI rallied from 6976 to
8223 on 7/31
1993 DJI rallied for 8 months before falling to LB.
1989 DJI fell to 21-dma and then rallied for 4 1/2 months
1985 DJI went sidewise 2 weeks and then rallied above upper band
1981 DJI fell to LB and then
rose to UB.
1977 DJI rallied 2% and then fell to LB.
1973 DJI rose from LB to 1% UB and then began
bear market.
1969 DJI rallied from 949 to 969 and then began bear market.
1965 DJI rallied from 922 to 940 on 5/13 and then began bear market.
1961 DJI rallied from ma to upper band and then fell to LB.
1957 DJI rallied from 496 to 520 2 months later and then began bear mkt.
1953 DJI rallied 2% from 275.7 and then fell to 263.4 on 6/10.
1949 DJI fell from 174.6 to 161.6 on 6/13
1945 DJI rallied 2% on 5/28 and then fell to LB
1941 DJI went sidewise for a month and then rallied for 2 months.
1937 DJI rose 1% from 174.6 and then fell to 167.5.
1933 DJI rose very strongly for 10 more weeks.
1929 DJI rose from 320.1 to 326.2 on 5/6 and then fell t0 298.9 on
5/28
1925 DJI rose powerfully for 6 months.
1921 DJI collapsed from 79.70 to 64.90
1917 DJI fell to LB and then rallied
above upper band. |
Table 3
Significant Tops from April 17th to May 22nd: 1915-2013
DJI Declined at least 5% and to Lower Band.
LA/MA
AnnRoc P-I
P-I ch
P^^
IP21
V-I
Opct
65PctChange
4/29/2013 1.010 .195
234 32 234 .088 -25 .169
.067
very low 6th lowest 4th highest
7th
highest
4/30/1915 1.075 1.976
.478
5/15/1918 1.058 1.024
.298
5/5/1921 1.034 .524
.276
5/6/1929 1.045 .888 -14 -7 -59
-.066 -271 .274 .041
4/17/1930 1.024 .674 -2 -7
-6 .084 -322 .533 .145
4/20/1934 1.035 .846 104 39 575
.097 105 .476 .030
5/9/1938 1.041 1.462 20 22 107
.175 28 .379 .007
5/9/1940 1.000 -.112
-51 20 -255 -.164 -135 .093 .021
5/4/1951 1.027 .583 43 -34 131
.183 -5 .401 .053
5/4/1956 1.011 -.005
-33 23 -103 -.093 -235 .024 .083
5/14/1965 1.018 .399 24 3
68 .108 3 .049 .04
5/8/1966 1.034 .764 111 18 278
.146 11 .519 .062
5/14/1969 1.028 .467 61 21 138
.097 0 .338 .023
4/28/1971 1.024 .608 82 2
175 .095 1 .402 .089
4/18/1978 1.019 .327 -20 4 -43
.054 -1 .147 .064
5/9/1974 1.021 .266 -138 4 -245
-.061 -2 .120 .053
5/7/1982 1.023 .454 122 10 236
.092 4 .254 .028
5/2/1984 1.027 .345 3 39
5 .032 0 .202 -.03
5/5/1987 1.018 -.271 -177
-1 -348 -.082 -14 -.154 .078
5/22/1996 1.036 .405 125 -1 160
.078 25 .261 .055
5/13/1999 1.028 .769 320 7 319
.070 35 .320 .179
5/21/2001 1.041 .832 410
81 400 .151 78 .083 .039
5/17/2002 1.028 .175
51 15 51 -.014 -149 .078
.035
5/9/2006 1.027 .547 110 94 101
.079 -6 .329 .073
5/2/2008 1.028 .406 173 -6 156
.036 -29 .079 .047
4/23/2010 1.018 .399 404 107 392
.134 14 .542 .053
5/2/2011 1.028 .467 212 -50 211
.147 -17 .332 .063
5/1/2012 1.018 .061 78
18 78 -.003 -87 .036 .046
|
--------------------------------------------------------------------------------------------------------------------------------------------------------
OLDER HOTLINES
-------------------------------------------------------------------------------------------------------------------------------------------------------
4/30/2013
No Peerless Sell. The NYSE A/D
Line is still rising.
MAXCPs and New Highs bullishly
outnumber MINCPs and new
lows.
Again advancers
outnumbered decliners on NYSE by 2:1, but NYSE \down
volume increased by
150% on NYSE. 15000 still looks like a stiff barrier
for the DJI. The hope is that the broader market as
measured by the ETFs,
MDY and IWM
will make solid breakouts and start to runs and that the
Value Line will also breakout, thereby voiding its
risky megaphone or
broadening top pattern.
The steady wall of blue Accumulation for all the ETFs
is impressive.
As for the
regularity with which the DJI has peaked in May, that is certainly
a problem.
But with the DJI only 1.1% over the 21-day ma, a May Sell S9V or
Sell S15 may be
avoided, wither by the DJI not reaching the 2.5% upper band
or the
V-Indicator turning positive.
What happened in
the past when the DJI surpassed its right shoulder apex
in a potential
head/shoulders pattern, just as the DJI has now
done by rising and
staying above
14775? In the past buying when the Accumulation Index was positive
on these
occasions always proved to be good time to buy. The DJI's Accumulation
Index is clearly
positive now. Similarly, it has always been bearish when the
Accumulation was
negative.
See the 10 cases in the DJI since 1929.
We also
want to study some of the more subtle signs that mark a stock
as being a
candidate for a sudden and sharp price breakdown from what
seems like
a simple and innocent trading range. See the study further below.
4/30/2013 ---> To
Key Index and Leading Stock Charts
Peerless Key Values
LA/MA
AnnRoc P-I
P-I ch
P^^ IP21
V-I
Opct 65PctChange
4/30/2013 1.011 .217
336 +101
336 .107
-5
.27 .063
---> 305 +85 MAXCP stocks Bullish MAXCP Stocks (4/30/2013) Bullish plurality
Link includes High Accumulation Breakouts and CP Crosses above CP MA.
---> 31 -9 MINCP stocks Bearish MINCP Stocks (4/30/2013)
---> 108 +15 New Highs on NASDAQ 10
new lows. Bullish plurality
---> 227 +53 New Highs on
NYSE 7 new lows. Bullish
plurality -
Stocks Showing Sudden Breakdowns:
Subtle Signs of Weakness
We have frequently mentioned here many of the most common bearish technical
features.
1) Avoid or sell short out-of-favor industries. Example: Gold and silver
stocks.
2) Stocks already in a long decline and showing steady red Distribution often fall
sharply even more as the bad news comes out. See DLIA, DRV. FST, EXXI, GROW, STSI,
3) Bearish, completed head/shoulders patterns and decline below 65-dma support.
Examples: ATI, CRR. CTSH, CSH, CTRX, EVEP, FVE, FLXS, GE, MSPD
4) Confirmed breakdowns below major support. Examples: like HXM, YZC, JNPR, RHI,
and TDC, TXT.
But
here are some stocks that have recently fallen sharply for a variety of more
subtle technical reasons.
AAWW - Head/Shoulders of 6 mo ago casts gloomy
technical spell on stock. Sell S7s. Below 65-dma.
AFFY - Falling 65-dma and Relative Strength
Quotient new low.
ACTG - CP divergence-Sell S7s and then
breaking of 65-dma nested with uptrendline.
ANCX - S7s, Big decline which simultaneously
breaks below neckline, uptrendline and 65-dma
AVEO - S7s, Red high volume quickly snuffed
out. Violation of 65-dma.
BMI - After nice 6 month advance, stock
simultaneously violated uptrendline, neckliue and 65dma.
BNCL- Weakening blue CP line. falling 21-dma,
Simulaneously broke 65-dma and uptrendline.
CACC - Over-extende. At upper band. Then CP
head/shoulders. Uptrend-and 65-dma break
DCTH - S7s. Low AI/200. CP in steady
downtrend. Short-covering rally quickly snuffed out.
DLA - CP and prices in downtrend despite rising
market.
DV - S7s. In weak educational group. IP21 did
not confirm April new high.
EW - Relative Strength New Low. Below falling
65-dma.
EZPW - Red high colume breakdown. Falling
CP. 65-dma turns down.
FVE - CP NC's and S7s. Head/Shoulders, 65-dma
broken and uptrendline violated.
FFIV - CP and RSQ uptrendlines broken.
Red high volume breaking of 65-dma.
FLR - OBV and RSQ NC of marginal new high. CP
breaks uptrend. Then price does, too.
FRO - RSQ and Price Breakdown along with
negative Accumulation Index.
IBM - OBV and RSQ fail to confirm marginal
breakout. Then CP uptrend-break.
SWY - Over-extended and sudden gap down on red
high volume. Rounding bottoms tend to do this.
VAR Falling RSQ and stock is below falling
65-dma in a rising general market.
====================================================================================
OLDER HOTLINES
====================================================================================
4/29/2013
No Peerless Sell. The NYSE A/D Line is still rising.
MAXCPs and New Highs bullishly outnumber
MINCPs and new lows.
Peerless Key Values
LA/MA
AnnRoc P-I
P-I ch
P^^ IP21
V-I
Opct 65PctChange
4/29/2013 1.01 .195
234
32 234
.088 -25
.178 .067
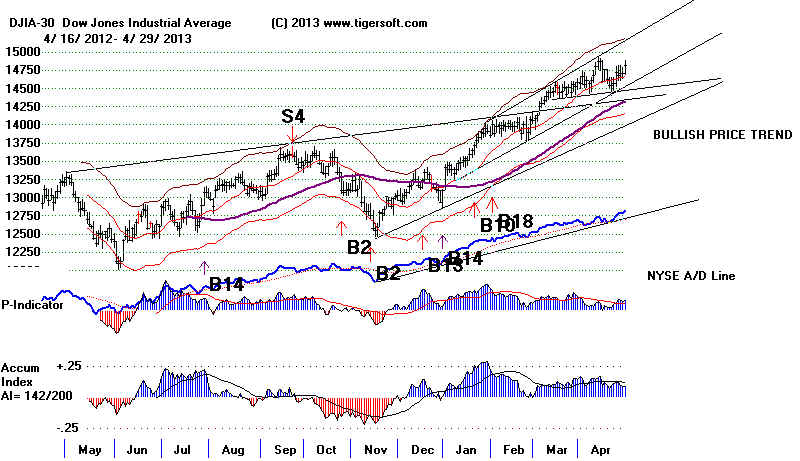
---> 220 +70 MAXCP stocks Bullish MAXCP Stocks (4/29/2013) Bullish plurality
---> 40 -8 MINCP stocks Bearish MINCP Stocks
(4/29/2013)
---> 93 New Highs on NASDAQ 7
new lows. Bullish plurality
---> 154 New Highs on NYSE 3 new lows.
Bullish plurality
Despite the good NYSE breadth, the advance is narrowing
and becoming more and more defensive. This usually
limits the upside potential until there has been a correction.
The broaders based IWM and MDY are still below the
resistance of their recent peaks. In the chart below, we
see that fewer and fewer stocks in the SP-500 are
still
above their 65-dma. That number is now 71.8% of the
group. Last Fall's top was made when that number
fell below 60% a second time.
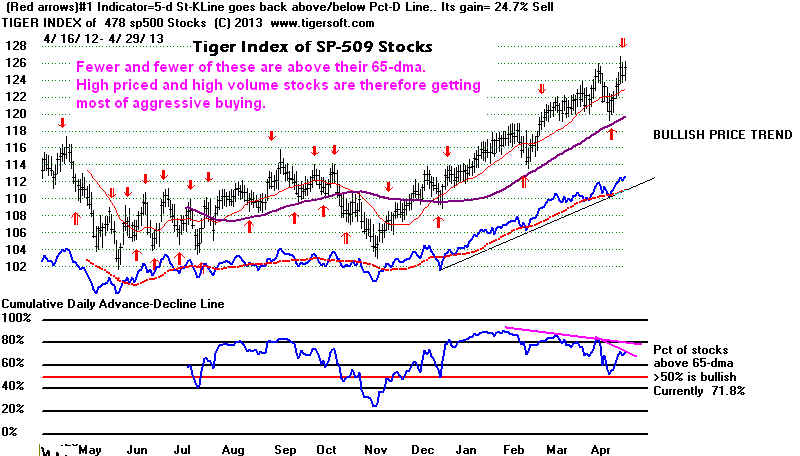
4/29/2013 ---> To
Key Index and Leading Stock Charts
Unfortunately a 1.5% additional DJI rally from here would put Peerless
in the
position of having to render a Sell S15 or Sell S9V since the V-Indicator
remains
negative and May is when these signals can occur because of that
weakness.
But a big decline is not foreseen. As I said yesterday, there is
good reason
to think the DJI may still rise another 10% in the Summer. That
would be in
keeping with its typical behavior in post Presidential Election Years
when a
Democrat who is not fiscally conservative sits in the White House.
A Month of May Decline May Become An "Iron Law"
But here's
an additional scary thought. Early Mays, until the 10th, have brought
DJI peaks
in 5 of the last seven years: 2006, 2008, 2010, 2011 and 2012.
The only
significant differences between now and then from the point of view of
Peerless
are that's it's not yet May and the DJI closed today only 1.0% above
the 21-day
ma. Usually, it takes a rally and close at or above the 2.5% band above the
21-day ma
to bring a Sell S9V or Sell S15 if the IP21 is positive, as now. As you
can see, in
all but one case the V-Indicator was negative. Except for 2009, in each
case the
DJI was up +4.6% to 7.2% for the last 65 trading days.
There is
one key difference now. The adjusted P-Indicator is slightly more positive than
any of the
six cases below at their peaks. See the
DJI charts and V-Indicators.
The
good breadth we see right now is most focused in the defensive sectors,
especially utilities, REITs and dividend paying S&P stocks. The biggest
speculative
advancers include smaller finance stocks, again the direct beneficiaries of the
FED's
QE-3. Some of the higher priced biotechs could be forming head/shoulders
patterns: AMGN, GILD and CELG.
I
suspect the DJI is headed for 15000, if only to grab some headlines and rev up its
trading. IBM's 5 point advance accounted
for 37 of the DJI's 106 point gain today and
Crude Oil got back above its 65-dma today.
IBM could easily rise another 5 points.
That
would close its downside gap of a week ago. And if the rally in energy prices
continues,
that
will boost high priced CVX and XOM in the DJI-30. This would add another 100
points
and
take the DJI up to where a Peerless Sell signal might again be produced early in May.
DJI Peaks in Late April and Early
May:
2006, 2008, 2010, 2011 and 2012
Signals LA/MA
AnnRoc P-I
P-I ch
P^^ IP21
V-I
Opct 65PctChange
4/29/2013
1.01
.195 234
32 234
.088 -25 .178
.067
-----------------------------------------------------------------------------------------------------------------------------
------>5/10/2006 S9
1.025
.527 117
6 108
.091 -10
.334 .072
------>5/2/2008 S9,S15
1.028 .406
173 -6 156
.036
-29 .077 .047
-----------------------------------------------------------------------------------------------------------------------------
6/10/2009
S9, S8 1.026 .448
233 50
217 .063
-115
.067 .25
4/26/2010
ES11 1.017
.394 421
16 408
.159 +8
.544 .072
------>5/2/2011 S9
1.028
.467 212
-50
211 .147
-17
.332 .063
------>5/1/2012 S15
1.018
.061
78 18
78 -.003
-87
.035 .046
====================================================================================
OLDER HOTLINES
====================================================================================
4/26/2013 No Peerless Sell. The
NYSE A/D Line is still rising.
---> 150 MAXCP stocks Bullish MAXCP Stocks (4/26/2013) Bullish plurality
---> 48 MINCP stocks Bearish MINCP Stocks (4/26/2013)
---> 64 New Highs on NASDAQ 7
new lows. Bullish plurality
---> 94 New Highs on NYSE 5 new lows.
Bullish plurality
4/26/2013
Accumulation is still high. There are many more MAXCPs than MINCPs.
Professionals remain
bullish in the US for the time being. Counter-cyclical
Gold Stocks still are under heavy
institutional distribution and professional
selling.
If Everyone Is Planning To Sell in May, Why Is
the market not going down now in anticipation?
Part of the
answer is that with Obama in the White House or any
fiscally
stimulative Democrat in the White House since 1945,
the tops do not
occur on May 1st and the declines have tended
with the
exception of 1965, to be shallow. The escalating US war in
Viet Nam explains
the May 1965 decline. US combat troops
were first
deployed in May,
Fiscally Stimulative Democrat in White House since 1965
1961 - DJI up all year.
5/22 peak and decline to the lower band.
9/7 peak and decline to the lower band.
1965 - DJI up all year.
5/13 peak brought 10% decline
1993 - DJI up all year.
5/27 peak and 3% decline
8/26 peak and decline to the lower band.
1997 - DJI up all year.
8/6 peak and decline to the lower band.
10/7 peak and 12% decline
2009 - DJI up for rest of year after March bottom.
6/8 peak and 7% decline
9/21 peak and 3% decline
10/20 peak and 3% decline
Conclusion:
It's clear to me why the DJI is still rising. When a
"stimulative Democrat is in the White House (not to mention
the
stimulative Federal Reserve Chairman), the DJI has gained
+10.3% on
average from May1st to October 31st. Selling now would
be
premature. The upside gain potential is greater than the risk
potential.
That does not mean there will not be decline to the
lower band
from a May peak. The biggest danger for the stock
market, as
I see it, is that Obama will become much more fiscally
conservative in 2013 than he was in 2009, much like FDR changed
abruptly in
1937 from being a deficit-spender in 1933. Of course,
a new war
would change things, too, for the worse. .
Vigilance Needed: A Decline to Lower Band Could
Be Shaping Up in May
Most serious investors
know the adage "Sell in May, Go Away." It's true
buying the week of
Thanksgiving in November and selling in May usually
brings the lion's share
of the trading gains the market offers. This is already
an important part of
Peerless. Some of the Buy signals are much easier
to get in late October
and November. Should we not make some of the
Sell signals easier to
obtain in May? In fact, many already are. The
Sell S9V for example,
is not allowed until May and it has brought 4 good
Sells in just the last
7 years.
Sell S9V is Our Main Concern Now
The DJI closed 0.4% over the 21-day ma. It would take a rally to the 2.5%
upper band to qualify
the DJI for a new Sell S12. Volume would have to
be low. The
V-Indicator now atands at -29. If it turns positive the S9V
would bot
occur.
la/ma annroc
P-I P-ICh
IP21
V-I Opct
5/2/2011 12807.36 1.028 .467
212 -50
.147 -17
.33
DJI declined below LB in six
weeks. NO PAPER LOSS
There was no other Peerless sell here. Peerless Gain =
+5.9%
5/18/2009
8504.08 1.033 .54
335 63
-.005 -11 .045
Peerless gave a better Sell S9 on 6/4/2009 at 8750.24
Initially declined to 21-dma and then to
lower band in 5 weeks PAPER LOSS =
3%
5/1/2008 13040.80 1.029
.405 178 36
.047 -28 .076
Extreme bear market followed. This was also a Sell
S15.
DJI declined below LB in 5 weeks,but fell much further.NO
PAPER LOSS
5/9/2006 11639.77 1.027
.547 110 94
.079 -6
.326
DJI declined below Lower band in 5 weeks. Also a Sell
S9.
NO PAPER LOSS
4/26/2013 ---> To Key Index and Leading Stock
Charts
Key Values: DJI
14713 +11 la/ma= 1.004 21dma-roc
= .151 P=+ 202 Pch=
-33
IP21 = +.089 (on 1/30/2013 IP21 was .293) V = -29 Opct = .193 65 day-pct-up = .063
With the V-Indicator now a negative -33 amd the DJI change on Friday less than .01%
Thursday's close, we
are getting closer to a Sell S9V or a Sell S8.
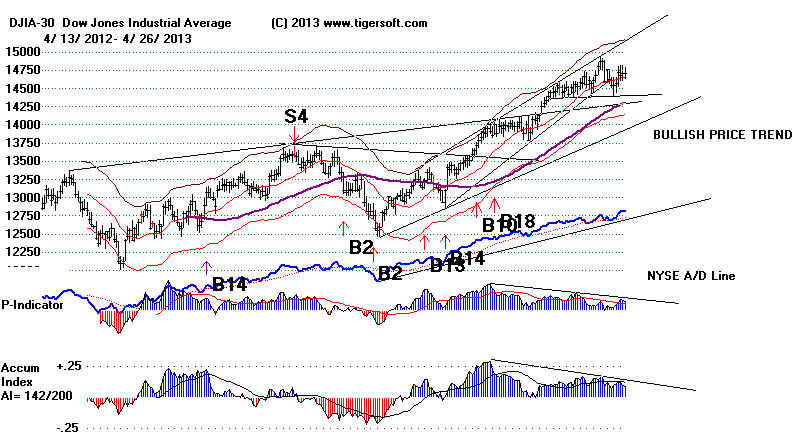
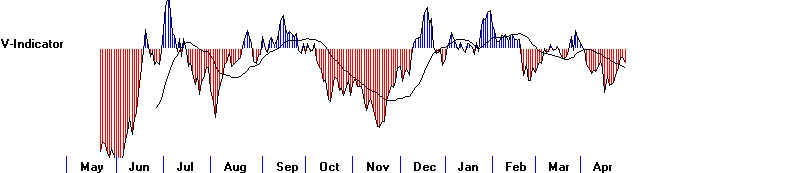
Selling at 15000. Too Easy?
If we were
to sell out prematurely next week how much might we lose?
The round
number 15000 will likely offer stiff psychological resistance. Selling
at 15000,
if the market does reverse and decline, will give you bragging
rights that
might last some time. And now we also have the "Sell in May"
argument.
So expect, many fund managers to sell into any rally. .
But let's
look closer at what happens to the DJI after May 1st in the
frequently
bearish post-Presidential Electionyear. . We are told, for example,
that since
1905 there have bave been no real NET gains to be had between May 1st
and
November 1st. But that's misleading. I have added a column
to show political party
and what
the President's fiscal approach was. Was the Democratic President a
"fiscal conservative", more "fiscally liberal" (FL) or caught
in a new
war (NW)?
It turns
out that when a Republican is in office there is an average
+0.41% rise
in the DJI from May 1st to October 31st in the post Presidential
Election
Year. Fiscally
conservative Democrats who are not in a new
war did
much worse. Wilson (1913, -0.31%), FDR (1937 , -20.71%)
and Carter
(1977, - 11.71%). They averaged a DJI decline of 10.9%.
By contrast, the fiscally more stimulative Democrats did much better:
FDR (1933,
+13.52%), Truman (1945, +12.29% ), JFK (1961, +3.71% ),
Clinton
(1993, +7.38% ), Clinton (1997, +6.16% ) and Obama (2009, +18.91% )
When a stimulative Democrat is in office, the DJI gains 10.32% on
average
from May to November.
Buying on May 1st and Selling DJI on October 31st
In White House DJI Pct Gain Investing
$10,000
1905 Repub
+10.12
$11,012
1909 Repub
+12.21
$12,357
1913 Dem
(FC) - 0.31
$12,318
1917 Dem (NW) -20.09
$ 9,844
1921 Repub
- 7.14
$ 9,141
1925 Repub
+30.42
$11,921
1929 Repub
- 14.34
$10,212
1933
Dem
(FL) +13.52
$11,593
1937 Dem
(FC) -20.71
$9,191
1941 Dem (NW) + 1.97
$9,373
1945 Dem
(FL) +12.29
$10,572
1949 Dem
(FL) +8.83
$11,505
1953 Repub
+0.39
$11,550
1957 Repub
-10.79
$10,304
1961 Dem
(FL) + 3.71 $10, 687
1965 Dem (NW) +4.18
$11,133
1969 Repub
-
9.91 $10,029
1973 Repub
+3.81
$10,412
1977 Dem
(FC) -11.71
$ 9,193 Carter
was more fiscally conservative than Reagan,
1981 Repub
-14.55
$
8,855
1985 Repub
+ 9.24
$ 8,581
1989 Repub
+9.36
$
9,383
1993 Dem
(FL) +7.38 $10,076
1997 Dem
(FL) +6.16
$10,669
2001 Repub
-15.46
$
9,044
2005 Repub
+2.43
$10,958
2009 Dem (FL)
+18.91
$10,755
2013 Dem (FL)
http://allstarcharts.com/sell-in-may-and-go-away-2/
====================================================================================
OLDER PEERLESS HOTLINES
=====================================================================================
4/25/2013 No
Peerless Sell. The NYSE A/D Line is rising. Accumulation is still high.
There are many more MAXCPs
than MINCPs. Professionals remain bullish
in the US for the time being.
But will the US be able to
stay uncoupled from the worsening world economy.
Despite Spain's official
unemployment hitting 27.2%, the governments
in Spain, Brussels and
Germany have nothing new to offer, except more austerity.
Austerity
blamed as unemployment soars in Spain and France
Search for Cuts Puts Portugal's Schools on Chopping Block NY
Times
Southern Europe's Recession Threatens to Spread North NY Times
While the austerity doctrine seems to have imploded,
austerity has strengthened its grip on elite opinion. Why? P Krugman NY Times
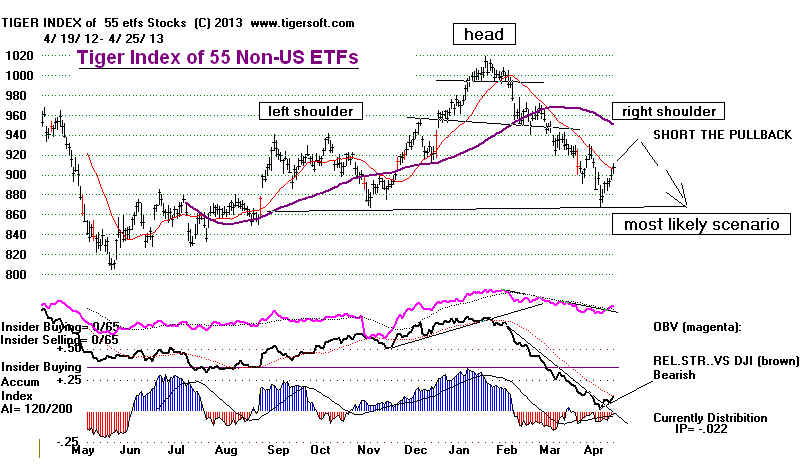
This
human tragedy in Spain is something the markets seem to have anticipated.
They are currently rallying.
The danger now is that this bleak economic news
will work against there being
a big enough rally in overseas markets
for our Tiger Index of
Foreign ETFs to get past the now rapidly falling 65-day ma.
Such a failure would set up a
bearish head/shoulders pattern. This dismal
news is not causing a change
of policy. But it may soon unsettle the nervous European
bond markets and cause a new
crisis for the Euro. .
The DJI
should easily be able to stay above its neckline. The usual
bullishness of the week or
two after April 25th will help, too. But watch closely
to see if the DJI's nascent
Head/Shoulders patterns becomes more recognizable.
Seldom does such a pattern
play out unless there is either red Distribution
on the right shoulder or, at
least, a noticeable subsidence from our Accumulation
Index. So we will pay
close attention to this indicator as well as the daily
breadth data, which continues
to be very positive.
Behavior of DJI since 1965
After 5 trading days
After 10 trading days
After 21 trading days
% of time Avg DJI
% of
time Avg DJI
% of time Avg DJI
DJI rises Gain
DJI rises Gain
DJI rises Gain
April 25th 68.1% +0.5%
61.7% +0.4%
51.1% -0.1%
statistically significant
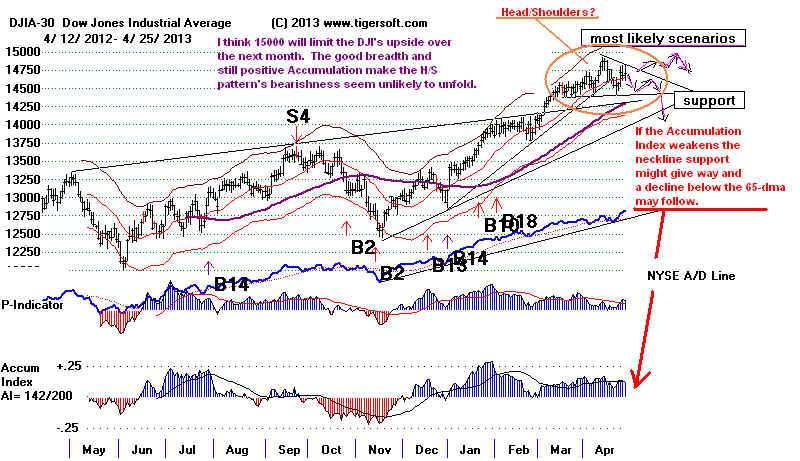
Meanwhile, very heavily
traded SPY seems to have surpassed its own potential right
shoulder apex. But it
has now reached it recent high and a short-term optimized
red Sell signal warns that it
will probably need to pull back again before advancing.
The Closing Power is still
uptrending. Professionals have not yet turned bearish
on SPY.
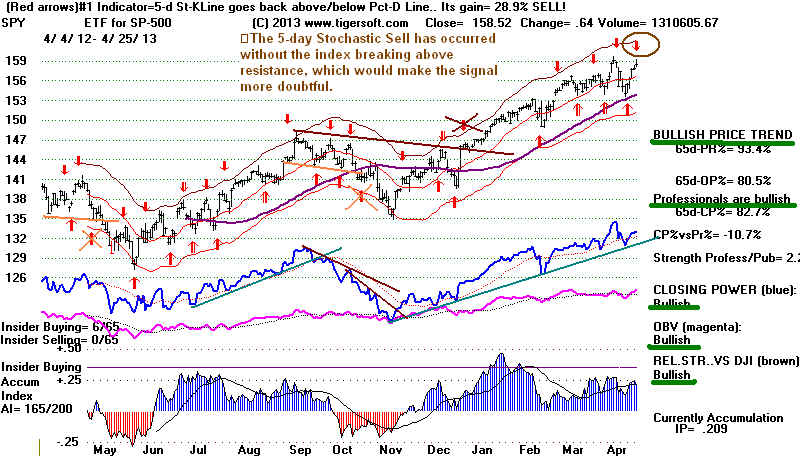
MDY (the ETF for Mid-Caps) will need to breakout above 210 on this advance
or it will generate a new red Sell and could retreat 4.5% to its best support,
its own price neckline.
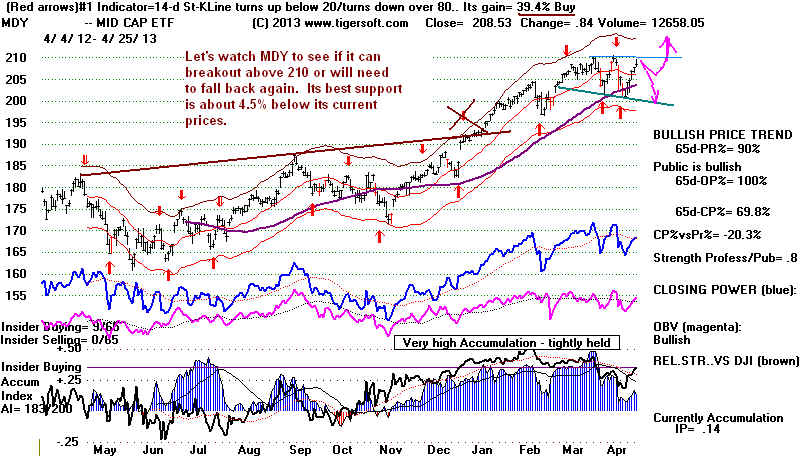
4/25/2013 ---> To Key Index and Leading Stock
Charts
Key Values: DJI
14701 +25 la/ma= 1.04 21dma-roc
= .115 P=+ 235 Pch=
-12
IP21 = +.119 (on 1/30/2013 IP21 was .293) V = -20 Opct = .11 65 day-pct-up = .067
---> 198 +11 MAXCP
stocks Bullish MAXCP Stocks (4/25/2013) Bullish plurality
---> 26 -3 MINCP stocks Bearish MINCP Stocks
(4/25/2013)
---> 101 New Highs on NASDAQ 9
new lows. Bullish plurality
---> 137 New Highs on NYSE 6 new
lows. Bullish plurality
====================================================================================
OLDER HOTLINES
====================================================================================
4/24/2013
No Peerless Sell. A/D Line is rising. Today, we saw a great surge
in the
number of stocks making new highs with very high Accumulation. More
today, I
think, than in January. While high priced biotech stocks got clipped with
some
profit-taking, the money from them seems to have been immediately
deployed in
a wide variety of stocks, with the usual emphasis on REITs and Utilities.
4/24/2013 ---> To
Key Index and Leading Stock Charts
Key Values: DJI
14676 -43 la/ma= 1.0026 21dma-roc
= .186 P=+ 246 Pch= +68
IP21 = +.142 (on 1/30/2013 IP21 was .293) V = -19 Opct = .094 65 day-pct-up = .069
---> 187 -17 MAXCP
stocks Bullish MAXCP Stocks (4/24/2013) Bullish plurality
---> 29 -37 MINCP stocks Bearish MINCP Stocks (4/24/2013)
---> 64 New Highs on NASDAQ 12
new lows. Bullish plurality
---> 139 New Highs on NYSE 4
new lows. Bullish plurality
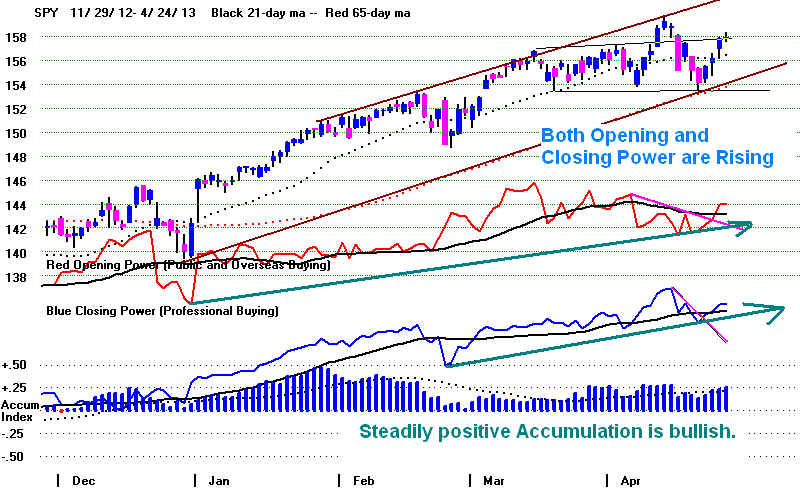
The SP-500
chart above also shows that prices have surpassed the right shoulder in a
potential head/shoulders pattern. This usually means higher prices. And though
the
DJI's
close today was below its tight shoulder peak, the good breadth and
high
Accumulation argue forcefully against this pattern being completed.
There
are very few valid, completed DJI H/S patterns that show a strong
A/D
Line and a very positive IP21 value on the right shoulder. The primary
exception was also at the end of April in 2010, but even then the IP21 was only
.079
on the right shoulder apex. Ours now is .142.
When
we look at the key ETFs, DIA, SPY, QQQ or IWM, we see a wall of
steady (blue) Accumulation. All dips have found eager institutional
buyers ready
to
cushion and soon reverse any decline. Nothing seems changed in this.
To Key Index and Leading Stock Charts

Some longer-term bullish forces are at work. The blade of the Auserity axe
has just gotten a lot duller because economists have gotten sharper in their
criticism of its academic foundation.
Austerity's Academic Support Is Hit Hard.
But Will Budget Balancers Acknowledge This?
Ideological Thinking and American Politics
Usually Preclude Such Re-Thinking.
I
think a key reason this new surge in US stocks is taking place is because
"Austerity" has been dealt a severe blow academically in the US. This
inevitably
weakens those here who keep arguing that the solution for high unemployment
and a
weak economy is more government lay-offs and budget cuts. It turns out
that two Harvard economists
twisted their data in 2010 and left out of their
research countries like Japan, which show the ratio of government Debt to GNP"
can
be much higher, before economic growth is seriously impeded. Listen to the
discussion
on usually quite conservative Yahoo. This is quite a blow to the
Austerity
crew. Just a few months ago, the Washington Post editorialized that
the US was
“dangerously near the 90 percent mark that economists regard as a
threat to
sustainable economic growth.” Krugman noticed the phrasing:
“economists”.
They might
have more accurately said “some economists”, since what they were
saying was
vigorously disputed by other economists."
Krugman writes:
"As soon as the paper was released, many economists pointed out that a
negative correlation between debt and economic performance need not mean
that high debt causes low growth. It could just as easily be the other way around,
with poor economic performance leading to high debt. Indeed, that’s obviously
the case for Japan, which went deep into debt only after its growth collapsed in
the early 1990s.
Finally, Ms. Reinhart and Mr. Rogoff allowed researchers
at the University of
Massachusetts
to look at their original spreadsheet — and the
mystery of the
irreproducible
results was solved. First, they omitted some data; second, they used
unusual and highly questionable statistical procedures; and finally, yes, they made
an Excel coding error. Correct these oddities and errors, and you get what
other
researchers have found: some correlation between high debt and slow growth,
with no indication of which is causing which, but no sign at all of that 90 percent
“threshold.”

Kenneth Rogoff and Carmen Reinhart
...What the Reinhart-Rogoff affair shows is the extent to which austerity has been
sold on false pretenses. For three years, the turn to austerity has been presented
not as a choice but as a necessity. Economic research, austerity advocates insisted,
showed that terrible things happen once debt exceeds 90 percent of G.D.P. But
“economic research” showed no such thing; a couple of economists made that
assertion, while many others disagreed. Policy makers abandoned the unemployed
and turned to austerity because they wanted to, not because they had to."
http://www.nytimes.com/2013/04/19/opinion/krugman-the-excel-depression.html?ref=opinion&_r=1&
http://www.guardian.co.uk/commentisfree/2013/apr/16/unemployment-reinhart-rogoff-arithmetic-cause
Unfortunately, President Obama is silent. So is his ex-chief of staff R. Emanuel.
Only
when the Wall Street Journal switches sides on this debate, like the Financial
Times
has, will these Democratic "leaders" take a new stand. If you've wondered
why the American electorate seems to be so slow to understand the other side
of
this issue, don't blame the Republicans, blame the Democrats for pandering
and
playing puppet to Wall Street.
Unfortunately, for Europe, neither major political party in Germany, the CDU or the SPD
seem
to favor ending the Austerity madness.
Angela
Merkel::: 'Austerity makes it sound evil, I call it balancing the budget.

The
British are turning around. That PM Cameron's Austerity has failed its
test
is now heard in the City of London.
Britain's
austerity is indefensible - FT.com - Financial Times
Another possible reason for a rally is that Janet Yellen is now being openly discussed
as a
successor to Bernanke. She is definitely in the "dovish" camp.
Solving the
high
and long-term Unemployment is more important for her than fighting inflation.
http://www.nytimes.com/2013/04/25/business/janet-l-yellen-possible-fed-successor-has-admirers-and-foes.html?nl=todaysheadlines&emc=edit_th_20130425&_r=0
=====================================================================================
OLDER HOTLINES
=====================================================================================
4/23/2013 No Peerless Sell, Rising A/D Line
and Closing Powers.
A further DJI and
SP-500 rally would void the potential head/shoulders pattern.
With both Opening
and Closing Power rising in DIA and SPY, the markets look
ready to move
higher. With NYSE advancers almost 4:1 over decliners,
the market
broadened nicely today. As the head/shoulders pattern is still a
viable
possibility, our Stocks' Hotline is still holding a few bearish MINCPs.
Again gold stocks
were weak when the general market rose. That suggests
higher stock
prices, too.
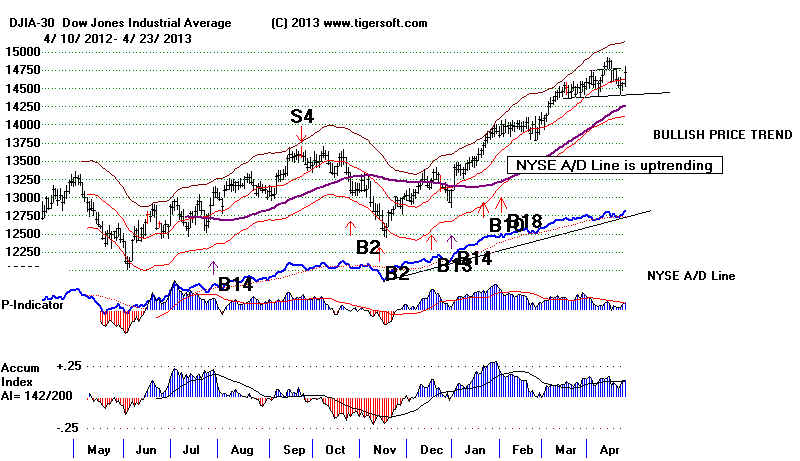
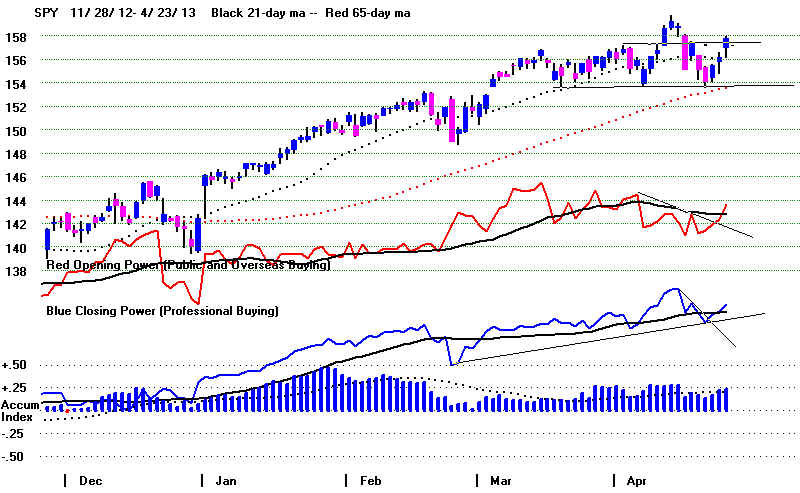
4/23/2013 ---> To Key Index and Leading Stock
Charts
Key Values: DJI
14719.46 +152 la/ma= 1.006 21dma-roc
= 0169 P=+ 177 Pch= +48
IP21 = +.14 (on 1/30/2013 IP21 was .293) V = -41 Opct = .097 65 day-pct-up = .077
---> 204 +44 MAXCP stocks Bullish MAXCP Stocks (4/23/2013) Bullish plurality
---> 66 -16 MINCP stocks Bearish MINCP Stocks
(4/23/2013)
---> 71 New Highs on NASDAQ 10
new lows. Bullish plurality
---> 172 New Highs on NYSE 4
new lows. Bullish plurality
===================================================================================
OLDER HOTLINES
===================================================================================
4/22/2013 No Peerless Sell, Rising A/D Line
and Closing Powers.
But once again it looks like
overseas and public selling at the opening will
challenge the DJI. The
SPY and SP-500 should be able to hold up, but we have to
watch the key SPY neckline
and rising 65-day ma support in SPY at 153-154..
SPY's rising Closing Power
trend and its IP21 at +.22 give us hope.
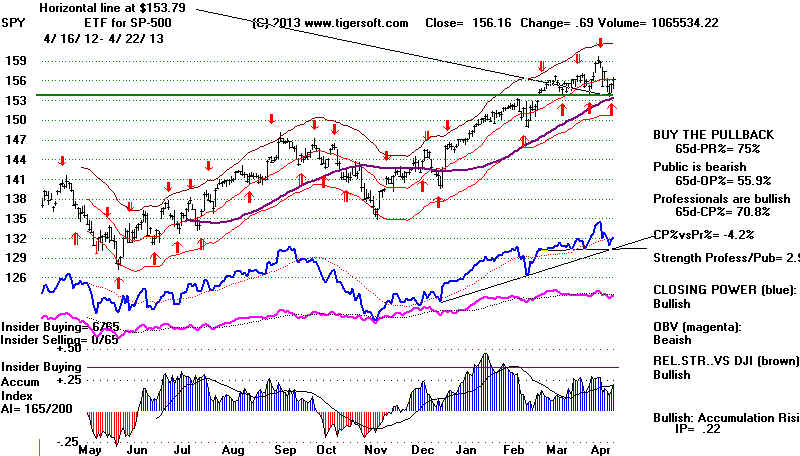
Weakness in GE and IBM Are Holding The DJI Back.
IBM's 3 day 21 point decline
has pushed the DJI down 168 points all by itself.
Since the strength seen in
DD, DIS, HD, JNJ, KO, PFE, PG, VZ is impressive,
the DJI will probably hold
above its 14400 point support, 160 points below
today's support But
lets watch JPM and SCHW. These are two other key stocks
that could break key support
in their own unfolding head/shoulders patterns.
4/22/2013 ---> To
Key Index and Leading Stock Charts
Key Values: DJI
14547 +10 la/ma= 0.995 21dma-roc = 0.029 P=+ 61 Pch= -7
IP21 = +.096 (on
1/30/2013 IP21 was .293) V = -72 Opct = .013
65 day-pct-up = .069
A "Nifty-Fifty" Defensive Market
"EVERY BULL MARKET has its glamour companies--favorites that can't go
wrong.
The late 1920s bull market had Radio Corp. of America
and the Great A&P Tea Co. The
early 1970s had a group of high-growth blue chips
called the Nifty Fifty." What this article
in Forbes fails to mention
is how badly the market behaves when the nifty fifty can no longer
hold up appearances. . .
The NYSE A/D Line Uptrend Is Intact. Last
week's test of it looks successful.
But now we must watch the emerging, potentially
bearish head/shoulders patterns
in the DJI-30
and SP-500. Meanwhile defensive groups
(biotechs, utilities and food
stocks) keep making new highs.
Can we still trust the A/D Line? The breadth of
the advance is narrowing despite
the A/D Line strength. For example, even though
Fidelity's biggest high cap positions
when weighted by price x volume, the number of gain
stocks are fewer and fewe.
The huge rise in their very big biotech positions and
Home Depot are covering over
a growing weakness elsewhere.
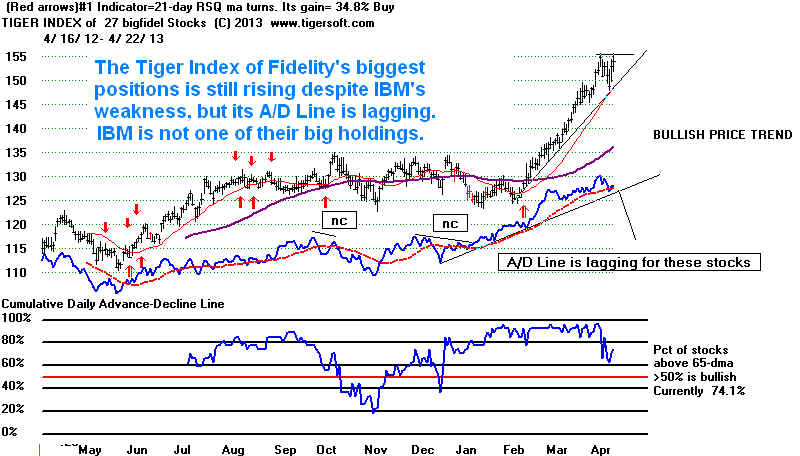
I think a secret "nifty fifty" may be
emerging now, just as it did in 1972. We don't see
this in NYSE A/D Line weakness and divergence from
the DJI like we did
back then, because, I think, of how many more
dividend paying and interest rate sensitive
investment vehicles are on the NYSE now.
The simplest approach is to keep watching
the NYSE A/D Line. When
its uptrend is broken, we could get a significant sell-off.
This is what happened in 2001 and 2002 when the A/D Line
uptrends were broken
in a low interest rate environment.
2001 A/D Line Trend-Breaks
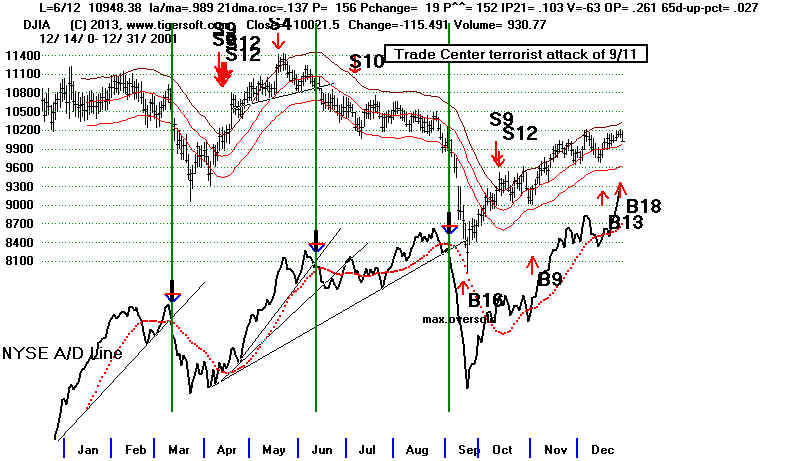 |
2002 A/D Line Trend-Breaks
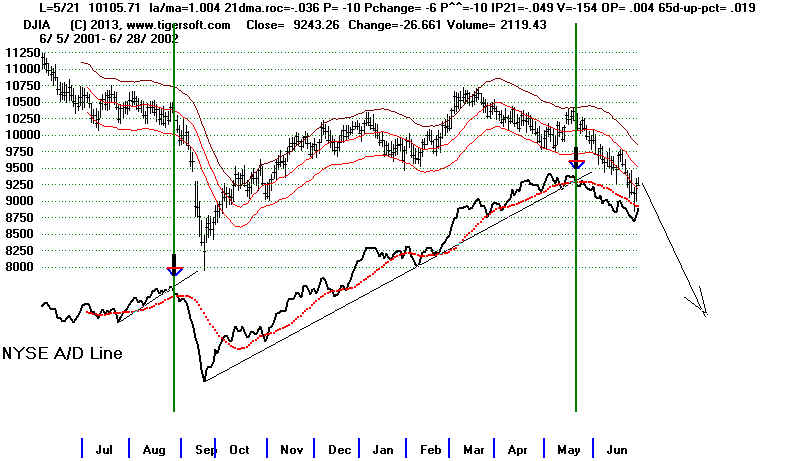 |
2013 DJI and A/D Line Trend-Break in
2012
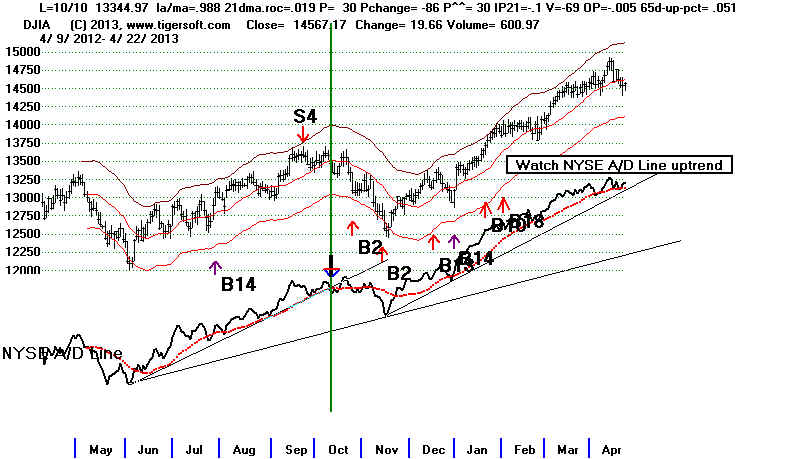 |
We have no Peerless Sell. But the round number
15000 is likely to be resistance.
Leadership by defensive stocks after a long rally has
to be bearishly construed.
This would seem to be a perfect market for hedging
with some bearish MINCP stocks.
Industry selection is very important. Gold
stocks still show declining Closing
Powers and steady distribution by institutions.
I know the temptation is high
to call a bottom in them, but I would wait until our
Closing Power shows that
Professionals have shofted to the long side.
See ANV, GG, ASA and NEM.
---> 160 -4 MAXCP stocks Bullish
MAXCP Stocks (4/23/2013) Bullish plurality
---> 82 -12 MINCP stocks Bearish MINCP Stocks (4/23/2013)
---> 41 New Highs on NASDAQ 15
new lows. Bullish plurality
---> 69 New Highs on NYSE 10
new lows. Bullish plurality
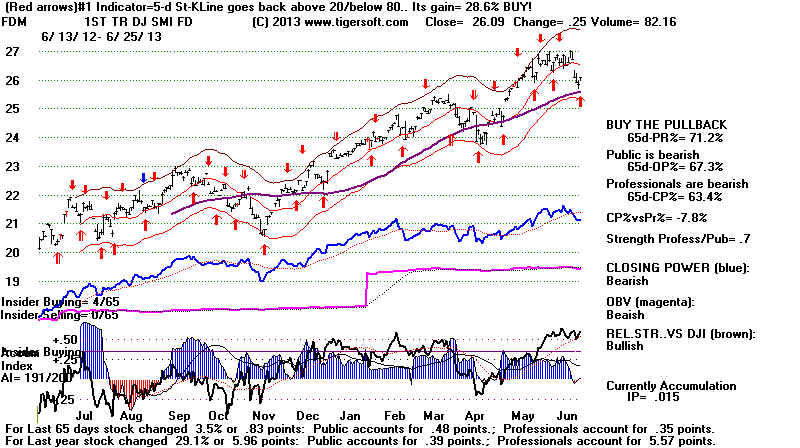
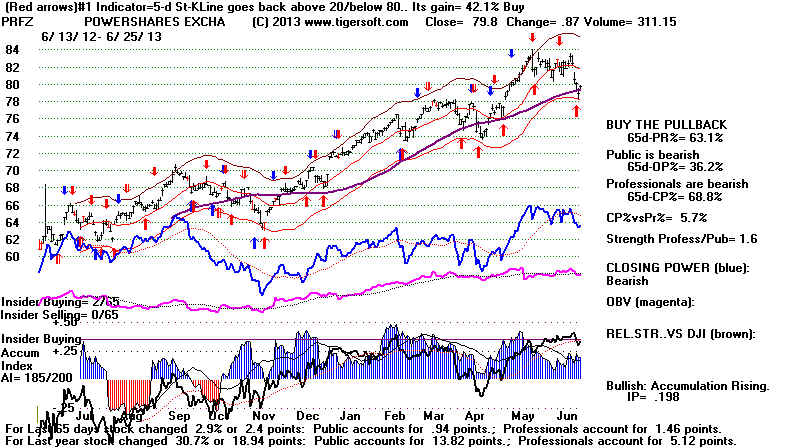
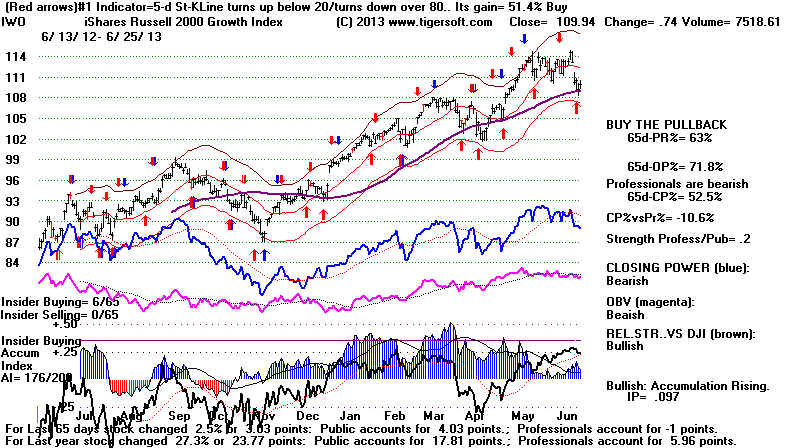
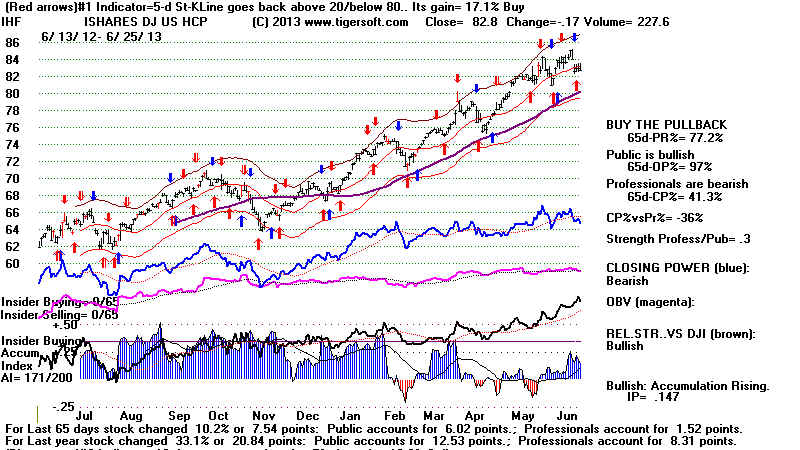
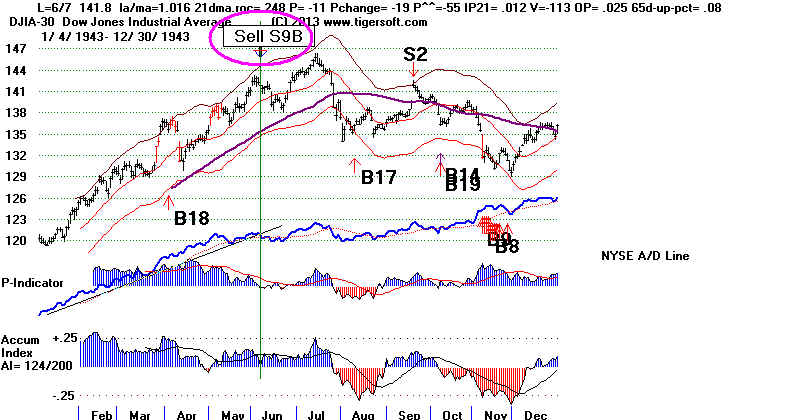
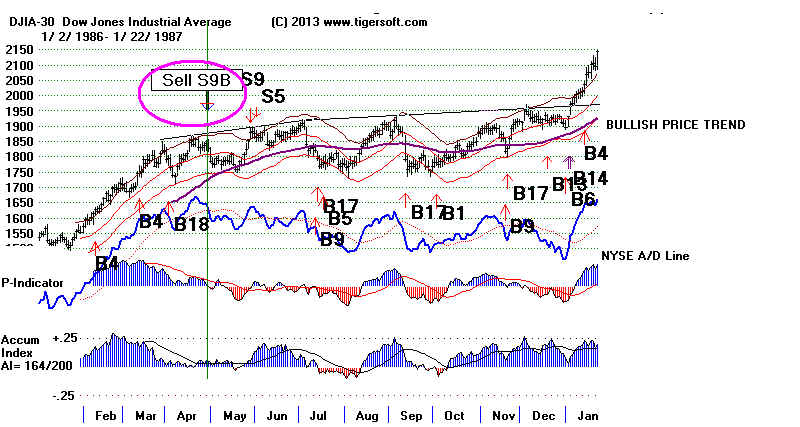
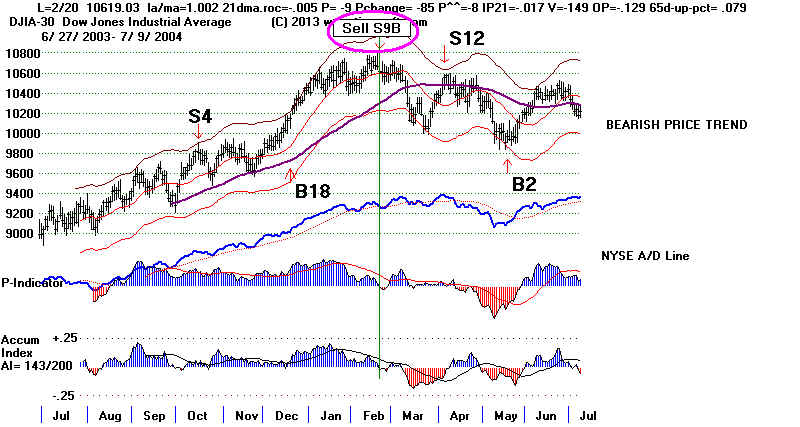
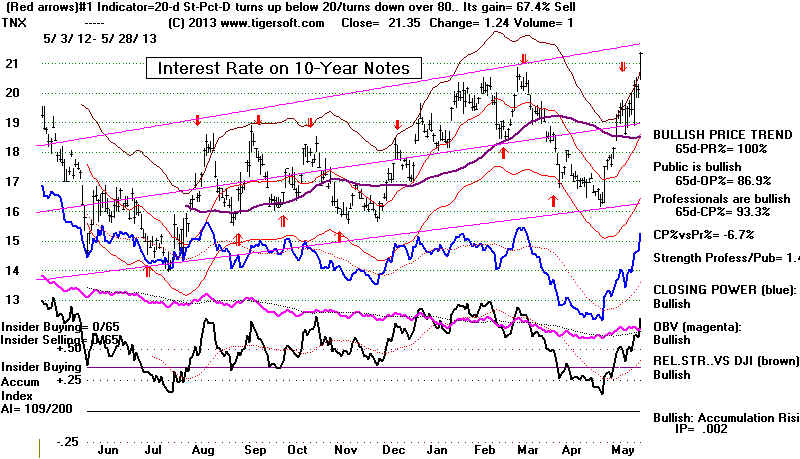
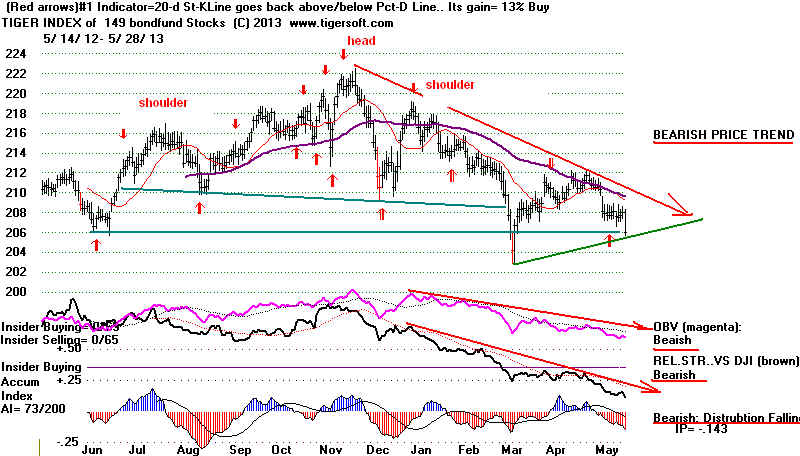
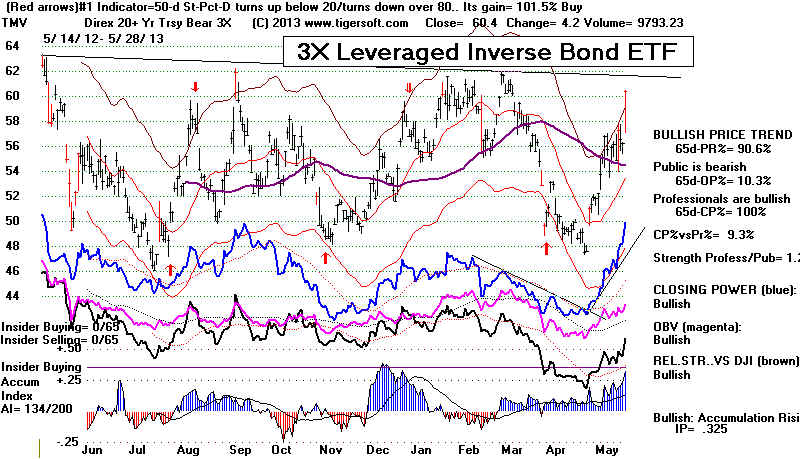
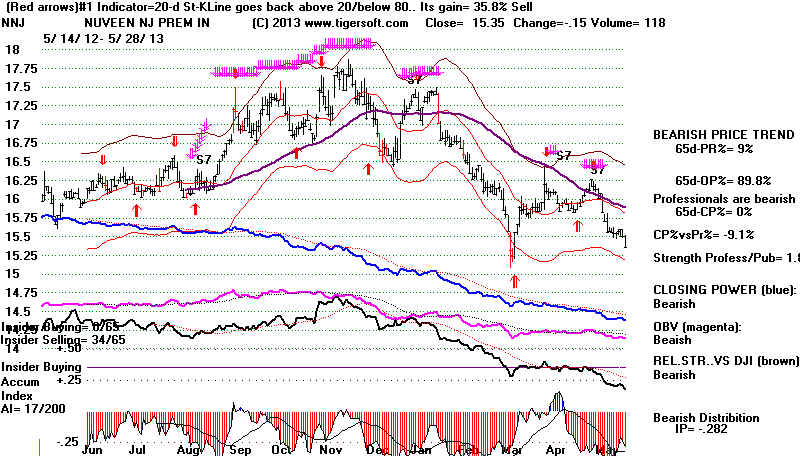
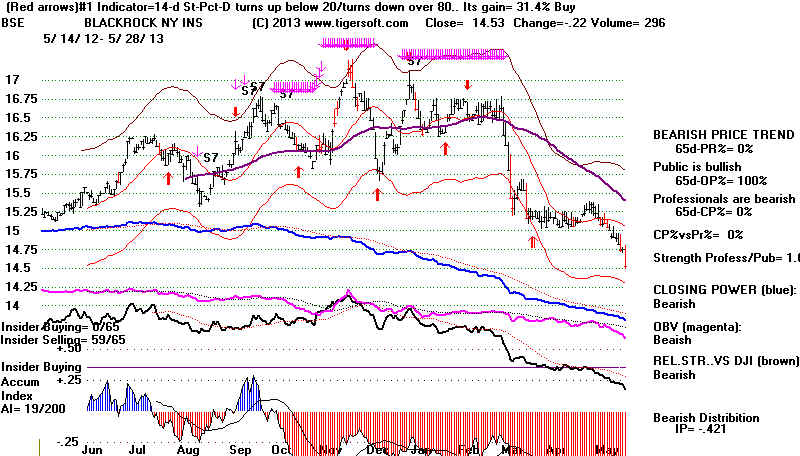
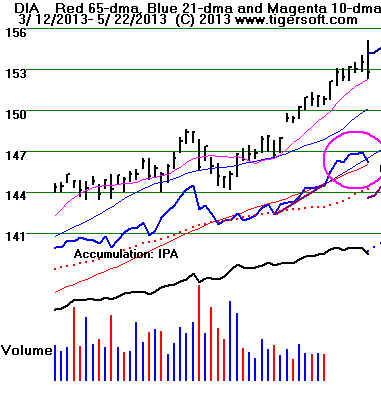
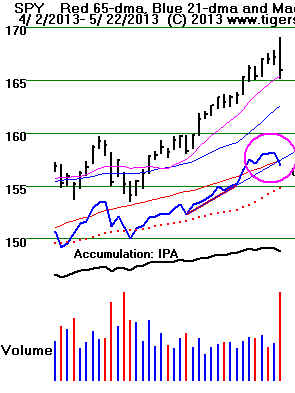
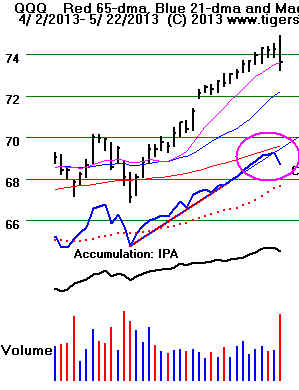
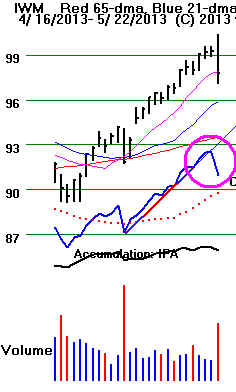
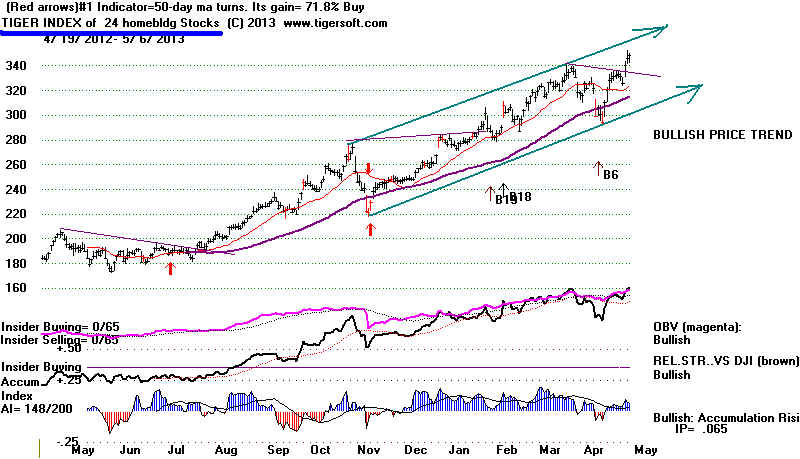
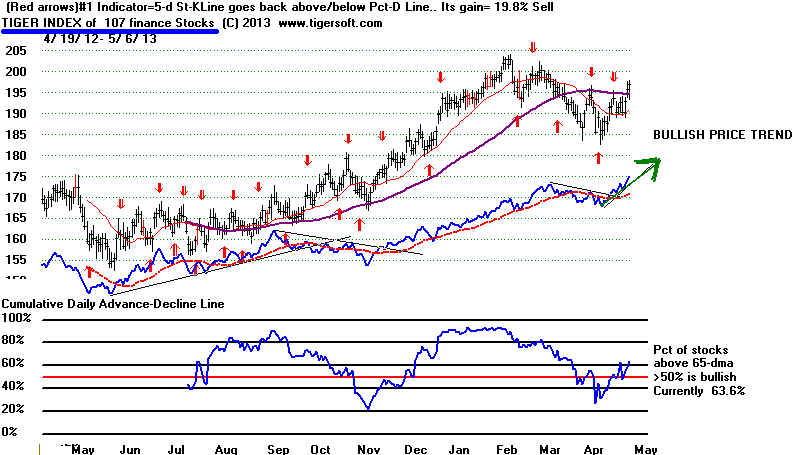
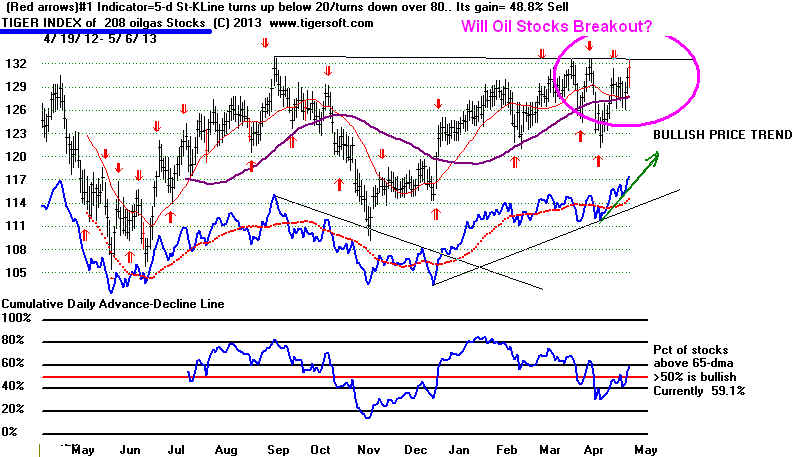
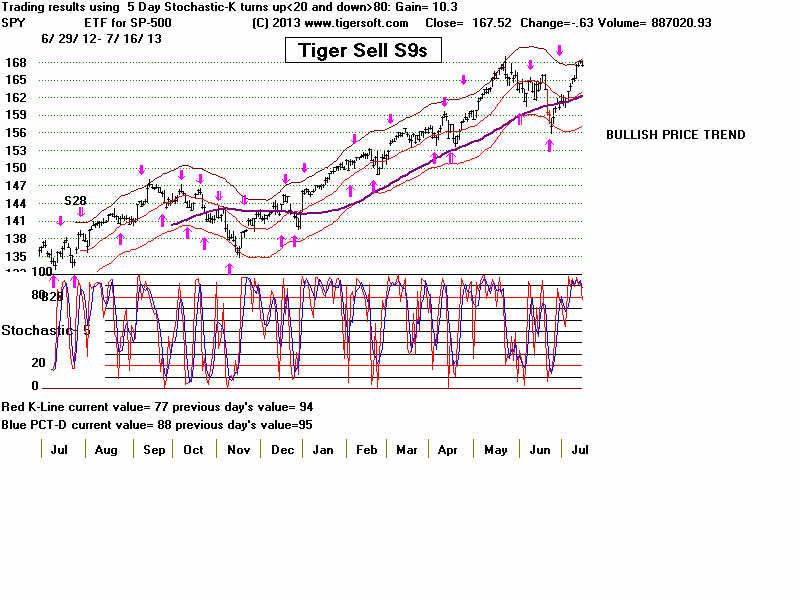
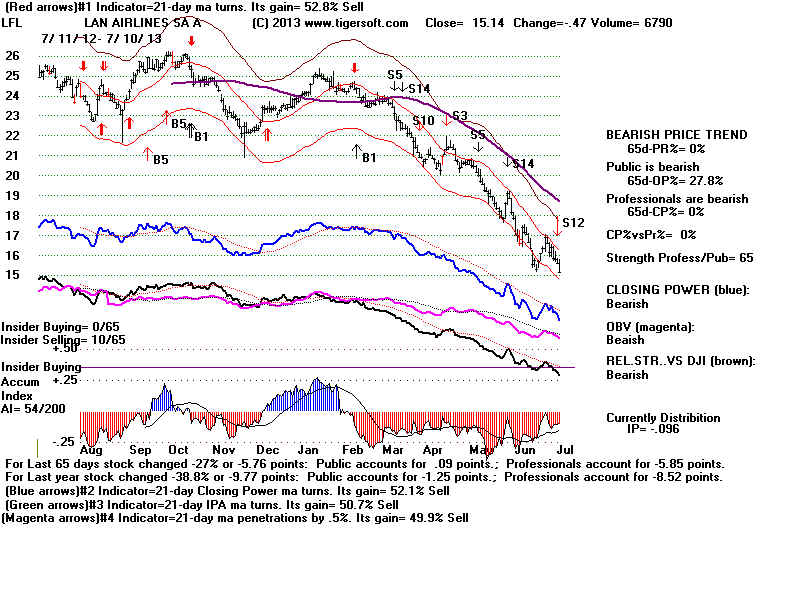
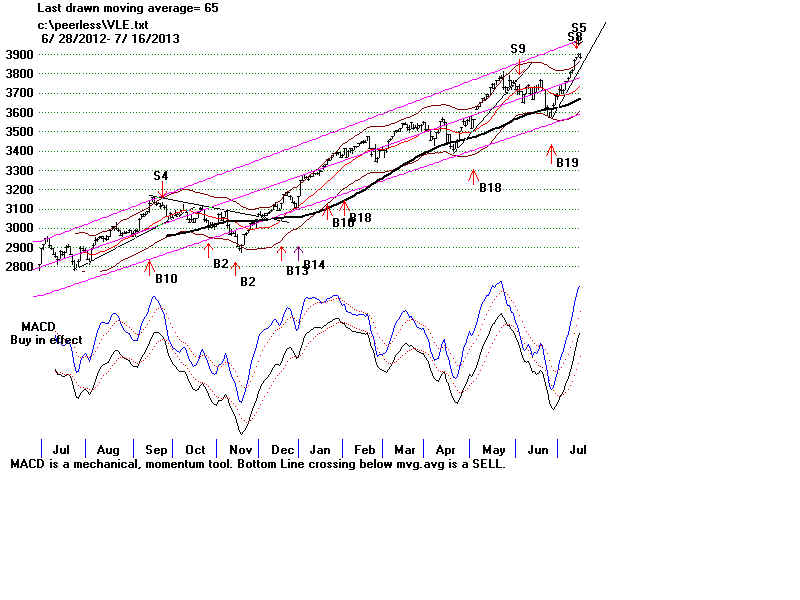
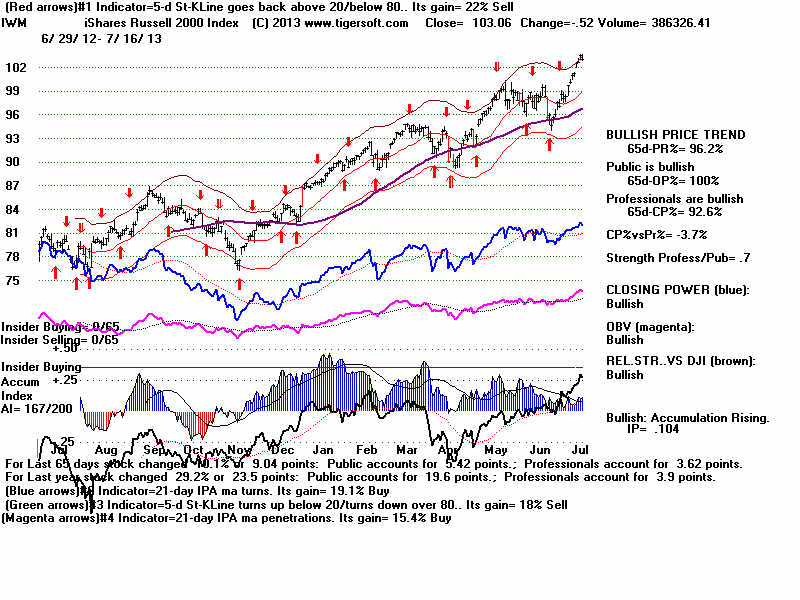
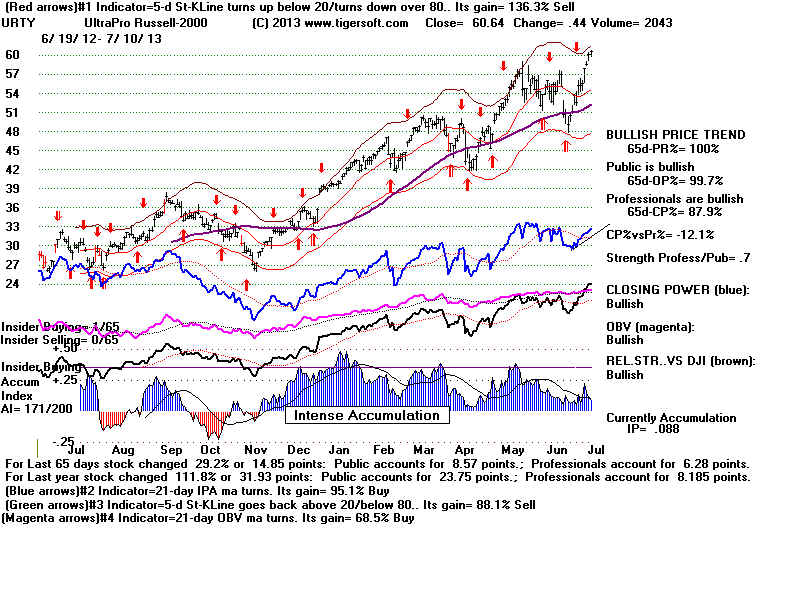
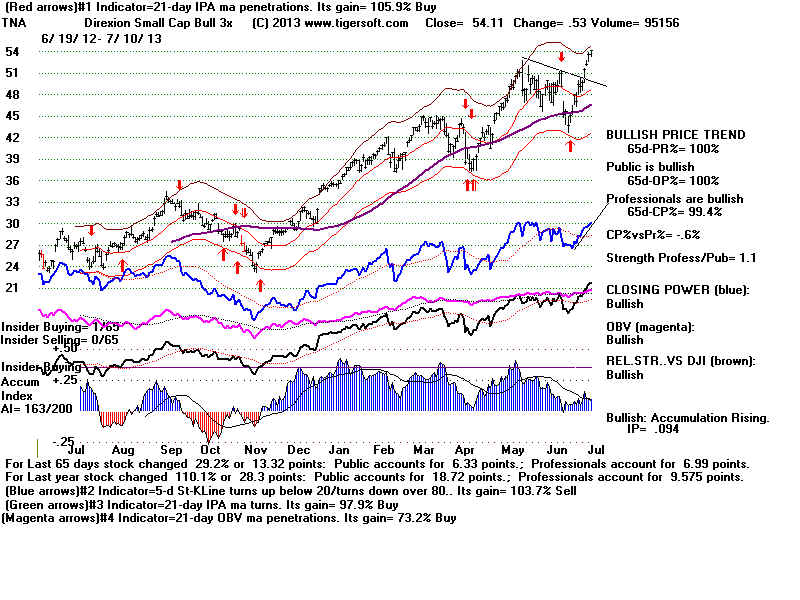
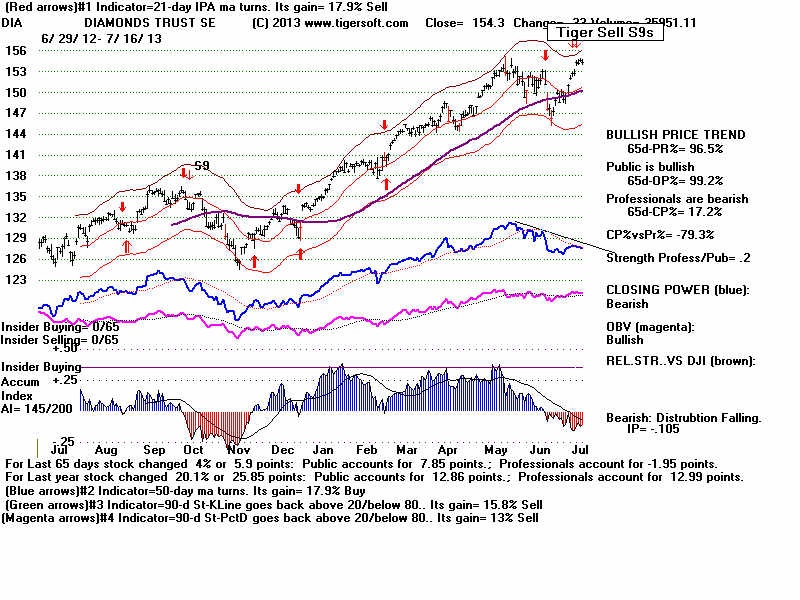
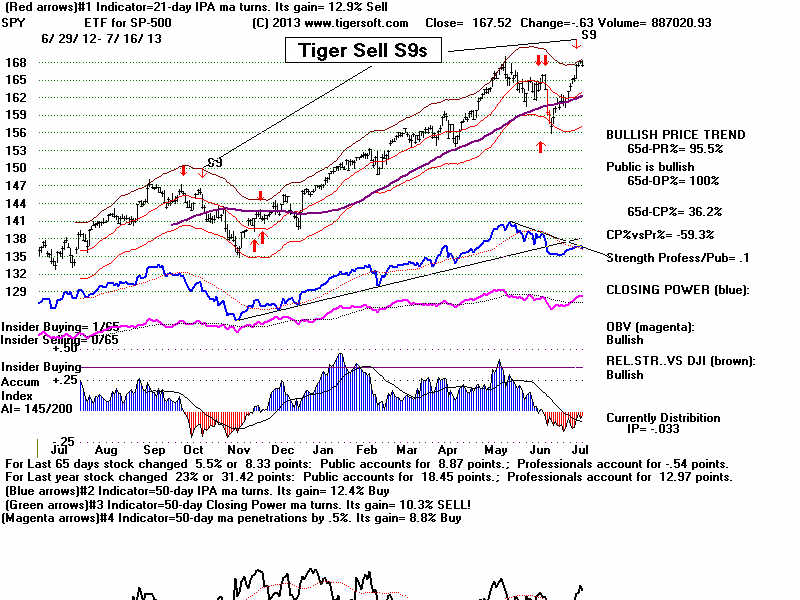
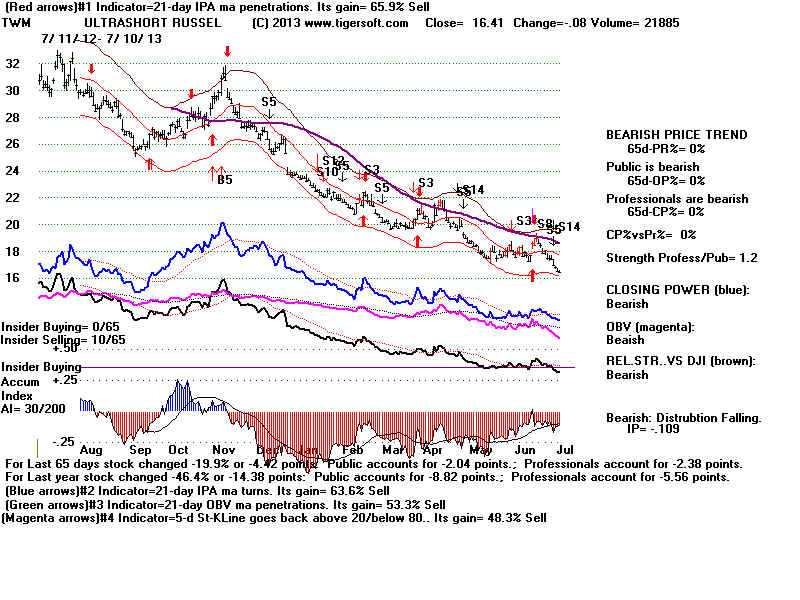
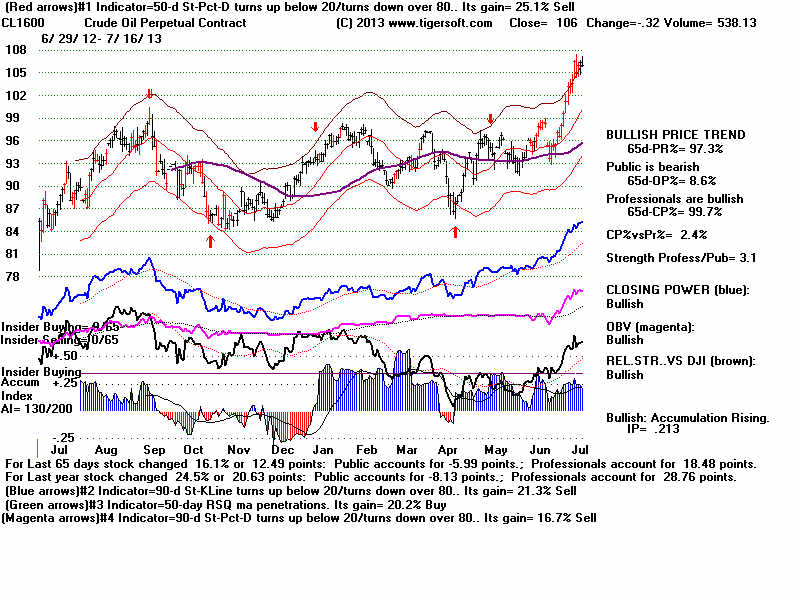
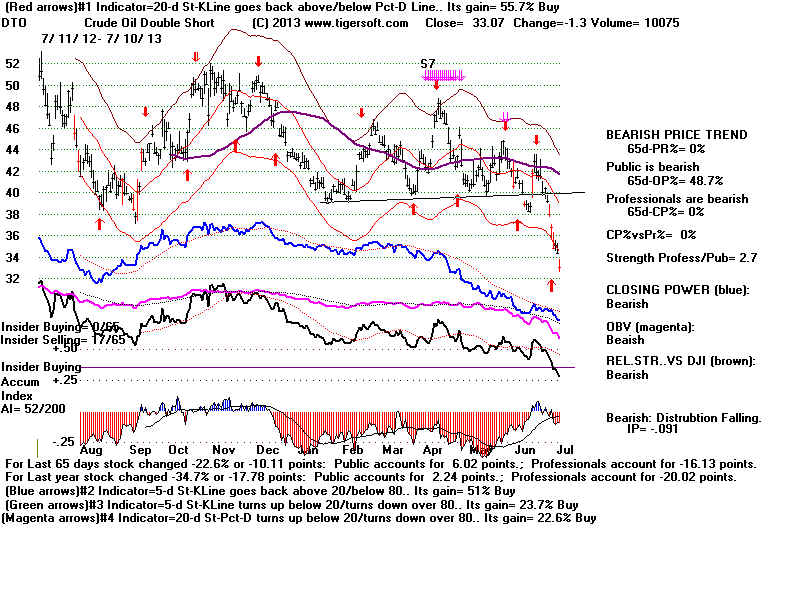
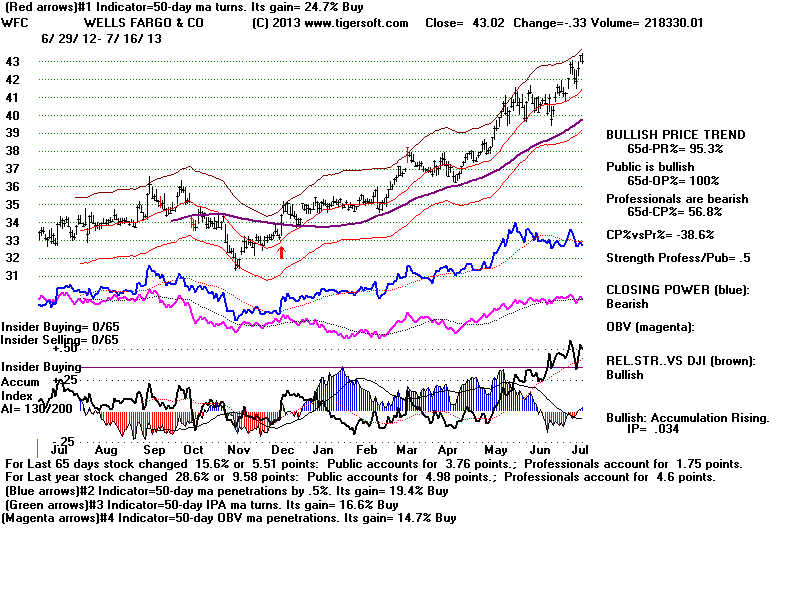
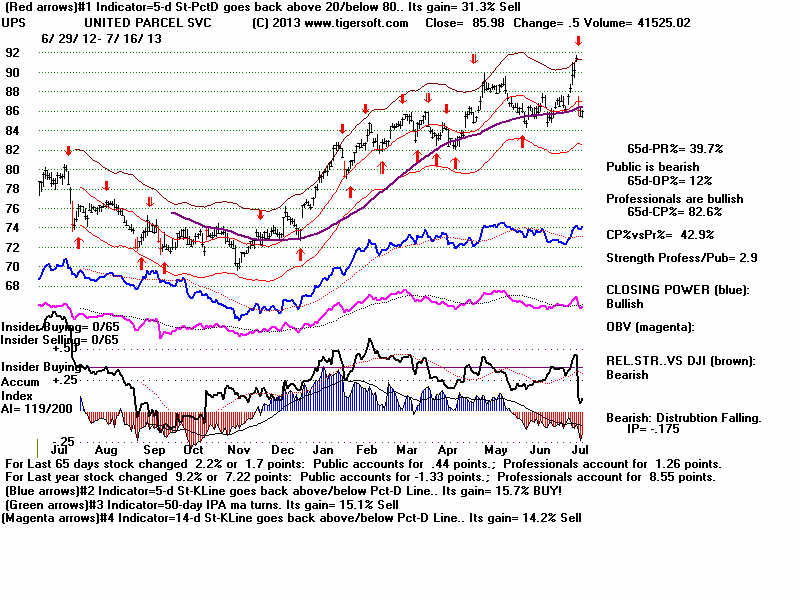
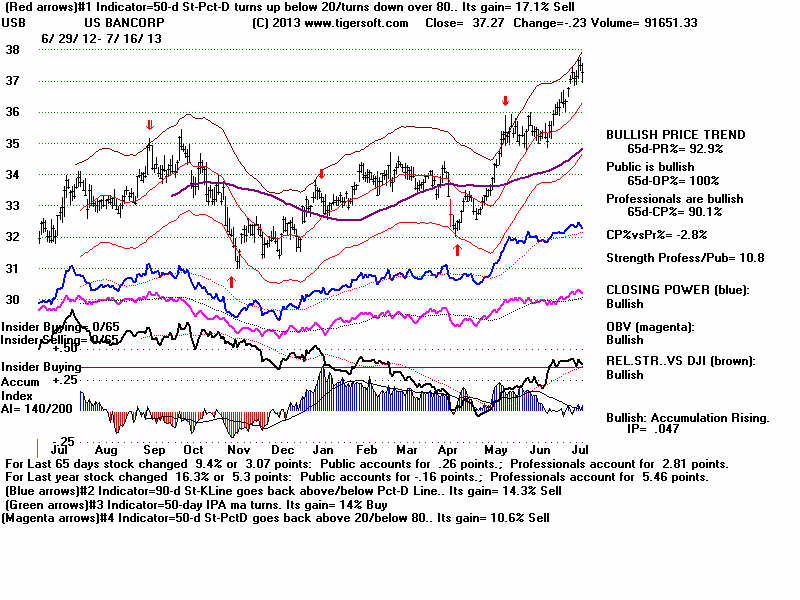
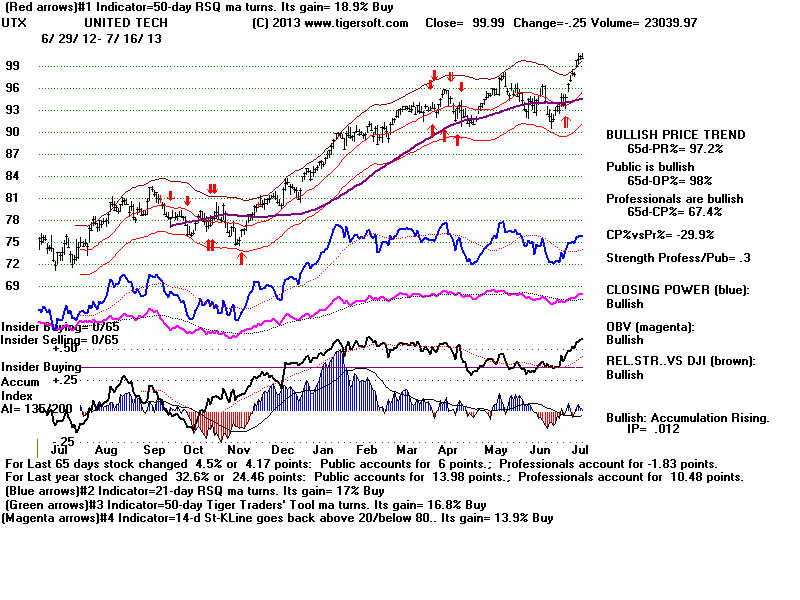
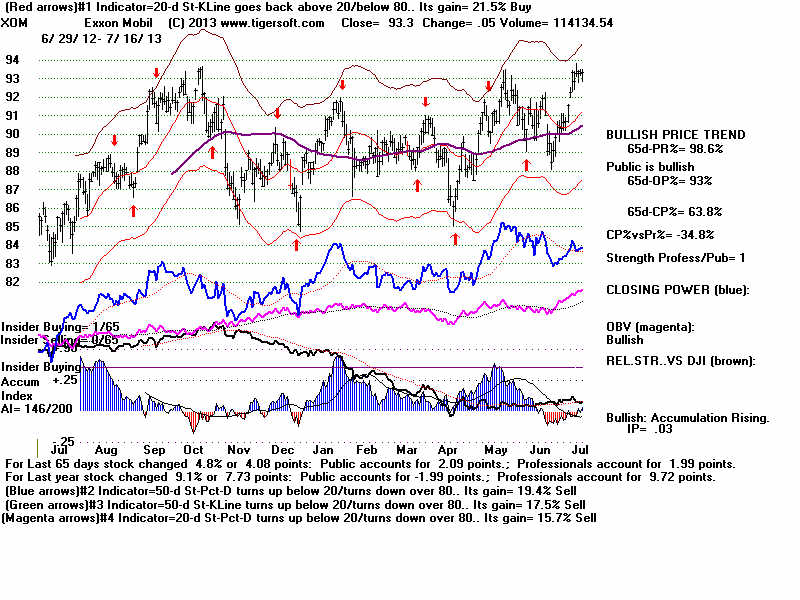
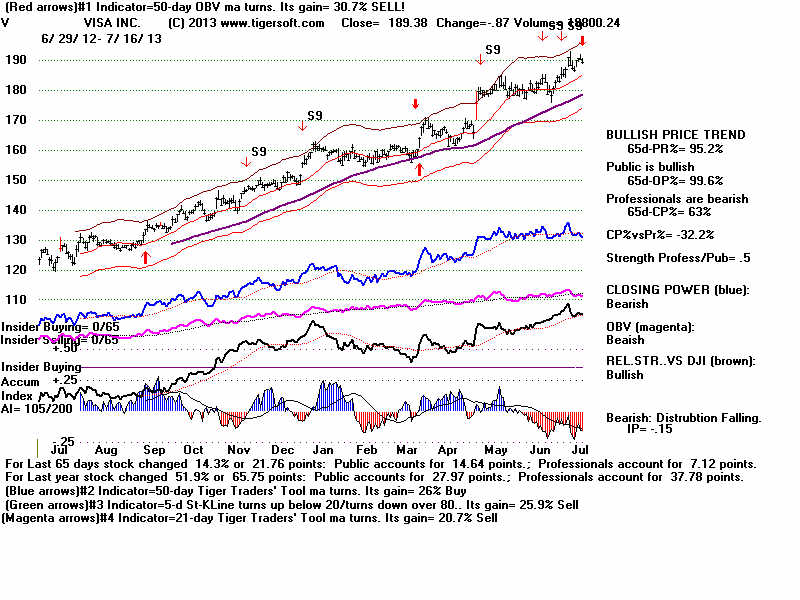
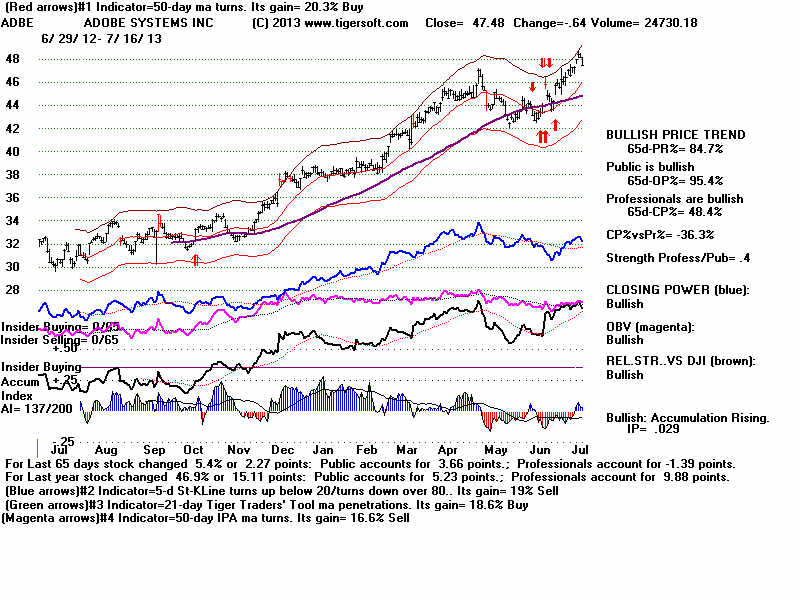
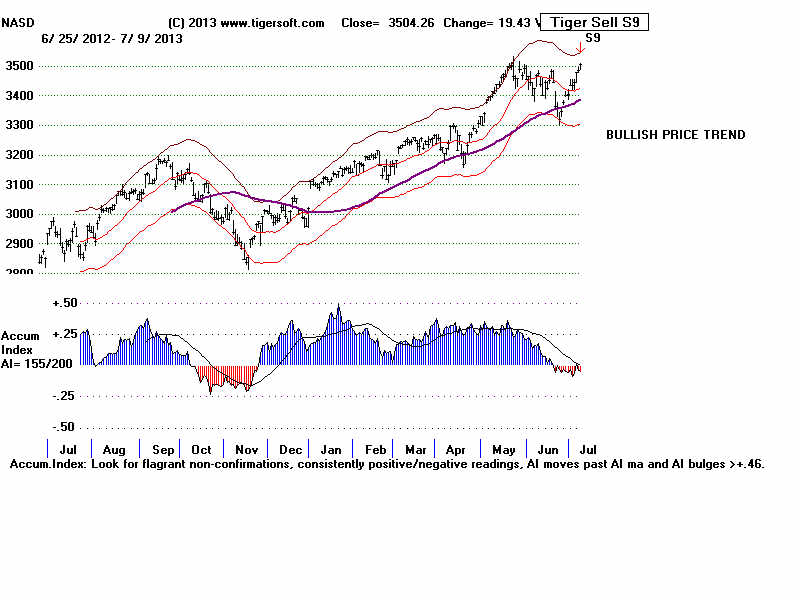
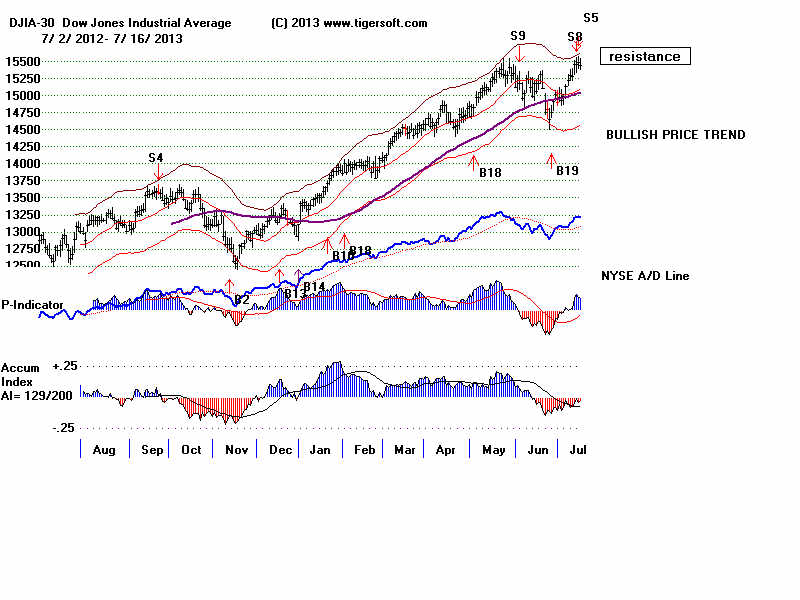
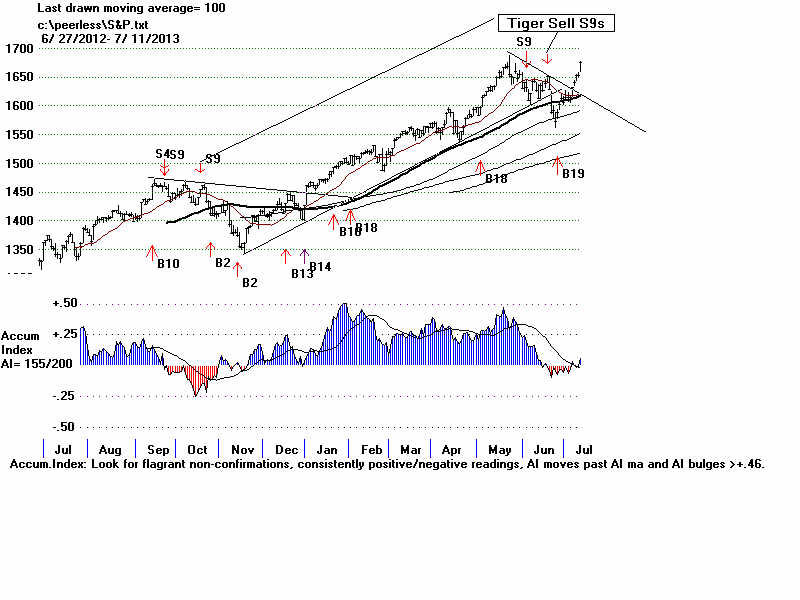
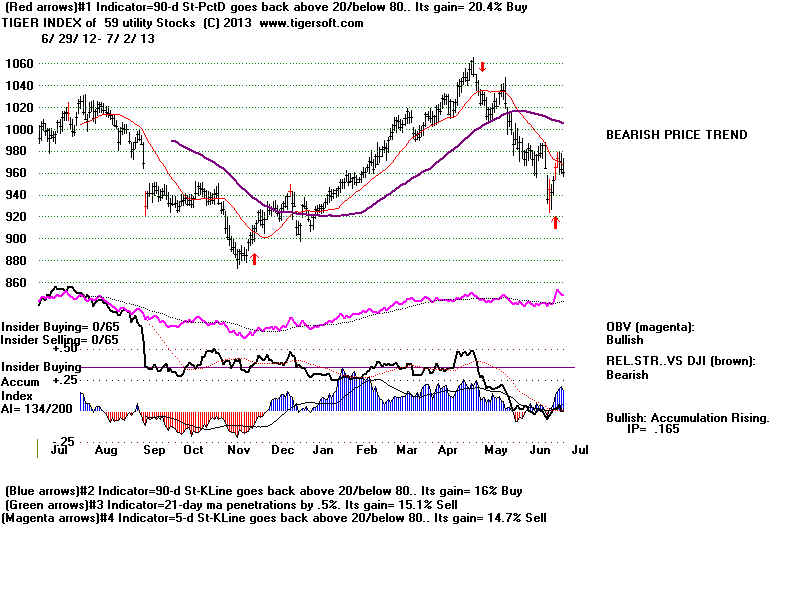
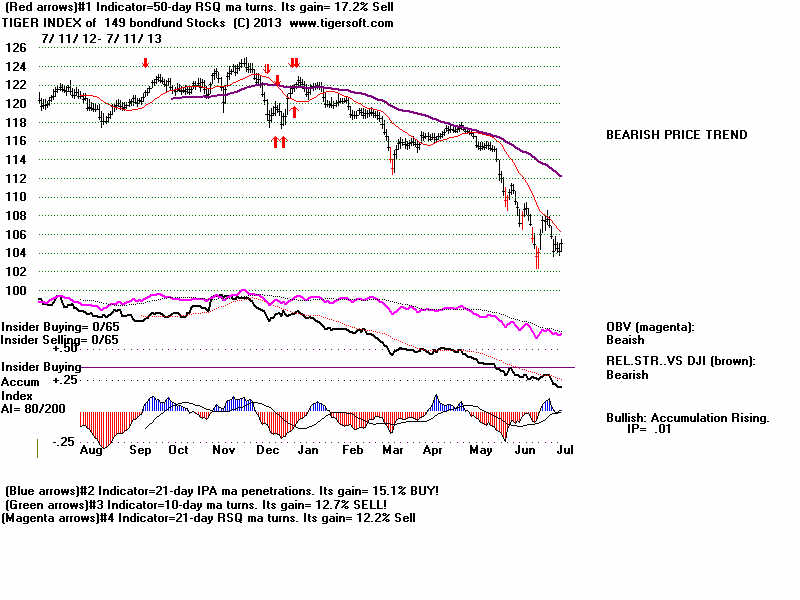
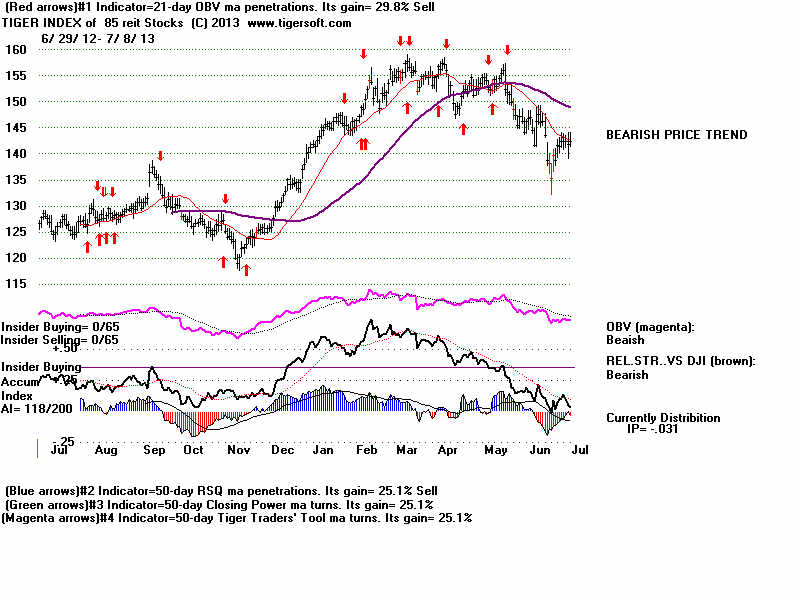
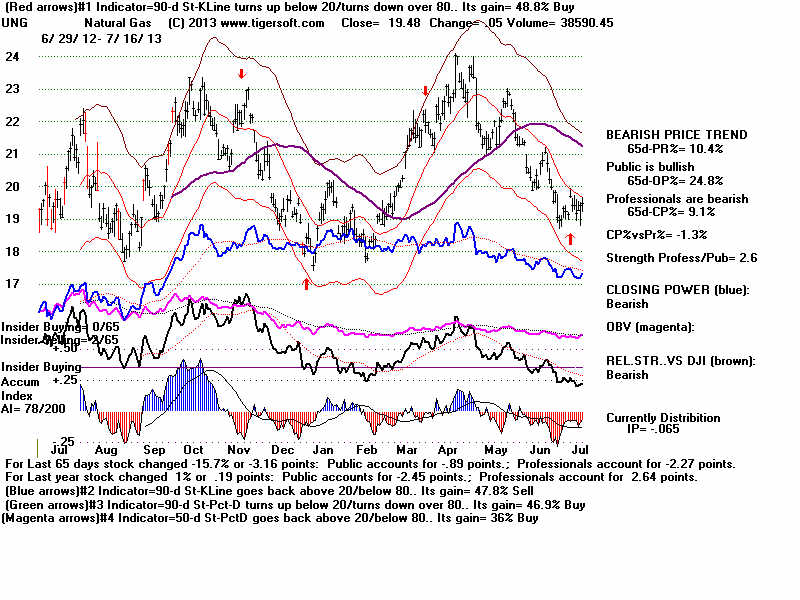
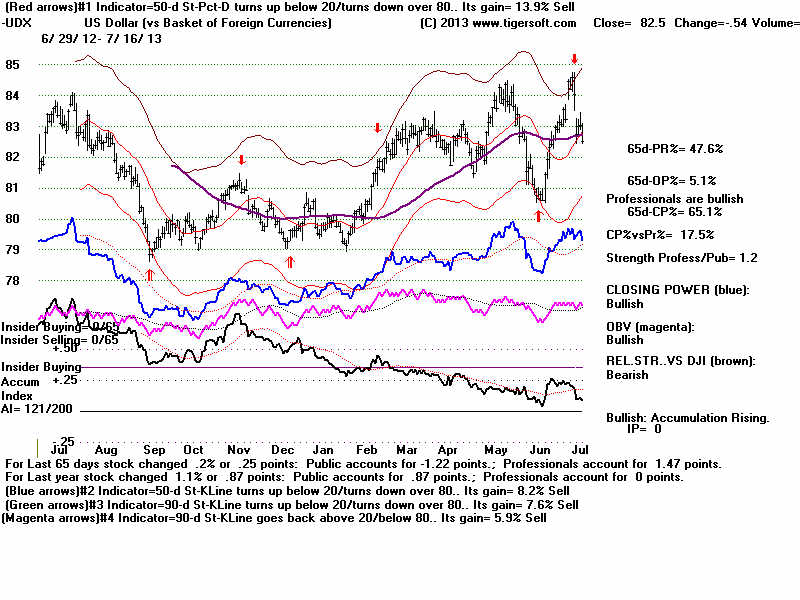
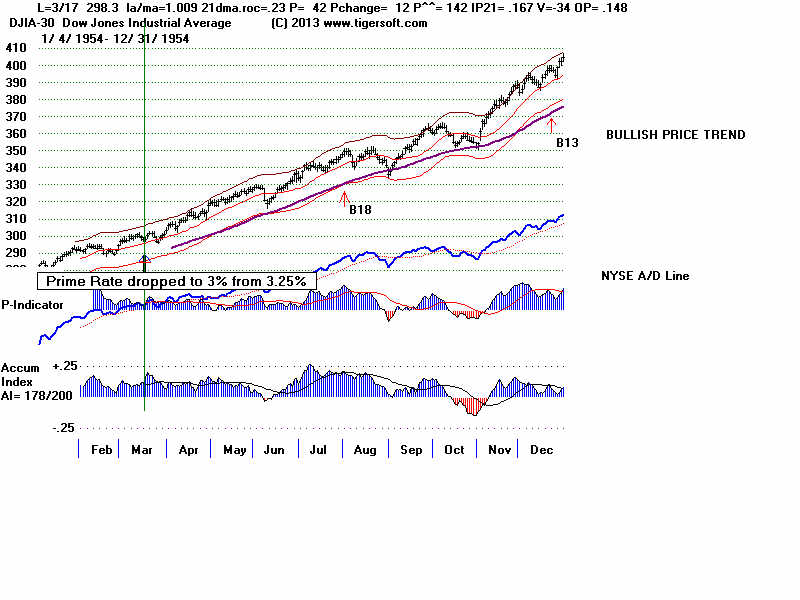
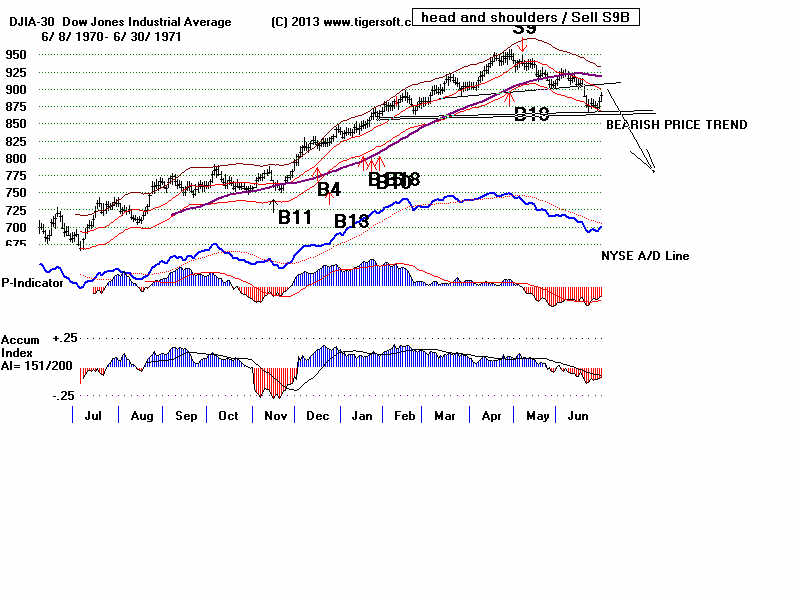
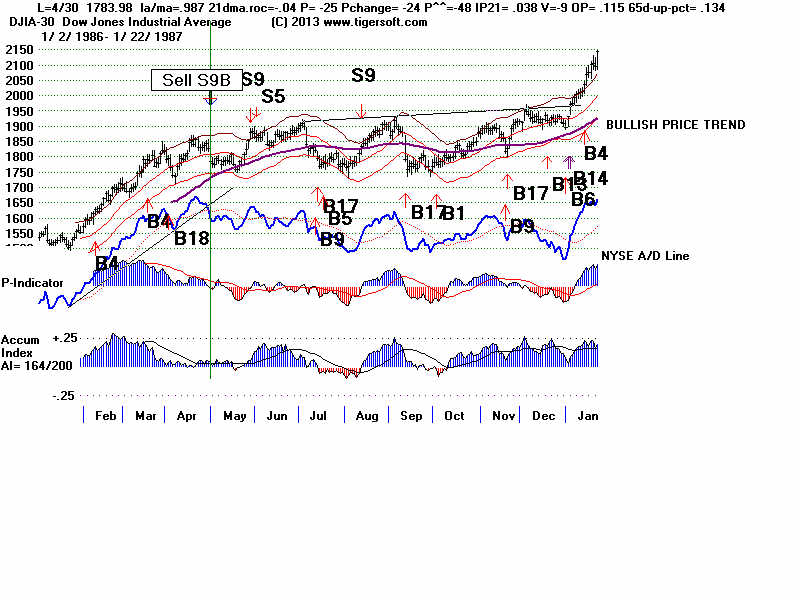
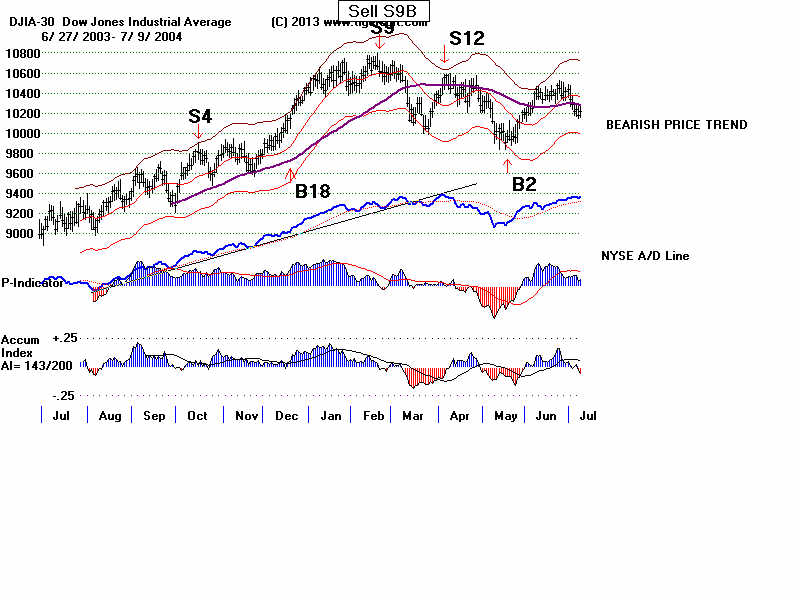
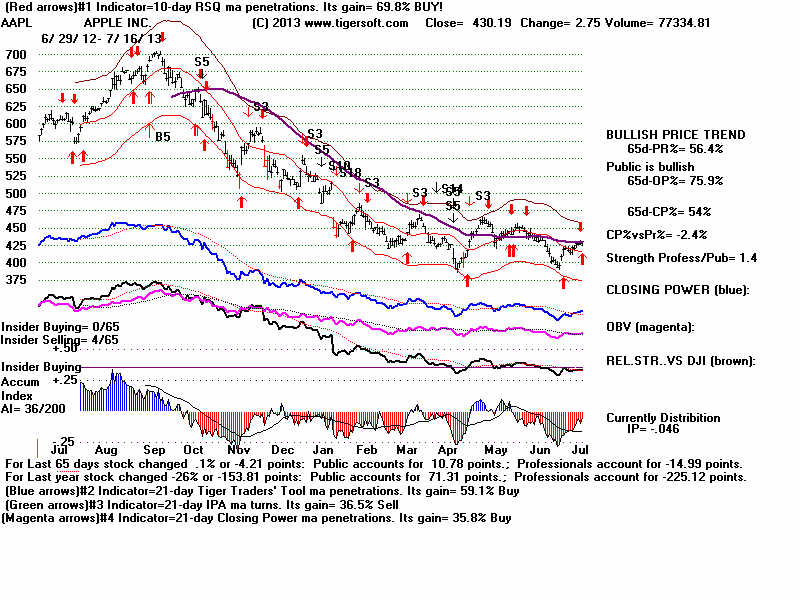
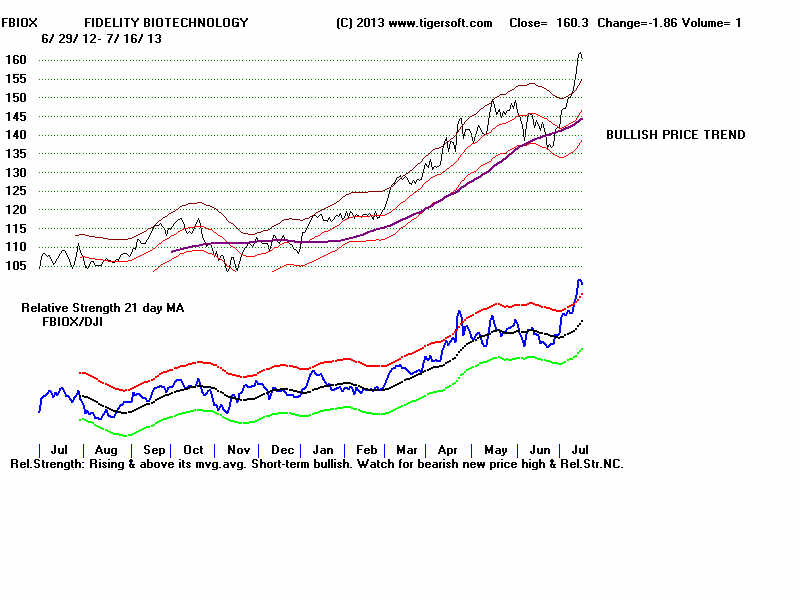
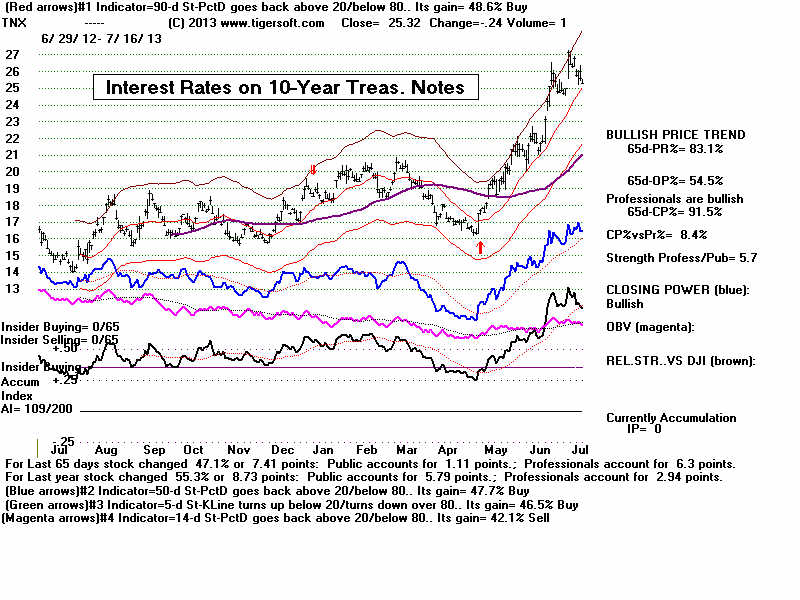
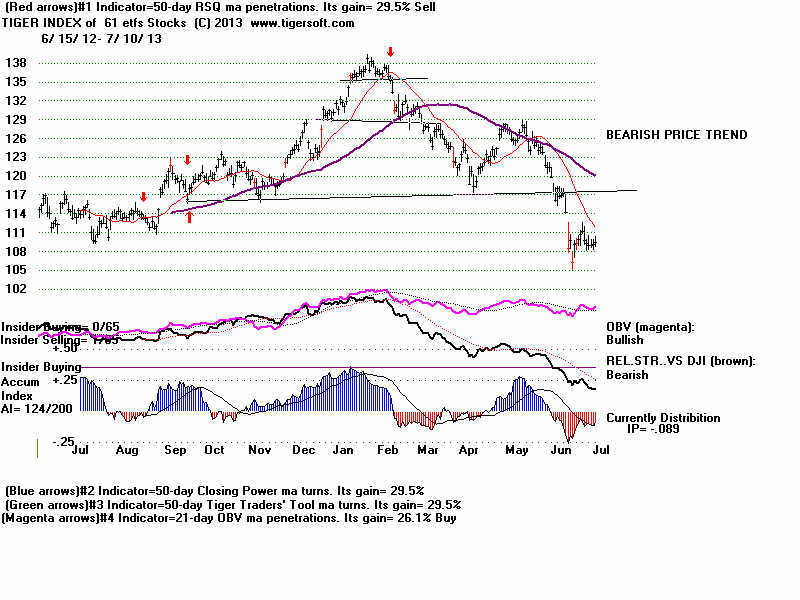
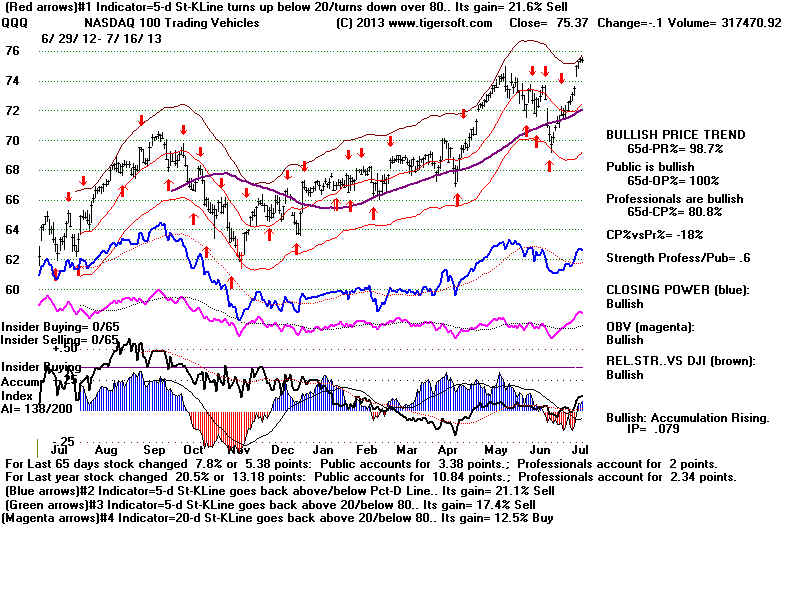
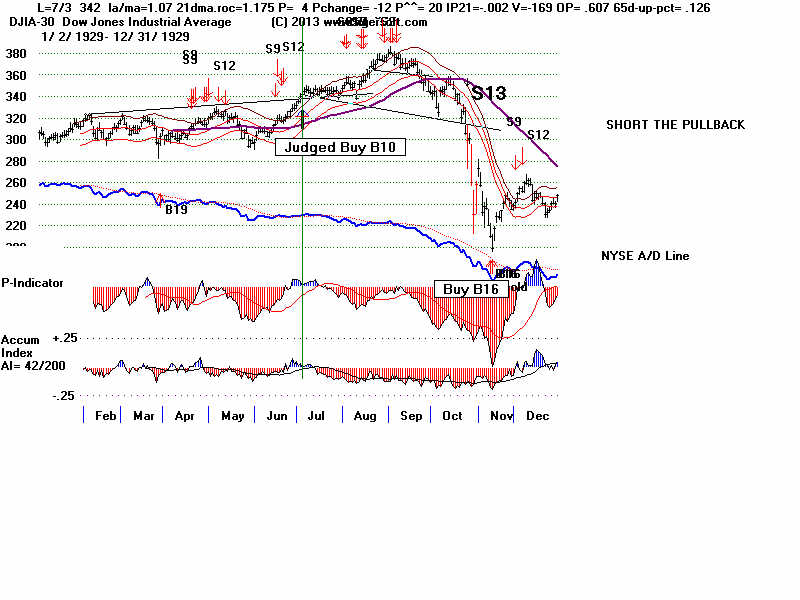
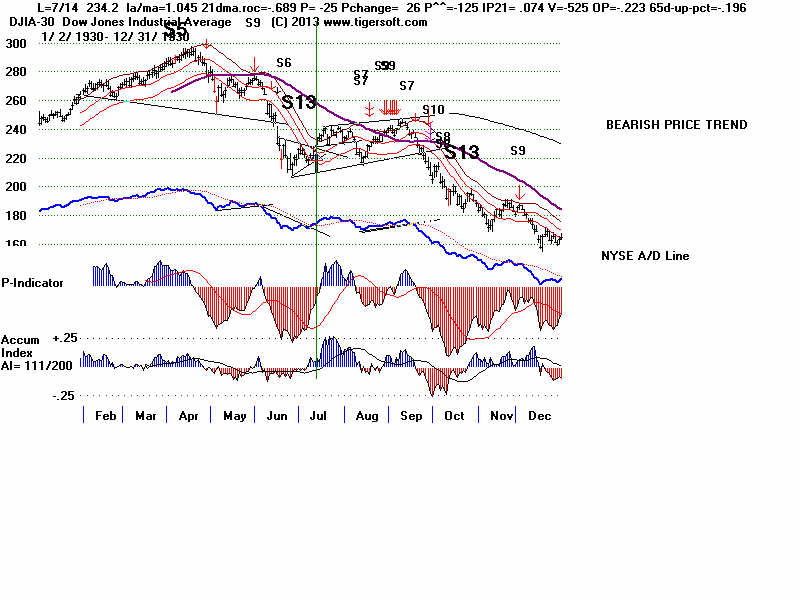
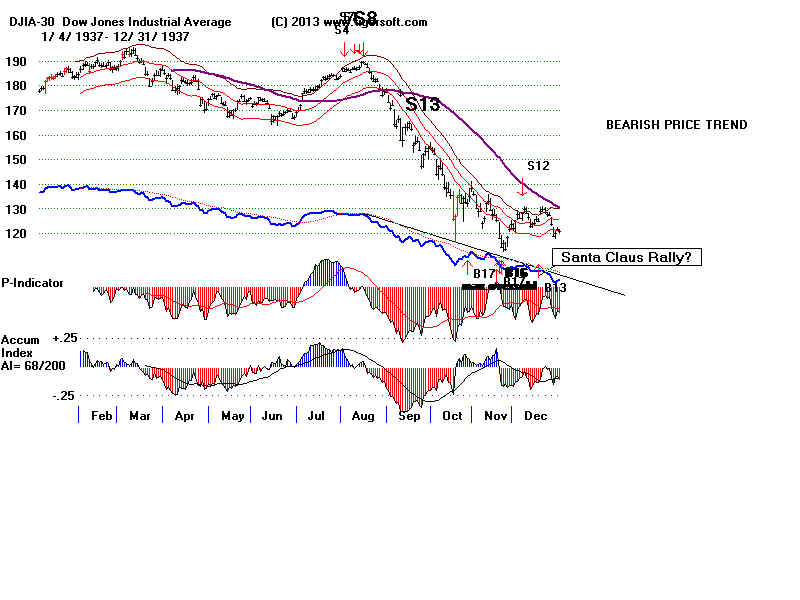
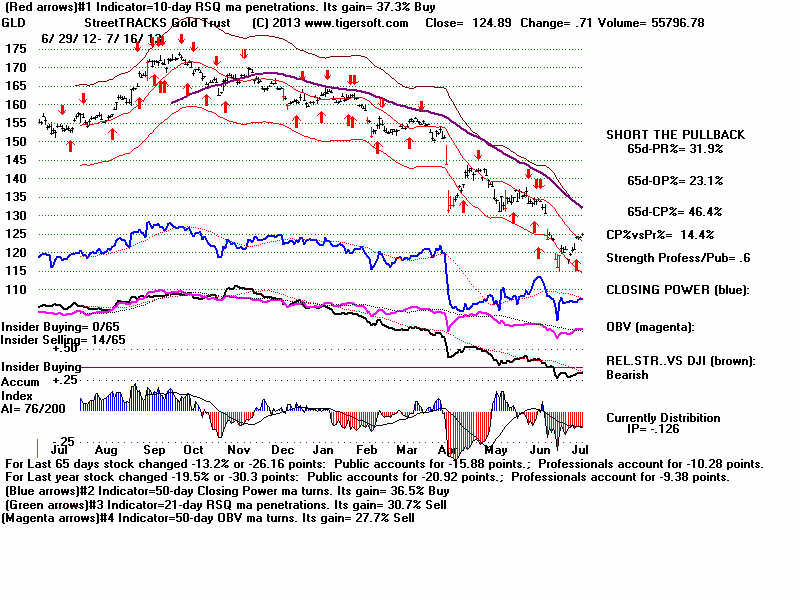
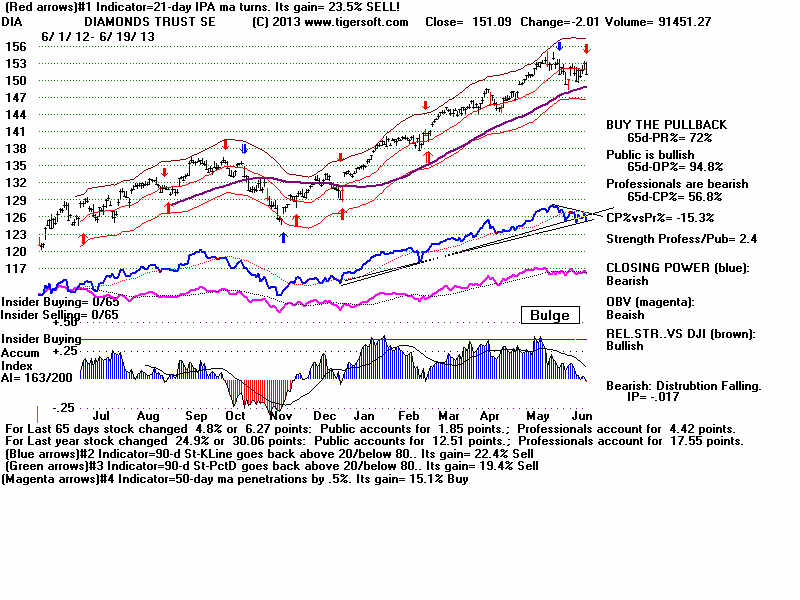
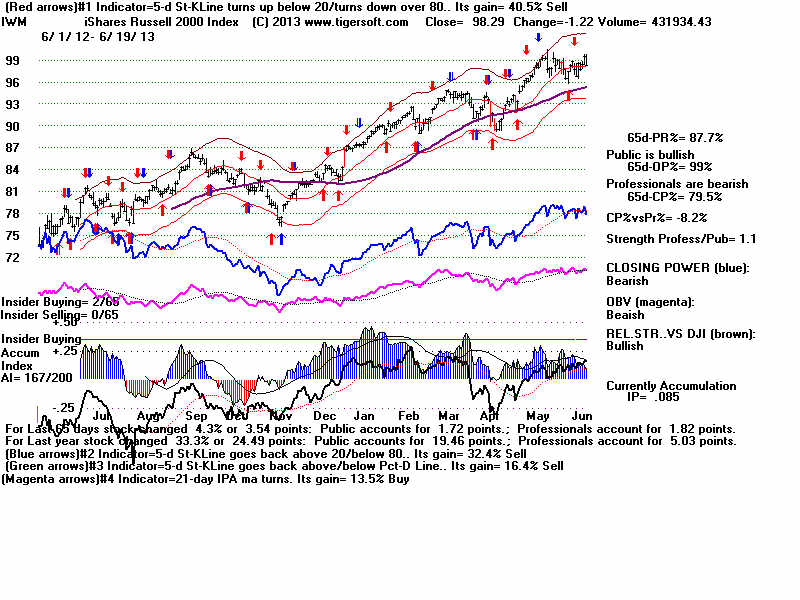
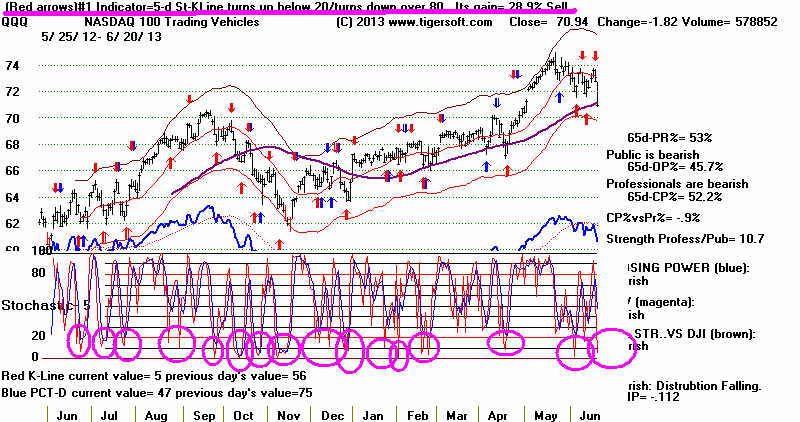
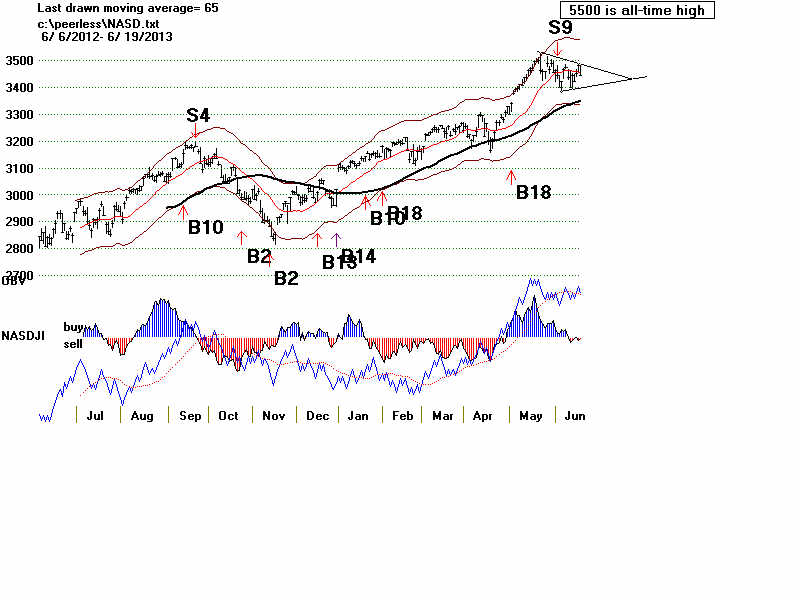
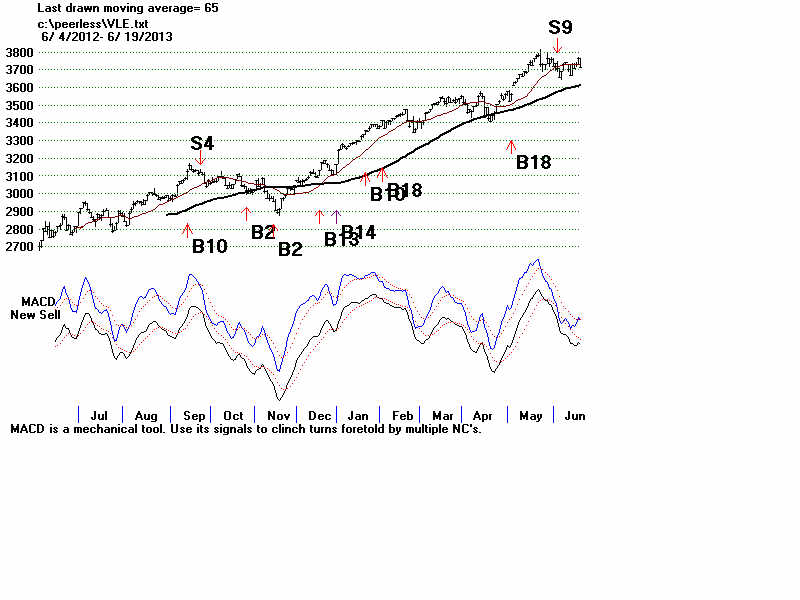
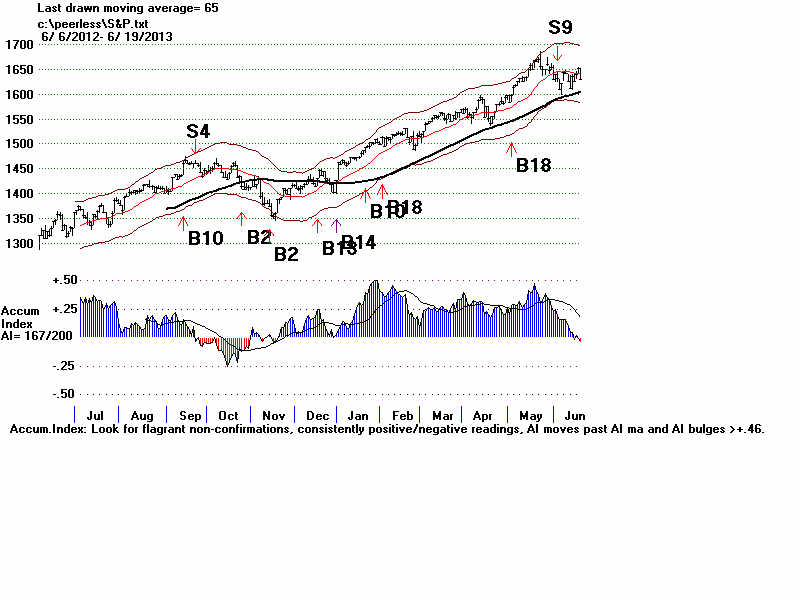
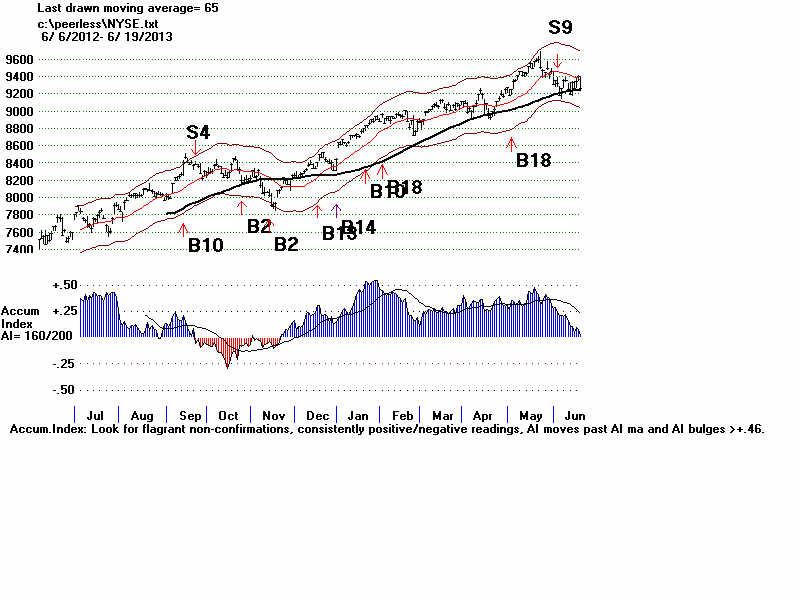
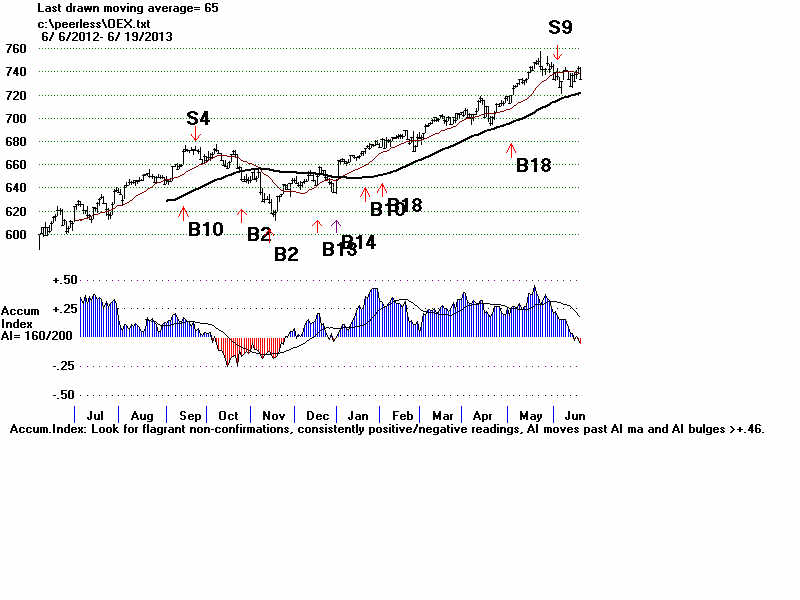
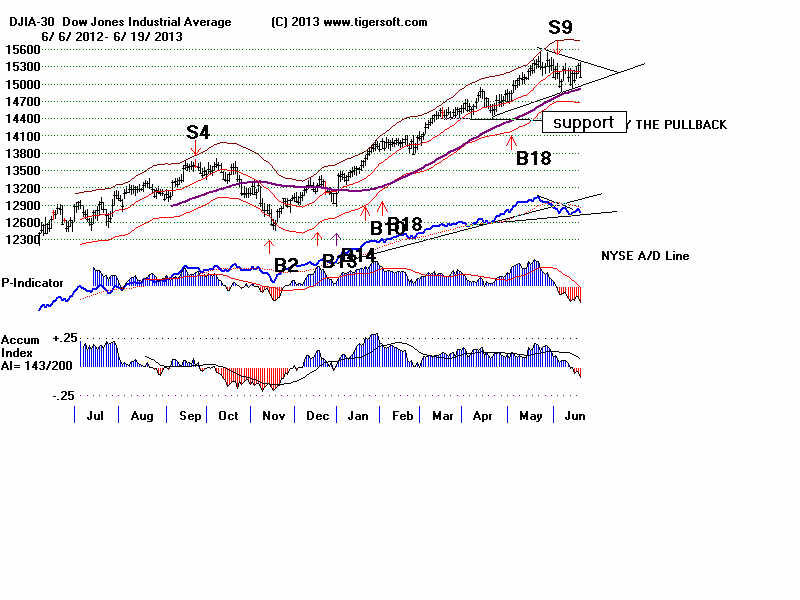
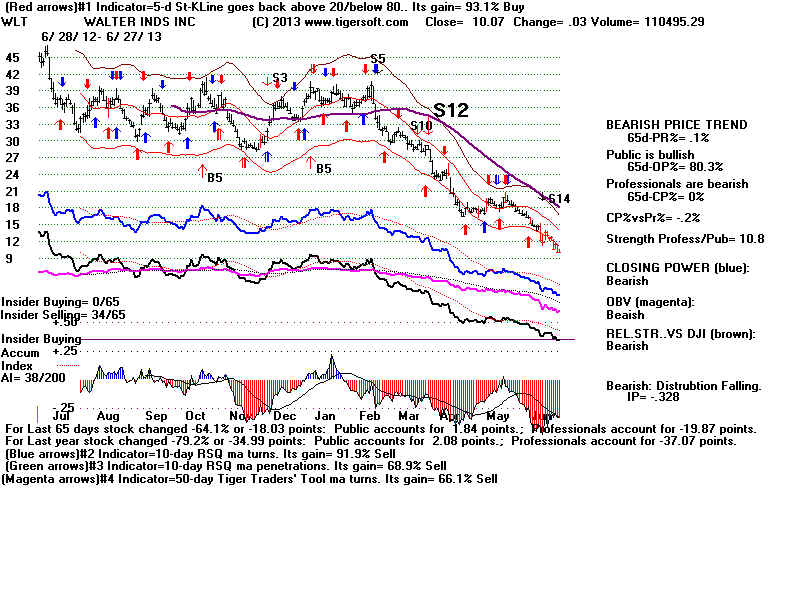
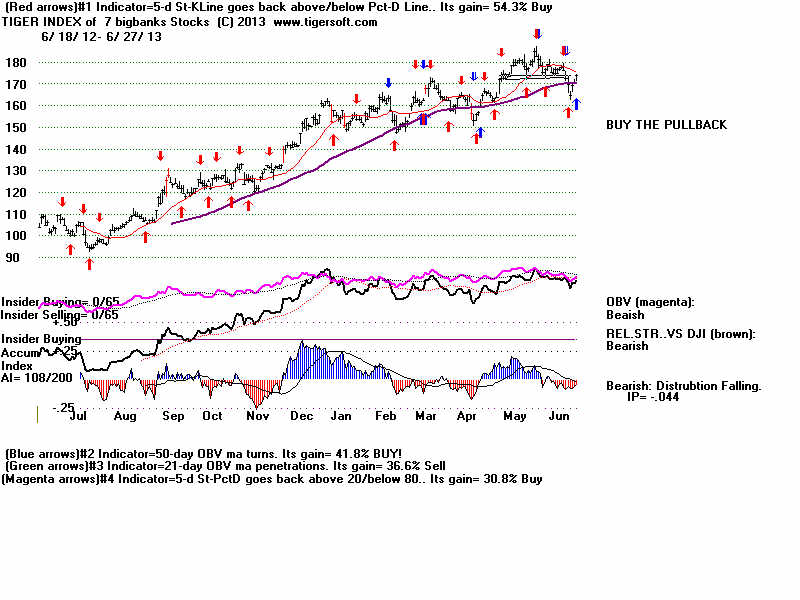
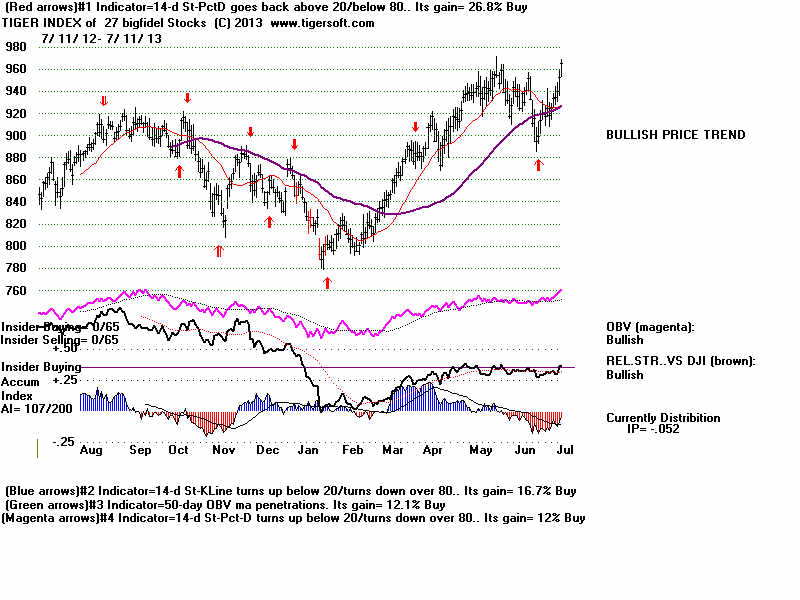
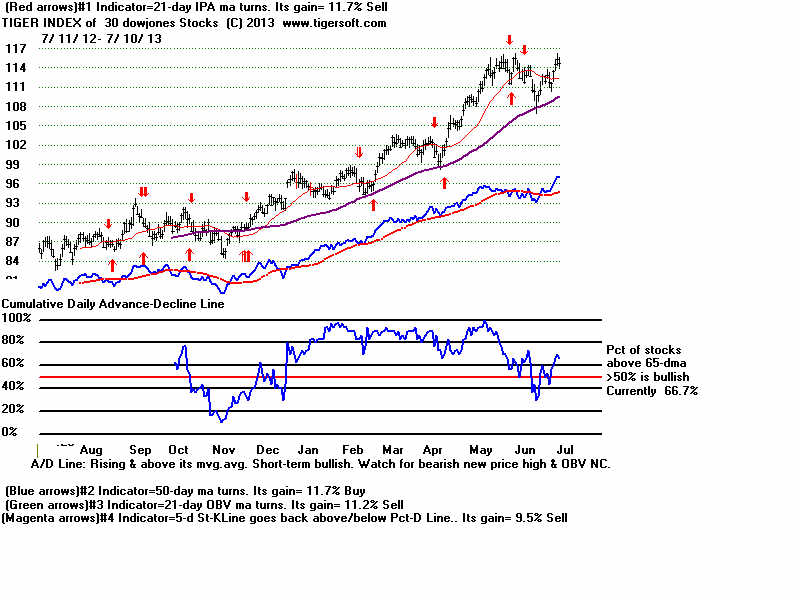
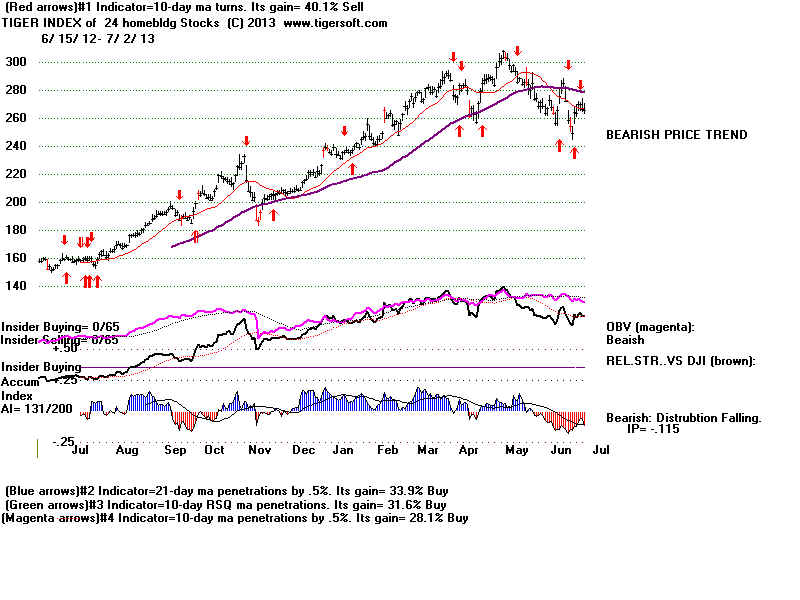
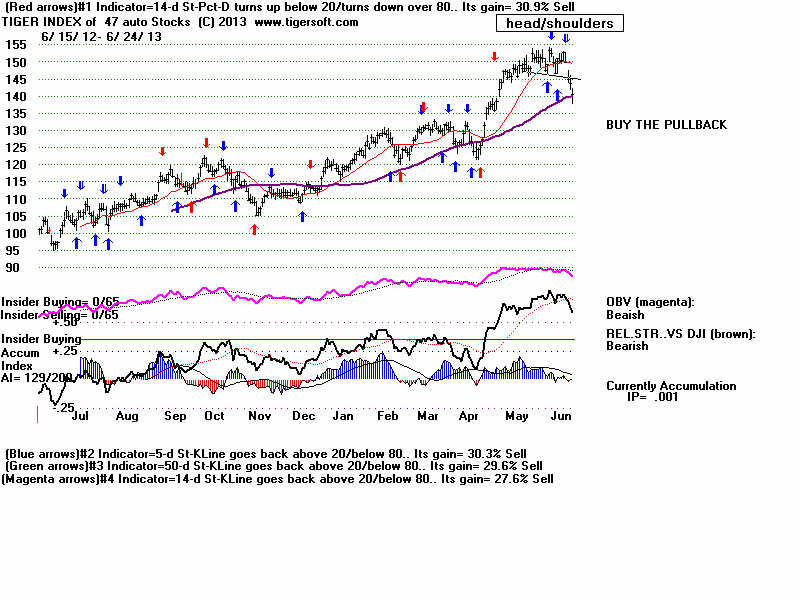
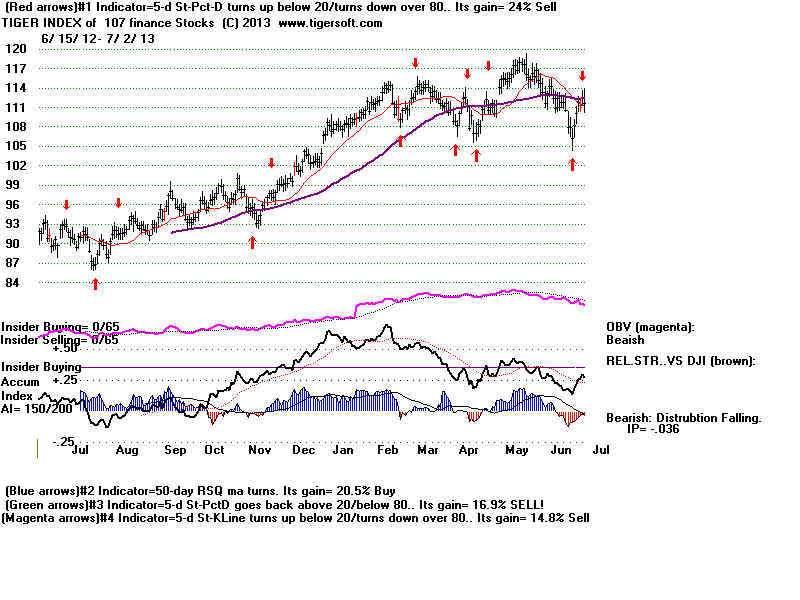
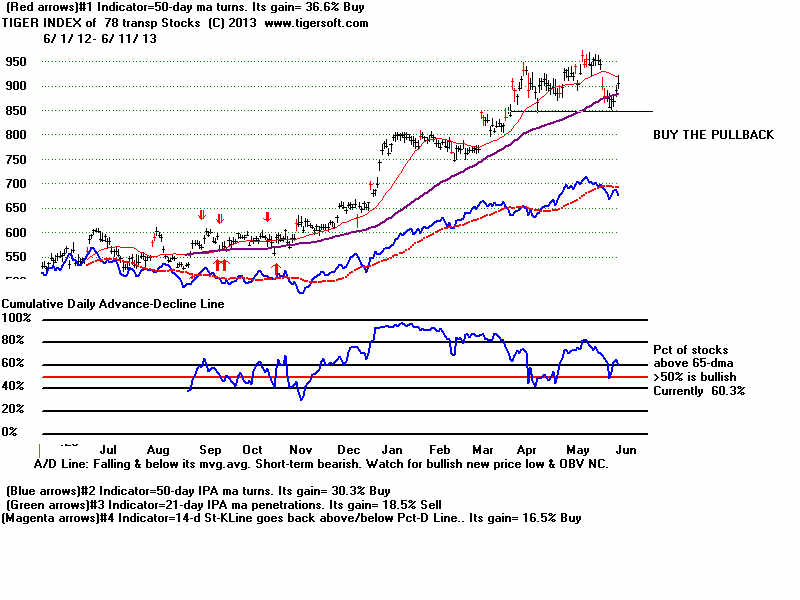
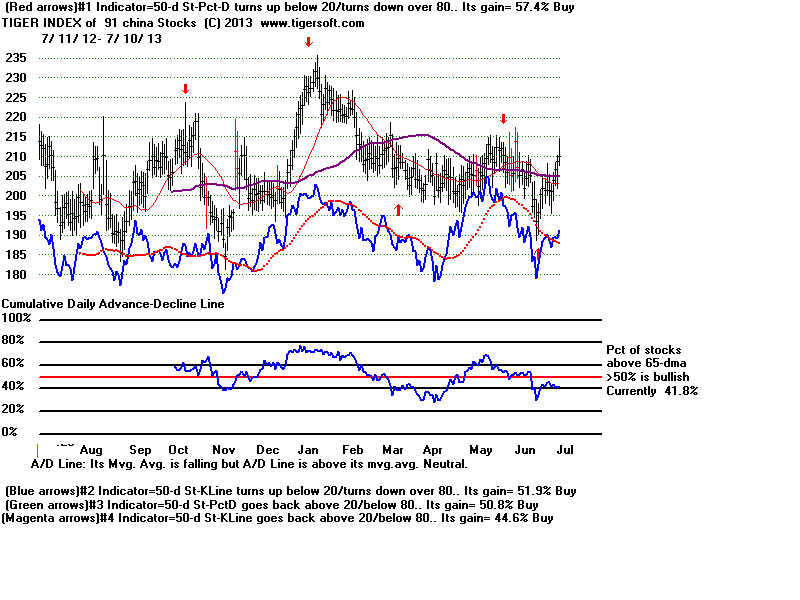
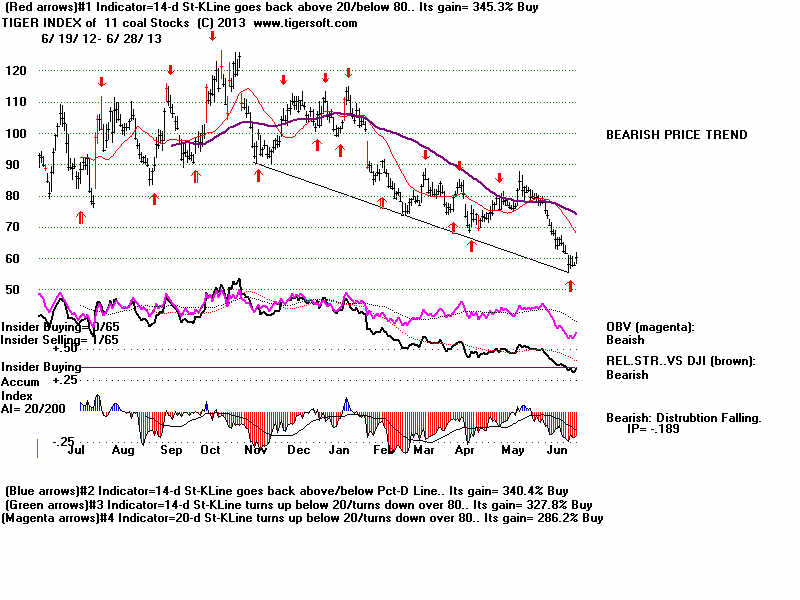
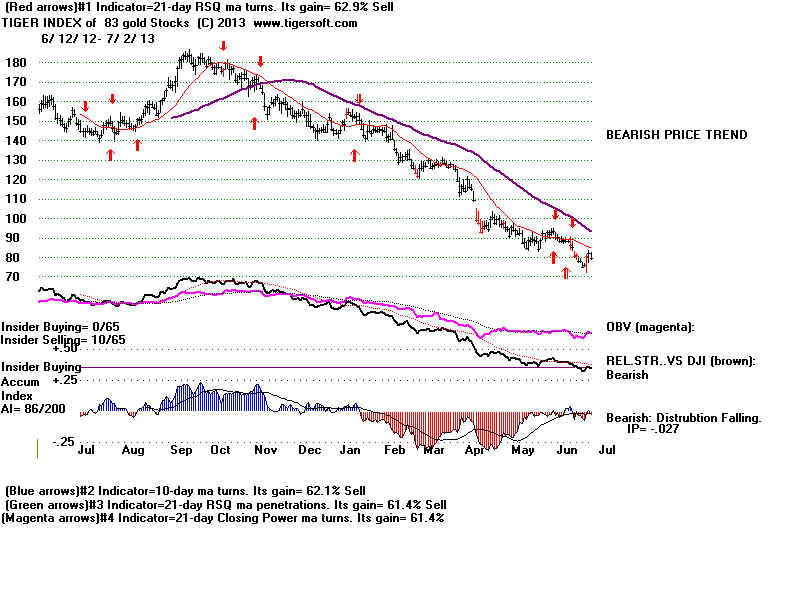
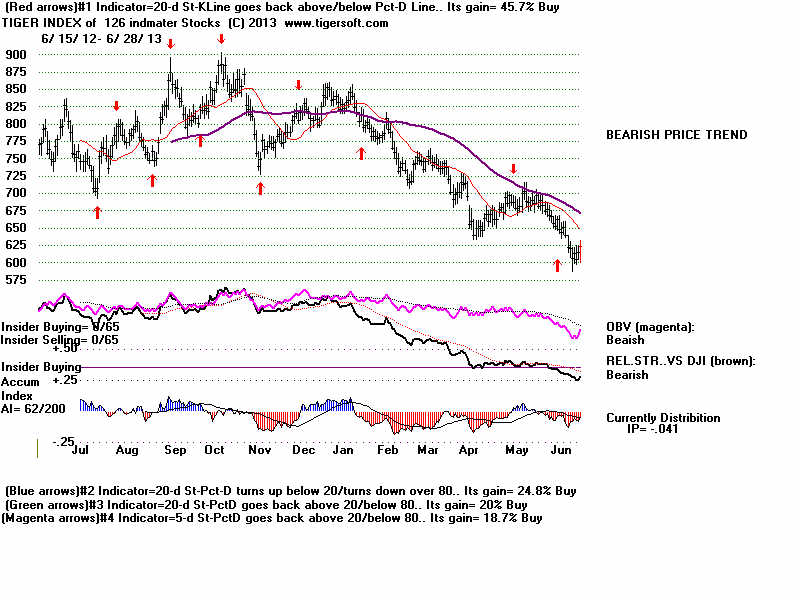
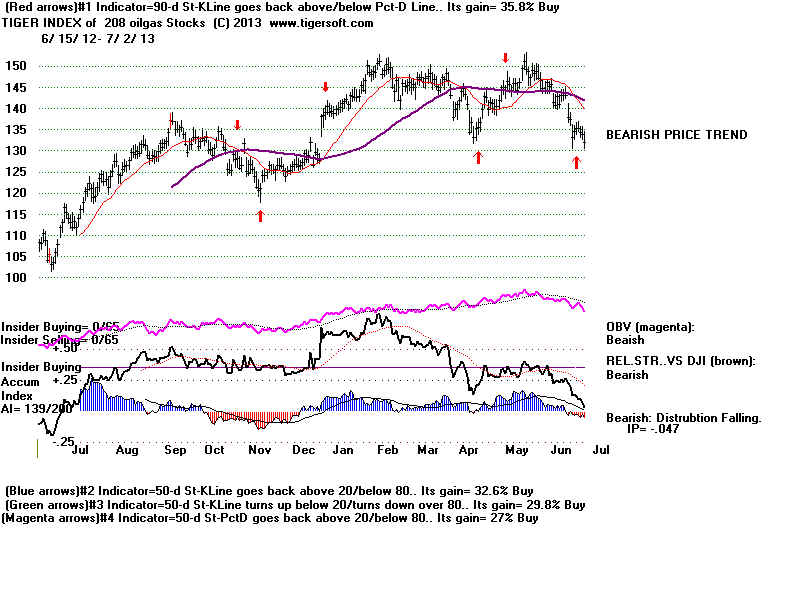
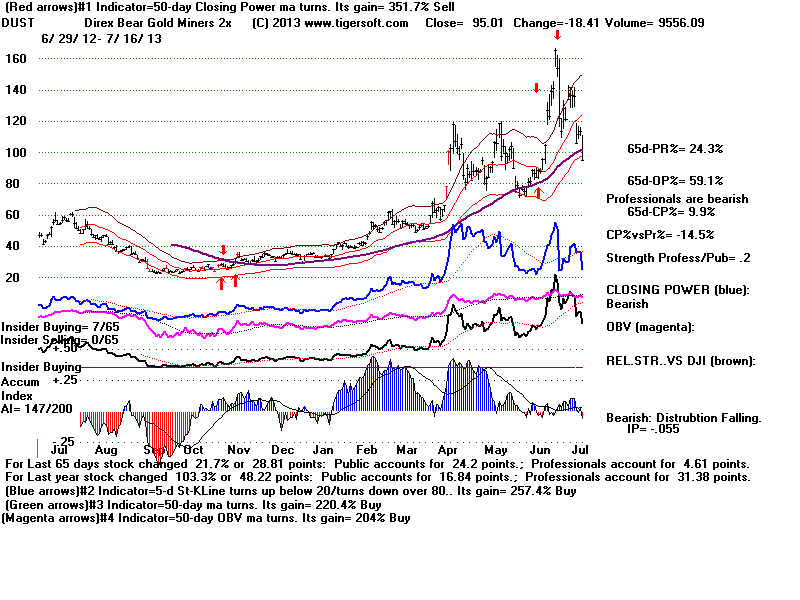
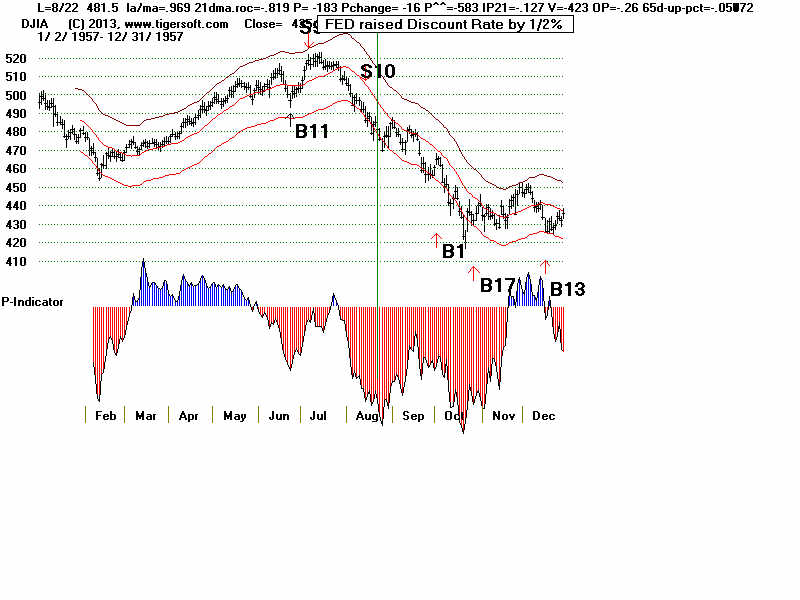
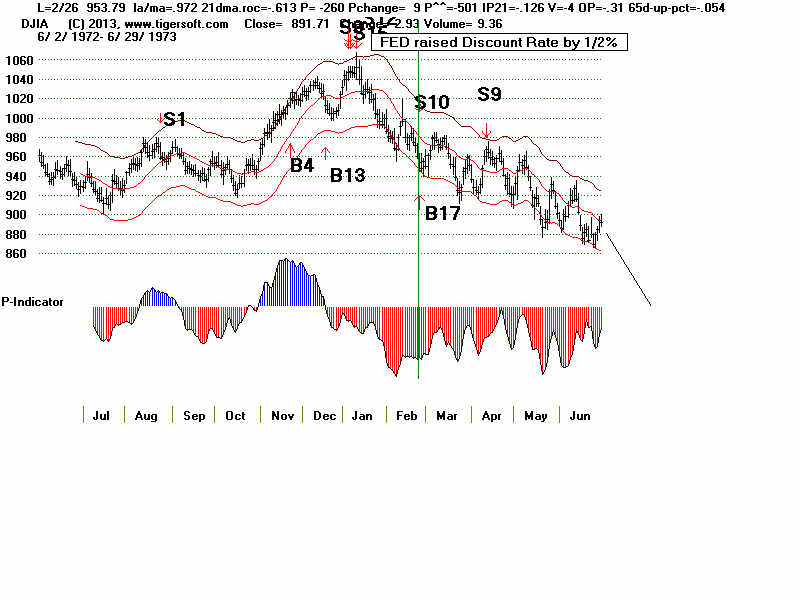
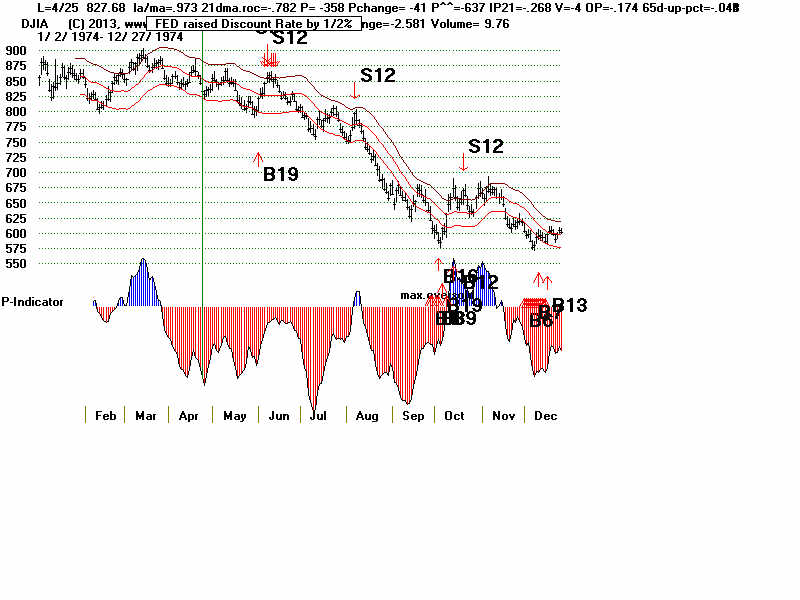
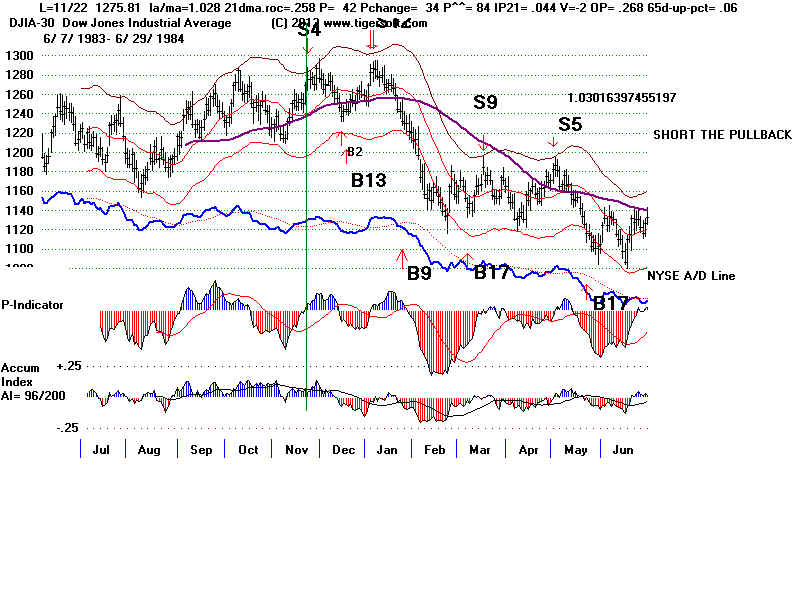
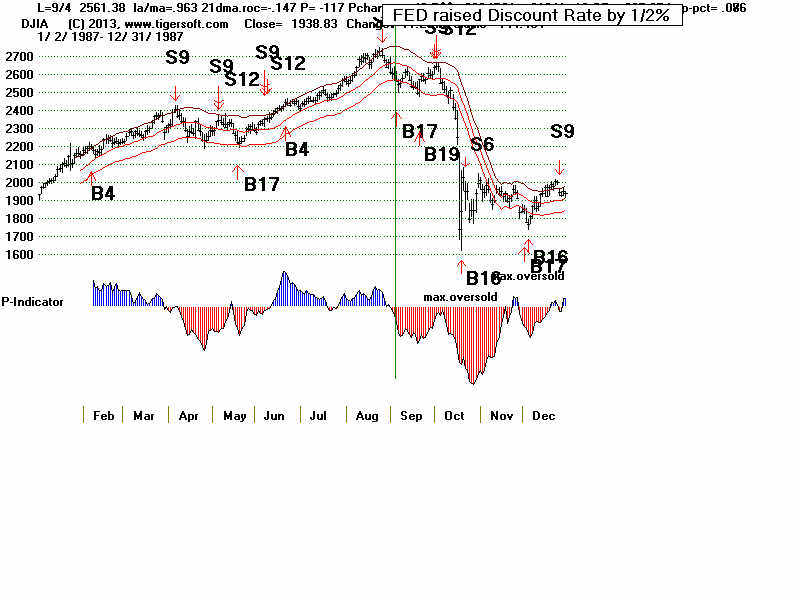
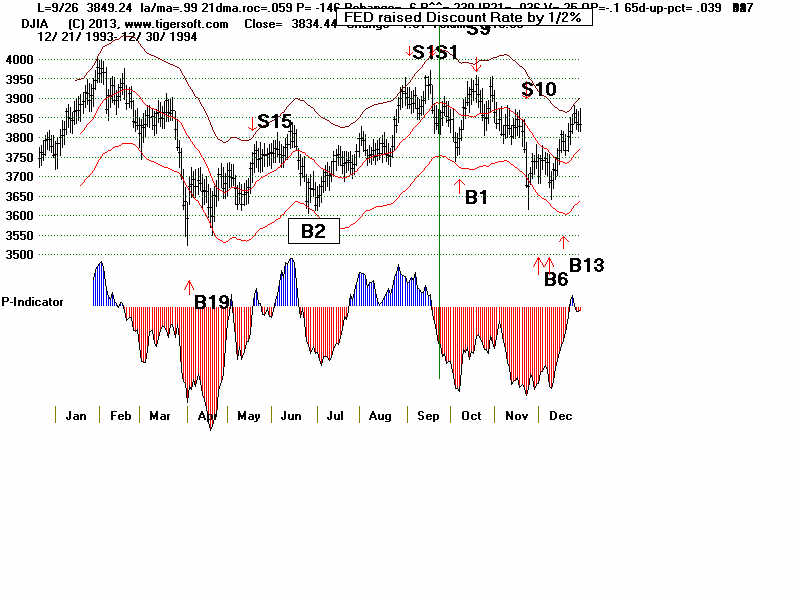
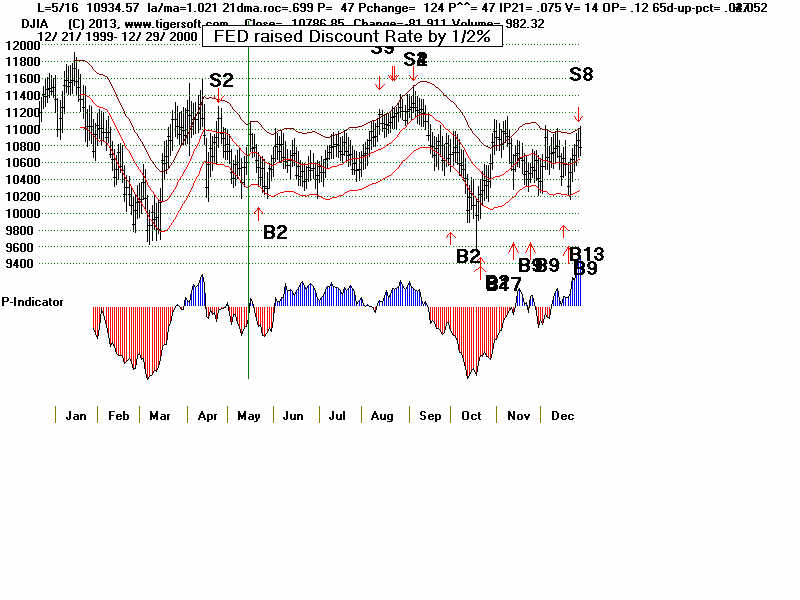
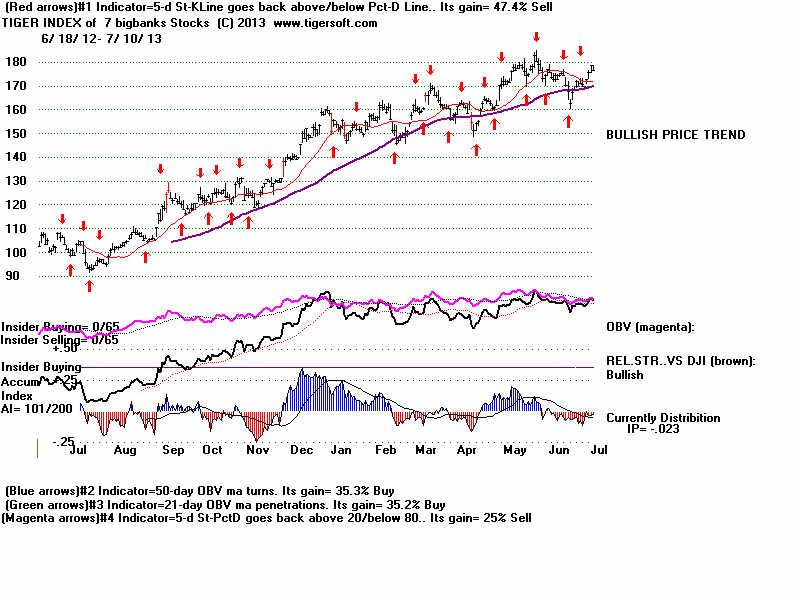
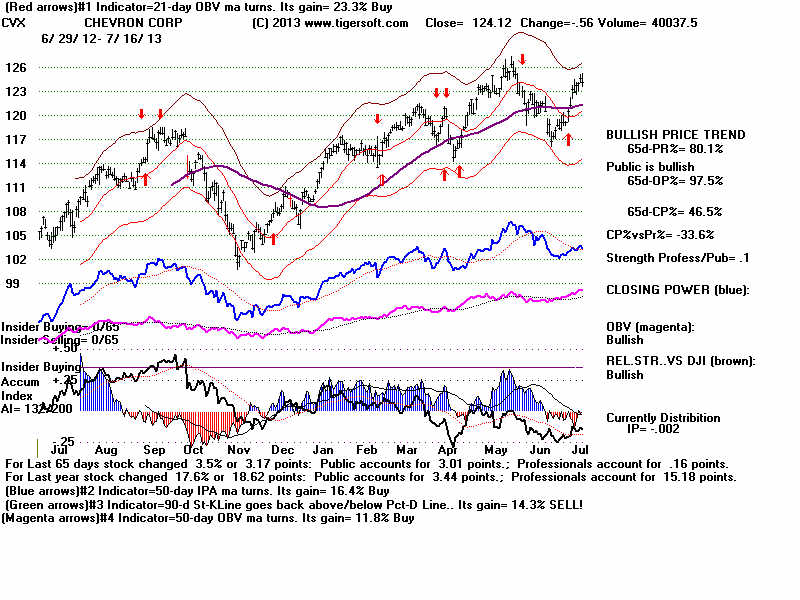
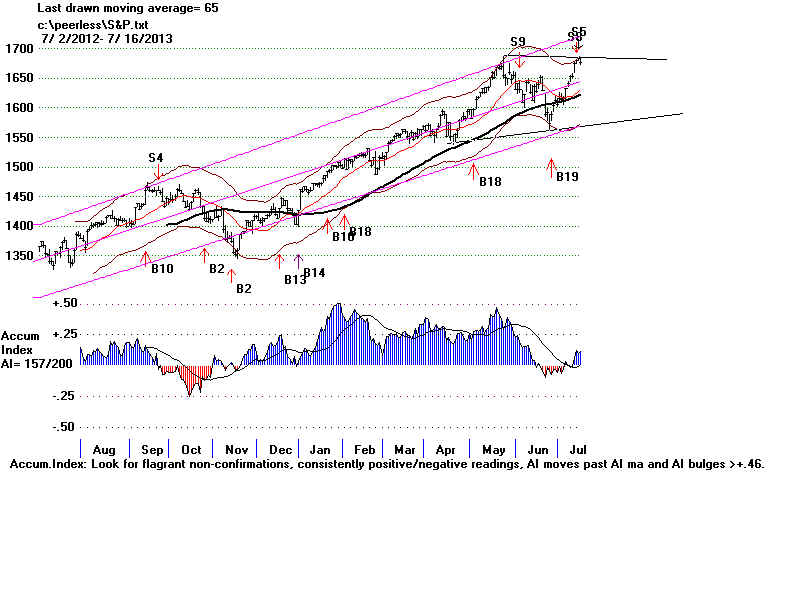
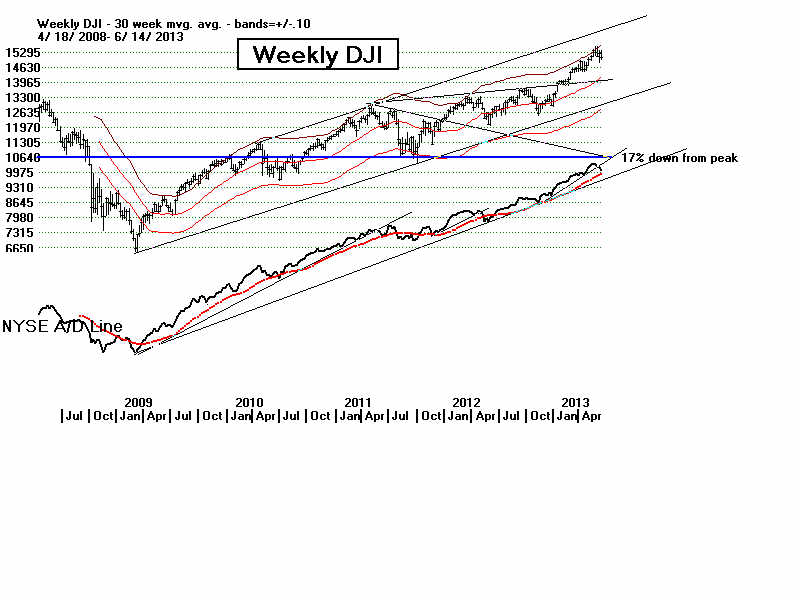
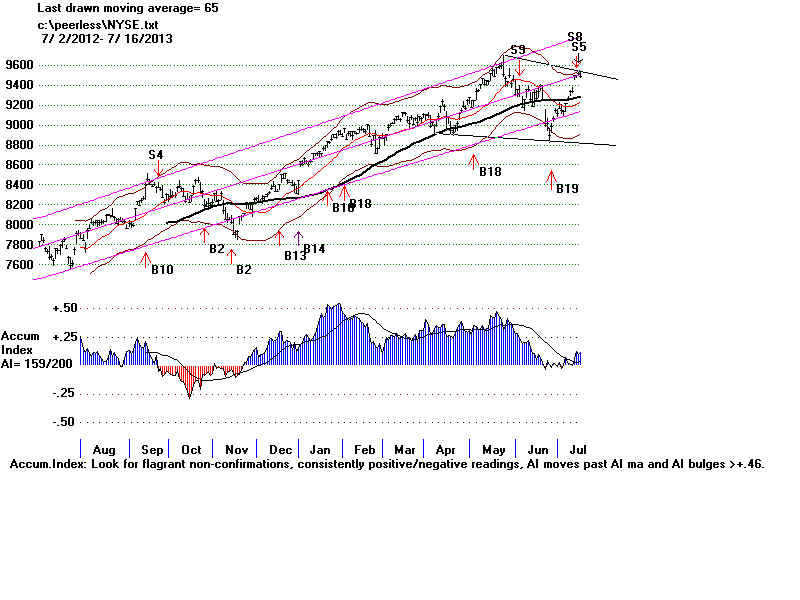
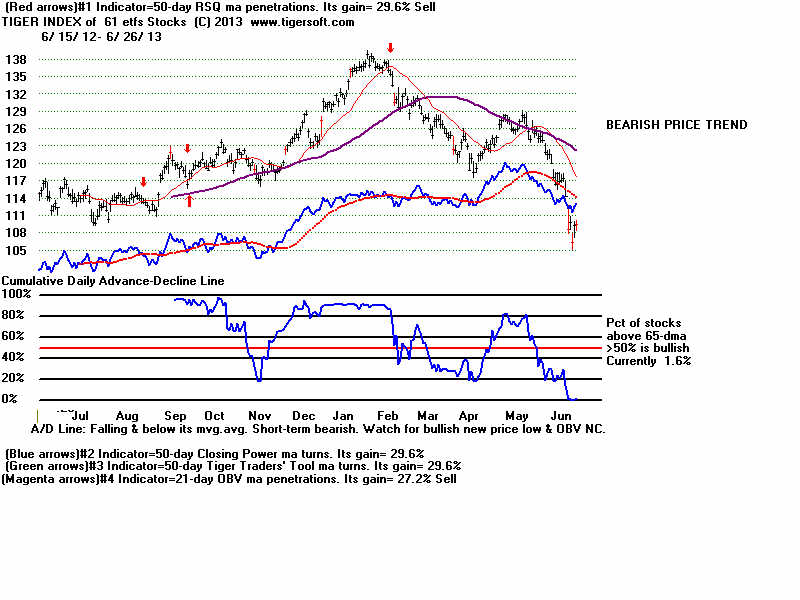
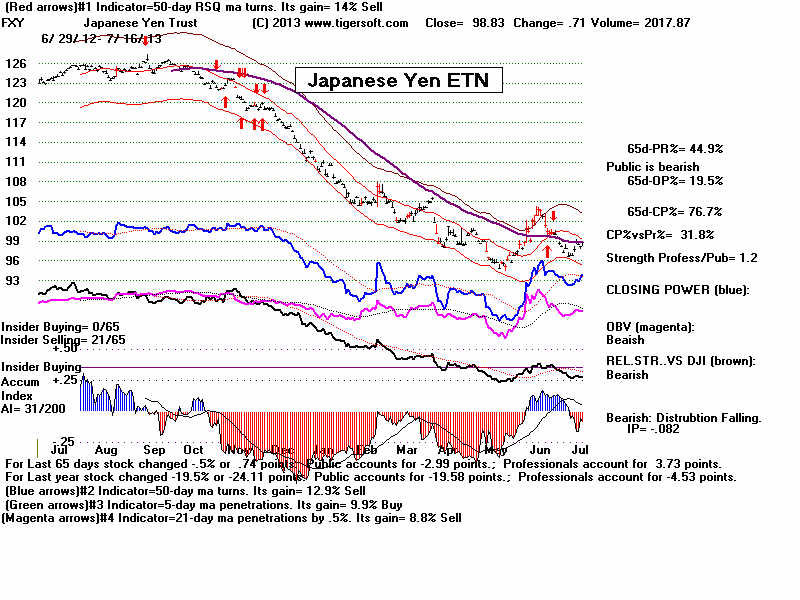
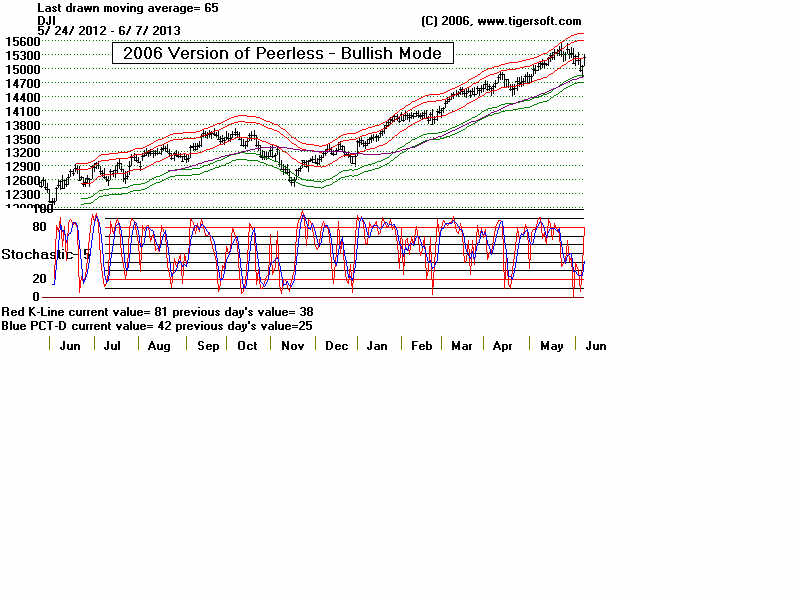
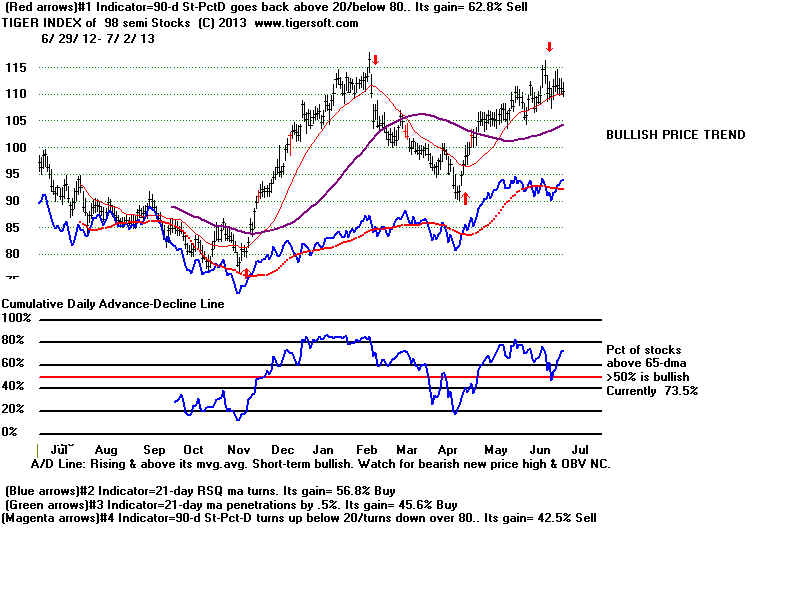
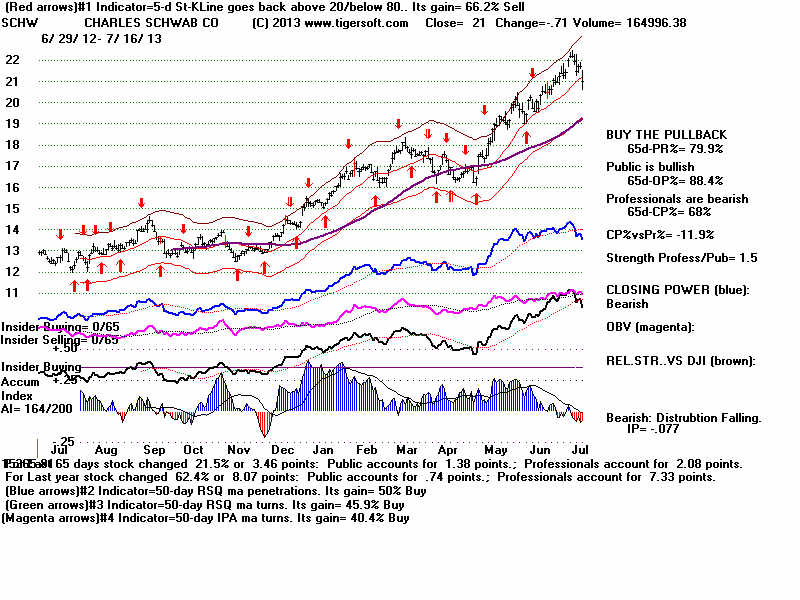
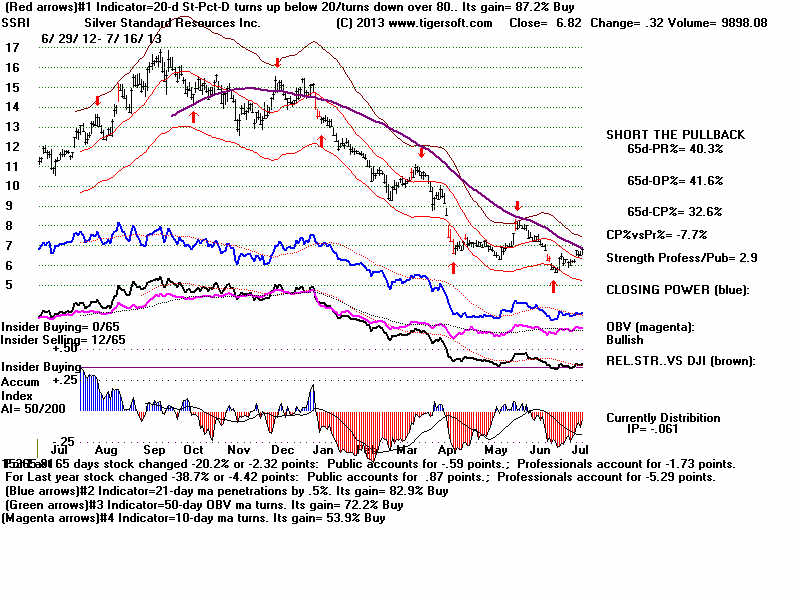
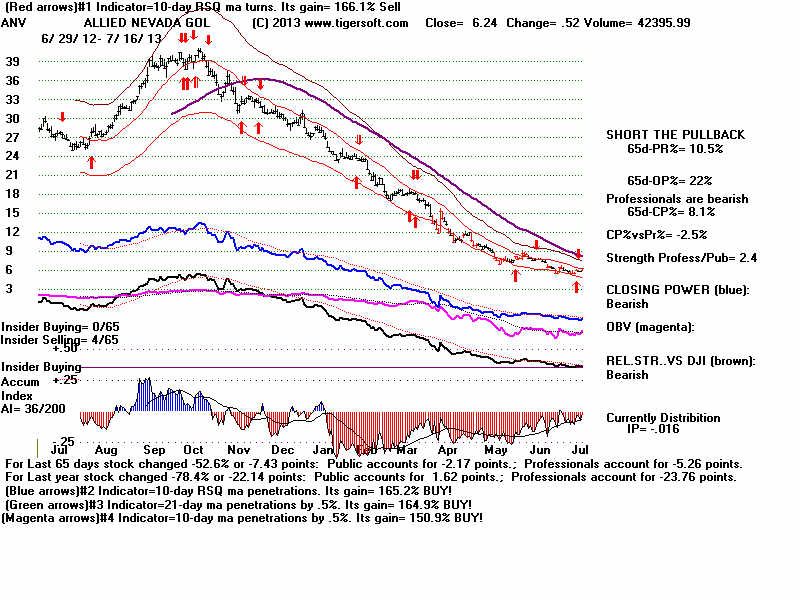
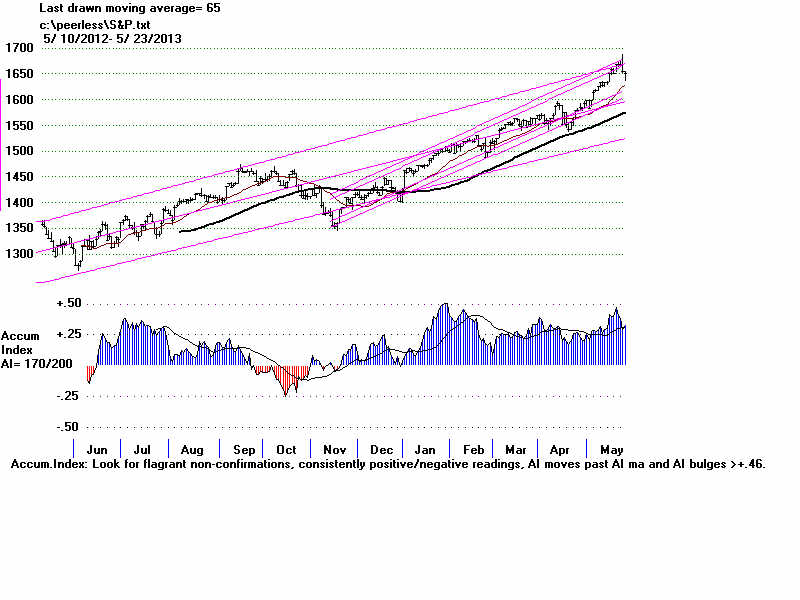
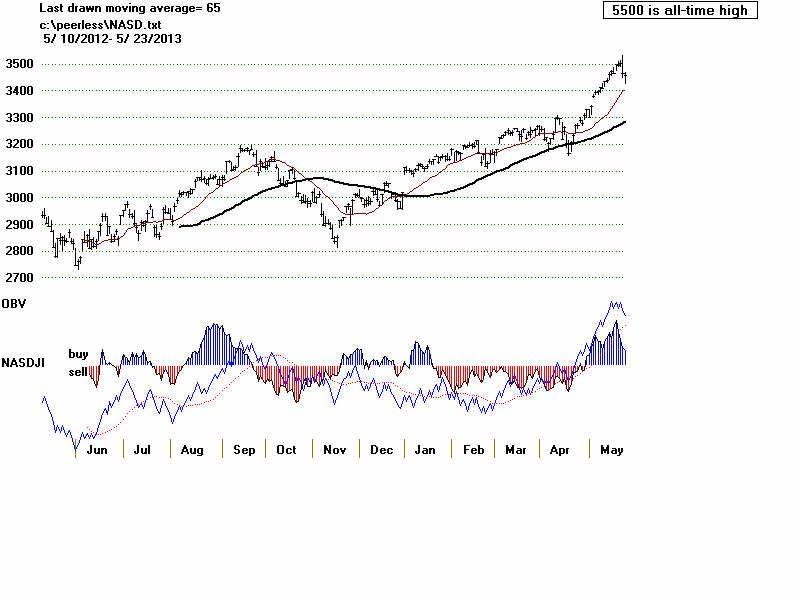
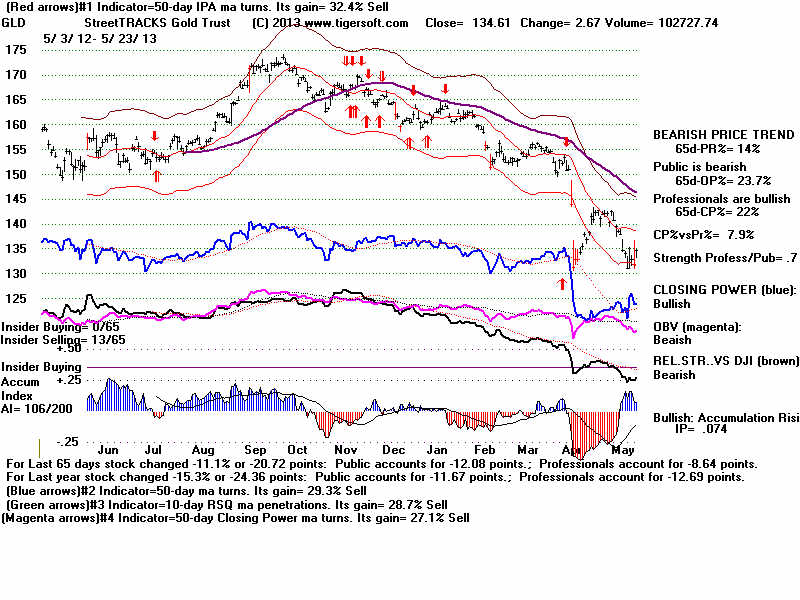
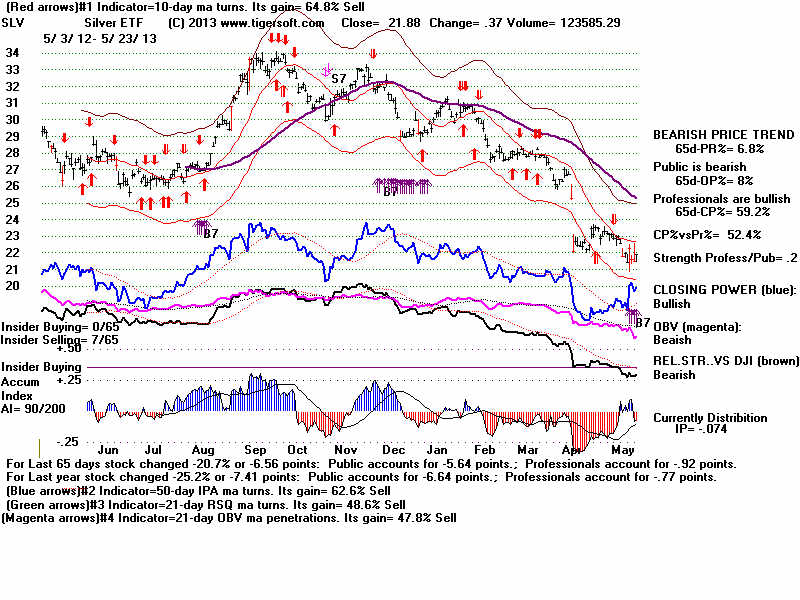
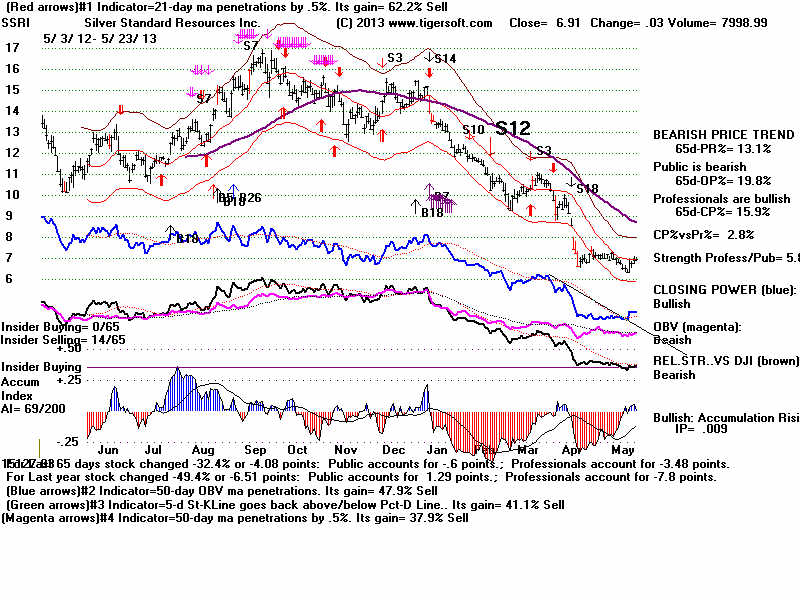
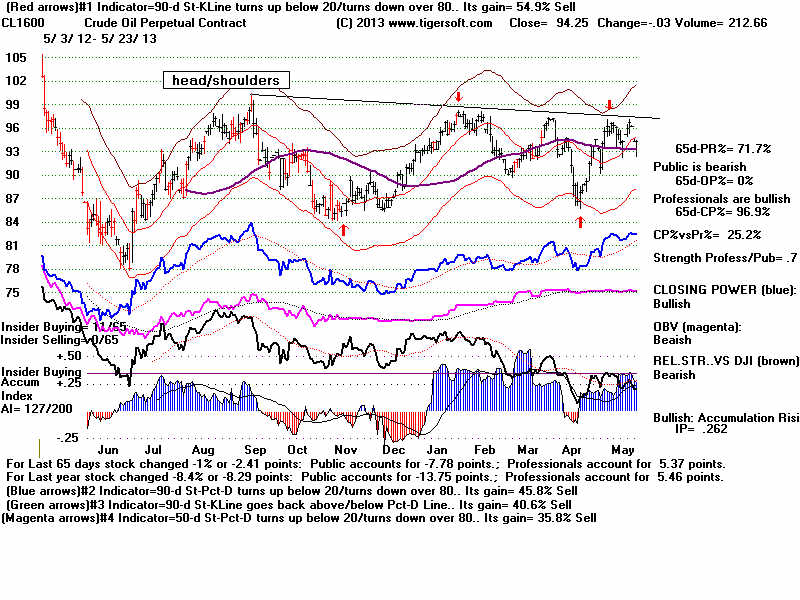
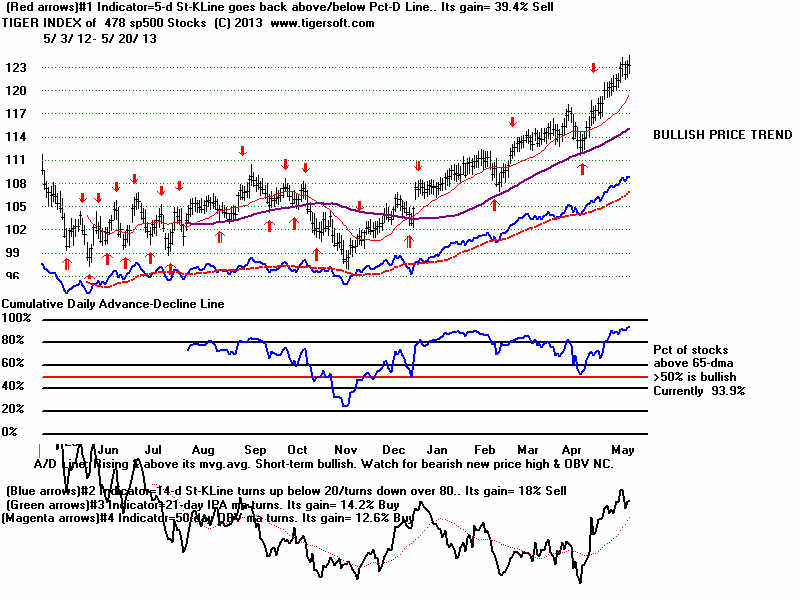
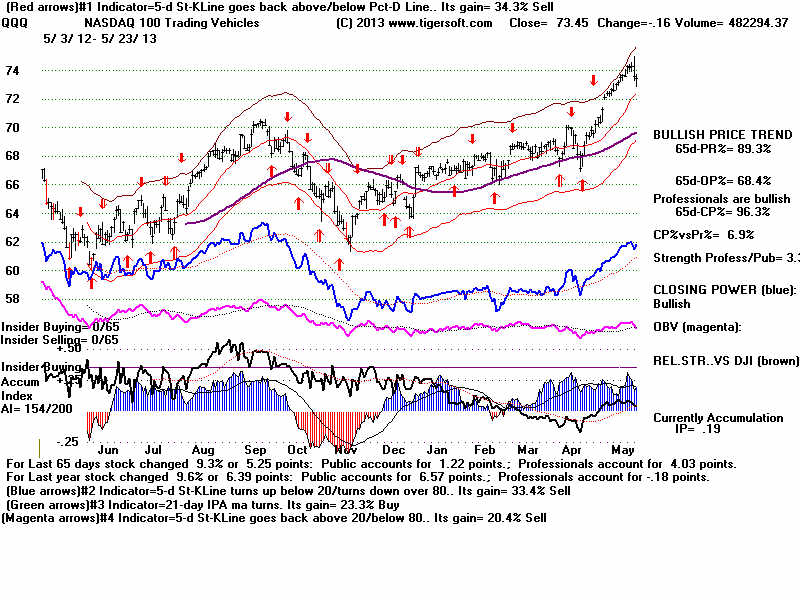
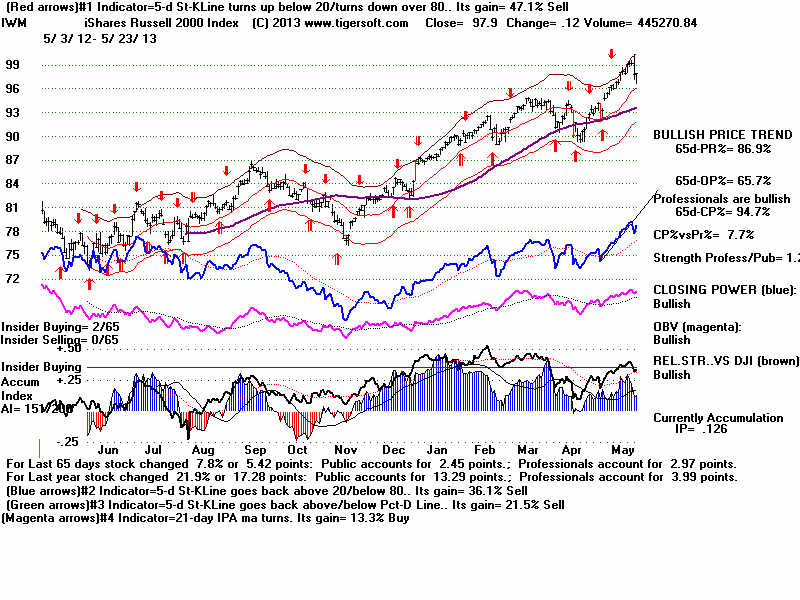
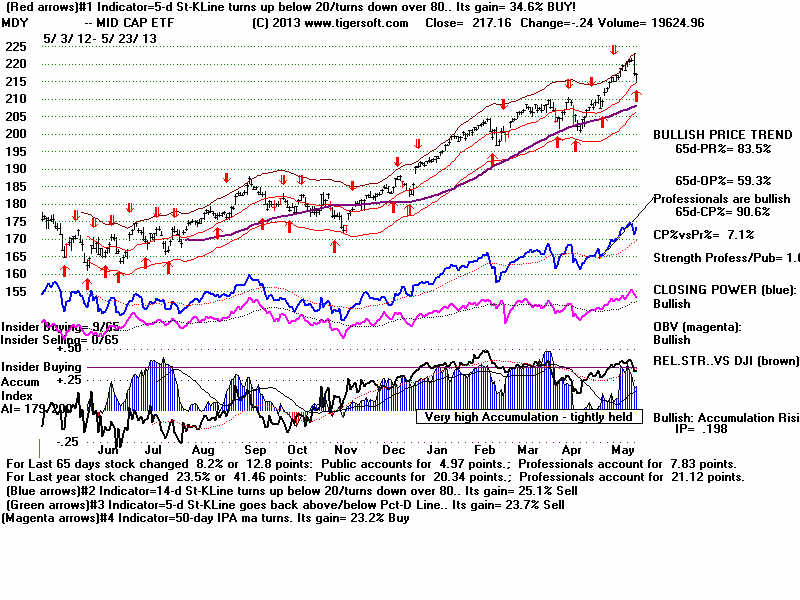
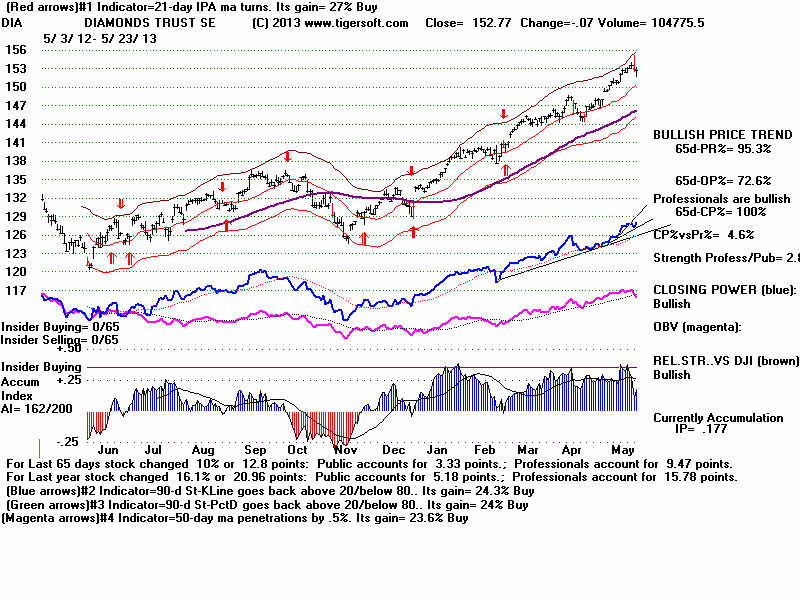
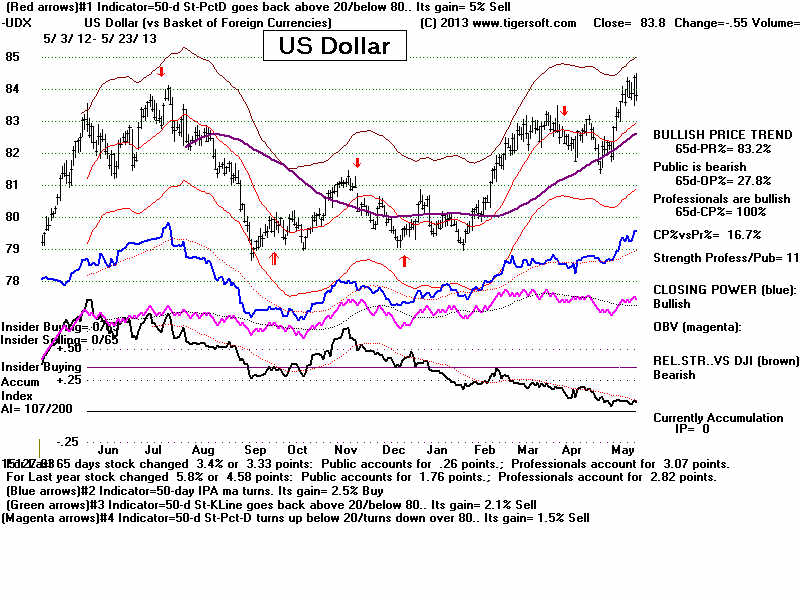
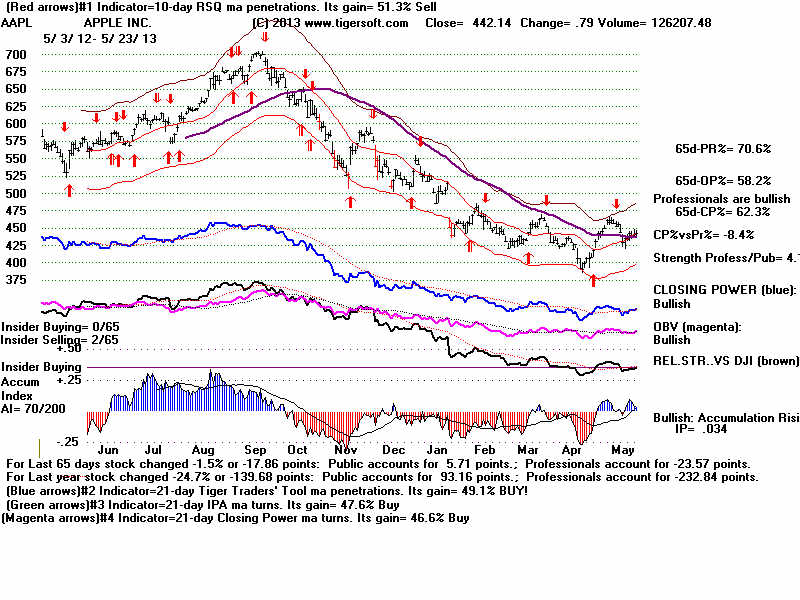
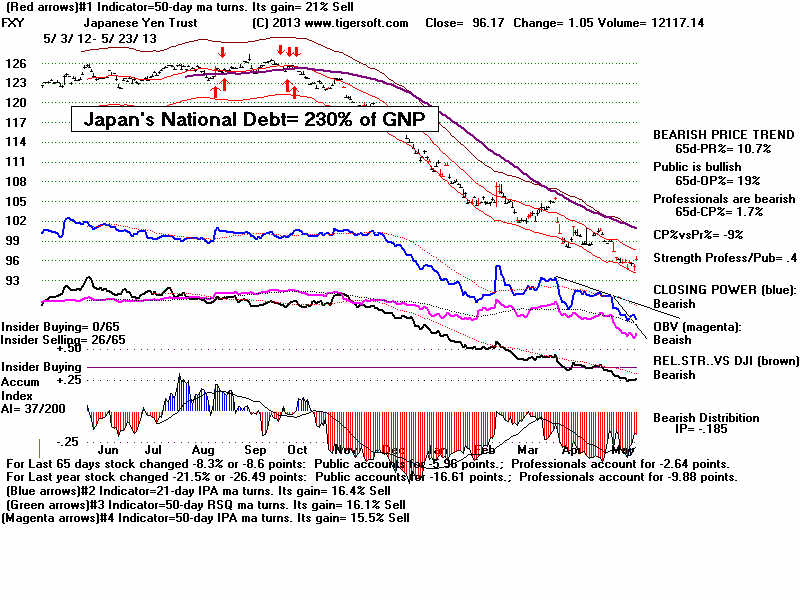
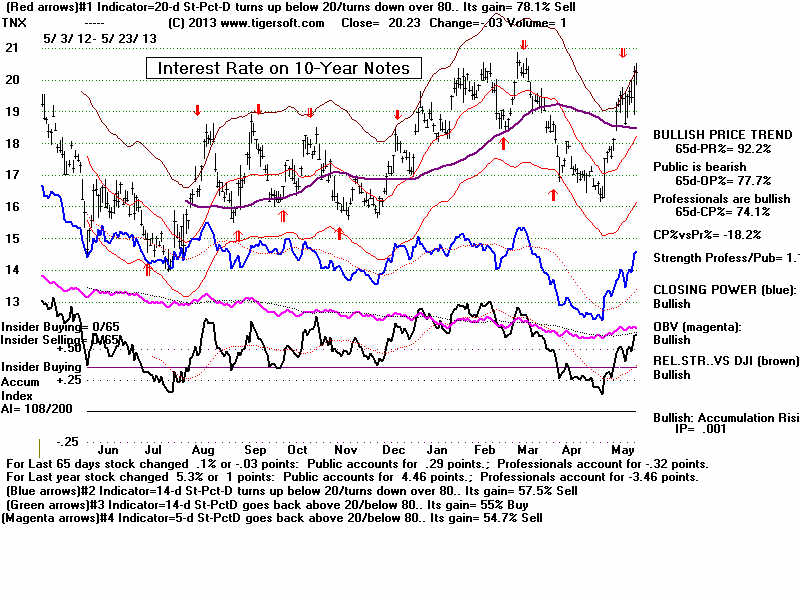
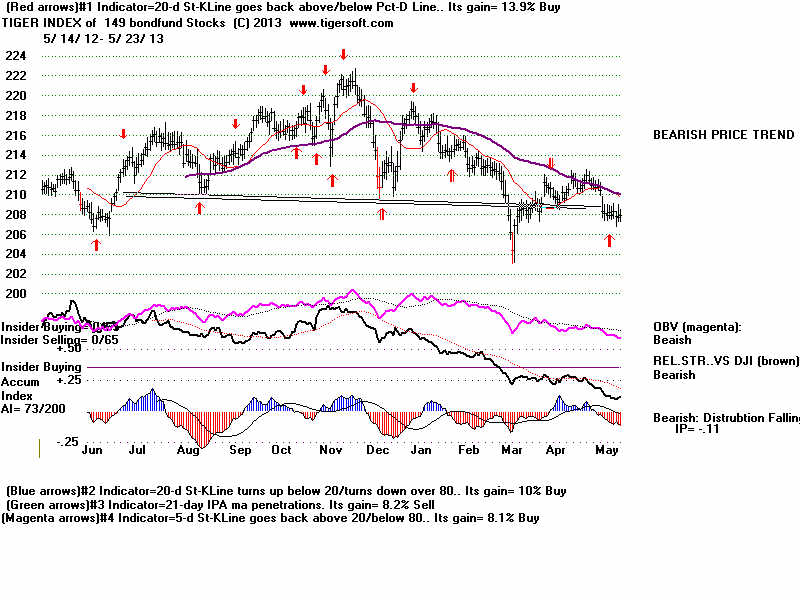
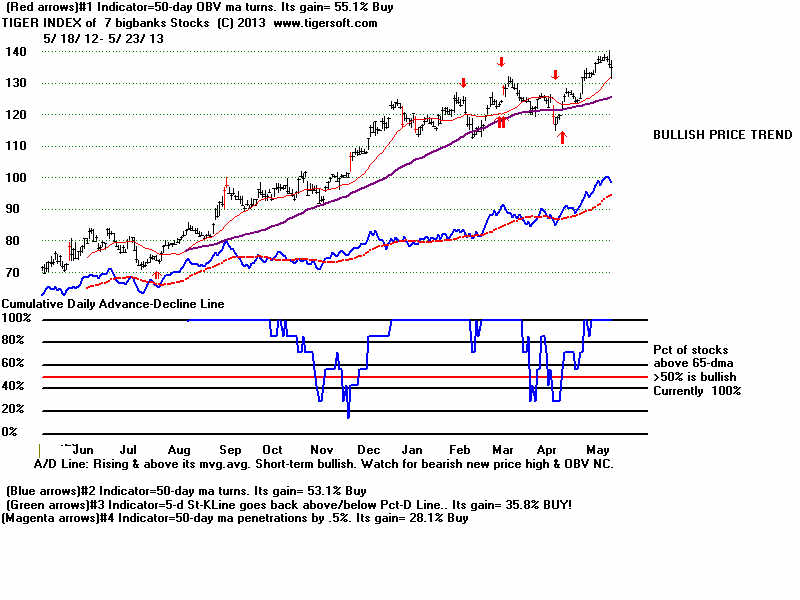
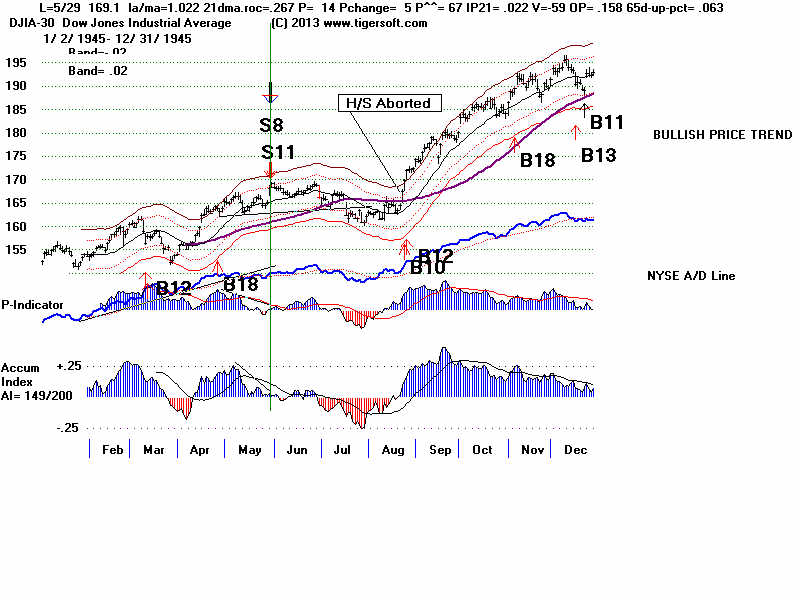
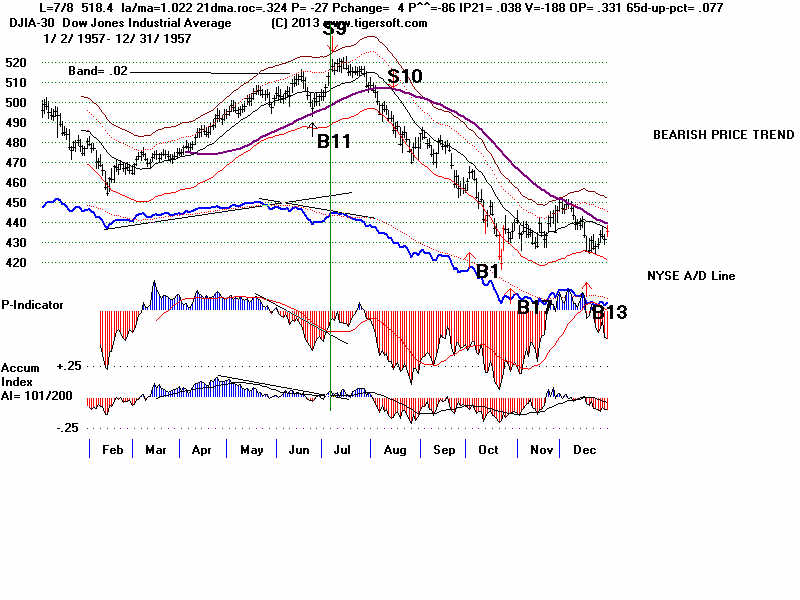
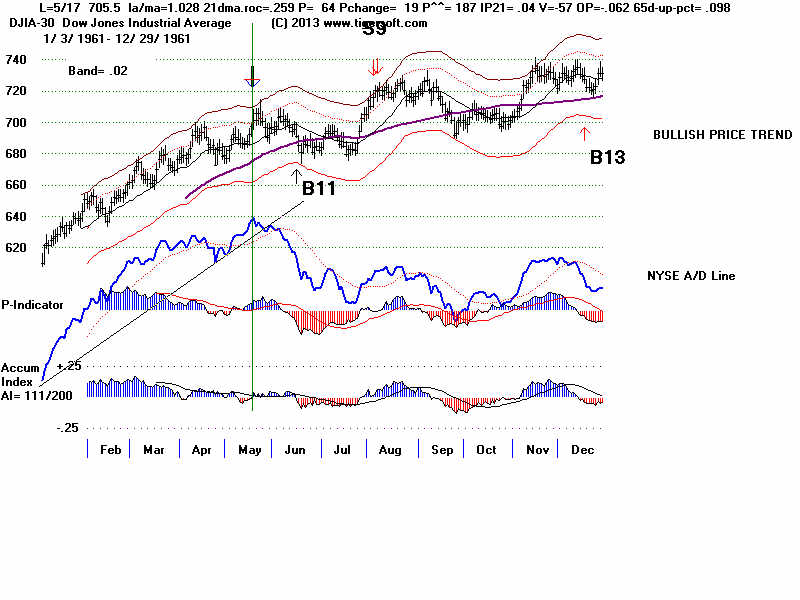
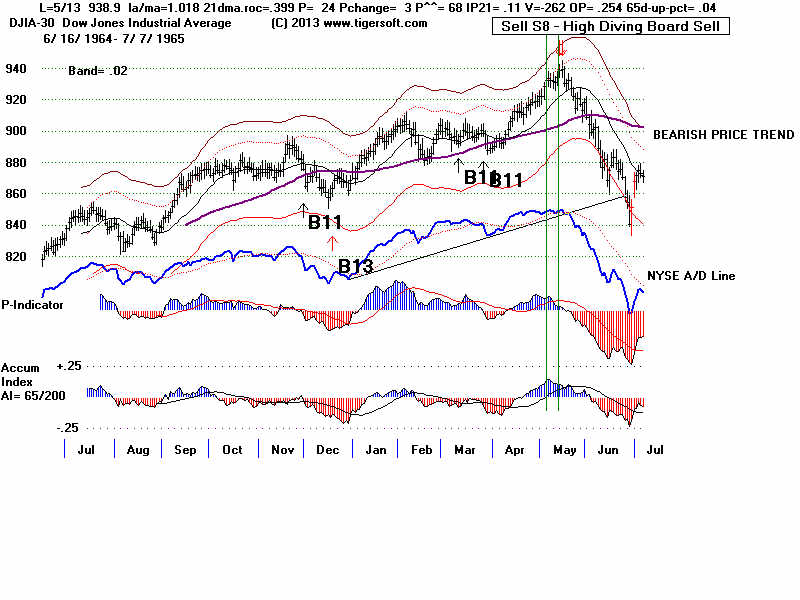
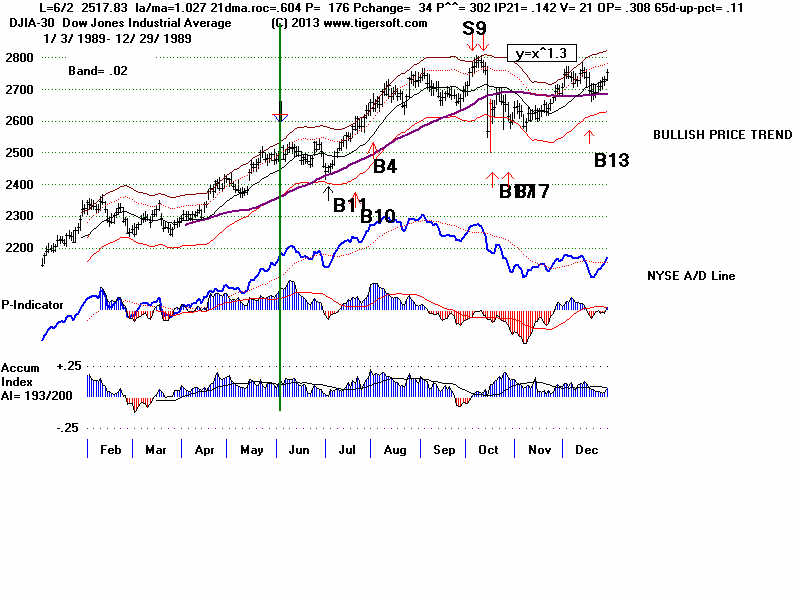
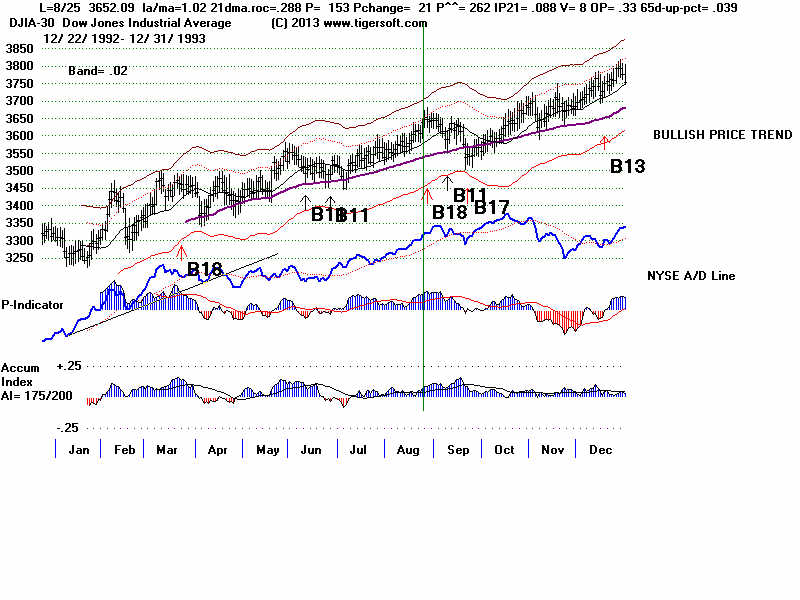
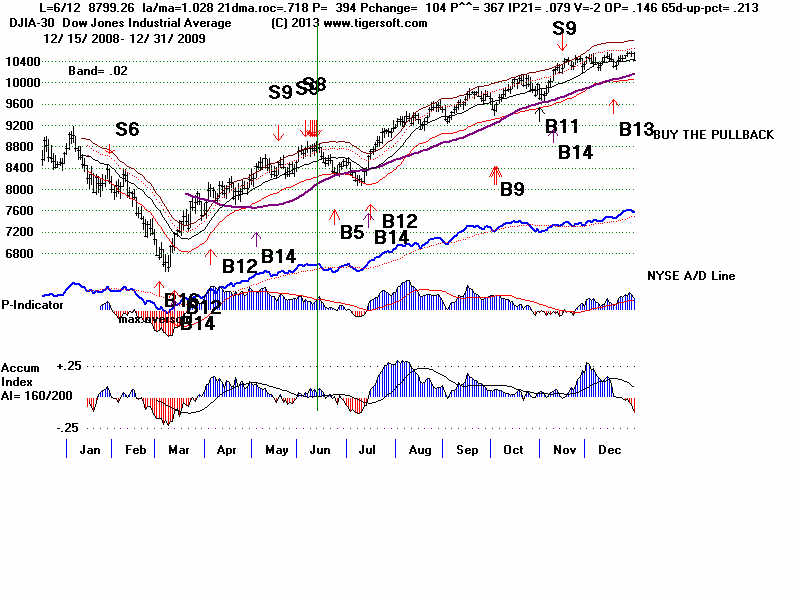
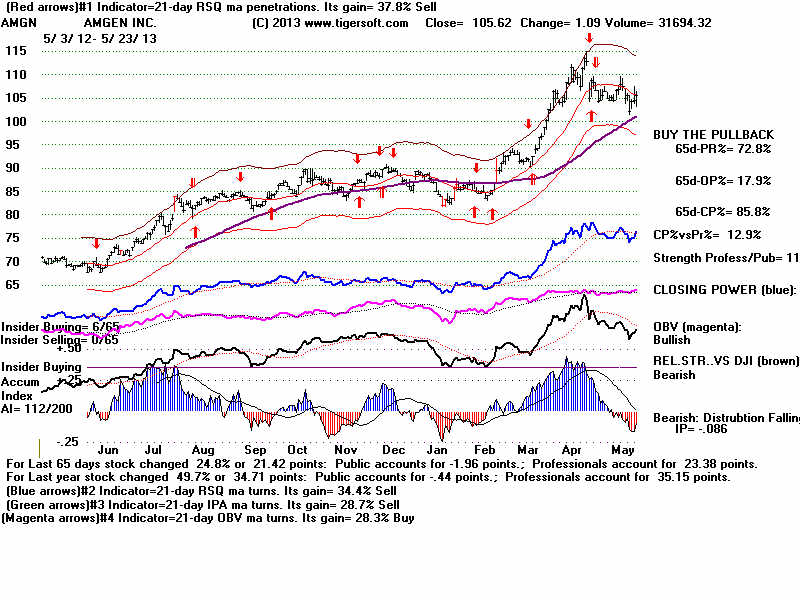
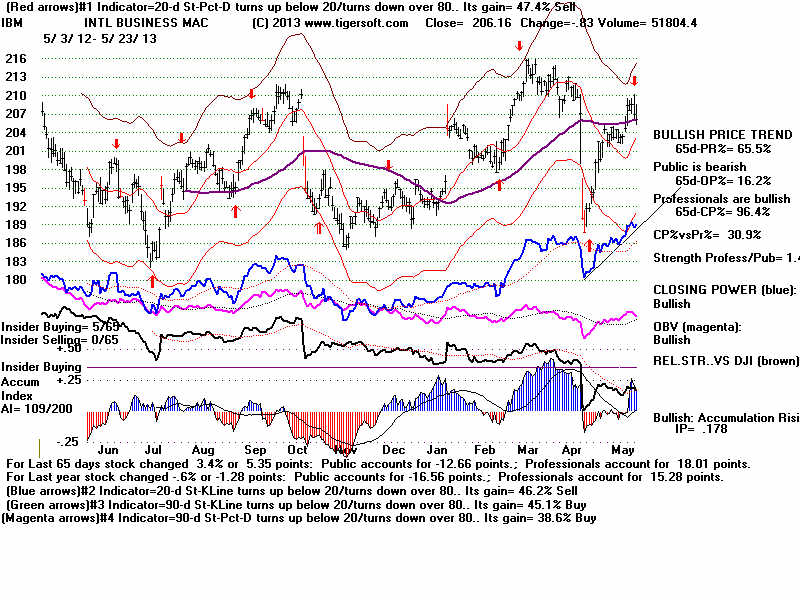
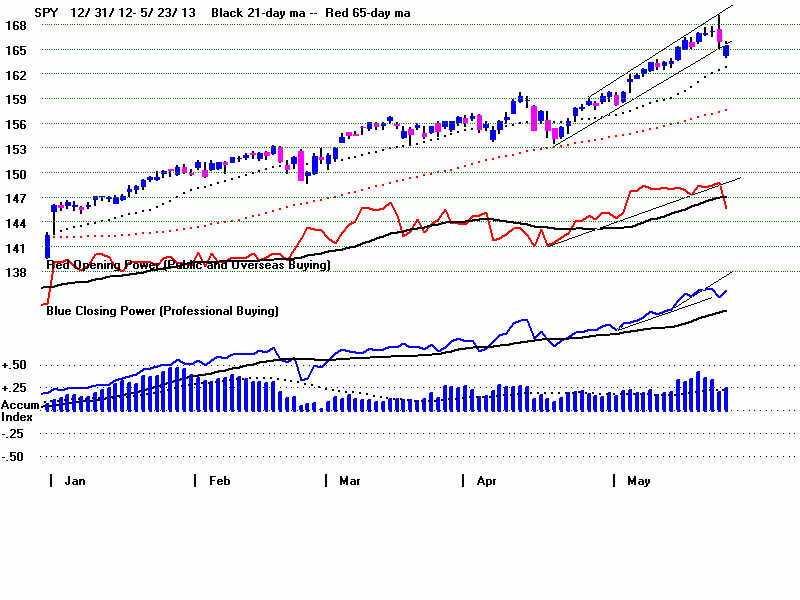
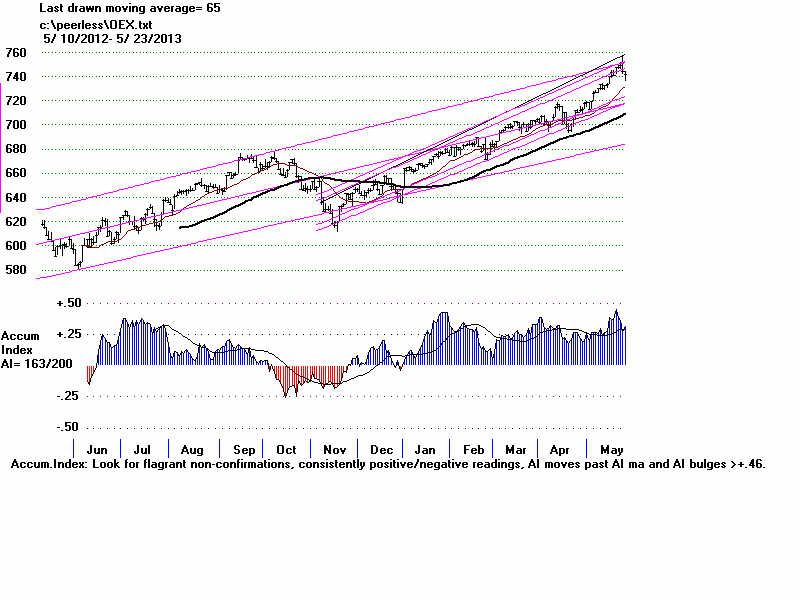
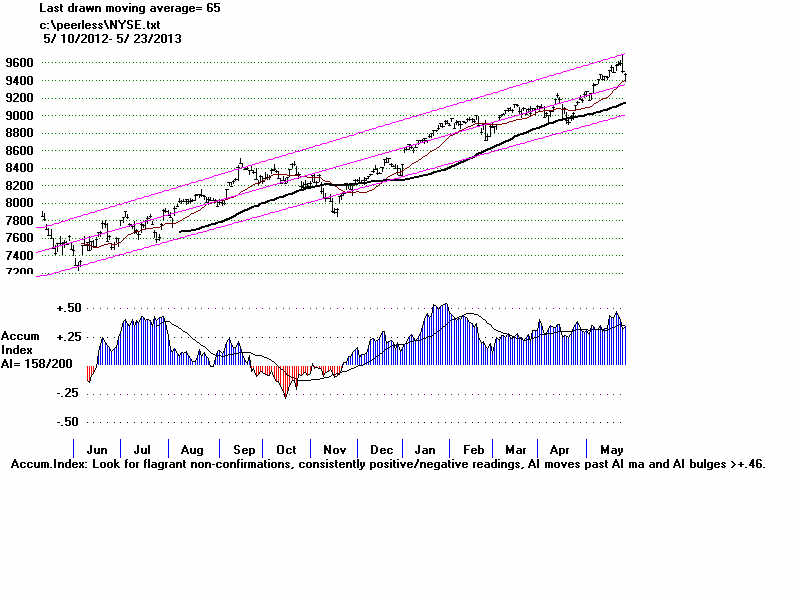
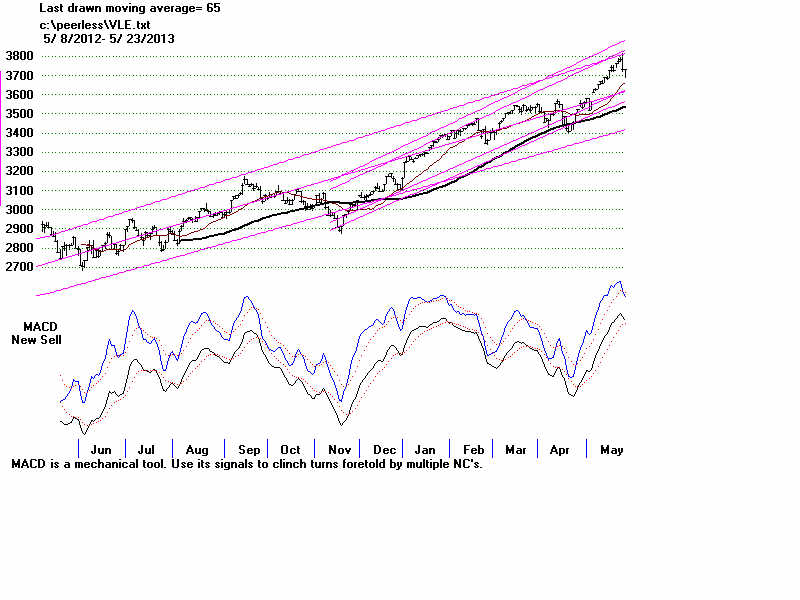
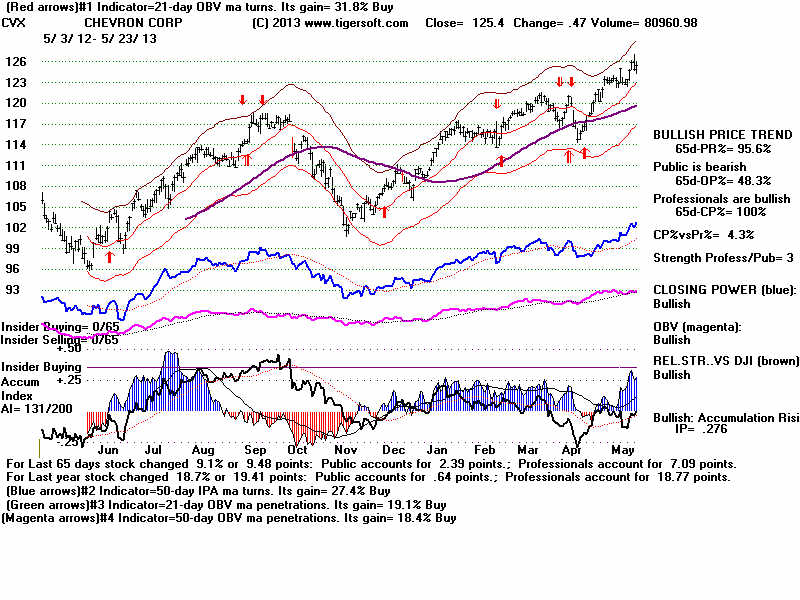
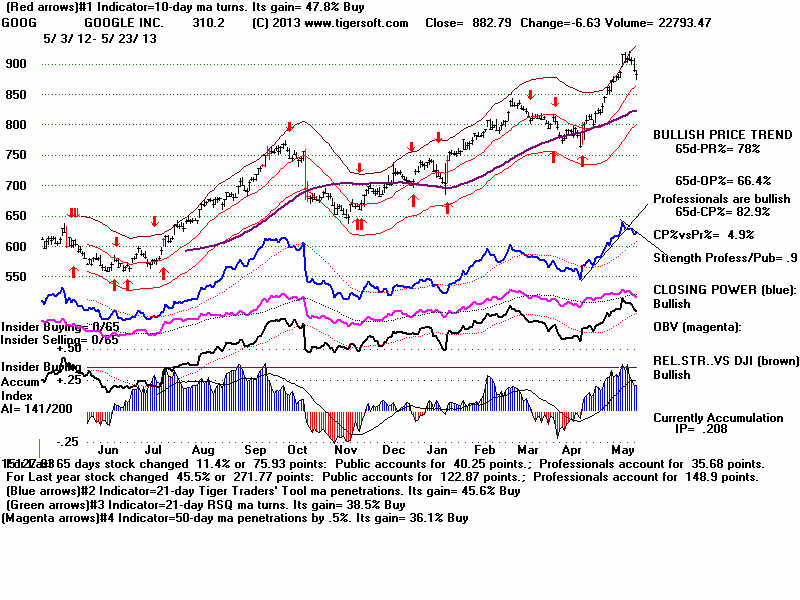
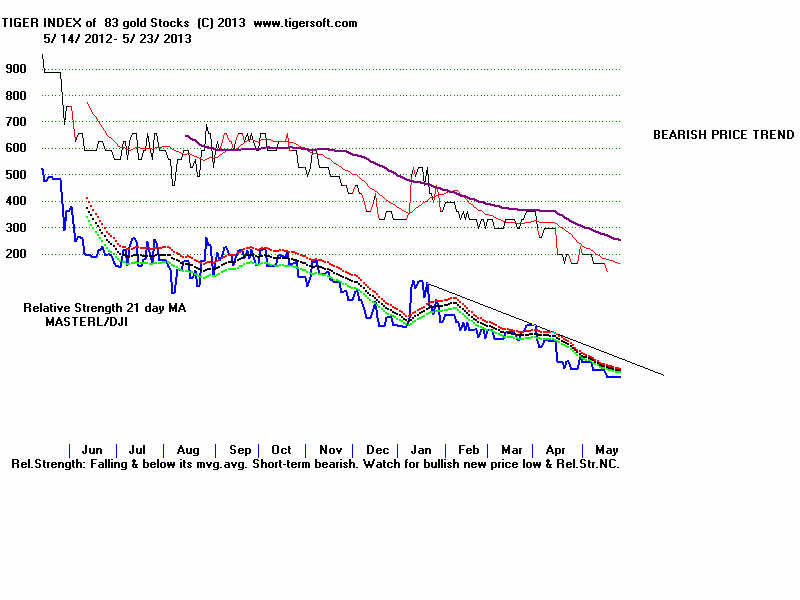
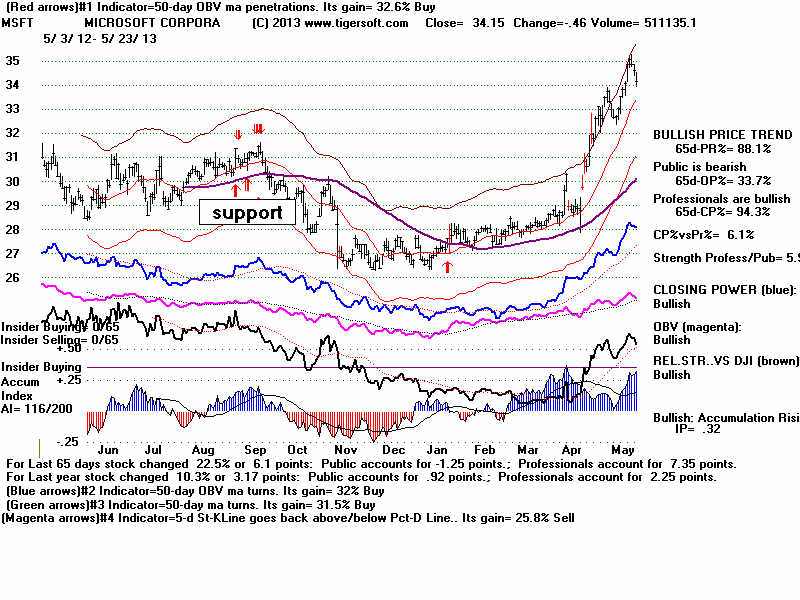
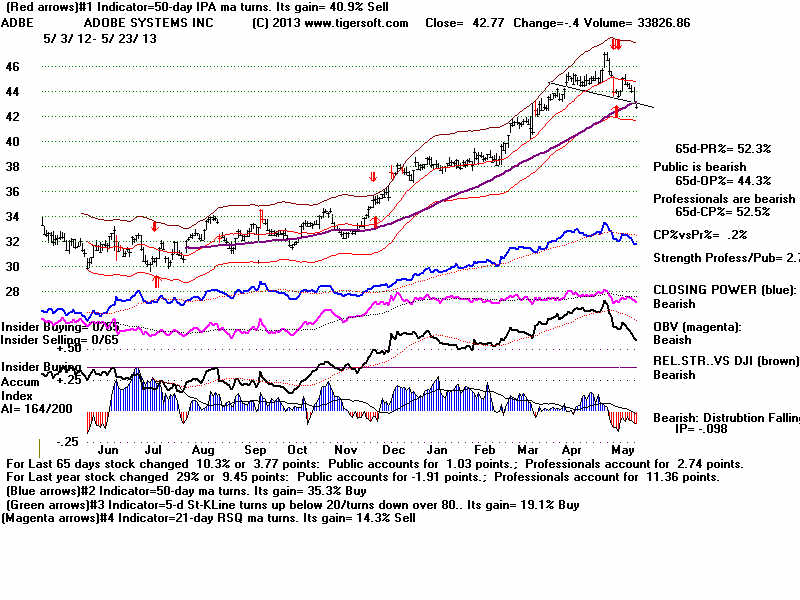
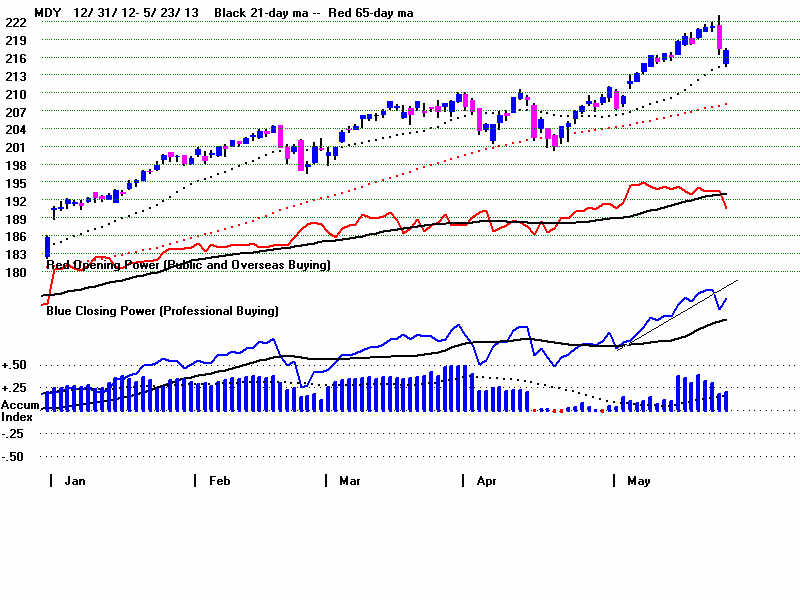
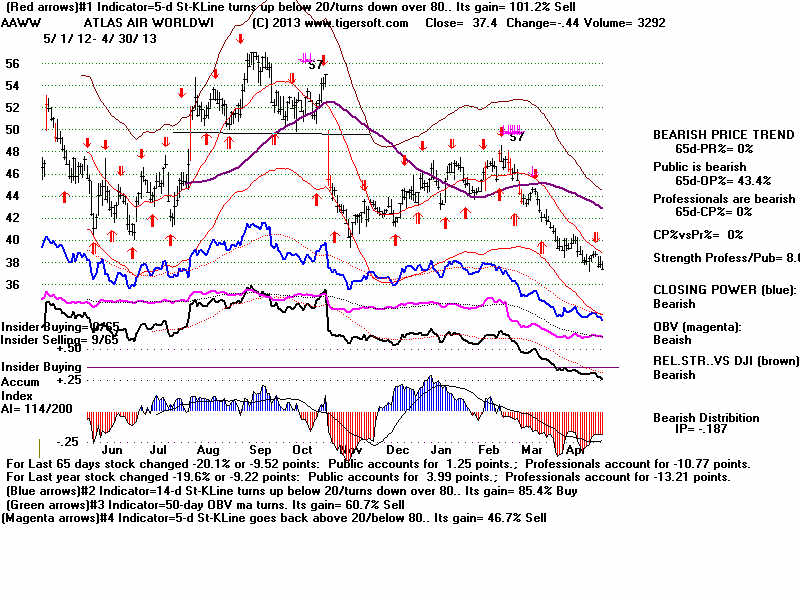
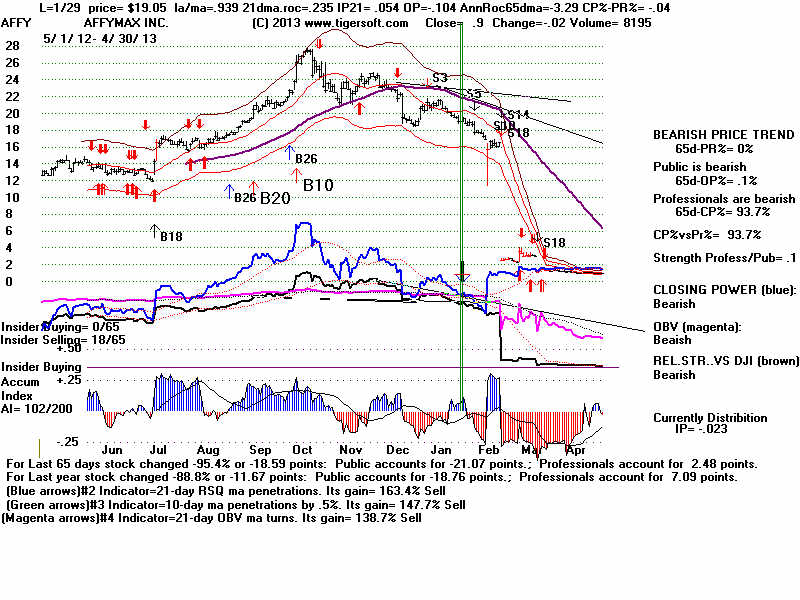
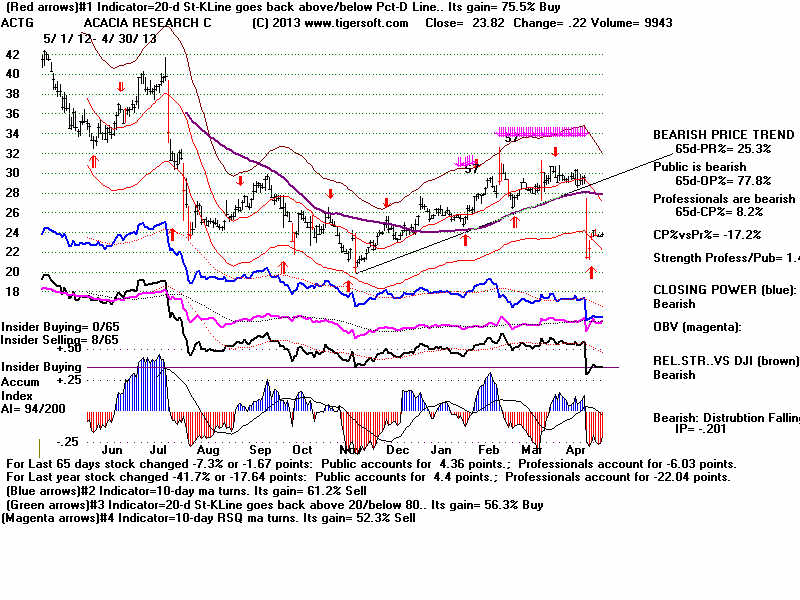
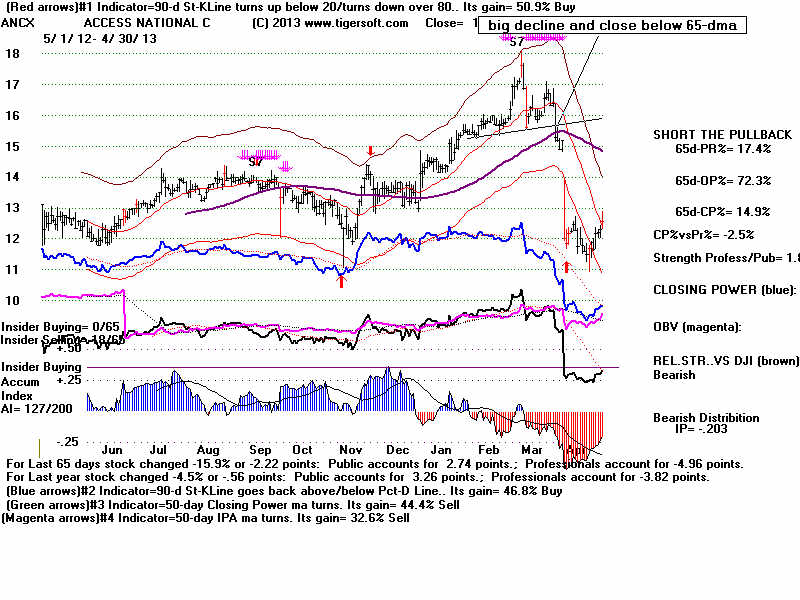
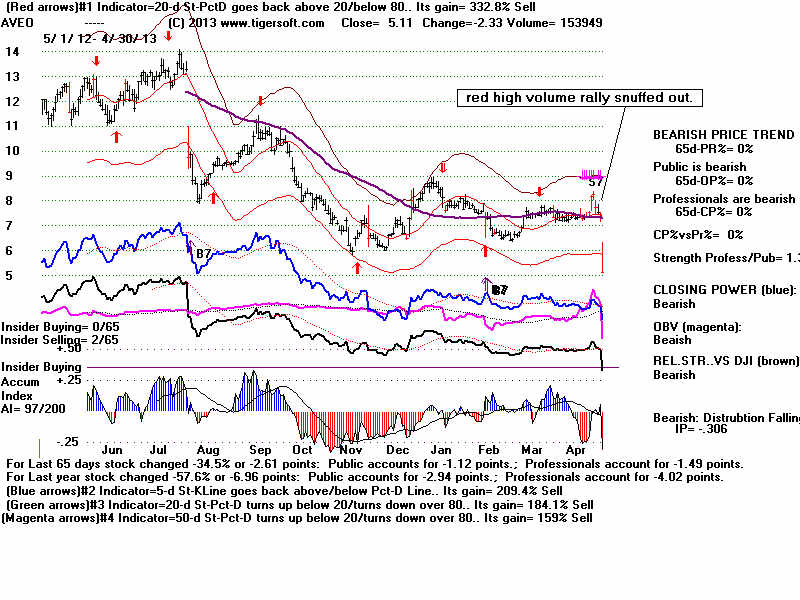
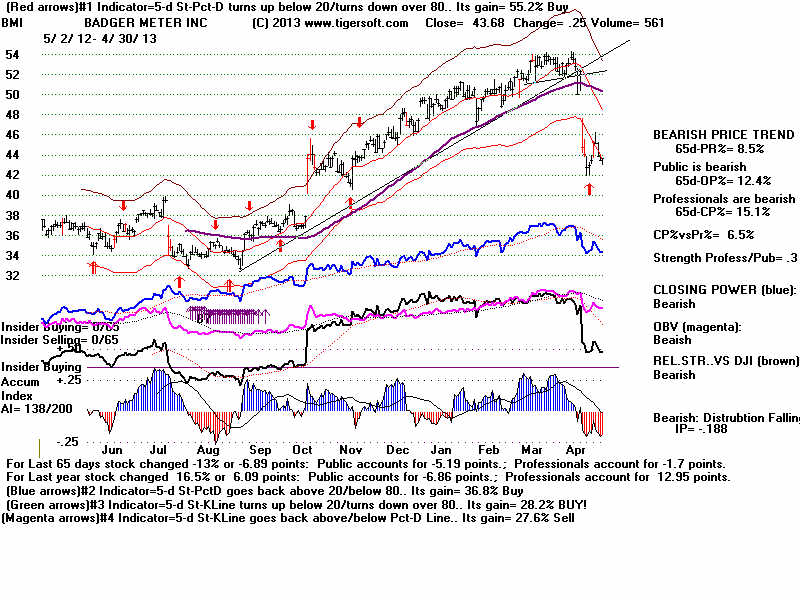
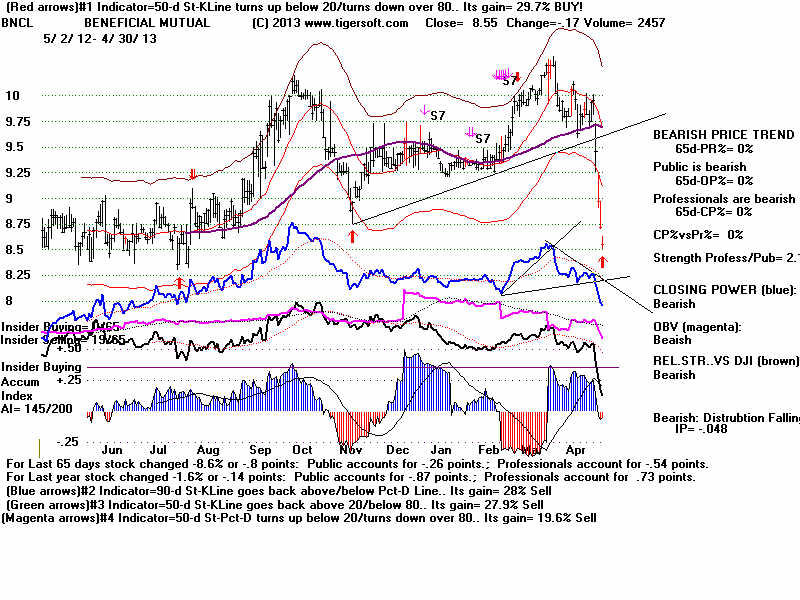
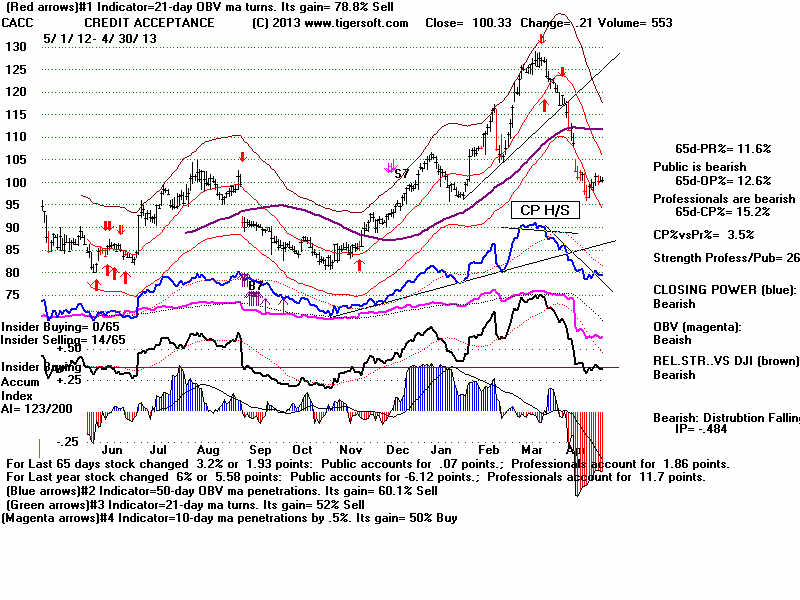
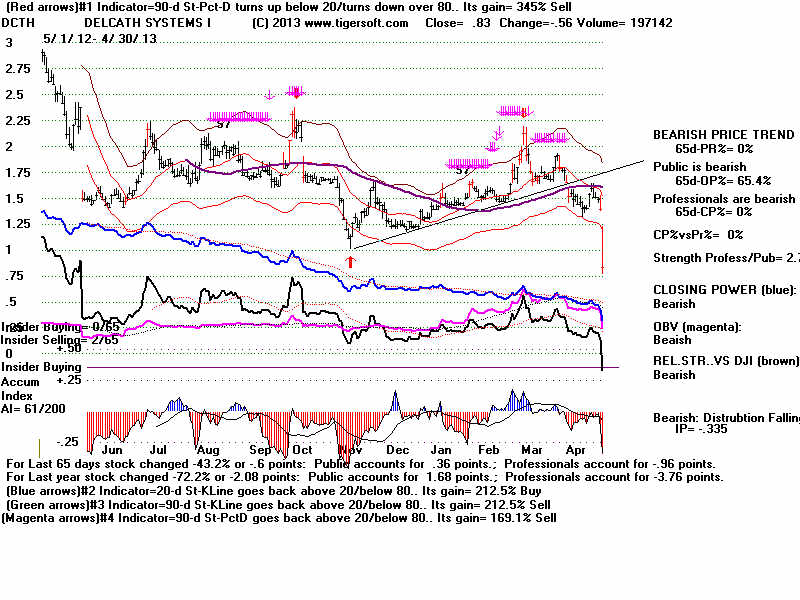
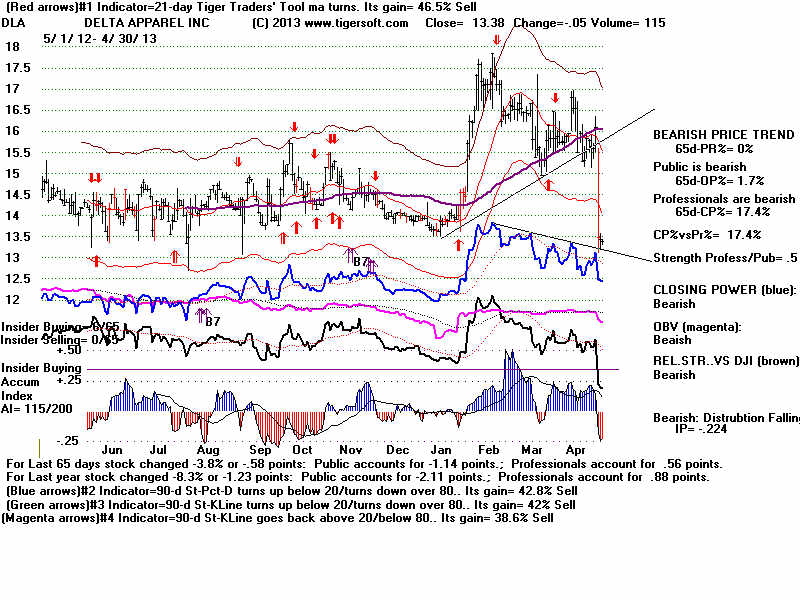
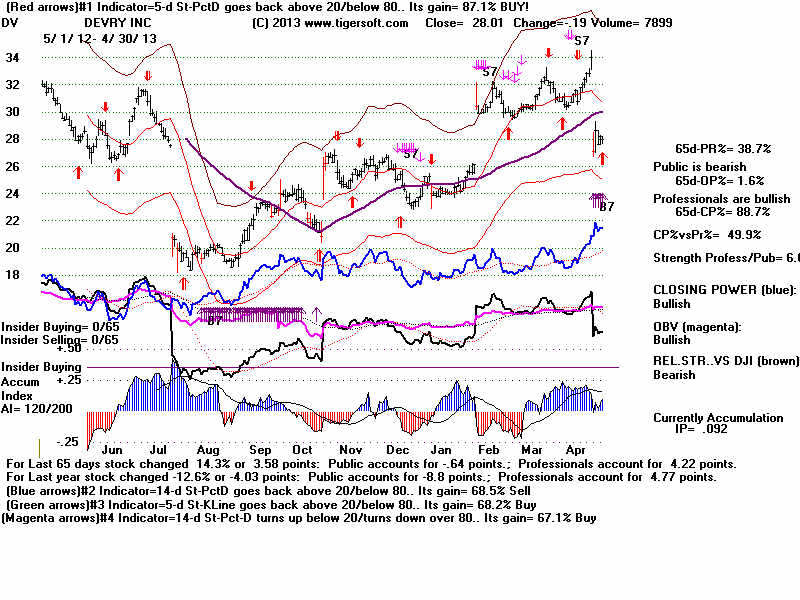
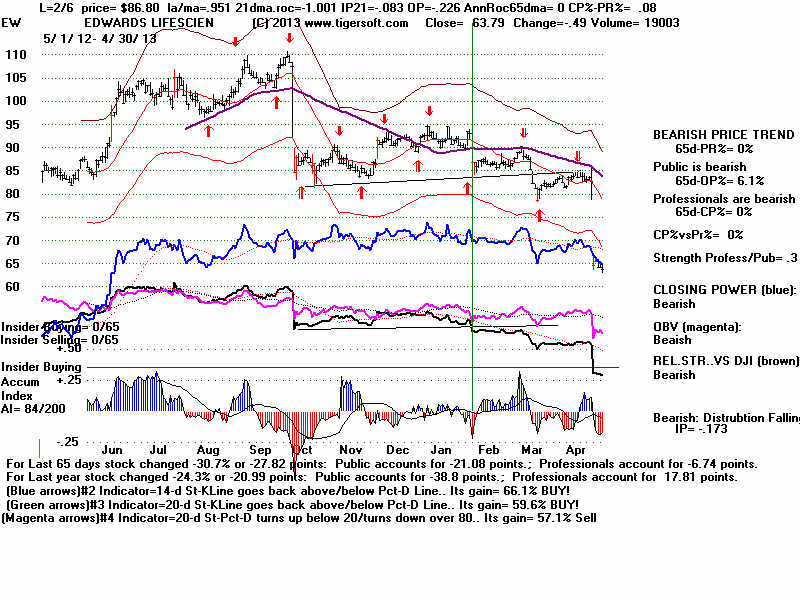
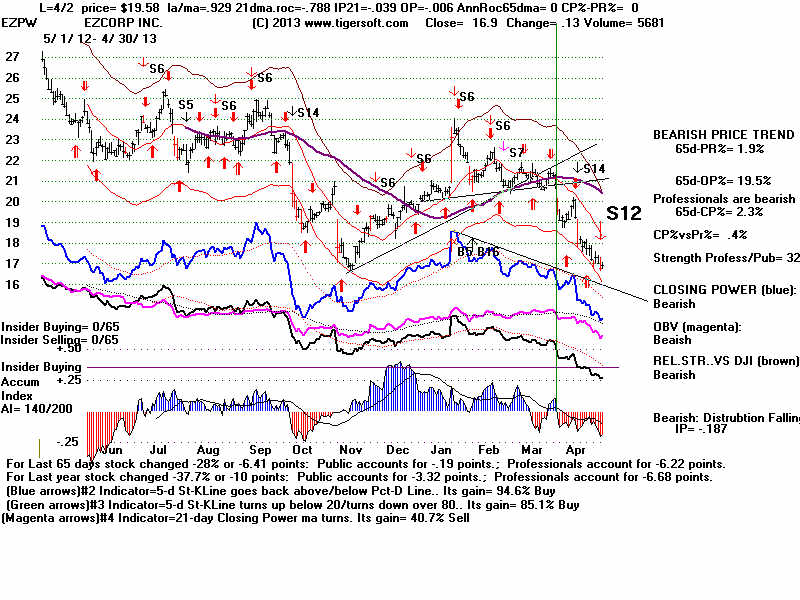
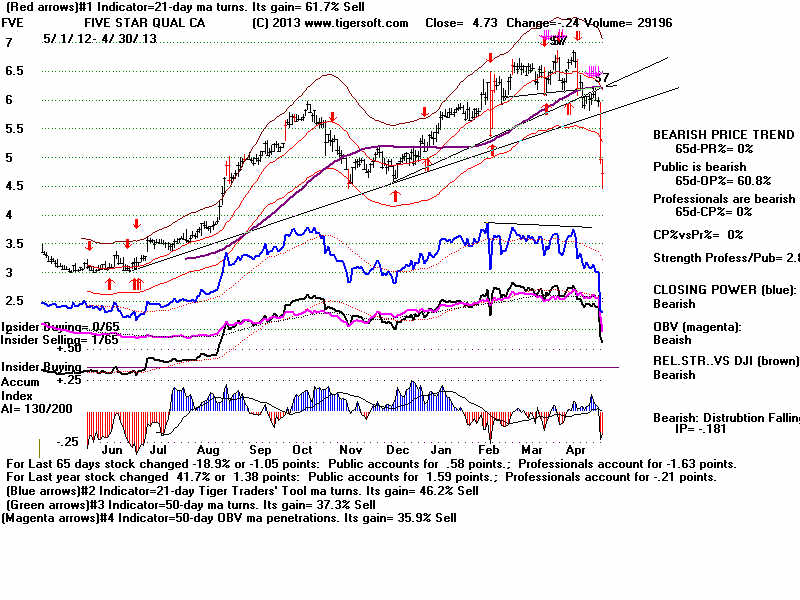
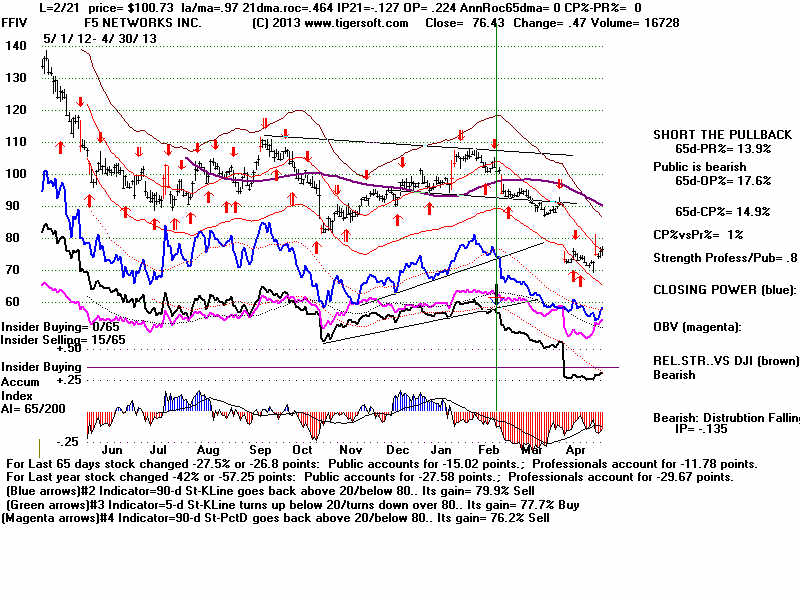
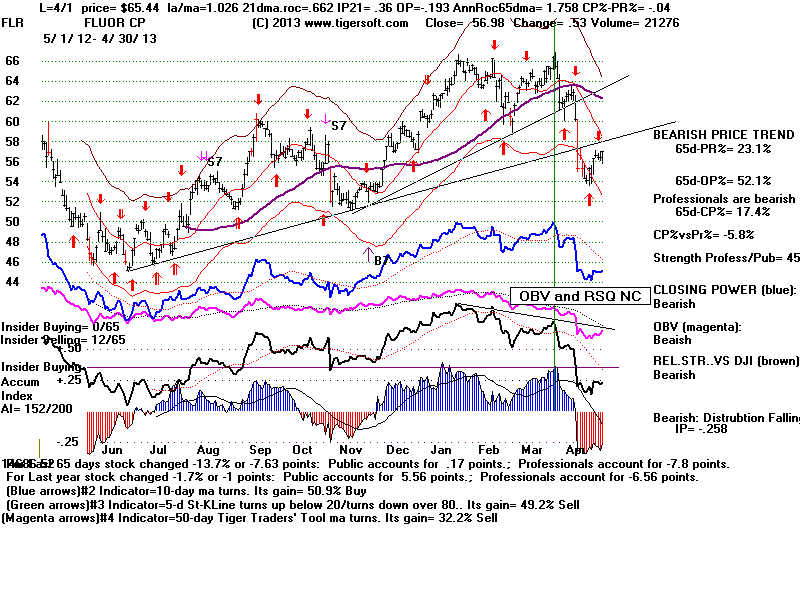
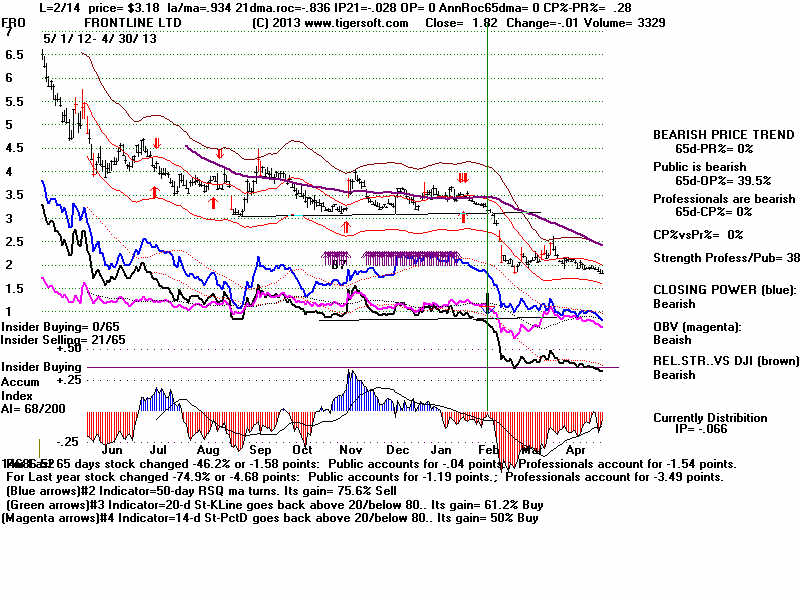
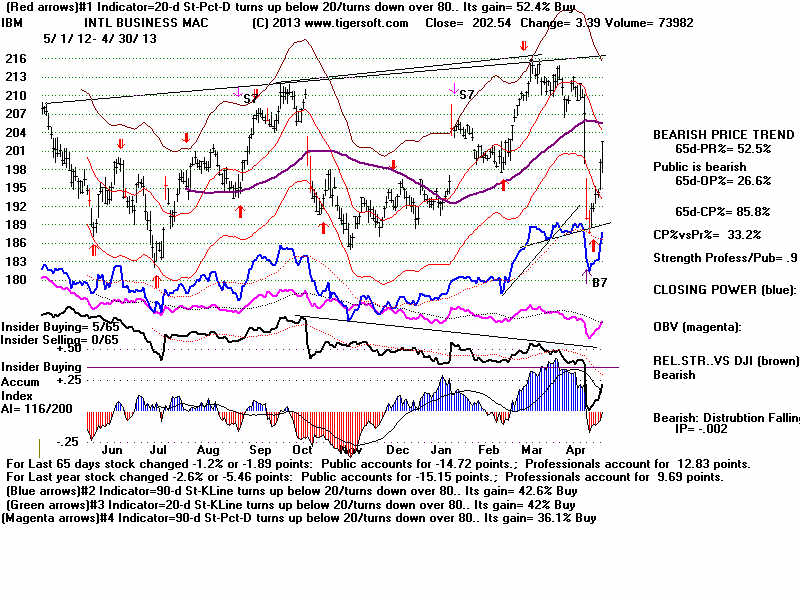
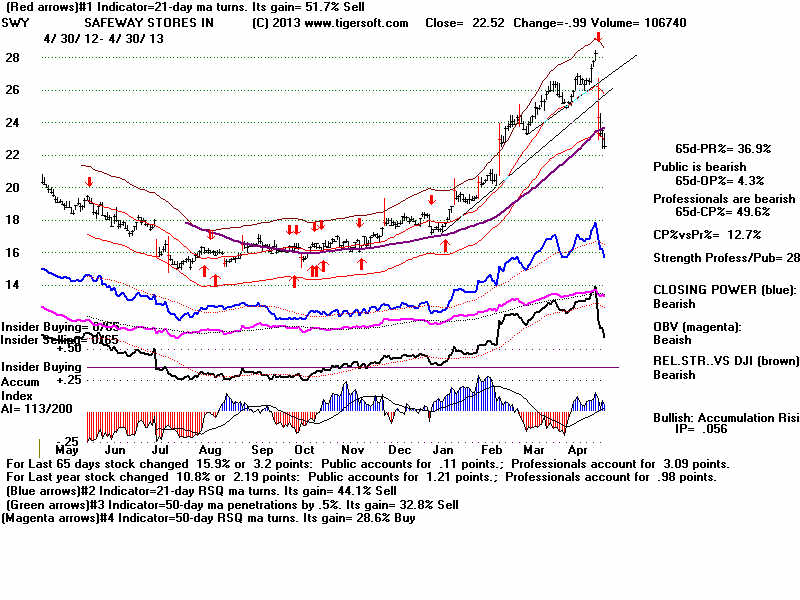
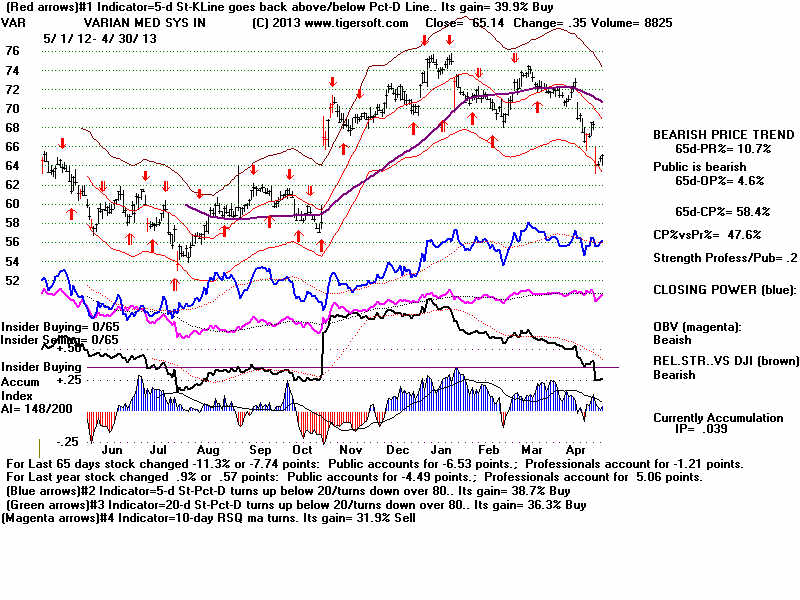
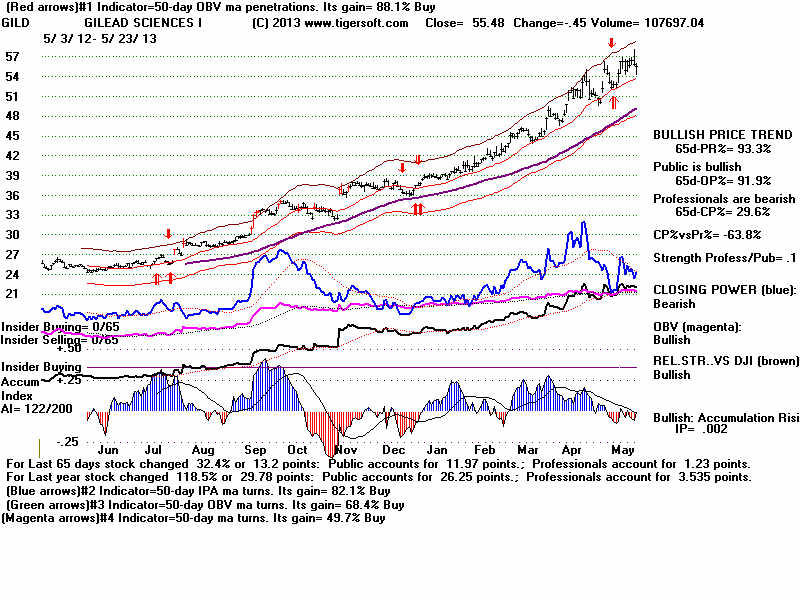
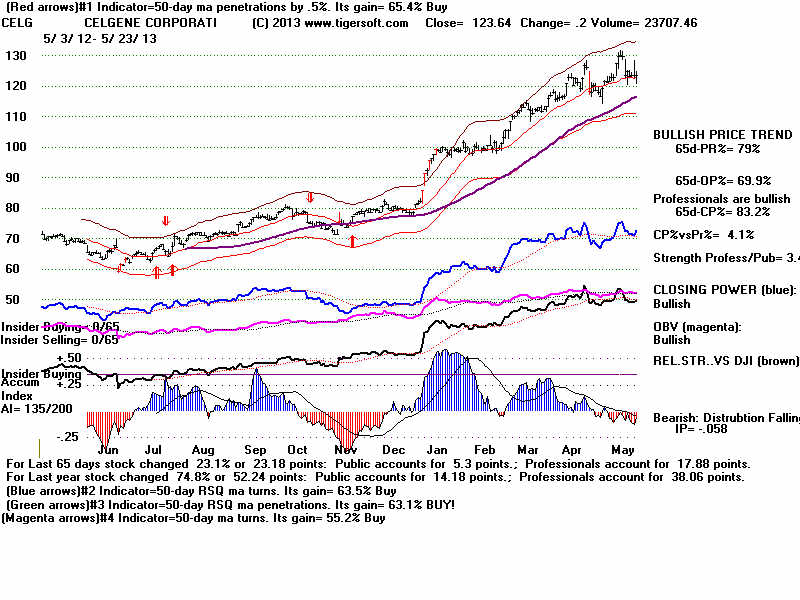
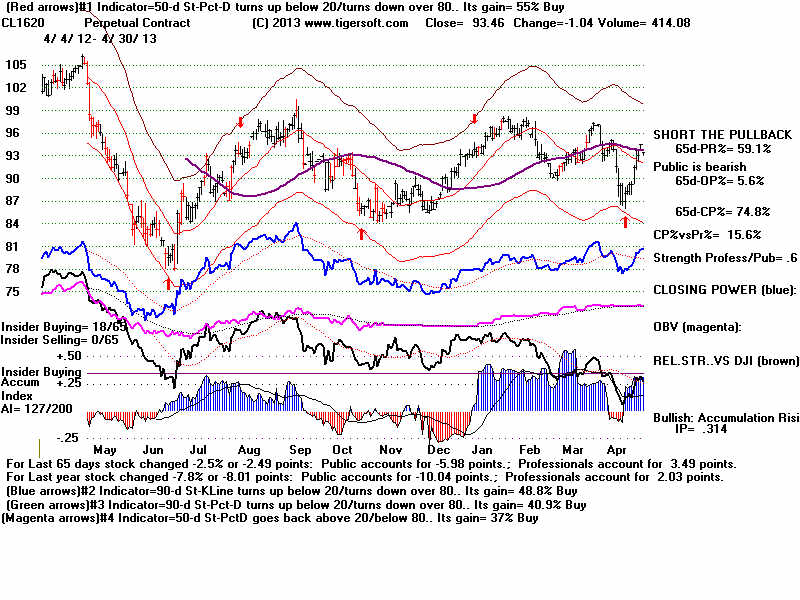
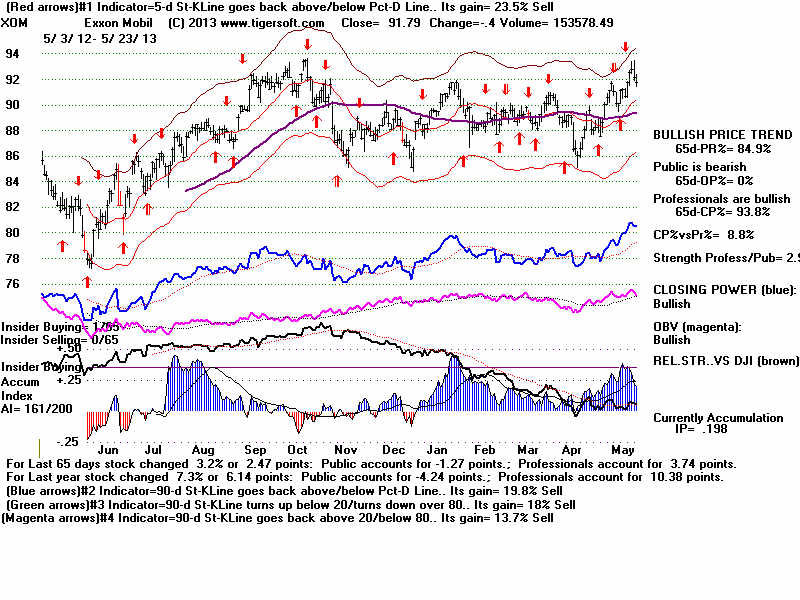
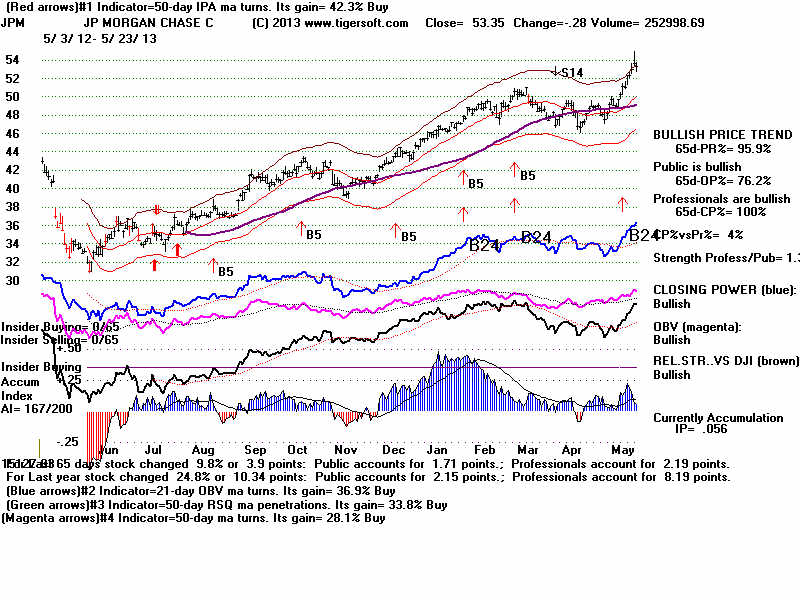
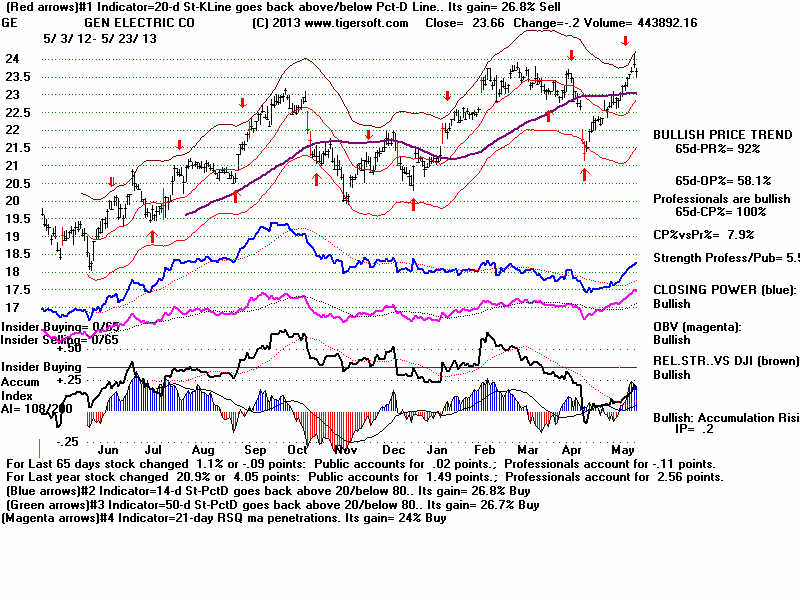
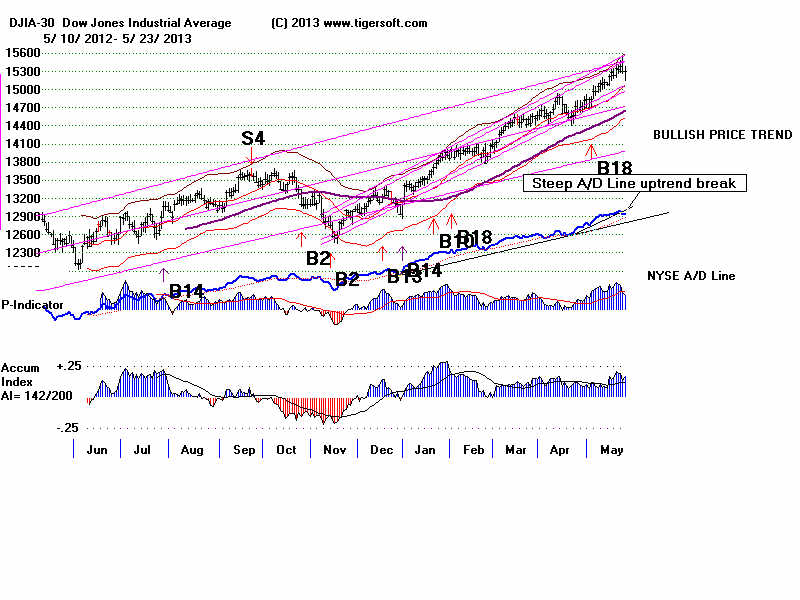
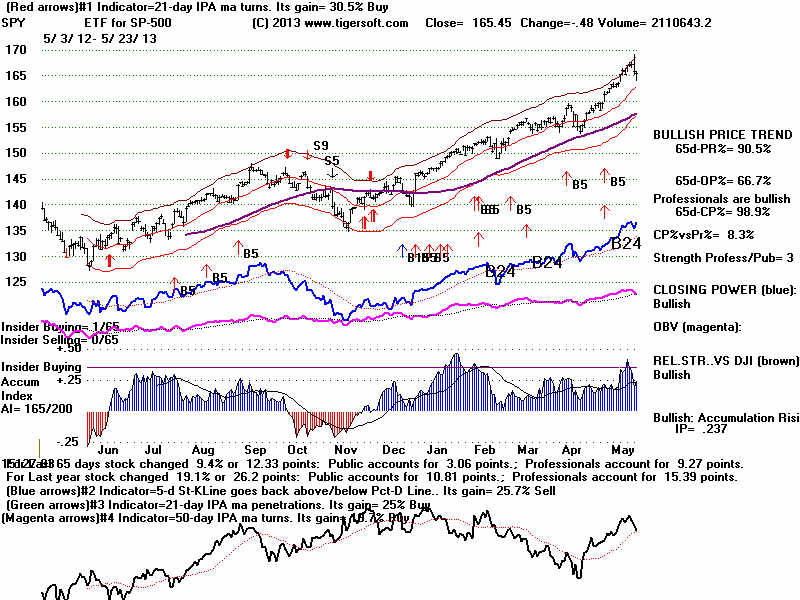
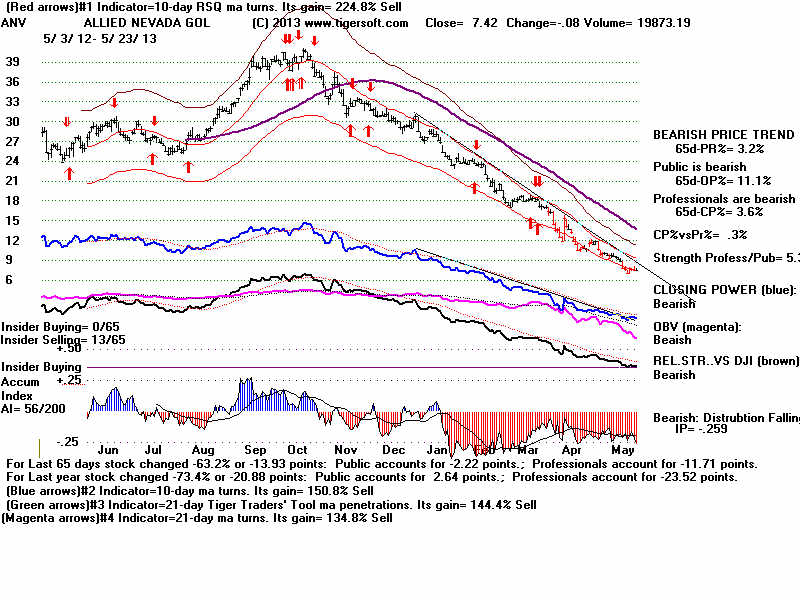
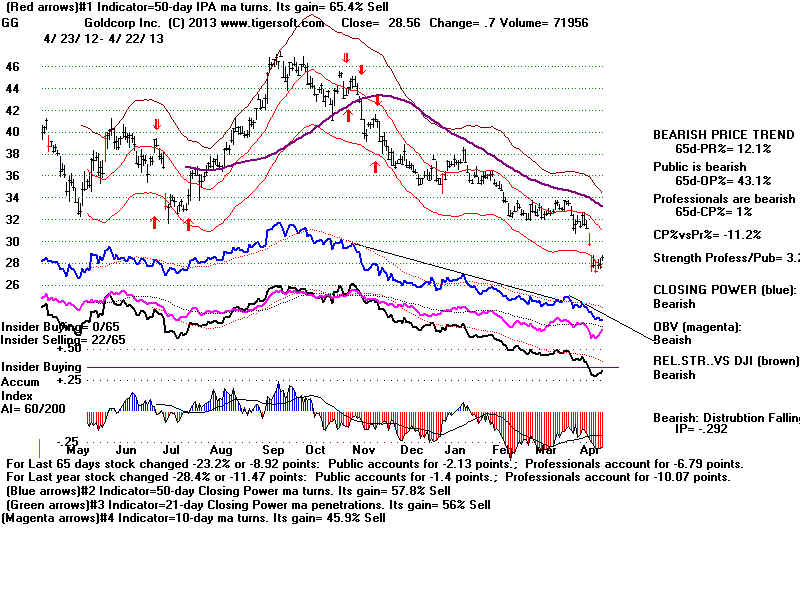
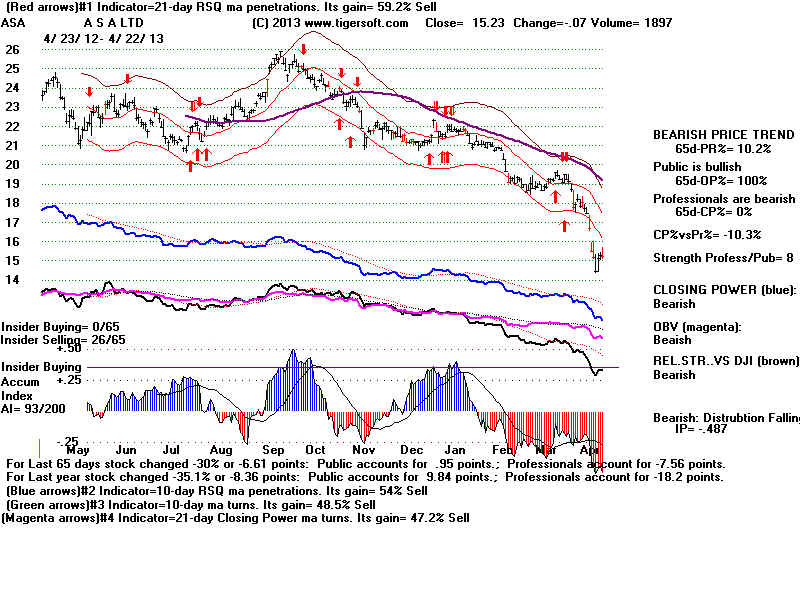
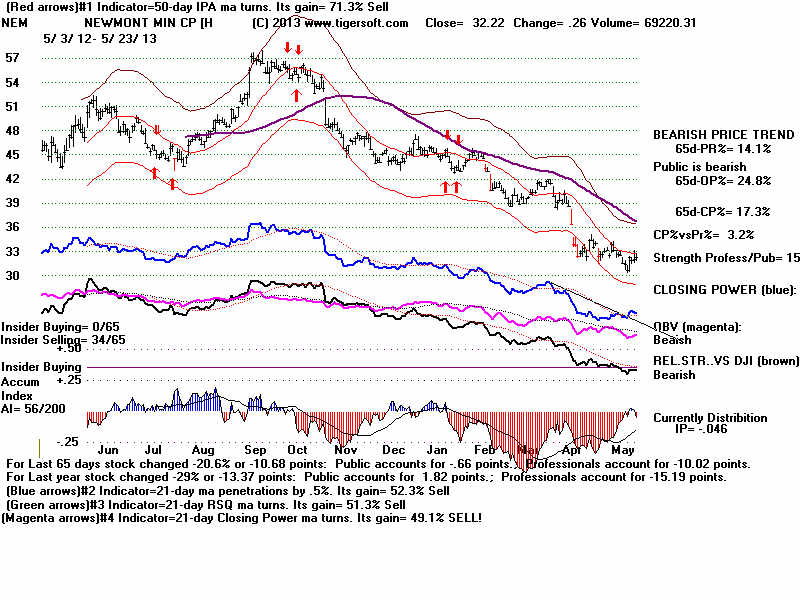