Sell S9 occurs when the Accumulation breaks below its 21-day ma
after a rally of more than 9% from a 65-day low or 7% from a two-month low.
The average gain = 9.1%. There were 33 cases since 1928. The buggest declines
generally took place from the 11th to the 20th of the month, +.24 and in year of
Mid-Term Elections, + .146. The smallest declines occurred in the 3rd year of
the Presidential 4-Year cycle.
>10% 11
>5%-9.99% 11
>2%-4.99% 8
>0%-1.99% 3
losses 0
Study just the IP21 crossings below its 21-day ma in June and July to see the
importance of these months and negative readings by the V-Indicator. This is
shown further below and was the subject of the 6/12/2014.
http://www.tigersoftware.com/11HL5522/index.htm
19370311 S4 192.2 .139
19370803 S4 185.9 .365
19401003 S4 135.1 .025
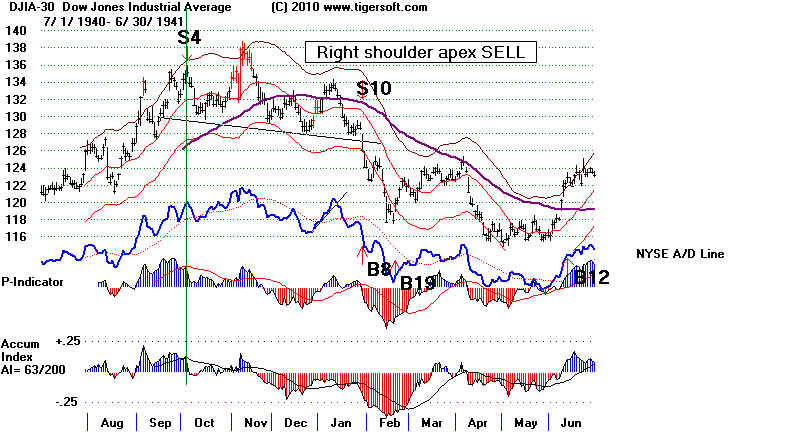
19410711 S4 127.9 .135
19430702 S4 143.7 .052
19460611 S4 209.1 .22
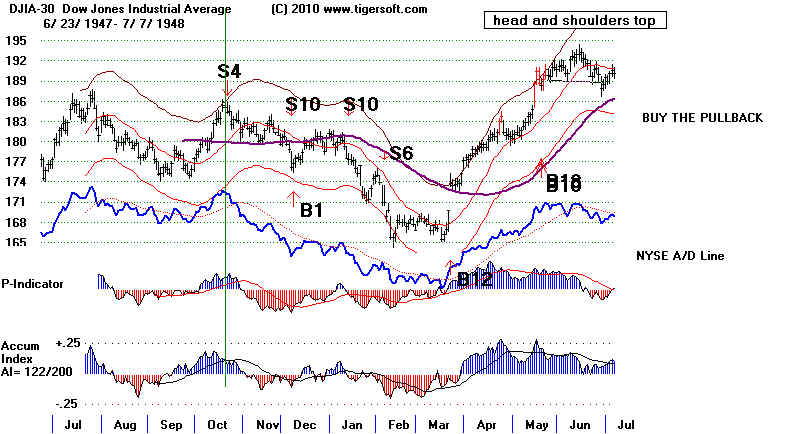
19470711 S4 184.8 .027
19471022 S4 184.4 .025
19510917 S4 275.1 .053
19570711 S4 518 .166
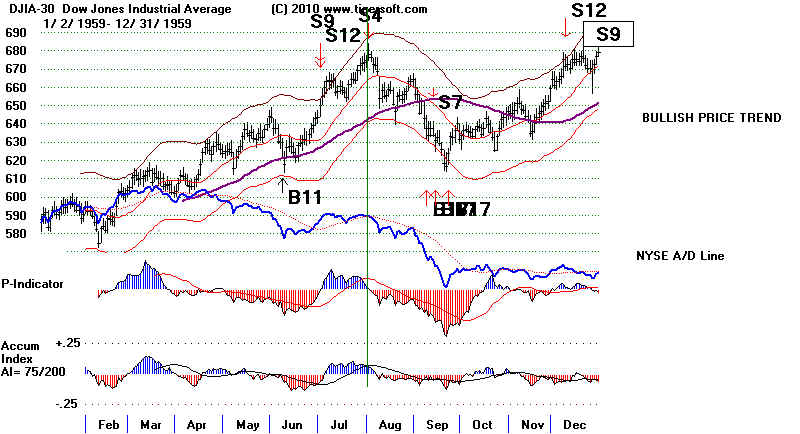
19610518 S4 701.1 .014
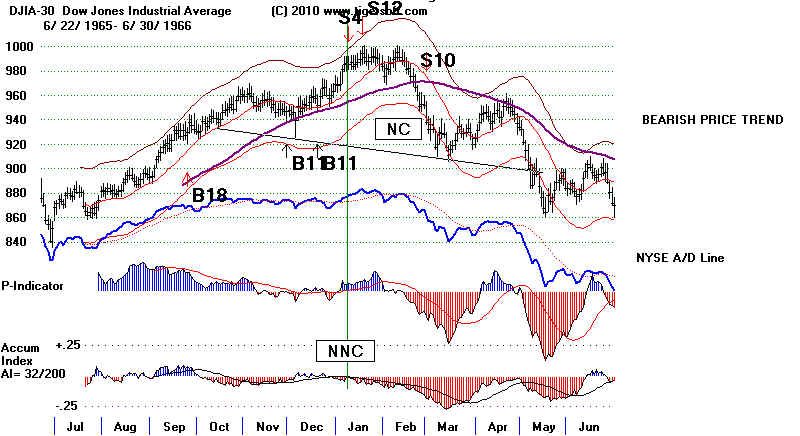
19660110 S4 985.41 .213
19730109 S4 1047.11 .114
19761222 S4 984.54 .051
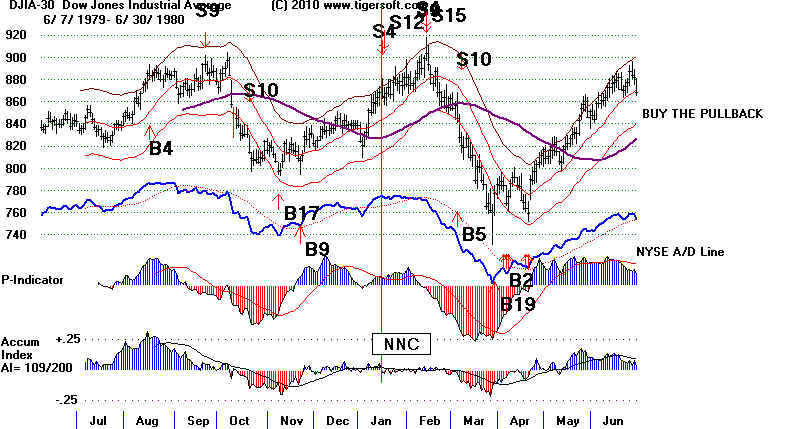
19800116 S4 865.19 .101
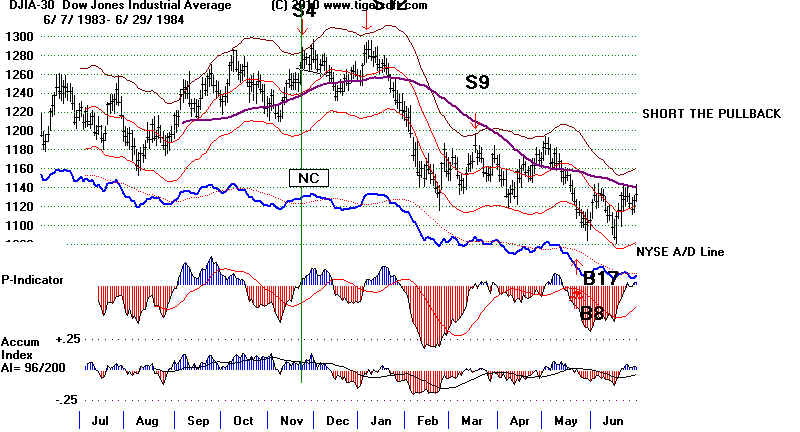
19831122 S4 1275.81 .031
19850208 S4 1289.97 .033
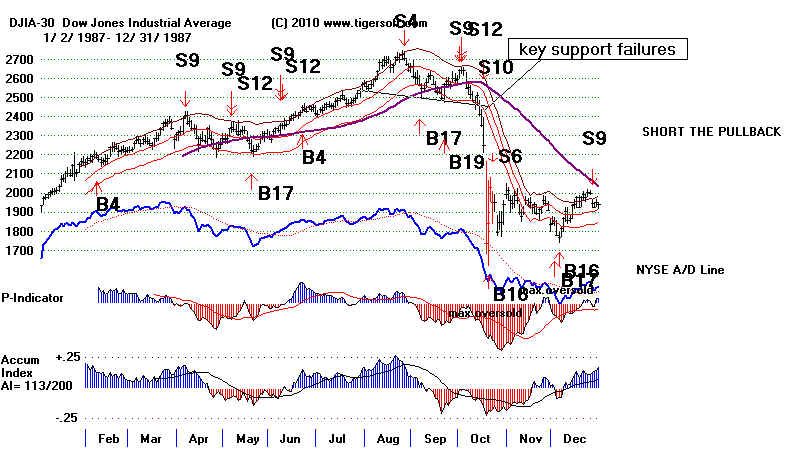
19870826 S4 2701.85 .052
19890209 S4 2323.04 .031
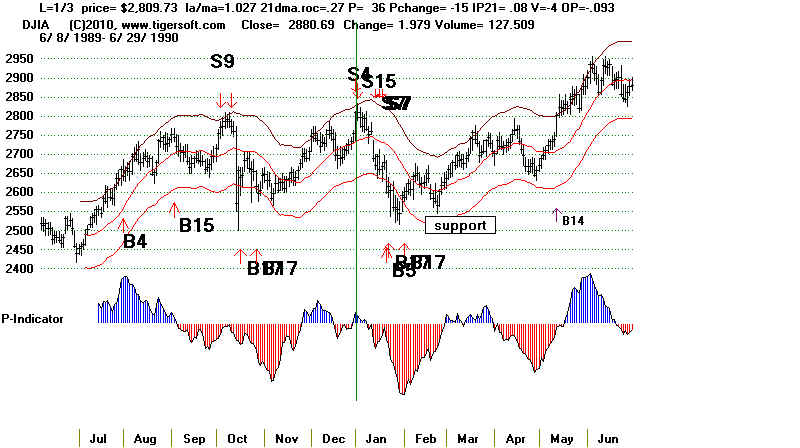
19900102 S4 2810.15 .075
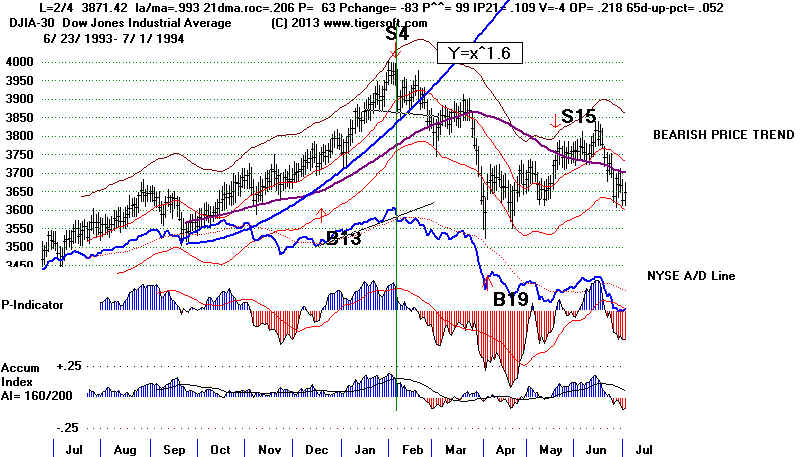
19940203 S4 3967.66 .074
19970207 S4 6855.8 .036
20000111 S4 11511.08 .13
20000906 S4 11310.64 .095
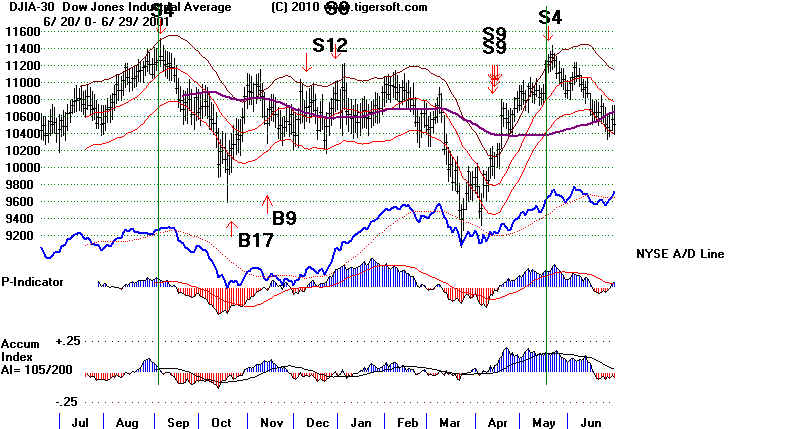
20010517 S4 11248.58 .268
20031015 S4 9803.05 .018
20050308 S4 10912.47 .076
20071005 S4 14066.01 .09
20080421 S4 12825.02 .112
20090105 S4 8952.89 .081
20090603 S4 8675.24 .041
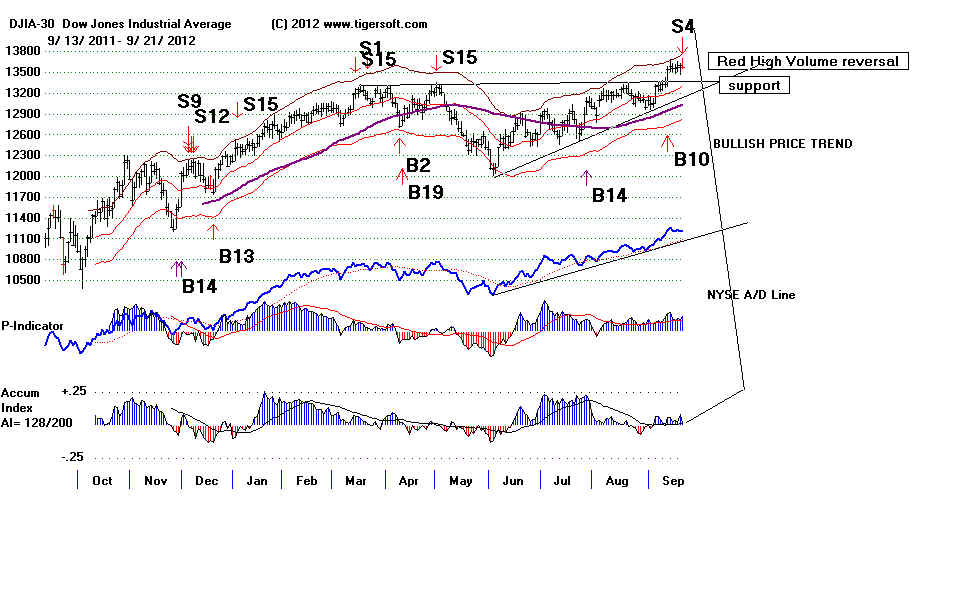
20120921 S4 13579.47 .056
-------------------------------------------------
no. = 33 Avg. = .091
11 11 8 3 PE 8 .071 PE +1 13 .115 PE +2 4 .146 PE +3 8 .044 January 6 .119 February 4 .044 March 2 .108 April 1 .112 May 2 .141 June 2 .135 July 4 .095 August 2 .209 September 3 .068 October 4 .040 November 1 .031 December 1 .051 1-10 15 .079 11-20 12 .24 21-31 6 .055 |
================================================================================
revised 4/11/2013
Sell after a rally of more than 9% from a 65-day low
or 7% from a two-month low
when the
Accumulation breaks below its 21-day ma at the specified times
(see below)
during each of the years in the 4-year Presidential cycle. These
specified
times have multiple successes. What seemed like a good Sell S4
may have
failed at other times.
Based on
this level of refinement, there have been 25 closed out cases.
None
produced a loss. The DJI should close more than 1.4% over the 21-day
ma, except
in June, a month that often starts declines. The annualized rate
of change
can be as high as .977. The annualized rate of change was above
.60 in a
quarter of the 24 cases. One sixth of the time the DJI was up more than
8% from 65
days earlier. The IP21 was as high as .189. The adjusted P-Indicator
So, many of
the Sell S4s reversed strong momentum.was as high as +800.
The
critical component of all these Sell S4 was the Accumulation (IP21)
broke below
its 21-day ma.
It is
important to take future signals Sell S4 signals at about the same time
in the year
that successful Sell S4 signals have occurred in the past. These
are shown
in blue. Avoid those periods when unsuccessful red indications
occurred
unless there are many more successful Sell S4s. The Peerless
program
eliminate most of these unsuccessful periods automatically.
For those
months having no successful S4 signals and no contrary indications,
my advise
is be careful: the Sell S4s at this time are unproven.
During Presidential Election Year:
1928, 1932, 1936...2012, 2016...
Best month is April.
January
1/4/1996 bad
1/20/1932 good
1/25/1976 good
1/26/1972 bad
February
2/1/1988 bad
2/13/1936 bad
2/13/1976 good!
2/13/1992 bad
2/10/1964 bad
2/19/1964 bad
2/20/2004 bad
2/21/1936 bad
2/27/1992 bad
March
3/1/1976 bad
3/4/1936 good
3/10/1936 bad
3/12/1936 bad
3/18/1976 bad
3/20/1936 good
3/22/2012 good
April
4/6/1976 good
4/7/1988 good
4/16/1956 good
4/30/2008 good
May none
June
6/5/1968 good
6/29/1944 good
July
7/15/1980 bad
7/20/1944 good
7/25/1980 bad
August
8/14/1940 bad
8/21/2012 bad
8/28/1940 bad
8/30/1984 bad
September
9/5/1984 bad
9/19/1984 good
9/25/1980 good
October
10/4/1940 good
10/8/1928 bad
10/26/1928 bad
November
11/18/1940 good.
December
12/4/2008 bad
12/26/1996 bad
12/29/2008 bad
During Year after a Presidential
Election: 1929, 1933, 2009, 2013...
Best months are January, June and
August.
January first half:
1/12/1973 good
1/4/2001 good
1/4/2005 good
1/7/2009 good
1/8/1997 bad
January second half:
1/30/1929 good
February
2/20/1985
2/28/1985
March
3/18/1929 good
3/19/1997 bad
April
4/3/1961 bad
4/24/1981 good
May
5/14/2009 bad
5/17/2001 good
June
6/5/1945 good
6/19/1945 good
6/15/2001 good
6/17/2009 good
6/24/1929 bad
July
7/30/1937 good
7/17/1941 good
August
8/10/1937 good
8/18/1937 good
8/6/1941 good
8/26/1941 good
September
9/2/2009 bad
October
10/21/2009 bad
November
11/13/2009 bad
December
12/23/1937 good
12/6/1949 bad
During Second Year after a Presidential
Election: 1930, 1934, 2006, 2010...
Best month is June.
January
1/7/2002 good
1/17/1930 bad
1/14/1986 bad
February
2/24/1930 bad
2/1/1934 good
March
3/5/1930 bad
3/13/1934 bad
3/2/1934 bad
3/14/1930 bad
April
4/15/1986 bad
4/25/1930 good
May
5/6/1938 good
5/9/1978 bad
5/14/1986 bad
5/16/1938 good
5/18/1978 bad
5/24/1938 bad
5/26/1978 bad
5/30/1978 bad
June
6/4/1970 good
6/12/1978 good
July
7/3/1942 bad
August
8/1/2002 bad
8/13/1970 bad
8/20/1930 bad
September
9/18/1930 good
9/18/1962 bad
9/22/1982 bad
October
10/15/1958 bad
10/25/1934 bad
10/15/1974 good
November
11/7/1974 good
11/13/2010 bad
11/15/1974 good
11/22/1982 bad
December
12/1/1982 good
12/3/2002 good
12/7/2002 bad
12/9/1942 bad
12/11/1958 bad
12/13/1934 bad
12/23/2010 bad
12/31/1962 bad
During Third Year after a Presidential
Election: 1931, 1935, 2007, 2011...
Best month is May.
January
1/6/1955 bad
1/12/1983 good
1/17/1955 bad
1/24/1935 bad
February
2/24/1958 good
March
3/6/1939 good
3/8/1991 good
3/13/1951 bad
3/23/1999 bad
3/25/1983 bad
3/27/1967 good
April
4/21/1987 bad
4/22/1987 bad
4/25/1991 bad
4/28/1943 bad
May
5/13/1963 good
5/14/1975 good
5/22/1963 good
5/26/1939 good
5/28/1935 good
June
6/6/1935 bad
6/5/1975 bad
6/7/1999 bad
6/7/2007 bad
6/15/2007 bad
6/17/1935 bad
6/25/1999 bad
6/26/1935 bad
6/30/2003 bad
July
7/7/1931 good
7/14/1939 good
7/14/2003 bad
7/23/1931 good
7/24/2003 bad
August
8/1/1955 bad
8/3/1931 bad
8/6/1947 good
8/18/1955 bad
8/19/1935 bad
8/27/1935 bad
September
9/9/1987 bad
9/20/1935 bad
9/22/1955 bad
October
10/3/1939 bad
10/28/1963 good
November
11/8/1939 good
11/19/1931 good
11/19/1999 bad
11/24/1939 bad
11/25/1935 good
December
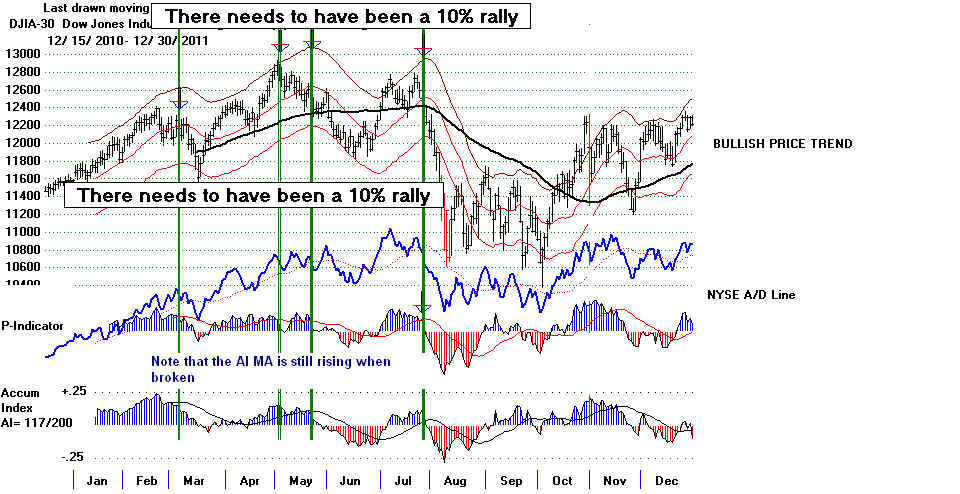
12/5/2011 bad
12/7/1955 good
12/8/1999 bad
12/28/2011 bad
12/31/1997 good
The average
decline at the time of the next Peerless Buy was 9.7%.
9 of the 23
Sell S4s would have allowed short sale gains on the DJI
of 9% or
more.
Below are
the S4s In order of the magnitude of the resulting decline before
a reversing
Peerless Buy signal. Sell S4s are important to Peerless because
they
sometimes occur when there are no other Peerless Sells and there was
also no A/D
Line non-confirmation warnings: notably in 1941 and 2001.
7/30/1937 35.8%
There was a Sell S9 two weeks later at final high.
The A/D Line failed to confirm the next DJI set of highs.
6/11/1946 22.0%
There was a Sell S5 two weeks before the S4.
The A/D Line confirmed the last DJI highs.
1/10/1966
21.3% A Sell S9, S12 and a Sell S15 occurred at about same time.
The A/D Line failed to confirm the next DJI set of highs.
5/17/2001 19.3% There were no other Peerless
Sells
The A/D Line confirmed the last DJI
highs.
7/17/1941 13.0% There were no other Peerless Sells
The A/D Line confirmed the last DJI
highs.
1/11/2000 13.0% There was a Sell S9 two
weeks later at final high.
A/D Line failed to confirm the next DJI set of highs.
4/21/2008 11.2% A Sell S9, S11 and a Sell
S15 occurred at about same time.
The A/D Line failed to confirm the next DJI set of highs.
1/16/1980 10.1% A Sell S9,
S121 and a Sell S15 occurred at final top 3 weeks later..
The A/D Line failed to confirm the next DJI set of highs.
10/5/2007 9.0% There
was a Sell S2 two weeks before the final high.
The A/D Line failed to confirm the next DJI set of highs.
Paper
losses averaged less than 1%. In 10 of the 22 cases, there was no paper loss.
The biggest
paper loss was 4.5%. All the rest were under 2.4 %. Users may
want to
work with a closing stop loss of 2.5%, but prepared to go short again
on a
subsequent major Sell.
Many of the Sell
S4s quickly led to a bear markets: 1937, 1940-1942, 1946, 1959-1960,
1966, 1977, 1987,
2000-2003 and 2007-2009.
Mid-year
Sell S4s are, by far, the most bearish.
7/30/1937
35.8%
2.9%
7/17/1941
13.0%
2.3%
6/11/1946
22.0%
none
5/17/2001
19.3%
0.5%
-------------------------------------------------
Avg. 22.5% 1.4%
The potency
of a Sell S4 varies a lot depending on which of the 4 years
in the
Presidential Election four-year cycle it occurs. The least bearish is
the year
before the Presidential Election. Sell S12s in the two years after
a
Presidential Election are the most bearish, averaging 22.7% and 12.2%
declines.
Presidential Election Year: Sell S4s
Gain Paper Loss
-------------------------------------------------------
10/3/1940
3.4% 1.1%
12/22/1976
5.1%
1.9%
1/16/1980 10.1%
4.5%
1/11/2000
13.0% 1.8%
9/6/2000
5.4% none
4/21/2008
11.2%
1.8%
9/21/2012
3.5%
0.2%
-------------------------------------------------
Avg 7.4%
1.9%
Year after Presidential Election Year:
Sell S4s
Gain
Paper Loss
-------------------------------------------------------
7/30/1937 35.8%
2.9%
7/17/1941
13.0%
2.3%
5/17/2001
19.3%
0.5%
-------------------------------------------------
Avg 22.7% 1.9%
2 Years after Presidential Election Year: Sell S4s
Gain
Paper Loss
-------------------------------------------------------
1/19/1938 5.3%
none
6/11/1946
22.0%
none
1/10/1966
21.3%
1.0%
1/3/1990
4.9%
none
2/3/1994
7.4%
none
-------------------------------------------------
Avg 12.2% 0.2%
3 Years after Presidential Election Year: Sell S4s
Gain
Paper Loss
-------------------------------------------------------
7/2/1943
5.2% 1.5%
7/11/1947
2.7%
1.2%
10/22/1947
2.5%
none
9/17/1951
5.3%
none
9/22/1955
5.7%
none
8/3/1959
6.0%
none
11/22/1983 2.4%
0.9%
8/26/1987 5.2%
none
10/15/2003 1.8%
0.4%
10/5/2007
9.0% 0.7%
-------------------------------------------------
Avg
% %
Sell S4s:
1928-2013
---------------------------------------------------------------------------------------------------------------------
la/ma
21-dma P-I P-I
Adj
IP21 V-I
Opct. 65-day
ann-roc change
PI
Pct Change
X
2/7/1930
declined only to ma 1.04 .839
67 -14
339 .
042
71 .306
.022
high
-----------------------------------------------------------------------------------------------------------------------
(1)
7/30/1937
35.8% 2.9% 1.022
.976 93 -15
415 . .14
73 .282 .075
highest
up 13% from 65-day low.
------------------------------------------------------------------------------------------------------------------------
(2)
1/19/1938
5.3% none 1.022
.019 -40
-19
209 . -.061
-159 -.077 -.042
8.8% gain if Extreme Bearish Mode B7 on 6/20/1938 at 118.6 was used to reverse the Sell.
up 13% from 65-day low.
-----------------------------------------------------------------------------------------------------------------------
(3)
10/3/1940
3.4% 1.1% 1.024
.262 60 -13
304 .053
48 .032
.105
up 21% from 65-day low.
----------------------------------------------------------------------------------------------------------------------
(4)
7/17/1941
13.0% 2.3% 1.014
.381 75 -21
404 .098
68 .328 .065
7/24/1941 13.7% 1.2% 1.015
.509 102
6 546
.126 91
.31
.099
up 10% from 65-day low.
-----------------------------------------------------------------------------------------------------------------------
(5)
7/2/1943
5.2% 1.5%
1.018 .076 26
-7 136
.076 -37
.177 .049
Best to wait a few days to sell when signal occurs right before July
4th.
---------------------------------------------------------------------------------------------------------------------
(6)
6/11/1946
22.0% none 1.001
.114 0 -48
1
.143 -55
.21 .073
up 12% from 65-day low
OK for
June
-----------------------------------------------------------------------------------------------------------------------
(7)
7/11/1947
2.7% 1.2% 1.037
.677 191 -6 799
.167
161 .409
.062
highest but A/D data in '47-'48 seems questionable
-----------------------------------------------------------------------------------------------------------------------
(8)
10/22/1947 2.5%
none 1.025 .424 72
0 303
.084 42
.321 .004
up 12% from 5-month low
-----------------------------------------------------------------------------------------------------------------------
(9)
9/17/1951
5.3% none 1.018
.424 96 -25
292
.137 69 .24
.081
up 13% from 65-day low
-----------------------------------------------------------------------------------------------------------------------
(10)
9/22/1955
5.7% none 1.024
.719 94 -14
270 .07
32 .298
.08
note modification in B17 at end of Sept.
Disallowed because of sharpness of decline.
up 17% from 4-month low
-----------------------------------------------------------------------------------------------------------------------
(11)
8/3/1959 6.0%
none 1.02
.418 4 -9 13
.068 -196 .434
.078
up 17% from 5-month low
-----------------------------------------------------------------------------------------------------------------------
X
911/1963 -0.9% 2.7%
1.021
.493 78 -10 221
.024
-26 .455
.032
too high
up only 12% from 6-month low
-----------------------------------------------------------------------------------------------------------------------
(12)
1/10/1966 21.3% 1.0% 1.02 .443
37 4
96 .01
6
.097 .049
up only 17% from 6-month low
-----------------------------------------------------------------------------------------------------------------------
11.21
what about?
5/11/1971
.997 .134 -87
-5 -184
.073 -1
.115 .065
5/14/1971
.995 -.027 -120
-17 253 .07
-2 -.101
.058
low low
-----------------------------------------------------------------------------------------------------------------------
(13)
12/22/1976 5.1% 1.9% 1.02
.354 214 -7
396
.066 2
.292 -
.011
up only 7% from 2-month low
-----------------------------------------------------------------------------------------------------------------------
what about?
4/6/1979
1.02 .428 147
-26 280
..003 3
.169 .056
----------------------------------------------------------------------------------------------------------------------
what about?
8/27/1979
1.02 .627 192
6 364
.201
5 .085 .054
high
------------------------------------------------------------------------------------------------------------------------
(14)
1/16/1980 10.1%
4.5% 1.025
.317 67 -19
129 -.016
2 .026
.03
up only 10% from 2-month low
low
-----------------------------------------------------------------------------------------------------------------------
(15)
11/22/1983 2.4%
0.9% 1.028
.258 42 34 84
.044 -2
.268 .057
up 10% from 65-day low
low
-----------------------------------------------------------------------------------------------------------------------
(16)
8/26/1987 5.2%
none 1.023
.824 96 -21 190
.189 17
.231 .148
up 22% from 65-day low
low
-----------------------------------------------------------------------------------------------------------------------
(15)
1/3/1990 4.9%
none
1.027 .27 36 -15 71 .08
-4 -.093 .041
up 9.5% from 65-day low
-----------------------------------------------------------------------------------------------------------------------
(17)
2/3/1994 7.4%
none
1.019 .517 146 -23 231
.151 9
.333 .067
up 12% from 65-day low
-----------------------------------------------------------------------------------------------------------------------
(18)
1/11/2000
13.0% 1.8% 1.017
.302 -30 -57 -30
-.06 68 .239
.074
low
-----------------------------------------------------------------------------------------------------------------------
(19)
9/6/2000 5.4% none
1.017 .476 103 -12 103
.013
-6
.392 .043
up 10% from 65-day low
Should
a B2 reverse in late September of a Pres Election year.
-----------------------------------------------------------------------------------------------------------------------
(20)
5/17/2001 19.3% 0.5% 1.039 .698
327 -15
318 .136 34
- .005 .03
up 10% from 65-day low
-----------------------------------------------------------------------------------------------------------------------
(21)
10/15/2003 1.8% 0.4% 1.025 .294
305 -102
295 .016 -30 .026
.068
up 9% from 65-day low
-----------------------------------------------------------------------------------------------------------------------
(22)
10/5/2007 9.0% 0.7% 1.027 .612
270 40
243 .05
54 .258
.035
up 10% from 65-day low
-----------------------------------------------------------------------------------------------------------------------
(23)
4/21/2008 11.2% 1.8% 1.024 .442
281 -92
253 .027
4 -.011 .027
up 9% from 65-day low
low
-----------------------------------------------------------------------------------------------------------------------
(24)
9/21/2012 3.5%
0.2% 1.021
.365 331 55
331 .014
23 .205 .055
up 12% from 65-day low
high
-----------------------------------------------------------------------------------------------------------------------
Number = 24
Avg.= 9.7% 0.9%
1.02
.43
107 -17 214
.06 4
.183 .052
1987 Top
Watch for Accumulation Index Breakings below its 21-dma
after a DJI rally of 9%, especially in the Summer
Even if
there is no Sell S4, you will want to watch the Accumulation Index on the
DJI.
Its dropping below its 21-day ma after a substanial DJI rally is a
often a
reliable
warning of a coming sell-off. This is especially true in the second half of
the
year before
a Presidential Election. In early 2011, I warned here that "2011 may see
a
signicant
top." That was because 10 of the 23 completed Sell S4s took place in the
second half
of the year BEFORE a Presidential Election Year.
Sell S4s
occur most frequently between August and February. February gains are
somewhat lower than average. Paper losses are most likely from December to February.
Sell S4s and Month of the
Year
Gain
Paper Loss
January
1/10/66
+ 21.3%
1%
up `8% from
June low. Sell S12 followed..
1 970 breakout support held on one test and then was violated.
1/16/80
+10.1%
4%
up 10% from Nov
loq. S12, S9, S15. followed.
1/3/90
+4.9%
none
up 10% frpm Oct low. S15. followed.
1/11/2000
+13.0%
2%
up
14% frpm Oct low. S15. followed.
February
2/3/94 +7.4%
none
March
April
4/21/2008 +11.2%
3%
May
5/17/01
+19.3%
none
June
July
7/30/1937
35.8%
2.9%
7/17/1941
13.0%
2.3%
August
8/3/1959
6.0%
none
8/26/1987 5.2%
none
September
9/17/35
+5.1%
none Also S8 Up 38% from March low.
only declined to LB.
9/17/51
+5.3%
none Up 24% from June
low.
9/22/55
+6.3%
none Up 24% from March low.
9/6/2000 +5.4%
none
Up 16% from March low.
9/21/2012 +3.6%
none Up 12% from May low.
October
10/3/1940
+3.4%
1.1%
10/22/1947
+2.5%
none
10/15/2003 +1.8%
0.4% UP 30% from March low.
Declined only to 65-dma and to B10 breakout point/ ut
10/5/2007
+9.0%
0.7% UP 27% from March low.
November
11/22/1983
+2.4%
0.9% UP 11% from
August low.
December
12/22/1976
+5.1%
1.9% 1.02
-------------------------------------------------------------------------------------------------------------------------------
4/9/2013
Program Code for
testing the Sell S4 at any time of year
For i = 66 To RN
If la(i) / ma(i) > 1.0398 Then 33411
If newipxxx(i) > .19 Then 33411
If opma(i) > .45 Then 33411
minlow = 99999999
For J = i - 65 To i - 5
If la(J) < minlow Then minlow = la(J)
Next J
If (la(i) - minlow) / minlow < .09 Then 33411
If newipxxx(i - 1) > maip21(i - 1) And newipxxx(i) < maip21(i) Then s9(i) = 4: ms(i)
= 4: pi = i: s4arrows (pi): i = i + 5
33411 Next i
+++++++++++++++++++++++++++++++++++++++++++++++++++++++++++++++++++++++++++++++++++++
Older Peerless
Versions
+++++++++++++++++++++++++++++++++++++++++++++++++++++++++++++++++++++++++++++++++++++
2011
Version Sell S4s:
1929-2010
  Date         DJI           Gain     Paper Loss  10% Downside Achieved?
----------------------------------------------------------------------
 2/5/1930     250.60                    +1.3%                     7%                 YES ....After peak 10 wks later.
  Leads to bear market
   2/1/1934           108.50                   + 4.8%                    none                YES ....10% decline 3/27/34.
   9/17/1935         133.10                   + 3.8%                    none                            4% decline 10/3/1963
  10/3/1940            135.10                  +11.2%                  none                YES ....12% decline 2/14/34.
  Leads to bear market
 10/22/47              184.40                     +4.2%                 none                YES ....10% decline 11/30/49.

   9/17/51                 274.10                    +5.3%                 none                             7% decline 11/8/1952
  9/22/55                 486                          +6.3%                none               YES ....10% decline 10/11/55.
    8/3/59                   678.10                    +6.0%                none                             9% decline 9/21/1959
    Leads to bear market                                                            YES ....10% decline 2/17/60
    9/11/63                 740.30                    +3.9%                  3%                              4% decline 11/22/1963
   1/10/66                   985.41                  + 11%                  1%                 YES ....10% decline 5/10/66
    Leads to bear market

   12/11/72               1036.27                   + 8%                     2%               YES ....10% decline 3/22/72
   12/22/76                 984.54                  +5.1%                 none      YES ....10% decline 8/8/77
  Leads to bear market
   1/16/80                  865.19                  +2.3%                   4%                  YES ....10% decline 3/24/80
    Leads to mini-bear market
   11/22/83               1275.81                 +11.8%                none               YES ....10% decline 2/22/84
    Leads to mini-bear market
    8/26/87                 2701.85                  +5.2%                 none               YES ....10% decline 10/14/87
    Leads to bear market

    1/3/90                   1809.73                  +7.4%                  none              YES ....10% decline 1/29/87
    2/3/94                    3975.54                 +7.4%                 none               YES ....10% decline 4/4/94
    Leads to bear market
    1/11/2000           11511.08                 +4.8%                   2%                YES ....10% decline 2/14/2000
    Leads to bear market
     9/6/2000             11310.64                 +9.6%                 none              YES ....10% decline 10/12/2000
     Leads to bear market
     5/17/01              11249                     +22.1%                 none              YES ....10% decline 7/11/2001
     Leads to bear market

     10/15/03               9803.05                   -0.6%                 -0.6%     NO  -  only shallow decline.
     10/5/07               14066.01                   +6.0%                 1%       YES ....10% decline 1/8/2008
  Leads to bear market
  4/21/2008           12825.02                +11.2%          3%       YES ....10% decline 6/26/2008
  Leads to bear market
==========================================================
                      Number of trades =  23
                                                   Avg. Gain=   6.9 %
                                                   There was only 1 loss.

    In 4 of the 23 cases the paper loss was 3% or more.
    The biggest paper loss was 7.% (February 1930)
    9 of the 23 brought short sale gains of more than 7.3%
                          at the time of next Peerless Buy.
    16 of the 23 casaes saw declines of more than 4.7%
     Sell S4s Are Signals Occur Only in Certain Months
              of the 4-Year Presidential Cycle:

               Sell S4s cannot and do not occur at any time in the year.

               Presidential Election Years -
               8 cases:  January (2x), April, September (2), October and December (2)

               The Year after a Presidential Election Year: Signal Excludes Januaries - March
               1 case: May
               (Why do not more Sell S4s occur in this year?  Probably because this year
               is often weak or rallies with very strong internals, as in 2009.)

               Two Years after a Presidential Election Year: They can occur any month, on theory.
               5 cases: January (2x) and February (3x)

               Three Years after a Presidential Election Year: Signal Excludes Januaries - March
               10 cases: August  (2x), September (5x), October (3x), November
      (Almost half of the signals occur in the third year of the Presidential Election,
                a year when rallies are common.)

               Normally the range of key values are:
                      LAST/MA  1.017 to 1027 .... near upper band
                      AnnRoc  .25 to  .70 ... rising
                      IP21      -.06 to +.19 ... weak and weakening.
                      V          -68  to + 73 ... (Not much of a limiting factor.)
                      OPMA  -.02 to +.46  ... (Not much of a limiting factor.)
Sell S4s in a Presidential Election Year. 1928, 1932, 1936...
2000, 2004, 2008. There have been 5 valid Sell S4s in a Presidential
Election Year. Each brought a decline below the lower band. They
averaged declines of 7.3% at the time of the next Peerless Buy.
1. 1940 10/3/40 <LB reversed by 2/28/41 B19 at 119.90 +11.2%
135.10 1.024 .262 60 .053 48 .029
2. 1972 12/11/72 <LB paper loss of and then +8.0% gain
1036.27 1.019 .558 152 .112 2 .357
3. 1976 12/22/76 +5.1% <LB This marked top before bear market.
984.54 1.02 .354 214 .068 2 .286
4. 1980 1/16/1980 <LB +2.3% 4% Paper Loss. This marked top before bear market.
865.19 1.025 .317 67 -,016 2 .026
5. 2000 1/11/2000 <LB
+4.8% Paper Loss 2%
11511.06 1.017 .302 -30
-.06
-68 .239
6. 2000
9/6/2000 <LB +9.6% gain Decline began
immediately
11310.64 1.017 .476 102
.013
-6 .391
7. 2008 4/21/2008 <LB +11.2%
Paper Loss 3%
12825.02 1.024 .442
282 -91 .025
5 -.012
8. 2012 9/21/2012 OPEN
13579.47 1.021 .365 +331 +55
-.014 .23 .216
--------------------------------------------------------------------------------------------------------
All seven went below the lower band
Avg. Gain = +7.4%
------------------------------------------------------------------------------------------------------------------------------------
            Note that a Sell S4 is not allowed in February or March  in a Presidential Election year.
            The 4 such cases in these months are shown below.
BAD  1936 2/5/36   Gain = + 1.3%
           150.60  1.025  .463  77      .022     73       .017
           DJI rallied to 160 on 4/3/36.  Paper loss = 7%.
           DJI then fell below lower band.

BAD  1936  3/20/1936  Gain = +5.6%
           157.40  1.019   .231    -34    -.043  -269   .088
           DJI rallied to 160 on 4/3/36.  Paper loss of 2%.
           DJI then gell below lower band.

BAD 1972   3/9/72      Lloss for 3 months +3.3%
             942.81  1.018  .349   101   .024       1     .064
            Sell S4s  in the first year after a Presidential Election.
             1929, 1933, 1937...  2001, 2005, 2009.

        1       2001  5/17/01    +22.1%  <LB    Decline began immediately
                 11249      1.039    .698             327    .136              34   -.005
 4 1990 1/3/90 <LB +7.4% 10% decline started immediately.
1809.73 1.027 .27 36 .08 -3 .-093
4 1990 1/3/90 <LB +7.4% 10% decline started immediately.
1809.73 1.027 .27 36 .08 -3 .-093