TigerSoft
New Service
TigerSoft
New Service BANKERS' "PUMP AND DUMP" =
WATCH OUT, SMALL INVESTORS!
10/31/2009 TIGERSOFT/PEERLESS HOTLINES:
SAMPLES FROM THIS WEEK
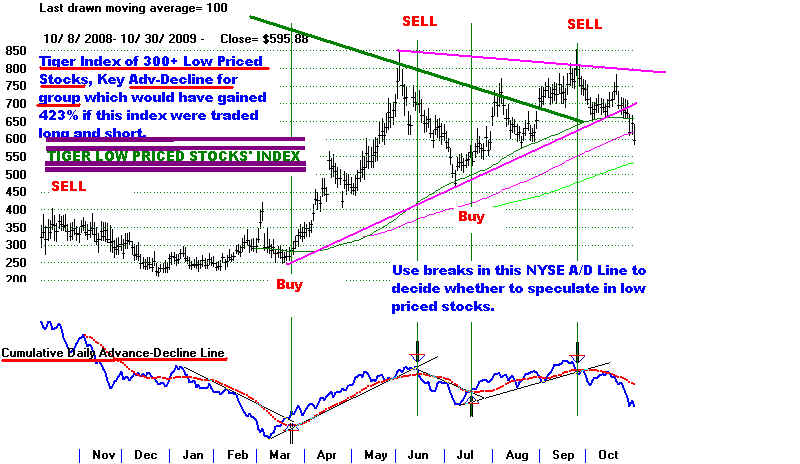
Tiger Index of Low Priced Stocks: 2008-2009
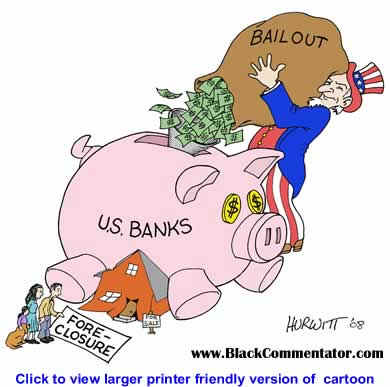
BE WARY OF BANKERS' DUMPING STOCKS
THEY BID UP WITH YOUR MONEY
by William Schmidt, Ph.D. (Columbia University)
Since March 2009, many low-priced stocks have risen 1000% or more. This always
ends badly. See the Blog I wrote in June: The Great 2009 Bull Market. At that point
50 stocks were up more than 400% from the bottom. Now these "pump and dump"
low-priced stocks are breaking down. Mayber, there's another rally still for them.
But considering the size of their advance and how much money the Fed and Treasury
have already given banks, I seriously doubt if the rally is sustainable. The evidence
is too strong that the banks have used the money to play the stock market and
not make loans to Main Street.
These binges always end bandly. The 1999-2000 net and biotech bubble is still in
most traders' memories. Oil stocks are particularly susceptible and vulnerable to
wild swings up and then DOWN. I was weaned on the 1968 speculative market "
in low priced and tech stocks. Investors should not fall in love with high-fliers.
But they do. Just as economic power is subject to an iron law than destroys
competition and creates monopolies, so to there is an iron law that produces
speculative booms and busts. Both of these iron laws reinforce each other unless
the government aggressively intervenes. Conservative free-trade promoters have
not figured this out.
1968
| Company | 1968 High | 1970 Low | % drop | P/E at High |
| Fairchild Camera | $102.00 | $18.00 | -82% | 443 |
| Teledyne | 72.00 | 13.00 | -82 | 42 |
| Control Data | 163.00 | 28.00 | -83 | 54 |
| Mohawk Data | 111.00 | 18.00 | -84 | 285 |
| Electronic Data | 162.00 | 24.00 | -85 | 352 |
| Optical Scanning | 146.00 | 16.00 | -89 | 200 |
| Itek | 172.00 | 17.00 | -90 | 71 |
| University Computing | 186.00 | 13.00 | -93 | 118 |
 |
 |
UNDISCLOSED SPECULATING WITH OTHER
PEOPLE'S MONEY IS CRIMINAL
Theodore Dreiser wrote a
novel, "The FInancier", more 70 years ago in
which a banker uses his connections to borrow
big sums from a city government
to buy stock with an interest rate of 0%.
He takes the stock he buys and uses
it as collateral to buy more stock, thereby
pushing up his stocks' prices. As prices
rise, his collateral rises. So he borrows
more and invests more. When a financial
panic comes, he loses everything. He
cannot pay the city back and actually goes to jail.
The only difference now is that no one from
Goldman Sachs will ever go to jail, even
though they are using the money they have
borrowed from taxpayers and the US
Federal Reserve to trade in and out of stocks
electronically.
One of the lessons of the stock market collapse of 87% from September 1929
to July 1932, should have been that banks not
not be allowed to buy stocks and sell
stocks and bonds. When banks become
brokerages, you get the situation
where their mortgages are packaged with
"AAA" ratings and sold to the innocent
and unsuspecting. Particularly galling,
Goldman knew it was selling junk when
it sold $40 billion in mortgages in 2006 and
2007. Why else would it simultaneously
buy $14 billion in CDS from AIG and set up a
$10 short-selling hedge?
"The Securities and Exchange Commission
should be very interested
in
any financial company that secretly decides a financial product is a loser
and
then goes out and actively markets that product or very similar products
to
unsuspecting customers without disclosing its true opinion," said
Laurence
Kotlikoff, a Boston University economics professor who's proposed
a
massive overhaul of the nation's banks. "This is fraud and should be prosecuted."
(
Source )
Such
leverage, power and fraud are always very dangerous to the overall economy,
which depends on confidence, and disastrous to
politcal democracy. Fraud, corruption,
booms and busts were bound to follow banking
de-regulation. But the hard fought
Glass Steagall
1930s' legislation that denied banks the right to become stock
brokerages and investment banks was torn down.
American regulators, Congressmen,
Fed Chairmen and Presidents all ignored the lessons
of history, just as now. Now we
must be prepared again to pay for their
well-rewarded, convenient and venial amnesia.
( Sources )
A year ago, it was obvious to me and millions of Americans that giving a trillion
dollars unconditionally to the biggest, most corrupt
bank monopilies was just
yet another plan, like the
Iraq War, to rob the exhausted US Treasury utterly bare.
We predicted the banks would not use the money to
make new loans or cut homeowners
a break. Banking executives feel a
bewildering sense of sense of entitlement
considering how badly thgeir decisons laid low the
world economy in 2008.
Now,
we are about to see what will happen when the reality of economic
stagnation and widespread depresion conditions
on Main Street overtake the
schemes and machinations of the Wall Street
wizzards that have artificially
bid stocks up so much so quickly on such light
volume.
Goldman
admited it manipulates market when the
compute program it used to do this
was strolen. And until recently, the NYSE
and NASDAQ reported how extensively
member firms were trading for their own
account. Goldman Sachs' share of principal
NYSE trading has gone from 27 percent at the
end of 2008 to fully 50 percent of trades
in the second quarter. This is 20% of all
NYSE trading. Eliot
Spitzer and Blogs such
as
Zero Hedge have been using NYSE data to argue
that Goldman Sachs now has an
almost unfettered ability to control stock
prices. IIn
July, the NYSE bowed to Goldman.
It
now refused to publish this information any longer.
See also
Goldman Sachs: "Engineering Every Major Market Manipulation Since The
Great Depression" (GreenLightAdvisor Views, 6/26/09)
Goldman Sachs: Manipulation Kings of the Market? (Market folly,
6/25/09)
Goldman Sachs Trading Source Code Stolen (The Swamp Report, 7/6/09)
Taibbi
v. Goldman - round 2 (The Swamp Report, 6/30/09)
McClatchy: http://www.mcclatchydc.com/227/story/77791.html
How Moody's sold
its ratings — and sold out investors
Firms are getting
billions, but homeowners still in trouble
Watchdog: Obama's
mortgage relief efforts aren't good enough
Where did that bank
bailout go? Watchdogs aren't sure
Worse than
subprime? Other mortgages imploding slowly
Banks fight to kill
proposed consumer protection agency
Why haven't
any Wall Street tycoons been sent to the slammer?
Nothing good will come out of the enrichment of each Goldman Sachs employees
to the tune of an average 2009 bonus of
$700,000. American home-owners are still
defaulting in record numbers, real unemployment
is over 15% and the only light at the
end of the tunnel is the train of Depression
coming closer and closer. Ordinary
consumer buying power is hardly making a
recovery, except where the Government
has offered temporary tax subsidies.
Without a national job program and guarantee
and without a much more equal distribution of
wealth, it sure looks like we are
doomed to re-live the 1930s, at worst, or the
1970s, at best. Both eras were
dismal. For investors, they put a premium
on market timing, as stock prices
periodically rose and then collapsed
(1929-1932, 1937-1938, 1966, 1969-1970, 1971,
1973-1975, 1977-1978, 1978, 1979, 1980,
1981-1982). For workers, there were lay-offs,
hiring freezes and chronically high
unemployment. For seniors, the collapsing Dollar
meant harder and harder choices as their
depreciated savings ceased to cover their
rent, food and medicines.
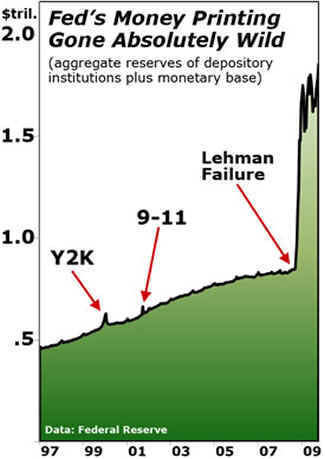
The Federal Reserve under Bernanle has pumped into banks much, much more
liquidity than we have ever seen. Such
Fed infusions also took place from October
1999 to January 2000 (laying the basis for an
even bigger internet bubble and bust);
after the September terrorist attack on New
York (which resulted in a 7 month
bear market rally that ended in April 2002 and
was followed by a big decline until
March 2003. "Up until the day Lehman Brothers collapsed in
September of last year,
it took the Fed a total 5,012 days
— 13 years and 8 months — to double the cash
currency and reserves in the coffers of
U.S. banks. In contrast, after the Lehman
Brothers collapse, it took
Bernanke’s Fed
only 112 days to double the size of U.S.
bank reserves. He accelerated the pace of
bank reserve expansion by a factor of 45 to 1.
http://www.marketoracle.co.uk/Article13574.html
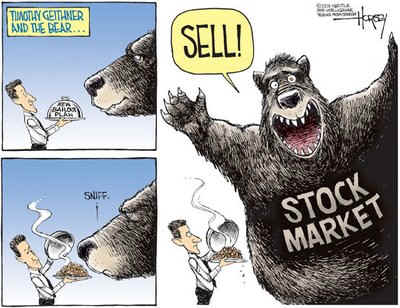
MAJOR SELL "S12" FROM PEERLESS
10/31/2009 TIGERSOFT/PEERLESS HOTLINES:
SAMPLES FROM THIS WEEK

(C)
2009 www.tigersoft.com
Call 858-273-5900.
Email us: william_schmidt@hotmail.com
About Us
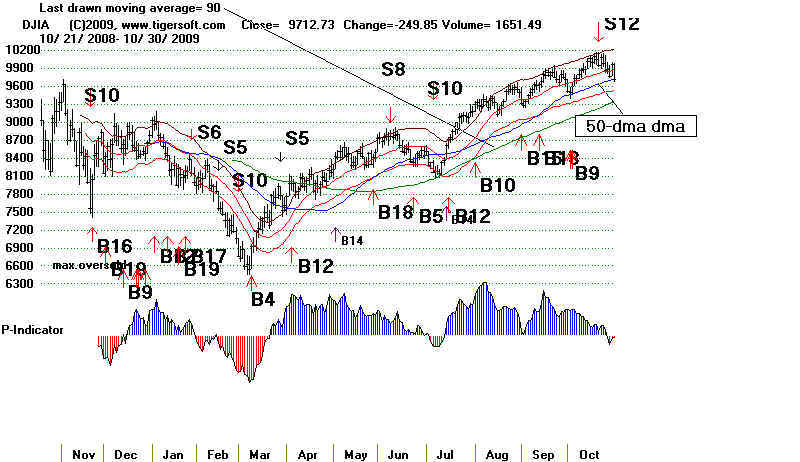
Below is the current Peerless chart, 10/30/2009, and below are recent Hotline
comments and recommendations to show you how we judge the market
as of this date.
TigerSoft and Peerless Daily Hotline
10/29/2009
===> Order form to Renew On-Line, "Nightly Peerless/TigerSoft Hotline " ($298/Year)
MAJOR SELL
We recommend using Peerless Stock Market Timing to judge the
trend of the general market. That will also tell you the likely
direction
of your stock, because most stocks rise and fall with the general market.
Here is the current Peerless chart of 10/30/2009. You can see the most
recent signal is a Sell. We do a Hotline each night, to tell users and
subscribers
what we take to be the direction of the market and where it is apt to go
on an intermediate-term basis. It shows the current chart and then
gives
the perspective we have on the market after considering Peerless, TigerSoft,
chart patterns, historical parallels, seasonality and internal strength
indicators.
The Hotline also makes occasional specific recommendations.
BE WARY OF BANKERS' DUMPING STOCKS
THEY BID UP WITH YOUR MONEY
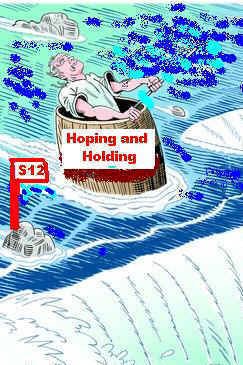
10/29/2009 Sell S12 Operating.
Only A Technical Bounce.
QQQQ Is Still below Resistance of Its 21-Day.
I probably should have awaited for the DJI and QQQQ to break their 50-day ma
before becoming to Haloweenish last night. The fact is that
though volume has been weak and
the S12 shows distribution, breadth has been constructive,
There was no Sell S9 signal.
And it is possible if the P-Indicator does not deteriorate much, we may
get a Buy B9 in a week
or two. None can occur for two weeks after a Sell S12.
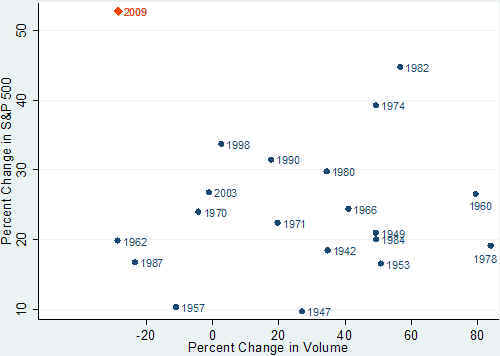
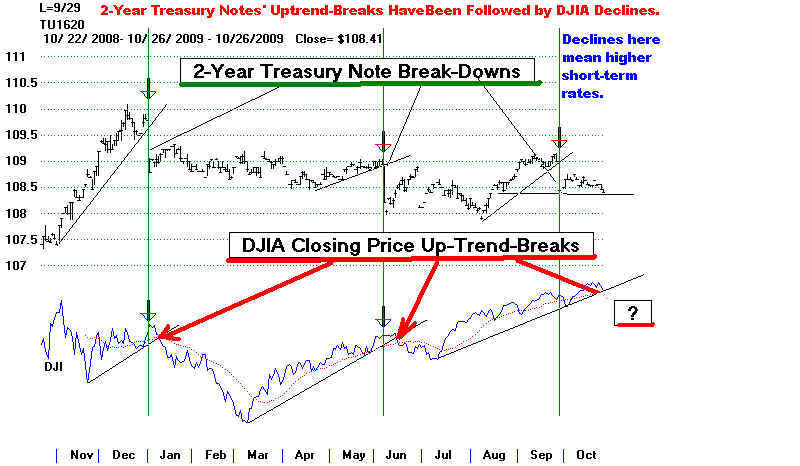
I came across an interetsing chart today. It shows that the 6
month advance in
the DJI is the highest of any new bull market on the lowest and most
negative volume.
Breadth has saved the rally thus far. Perhaps, it will still.
The shallower uptrend
of the NYSE has not yet been violated. The creator of the chart below states that
"if you think of volume as fuel for any
sustainable market rally, then we’ve been
running
on fumes for a few months."
6 Month Gain and 6 Month
Change in Volume
The DJI rebounded 100 today as it
turned up from a little above its rising 50-day ma.
The ratio yesterday of NYSE advances to declines was 1 to 9.
Today's ratio was 4.8 to 1.
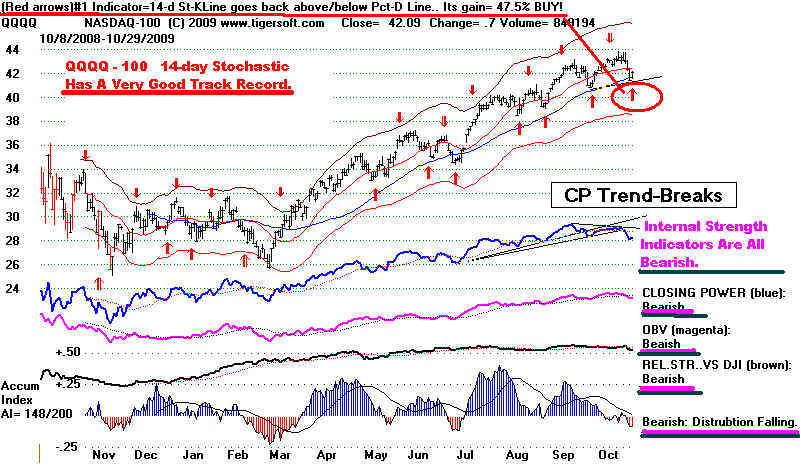
Volume was lower than yesterday. The QQQQ (chart below) was
typical of the long general market
ETFs. After four staight down days, it rose today and gave
a red optimized Stochastic Buy based
on the short-term 14-day Stochastic. The bounce occurred
just where one might look for
one, up from the rising 50-day ma. How far will it advance.
It is still below the resistance
of its now flat red 21-day ma. Most important, all
its key internals are rated "negative' by
the Tiger program. I
QQQQ Internals:
1. The Blue Closing Power is below its
falling 21-day ma.
2. The Magenta OBV is below its falling
21-day ma.
3. The Brown Relative Strength Quotient
is below its falling 21-day ma.
4. The Accumulation Index is Red
(negative) and below its fall 21-dma.
5. The Tiger Dat Traders' Tool is below
its falling 21-dma.
Gold (GLD) rembounded from
the 100 breakout point. The Dollar Fell back from its falling 50-day ma
I would say GLD is at a good buy point again. See the chart
below.
DJI rebounds like we saw
today (10/29/2009) from a rising 50-day ma are normal.
But they do not mean a
big recovery. Below are the historical cases most resembling
the current S12. I have posted in immediately below what the DJI did after the S12
upon
first reaching the rising 50-day ma. Brief bounces do occur. But they
are meaningless
from an intermediate-term perspective because the lower band was always soon hit.
10/28/200 Sell S12 Operating. Bankers' Pump and Dump.
The lower band at 9500 is the first
downside target for the DJIA. Today's DOW closing
below the support of its 21-day ma
invites such a test after the SELL S12. As I showed
yesterday, a deeper decline is more
typical after a bull market S12 with negative OPCT
readings on the last peak.
Confirming that prognosis, the DJI fell 120 today and the rest
of the market dropped even harder.
Downside volume on the NYSE was 10 times
Upside volume. It's been six months
since the number of NYSE advancers was this
low. The number of new lows on the
NYSE was only 11 and on the NASDAQ was only 33.
So, at this stage, what is happening is
that a great many stocks are viciously and quickly
breaking down below their 50-day ma.
They are slicing through this usual support as though
it was non-existent. And, in fact,
it may not be. That is what happens in a classic "pump and
dump". The stock is mostly
dumped on the way down to investors who think that they
are gtting a bargain.
Dumping like this is dangerous.
It reminds me of the classic "Pump and Dump"
manipulation.
This time it is being done by the
likes of Goldman Sachs. JP Mortgan and Bank of America.
So, not only did these banks
"steal" (in my opinion, that is the only word that applies) trillions
from the general public with the
help of Paulson, Geitner and Bernanke, now they are
dumping the over-priced stocks they
recklessly bid up onto the very same people who bailed them
out. What gratitude! No
wonder Glass-Steagall forbad commercial banks for 80 uears from
being investment banks and
brokerages. If I am right, when the whole story comes out about
this "Bankers' Pump and
Dump", buy the stock in the company that makes pitch-forks!
 Reading about Pump, Dump and Bankers:
Coming
Soon: More Scandals. Dec. 1, 2005
Criminal Environment Is Created by US Government
Jan. 12, 2005.
Does
Goldman Manipulate The Stock Market?
About that stock
manipulation software Goldman Sachs owns ...
Manipulation
is rife on stock markets « melange
Goldman
Sachs Market Manipulation Dominance at Risk by Theft

THE RISKS OF HOLDING SEEM QUITE HIGH
Technically, the rapid falling below the
50-day ma on very high volume is a clear warning.
Normally, it can be taken as just a
warning unless the stock's Accumulation
Index readings are negative. Then
it must be taken as a SELL, especially when
market conditions look artificial and
over-extended, as now. I think the low volume rallies
and the NYSE own statistics show that the
advance has been pushed up artificially by
banks with public funds. But just
given how far the market has risen, how there has not
been a double-bottom and the history of
the type of Sell S12s we just had, I believe such breaks
in particular stocks make then necessary
and reasonable Sells. There is too much risk not to sell.
A closing below their 65-day ma is more
emphatically a Sell. Use that if you want to be surer.
I think that is what is coming.
If selling is too hard emotionally to do or because you want profits to be
postponed for tax
purposes, then buy some of the leveraged
ETF puts I mentioned last night. This is the approach
I have taken on our Stocks' Hotline.
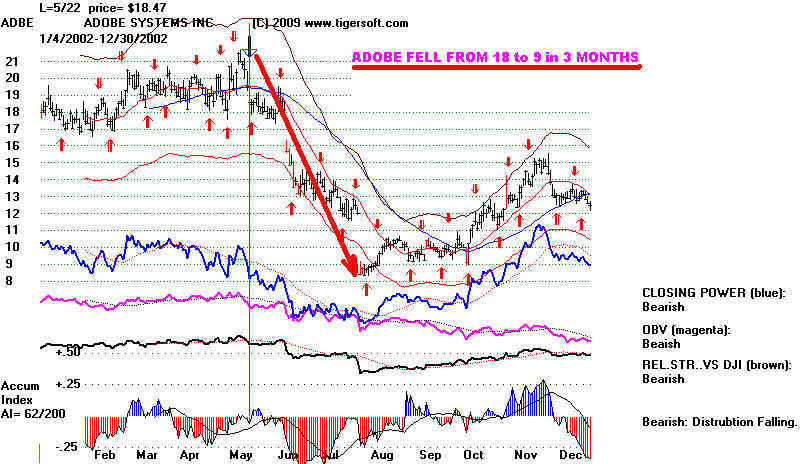
I want to show some typical NASDAQ-100
stocks back in 2002 after the 7 month's uptrending
A/D Line then was broken. See how
quickly these stocks caved in when the NYSE Advance-
Decline-Line was broken then. So
far, only the steeper Advance-Decline Line has been broken.
But with prices and the A/D Line up so
much and so over-extended, it is usually best to employ
the steeper uptrend.
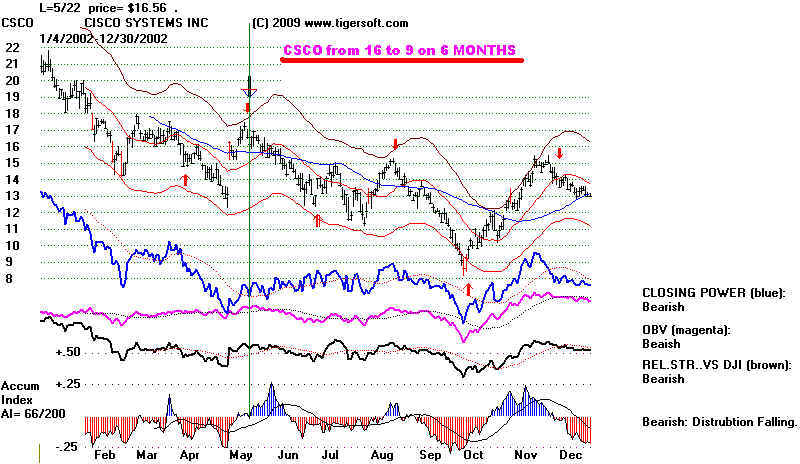
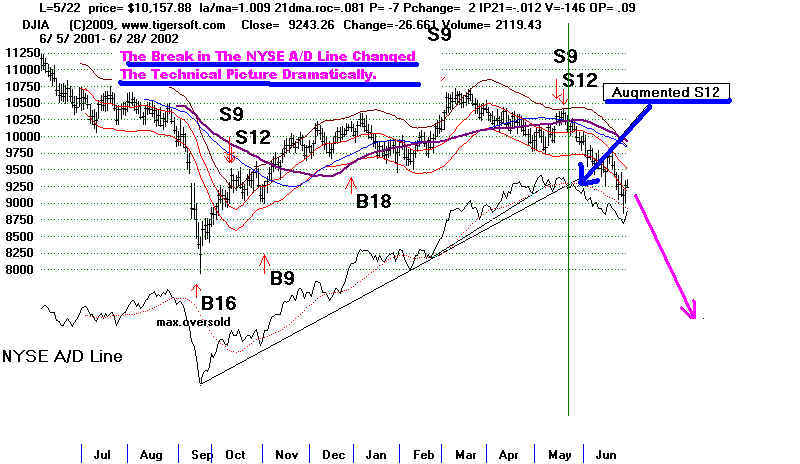
FIRST, NOTE HOW THE BREAK IN THE A/D LINE UPTREND ON 5/22/2002
CHNAGED THE TECHNICAL PICTURE OF THE MARKET DRAMATICALLY.

SECOND,
SEE HOW THESE STOCKS COLLAPSED AFTER 5/22/2002.
Not shown here, QQQQ
fell from 31.40 to a low of 20 five months later.
AAPLE fell from 12 to 7 in 3-4 MONTHS
ADOBE FELL FROM 18 to 9...
CSCO FELL FROM 16 to 9.


10/27/200 Sell S12 Operating.
The Peerless Current Sell S12 is made more bearish by the fact that as the
Sell S12 was occurring, the OPCT was
negative. Since 1928, there have only been six cases
of an independent Sell S12 with a
negative OPCT while the DJI had been in a sustained
uptrend and was above a rising 65-day ma.
The average decline was 12.7%. If you are
bullish still, it is important that the
DJI now NOT drop below the lower 3.5%-4.0% lower
band. We can hope that the
bullish period after the third week of November prevents a
bigger decline, for the sake of all those
that are already jobless.
The research I did tonight on the HOTLINE suggests a 13% decline in the DJI if past
volatility applies. This past year's
volatility has been twice to three times greater. We do not want
to be in stocks that will eventually sell
off as confidence erodes. In additon to selling thinner
stocks that have run up a long ways, look
at the ETFs that allow aggressive leveraged short
selling, Two criteria can be used:
1) high levels of Accumulation and 2) the surpassing the 50-day
ma. TigerSoft Data permits
downloading the large number of leveraged short ETFs.
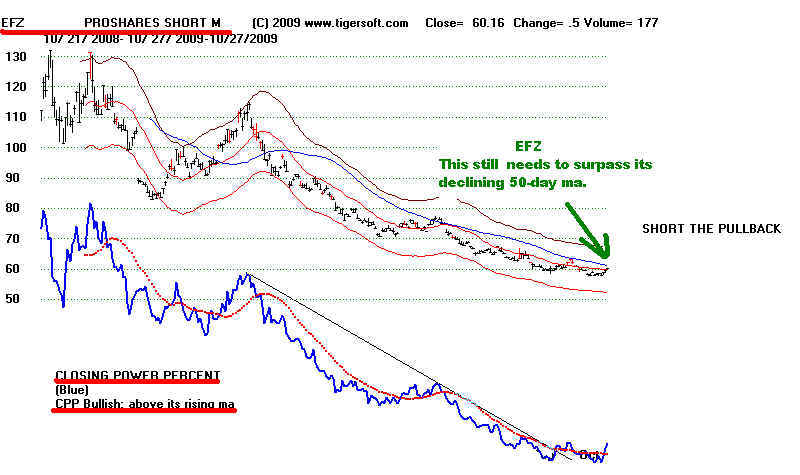
Here are the ones that look the most
interesting as purchases, either to hedge portfolios
or to be aggressively short: RWM
47.86, SBB 42.37, EFZ 60.16 - IP21= + .34 and
EWV 52.74 and SSG 24.28
Parallel SELL S12s' Statistics
Cases since 1928 Most Resembling Current Sell
S12 with negative OPCT.
.
Formula:
(On-Balance-Volume Pct = 21 days' OBV/Volume for 21 days)
Cases Most Resembling Current S12 with
negative OPCT.
Here they are:
Outcome:
1.
8/24/38
143.50 Fell immediately,
reaching 129.90 below lower band a month later. OP= -.174
10% decline.
2.
7/11/1968
922.82 Fell immediately, reaching
870.37 and lower band 3 weeks later. OP= -.008
10% decline.
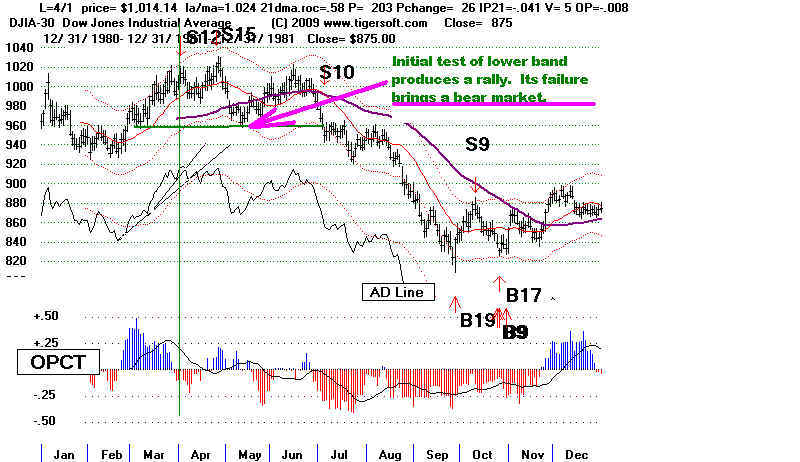
3.
4/1/1981 1014.14 Rose to 1024.05 and fell to the lower band in a month, 963.33
-.052
This started the 1981-1982 bear market.
20% decline.
4.
1/6/1983
1070.92 Rose
to 1083.79 and fell to the lower band in 3 weeks, 1030.17 -.134
6% decline.
5.
1/6/1984
1286.64 Immediately declined below lower
band to 1134.63 on 2/23/1984 OP= -.154
16% decline.
6.
12/8/2000
10712.91 Fell immediately to lower band,
10487.29, on 12/21/2000
and then below lower band to 9389.48, on 3/22/2000 OP= -.156
14% decline.
Rallies after, and paper losses from, these Sell S12s occurred only in 2 of the 6
cases
and were by less than 1.5%.
In these cases, no clinching is needed apparently. What
is more to the point now is that in
5 of 6 cases the DJI eventually fell substantially
below the lower band. The lower band support is very important. You can see this
in the 1981 chart below.
1981 Sell S12
Completed S12 Statistics: 1928-2009
Rising Markets:(above 65-dma): S12s with
no Near-By S4,S6, S9
------------------------------------------------------------------------------------
6/12/35 117.1
Reversal loss -8.7% OP= +.072
Avoided using A/D Line trend-break clinching.
6/24/35 120.
Reversal loss -6.1% OP= +.067 Avoided
using A/D Line trend-break clinching.
7/27/38 140.20
fell directly to 136.90 and lower band. OP= +.014
8/5/38
144.50 fell
directly to 136.90 and lower band. OP= +.028
1. 8/24/38
143.50 Fell
immediately, reaching 129.90 below lower band a month later. OP= -.174
3/16/1967 868.49
fell directly to 842.43 .025 lower band
in 3 weeks. OP= +.017
4/21/1967 883.18
Rallied to 899.89 and fell below
lower band in a month, 899.89. OP= +.179
9/14/1967 929.44 Rallied to
937.18 and fell below lower band in 6 weeks to
850. OP= +.109
1/9/1968 908.29
Rallied to 900.24 and fell
below lower band in 19 weeks to 825. OP=
+.158
2. 7/11/1968
922.82 Fell immediately, reaching 870.37 and
lower band 3 weeks later. OP= -.008
10/21/1975 846.82 Rallied
to 860.67 and then fell slightly below lower band, 793.80, on
9/30/75 .OP= +.125
7/17/1978
839.05 Fell only to 21-dma
immedately and then rallied OP= +.051
9/11/1978 907.74
Declined
to lower band at 857.16 in 7 trading days and rallied OP= +.187
3. 4/1/1981
1014.14 Rose
to 1024.05 and fell to the lower band in a month, 963.33 -.052
4.
1/6/1983 1070.92 Rose to 1083.79 and fell to the lower band in 3 weeks, 1030.17
-.134
5. 1/6/1984
1286.64 Immediately
declined below lower band to 1134.63 on 2/23/1984 OP= -.154
10/7/1997 8178.31 Immediately declined below lower band to 7161.15 on 10/27/1997 OP= +.118
6/18/1999 10855.55
DJI rallied to 11300 in 2 months before falling to 10019.71 on
10/15/1999 OP= +.046
7/17/2000 10804.27 Fell immediately to 10511.17 on 7/28/2000,
then rallied to 11259.87 on 9/7/2000 and
then fell to 9975.02 on 10/18/2000
OP= +.193 and OP= +.12 on 2nd S12 two days later.
6.
12/8/2000 10712.91 Fell
immediately to lower band, 10487.29, on 12/21/2000
and then to 9389.48, on 3/22/2000 OP= -.156
10/15/2009 10062.94 (Dial
Data corrected data) OP= -.07
10/21/2009 9949.36 (Dial Data
uncorrected data) OP= -.208
10/26/200 Sell S12Clinched... Be Wary of Trap-Door Declines.
We have an "Isolated Sell 12" in a
rising market. How bearish are these? We have to also
consider
the values of the OPct. At the time of the recent Sell S12 on 10/21/2009, the OPCT
was -.20.
and IP21=.004. It will take some effort to put all the data together. This
will appear
in the next
day. Early returns suggest the S12 and a negative Opct are a reliably bearish
combination. While there is always a chance for a recovery now that the
DJI is back to its
21-day ma,
S12s usually produce deeper declines, especially when the volume indicators
are
bearish, too.
Watch the Dollar.
If it rises and breaks its downtrend, it probably means that the FED will
raise
interest rates a point or two. Banks might then sell the stocks they speculated with
so cheaply
at tax payer expense, rather than make loans. Such expectations go a long way
in
explaining the mix of profit-taking, shorting and the the faltering breadth on the NYSE.
The same
message is being signalled by the way some gold and silver stocks now show
unusually
high distribution and are now falling. See NEM and SSRI. There was a
reason
they could
not make new highs when the Gold
ETF did. If a stock can't make a new high
with
such background fan-fare, it usually has to decline to recharge. I
remind you that
advances
by gold are very often followed by a swooning stock market.
Another
thing to watch is how well stocks that show a lot of Blue Accumulation
do as their
prices fall to the key 50-day ma. If many of these stocks sell off like
NWK just did, wouldn't this
suggest that big money is very skittish. And that would
not be a
good sign. They probably fear that a deeper retest of the lows will be needed.
Indeed,
"V" bottoms are relatively scarce.
Price Pot-Holes Point To Problems in The Market
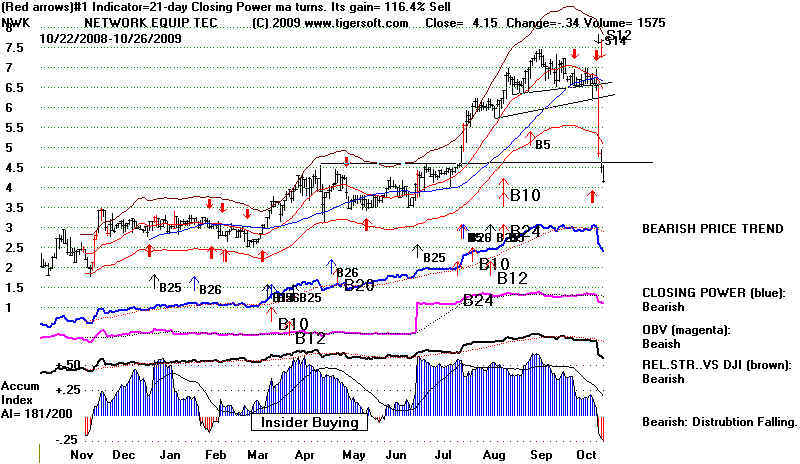
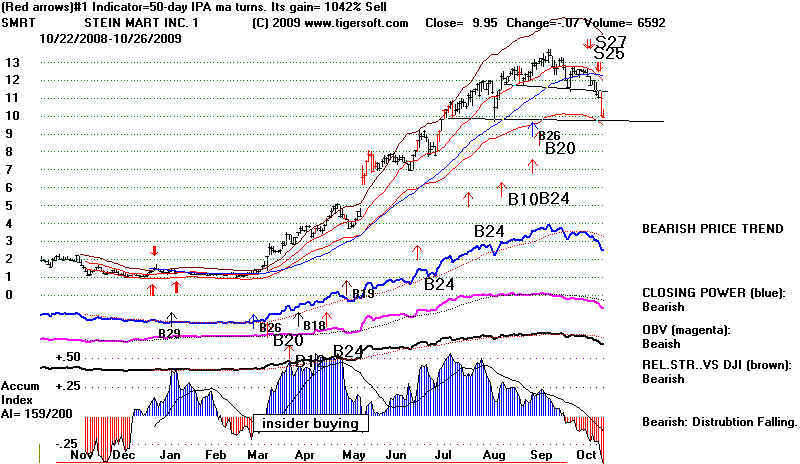
Serious Break Downs In High Accumulation Stocks Are
Worrisome.
If these high
Accumulation stocks don't hold up, is big money getting nervous again.
Were these stocks
just pumped up only to be dumped on the unspuspecting public on the way down.
Here are some
high Accumulation stocks to watch that have broken their 50-day ma:
AMCS, ATRI, ATSI, BAMM, CAVM, CRED, MEDQ, SMRT
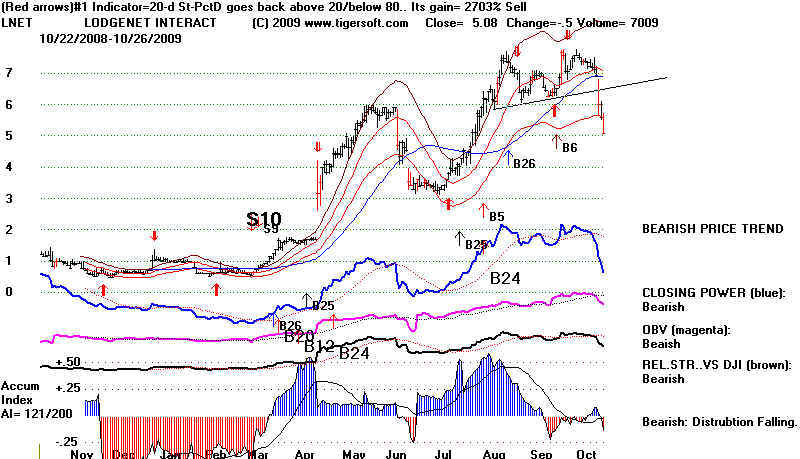
Some interesting
shorts are AAI, ARQL, ASFI, AYR, BAC, CAL. CSFG, LNET, SMRT

10/23/200
Sell S12 --- WATCH THE A/D LINE OF THE NYSE.
The excellent breadth has kept the 7 month 2009
rally going long beyond
where a simple
study of daily volume might have thought possible, so low was
the volume on
much of the rally since March.
But now we should
ask: "What will happen if the good breadth ends?"
The growing
investor optimism and the stock market's direction and apparent
safety may change
rather sharply. To see this, I suggest looking at the reversal
upon the
occurrence of a clinched Sell S12 in early 2002. The break in the long
NYSE A/D Line
uptrend was the light switch! That was also when interest rates were
kept artificially
low after the 9/11 attack. Of course, 2002 saw the run-up to a new war.
Had Bush,
Cheney or the CIA Director been of a different mind, my guess is the
2002 DJI decline
would have been much more shallow.
2002 Top and Clinched Sell S12.
A PICTURE IS WORTH A THOUSAND WORDS