


william_schmidt@hotmail.com
TigerSoft and Peerless Daily Hotline
(C)
1985-2012 William Schmidt, Ph.D. www.tigersoft.com
All rights
strictly reserved.
^^^^^^^^^^^^^^^^^^^^^^^^^^^^^^^^^^^^^^^^^^^^^^^^^^^^^^^^^^^^^^^^^^^^^^^^^^^^^^^^^^^^
>>>>>>> Important Announcement ->>>>>>>

The Location of This HOTLINE Page will
change
on Wednesday, May 30th.
You should have received an email
from us today giving you the new address
-----------------------------------------------------------------------------------------------------------------------------
 A Guide To Profitably Using The
Tiger Nightly HOTLINE
A Guide To Profitably Using The
Tiger Nightly HOTLINE
Background Studies
2/3/2012 Dalily All-Time Highs.
1
/30/2012 Inverted
Traders' Index NCs at upper and lower bands have
good predictive value:
1990-2012 10/24/2011 2011's
Super Stocks - 90% Showed Insider Buying as Tiger measures it,
early on and before
their biggest moves
9/30/2011
Key Support failures in
DJI since 1929
Weekly DJI and A/D
Line charts since 1928
6/14/2011
- Tiger Charts of
SPY's Closing, Opening Powers and IDOSC: 1994-2011
Peerless
Buys and Sells applied to DIA, SPY, QQQ and Canadian ETF (EWC)
See New blogs about the
profitability of Peerless Buys and Sells applied to DIA,
SPY, QQQ and EWC
(Canada) and other country ETFs, Brazil, South America
and Mexico. Also
see the study just done of the industry groups that Peerless
Buys and Sells worked
best with since 1986.
http://tigersoftware.com/TigerBlogs/April-28-2011/index.html
http://www.tigersoftware.com/TigerBlogs/April27-2011/Index.html
http://tigersoftware.com/TigerBlogs/4-23-2011/index.html
4/15/2011 Surging Biotech's
- A Wave of Good Hope
3/11/2011 NASDAQ Charts:
1990-2011 Show Reliability of Head/Shoulders
3/8/2011
Compare Grain Tops Now
with Those They Made in 2008:
Rice, Wheat, Oats,
Soybeans
>SPY: TigerSoft
Charts: 1993-2011: Study them to improve your technical analysis skills.
>Head/Shoulders,
CP trends, NC's, zig-zags, Flagrant Accum. Index NNCs and PNCs.
>Use
TigerSoft's Insider Trading Charts To Look Beneath A Stock's Surface
2/23/2011 SPY Candle Stock
Charts: 1993-2011
2/12/2011 Trading Gold and Silver Stocks with
TigerSoft's Key Indicators Measuring Insider
and Professional Buying and Selling.
2/8/2011 Trading The EURO since
1999 Using TigerSoft's Closing Power and Accumulation Index.
This sets out a convenient list of trading rules that should be helpful.
TigerSoft Blogs
11/16/2010 30-Treas.-BONDS and
The DJIA since 1980
11/4/2010 TRADING RESULTS FOR
BULLISH and BEARISH SPECIAL SITUATIONS
What we can learn from the Picks from Late July - September 2010
10/16/2010 New Research for
Trading with Closing Power
Overnight Market Action:
Bloomberg Futures around
the world before the US Markets open.
CNN Futures before the Opening in NY
24-hour Spot Chart - Gold
24-hour Spot
Chart - Silver Dollar and Currencies
Daily NYSE and NASDAQ New Highs.
|
NOTES:
---> To renew this Hotline, order here $350 (check) -
$360(Visa/MC)
 IMPORTANT - The server
that hosts this site is now sometimes IMPORTANT - The server
that hosts this site is now sometimes
slow or unavailable briefly as I post
updates. It may be necessary in an emmergency to use
the other web-page at tigersoftware.com
If that happens, I will post the Tiger Hotline on
www.tigersoftware.com/2012-AprilHL/index.html
instead of here. Notice the
difference is only a matter of adding
"ware" to "tigersoft". It will be there only if I have
a problem here. |
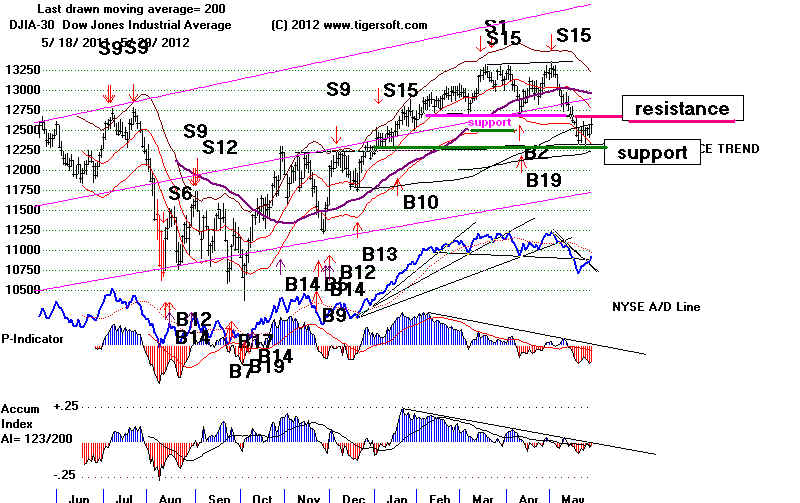
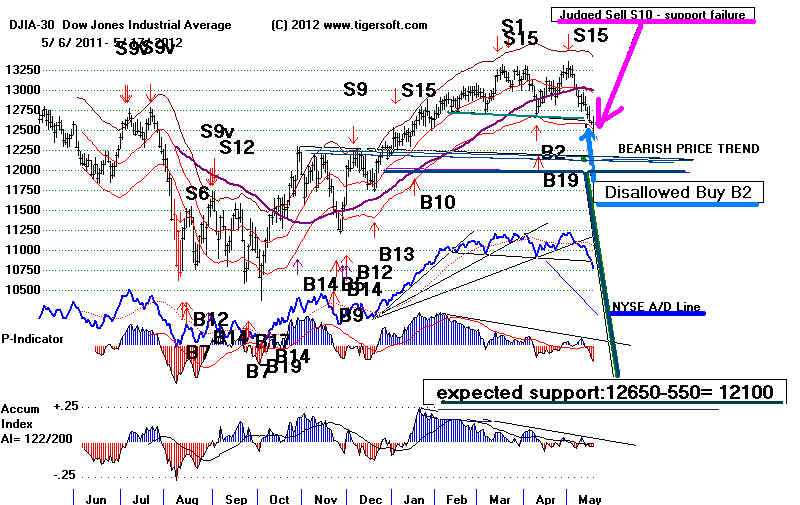
5/29/2012 TIGERSOFT HOTLINE Judged Sell S10.
Key Values - Peerless-DJIA -
DJI
12581 +126 la/ma = .985 21dmaROC= -.602 P= -332 P-Ch -32 IP21= -.024 V= -210 OP= - .558
Key Stocks: AAPL and 6 highest priced DJI stocks : IBM CAT, - CVX - MCD MMM and XOM
KEY TigerSoft CHARTS and
INDUSTRY INDEXES
DIA SPY QQQ DJIA-Peerless
TigerDJI TigerSPY TigerQQQ GLD SLV Crude
Oil IWM-Russell-2000
---> 102 MAXCP
stocks Bullish MAXCP Stocks (5/29)
Bullish plurality
--->
51 -15
MINCP stocks Bearish MINCP Stocks (5/29)
MAXCP stocks are those showing Tiger Closing Power making new
highs.
This suggests heavy Professional Buying. Applying the Tiger Power Ranker's
"bullish" to the MAXCP stocks find those with heavy insider buying and Blue
institutional accumulation. Bearish
MINCP stocks show the opposite.
Coupling Closing Power new lows with heavy Red Distribution and
red Candle-sticks' predominating easily finds reliably weak stocks to short
when Peerless gives a Sell, with the exception of year-end when
selling pressures end suddenly when tax-loss selling does.
---> 25
new
highs on NASDAQ. 20 new lows on NASDAQ
Bullish
plurality
---> 32
new
highs NYSE 28 new lows on NYSE Bullish
plurality
HOTLINE No
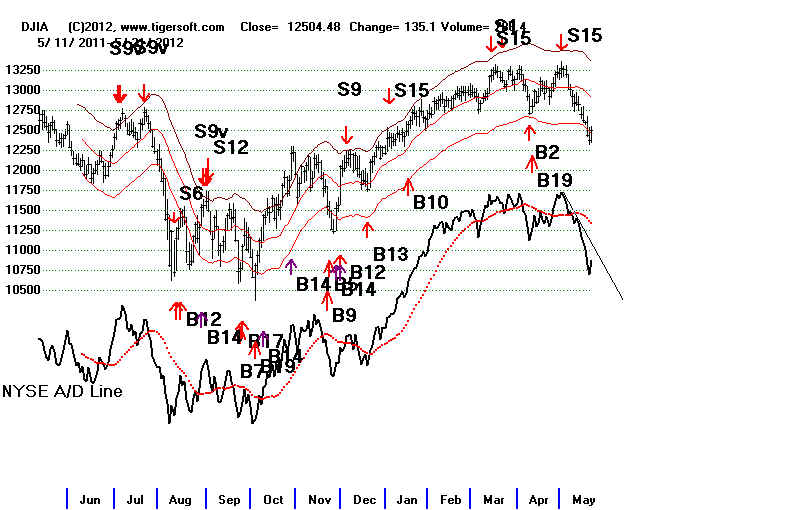
Peerless Buy Signal. Downside Minimum Objective at 12100.
But the very low -.50
readings from the OPct have all been near important bottoms
since 1995. The Address
of the Hotline changes tomorrow. If your subscription
has run out, comeback
tomorrow and get "the rest of the story."
A rally the day after Memorial Day is not to be
trusted, per se. But the NYSE
A/D Line downtrend-line was
broken. This is constructive and may set up a
Peerless buy signal if there
is more weakness. Right
now, the DJI futures are down
109. Without a new Peerless
buy signal, I would think the odds favor another
test of 12300 with a good
chance of a decline to 12100, where the minimum
downside objective for the
DJI, based on the height of its trading range from
12700 to 13000 gives us a way
to reckon the minimum weakness that may lay
ahead. Such a
decline would also take the DJI down to the support of the
200 day ma
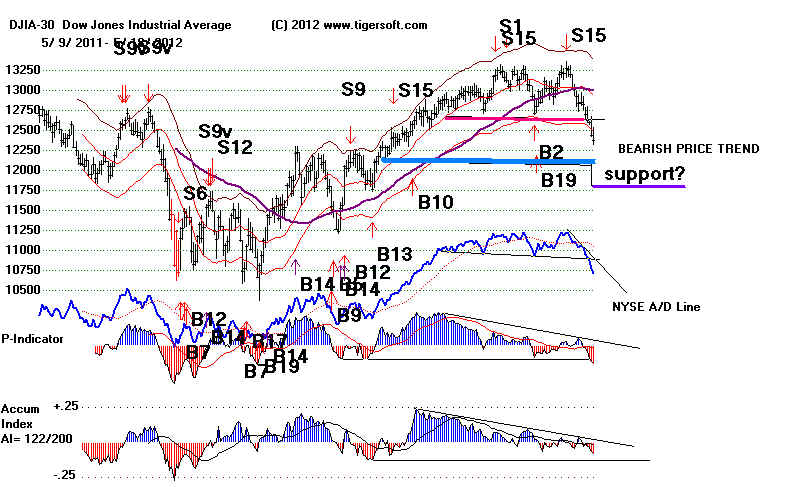
False
DJI Breakdown?
What if the DJI rallies
further and closes clearly above the horizontal support
that was broken at about
12740? Certainly it could happen. It would be a
"false breakdown".
When the broken, well-tested support is very flat and the DJI
clearly breaks it, usually
there the DJI must fall at least to its minimum downside
objective. But I can
find there cases where it did not and the DJI recovered
itself back above the broken
support-turned-into-expected resistance. The key
in these cases was to see the
recovery be accompanied by mostly positive
internals, Peerless Buy
signals and/or the OPct turn clearly positive. If I can
find other examples, I will
add them later tonight. Since we have no Buys
and the OPct is now a very
low -.558, I would think that there will not be a recovery
up past 12750, at least, not
until we see more improvement from the Peerless
key values or we see a
Peerless Buy signal.
See
http://tigersoft.com/PeerInst-2012/False-Breakdown/index.html
Oversold
OPct? Parallels with the Present
I want more and more to try
to find the closest parallels with the present using
the most unusual readings
from the key values. Here that is OPct., now -.527.
Similar very low readings
occurred on:
8/24/2010
(OPct= -.528 and IP21 = +.016 ...a B17/B14 bottom)
10/27/2008
(OPct= -.522 and IP21= -.169 ...a bottom).
9/21/2001
(Opct= -.512 and IP21= -.18... a market bottom)
8/28/1995
(Opct= -.53 and IP21= -.079...a market bottom.)
Tomorrow I will look at all the
lowest past readings for the Opct. I would mention that
buying on 7/19/2002 when the
OPct was -.544, would have meant buying when
the DJI was 8018.26. It fell
over the next two days to 7702,34 and then rallied
to 9000 very quickly.
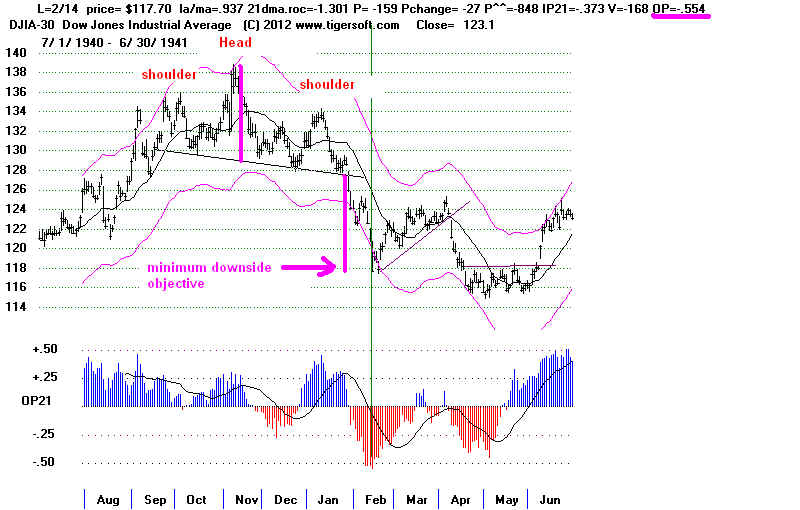
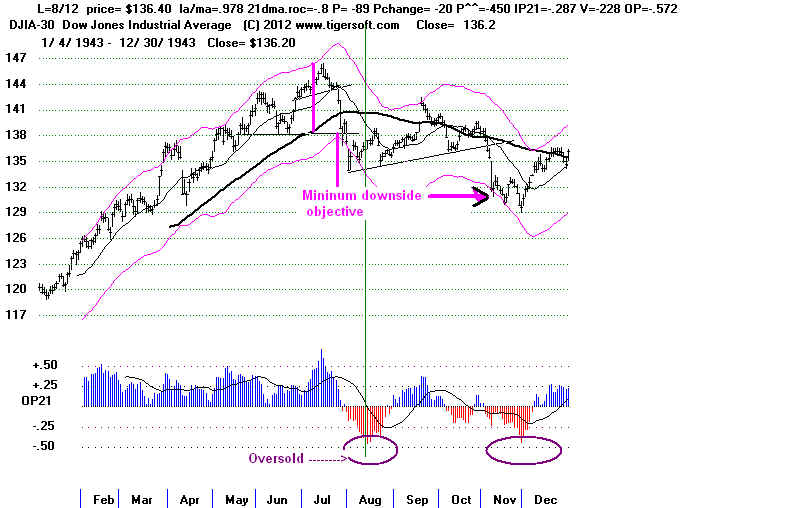
The reading of -.50 from the
OPct is unusual when the other key Peerless
internals are much better.
I can find only two other cases where this was true:
in 1941 and 1943. In
both cases, the DJI was probing for support, but more
weakness lay ahead. See
the Opct of 1941 and 1943. In both cases, rely on
Peerless buy signals worked
well.
The OPct is an indicator I
developed in 1981, along with IP21 (Tiger AI),
to allow different stocks and
indices to be compared over time and with each other.
OPct is a valuable Peerless
key value in helping defining reliable Buys and Sells.
We also watch for blatant
non-confirmations from it of new highs and lows. In
our present case, the OPct
clearly confirmed the breakdown. At the very
least it needs to rise back
above its falling 21-day ma before a decent recovery
can take place.
1941 A Buy B19 occurred
on 2/19/1941.
1943 There was a
Buy B17 on 8/10/1943 and a Sell S2 on the rally back to the upper band.
Past False DJI Breakdowns
8/16/1983
DJI closed clearly back above what should have been resistance on 7th day
following the breakdown. Volume was
low on the recovery but the key values
were all positive, except the P- and V-I
Indicators. There was also a Buy B17 at the bottom.
DJI
LA/MA AnnRo
c PI P-I ch AdjPI
IP21 V-I Opct
1190.45 .992 .005 -71 +17 -140 .033 -6 .135
3/22/1935 DJI closed clearly back above
what should have been resistance on 7th day
following the breakdown.
Volume was moderate on the recovery. The key values were
mostly negative, but the OPct
was quite positive. but the key values
were all positive, except the
P- and V-I Indicators. There was also a Buy B5 on the breakdown.
DJI
LA/MA AnnRo
c PI P-I ch AdjPI
IP21 V-I Opct
100.70 1.003 -.497 83 +30 -459 -.054 -169 .068
6/29/1928 DJI closed clearly back
above what should have been resistance on 12th day
following the breakdown.
Volume was very low on the recovery. The OPct was negative,
but waiting for it to turn
positive would have been a good strategy. It would have meant buying
on 7/11/1928 on a pullback to
the point of breakdown. Note that there was also an intervening rally"
back up to the
boek-support-now resistance, which served to eat some of it up and make it more
vulnerable.
HOURLY DJIA
=====================================================================================
OLDER HOTLINES
=====================================================================================
5/25/2012 TIGERSOFT HOTLINE Judged Sell S10.
Without a new Peerless Buy, the
current bounce is not expected to rally above
the 12700 resistance, and it may not even
make it much above 12550, the recent
hourly resistance. The rally
has been driven mostly by hot money leaving Europe
and going into NYSE dividend stocks and
bonds. Friday we saw a break in the key
ETFs' Closing Power uptrends. But
the bullishness of the day after Memorial Day
may over-ride this. Another
successful test of 12300 would be constructive. The.
downside minimum objective remains 12100.
DJI futures are up 67 at this
writing. Hopes are that JP
Morgan's hasty selling is over
of
$25 Billion worth of profitable securities to offset the "London Whale" loss.
We
continue to wait for JPM's Closing Power
to break its downtrend. That would tell
us that professionals are net buyers of
the stock again.
That there are more MAXCP stocks than MINCP stocks shows that Professionals
in NY still believe there is more to this
rally. In addition, seasonality is bullish by 2:1
for the two weeks following May 28th
since 1965. So, if the news from Europe is good,
a modest rally should continue until
12700 is reached. Our Stocks' Headline is hedged
for now with about equal number of long
and short positions. The bullish MAXCP
stocks can go up even as the bearish
MINCP stocks go down, but use CP moves above
past the CLosing Power trendlines and
21-day ma as points to close out. moves that
start to go awry.
5/25/2012 Key Values - Peerless-DJIA -
DJI 12455 -75 la/ma = .973 21dmaROC=
-.695 P= -364 P-Ch -48 IP21= -.039 V= -229 OP= - .552
Key Stocks: AAPL and 6 highest priced DJI stocks : IBM CAT, - CVX - MCD MMM and XOM
KEY TigerSoft CHARTS and
INDUSTRY INDEXES
DIA SPY QQQ DJIA-Peerless
TigerDJI TigerSPY TigerQQQ GLD SLV Crude
Oil IWM-Russell-2000
---> 102 MAXCP
stocks Bullish MAXCP Stocks (5/25)
Bullish plurality
--->
66 MINCP stocks
Bearish
MINCP Stocks (5/25)
MAXCP stocks are those showing Tiger Closing Power making new
highs.
This suggests heavy Professional Buying. Applying the Tiger Power Ranker's
"bullish" to the MAXCP stocks find those with heavy insider buying and Blue
institutional accumulation. Bearish
MINCP stocks show the opposite.
Coupling Closing Power new lows with heavy Red Distribution and
red Candle-sticks' predominating easily finds reliably weak stocks to short
when Peerless gives a Sell, with the exception of year-end when
selling pressures end suddenly when tax-loss selling does.
---> 10
new
highs on NASDAQ. 20 new lows on NASDAQ
Bearish plurality
---> 14
new
highs NYSE 21 new lows on NYSE Bearish plurality
Can
Peerless Be Used To Trade The Dollar?
Yes, Sell the Dollar when Peerless Gives a Buy
and Vice Versa. This has worked well since 2003, anyway.
The stock market
itself mostly goes up when Peerless is on a Buy,
But when Peerless
is on a Buy, since 2002, the Dollar has declined,
sometimes quite
sharply in every year but 2005. And when Peerless
was on a Sell,
the Dollar has risen in every year except 2007. This was
not the case
between 1997 and 2002. This suggests more and more
that a weak
Dollar is a friend of the stock market and a strong Dollar
is not so
friendly. Right now, the Dollar is rising at a 9% annuaized rate.
-------------Gains Trading The Dollar -------------
Annualized
Longs
Shorts
Rise in Dollar
Buy on a Buy
Sell
Short on a Sell
Sell on a Sell
Buy on a Buy
-----------------------------------------------------------------
---------------------
1993 +3.4%
no sells
+7.3%
1994 -9.3%
-0.1%
-10.5%
1995 -3.9%
no sells
-2.4%
1996 -3.6%
-3.3%
+2.1%
1997
+6.4%
+1.3%
+7.0%
1998
-1.3%
+6.3%
-6.0%
1999
+3.3%
+4.1%
+4.4%
2000
+2.3%
-5.1%
+13.8%
2001
+2.9%
+2.7%
+3.6%
2002
-1.6%
+14.9%
-13.8%
2003
-15.1%
-1.1%
-11.3%
2004
-11.9%
-7.4%
-4.4%
2005
+8.9%
-1.4%
+11.8%
2006
-11.8%
-3.1%
-7.0%
2007
-7.6%
+.7%
--10.5%
2008
-5.3%
-13.1%
+14.8%
2009
-14.4%
-5.5%
--13.2%
2010
-4.1%
-2.0%
--0.8%
2011
-9.1%
-10.6%
+1.5%
2011-12 -1.1%
-9.1%
+9.0%
-------------Peerless Gains Trading
Gold, Silver and Crude Oil -----
Long and Short Positions Combined.
Although gains in precious metals and Crude Oil have recently been very good when
trading with the Peerless signals, their record with Peerless is poor between 1994 and
2001.
It is best not to trade them with the
Peerless signals if the last year's results
were not positive.
The gains with SPY are consistently good. (Note that the calculations are
based on year's first signal of each year, not the operating signal from
January 1st. Openings the next day are used and a small amount is applied
to allow for commissions. )
GOLD
SILVER
CRUDE OIL SPY
GO1620
SV1600 until 2007
CL1600
SLV 2007-2012
1993 +18.4%
+70.7%
-30.5%
NA
1994 -0.3%
-11.1%
-9.7%
+17.3%
1995 -1.8%
-2.3%
+2.1%
+22.0%
1996 -3.5%
-9.9%
-36.3%
+19.0%
1997 -5.2%
-16.8%
-19.6%
+6.6%
1998 -5.5%
-5.7%
-31.7%
+42.9%
1999 -31.9%
+15.8%
-17.6%
+19.0%
2000 -7.2%
NA
NA
+25.8%
2001 -12.8%
+1.7%
-6.2%
+33.2%
2002 +3.4%
-2.4%
-21.4%
+34.4%
2003 +7.4%
+17.7%
+18.5%
+21.9%
2004 +23.5%
+30.7%
-19.9%
+14.5%
2005 +19.2%
+22.5%
+10.0%
+13.2%
2006 +42.6%
+134.3%
-8.0%
+29.3%
2007 +2.1%
+9.2%
-0.1%
+42.1%
2008 -0.5%
+92.4%
+18.5%
+62.1%
2009 +34.9%
+87.2%
+95.2%
+72.7%
2010 +23.4%
+107.2%
+67.2%
+49.2%
2011 +18.4%
+102.5%
+124.5%
+48.2%
2011-2012 +19.3%
+60.7%
+143.6%
+60.0%
-----------------------------------------------------------------------------------------------------------------------------
Over 20% 4/20
9/19
4 /19
13/19
Positive 11/20
13/19
9/19
19/19
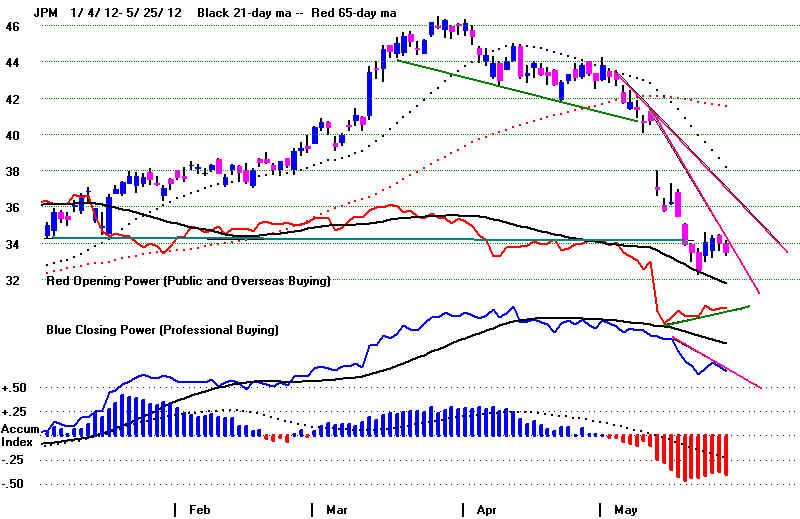
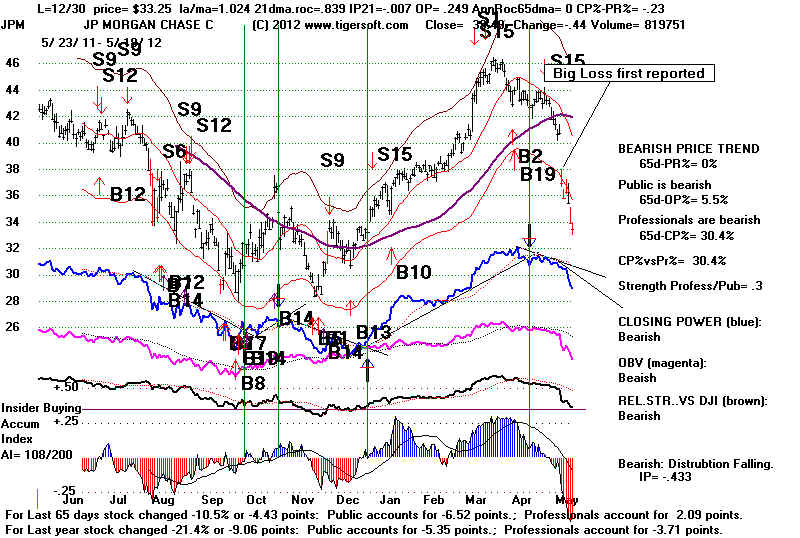
KEY STOCKS TO WATCH
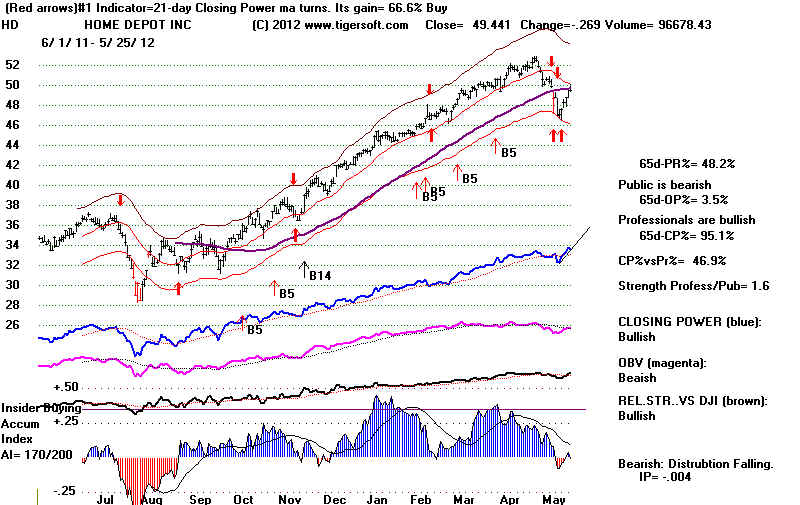
Home Depot (HD) is the highest Accumulation stock int he DJI-30. Below you
can see that it
has rallied to its now flat 65-day ma and stalled out. If the highest
Accumulation blue
chip that is enjoying heavy professional buying cannot
go higher, stocks
more generally are probably in big trouble.
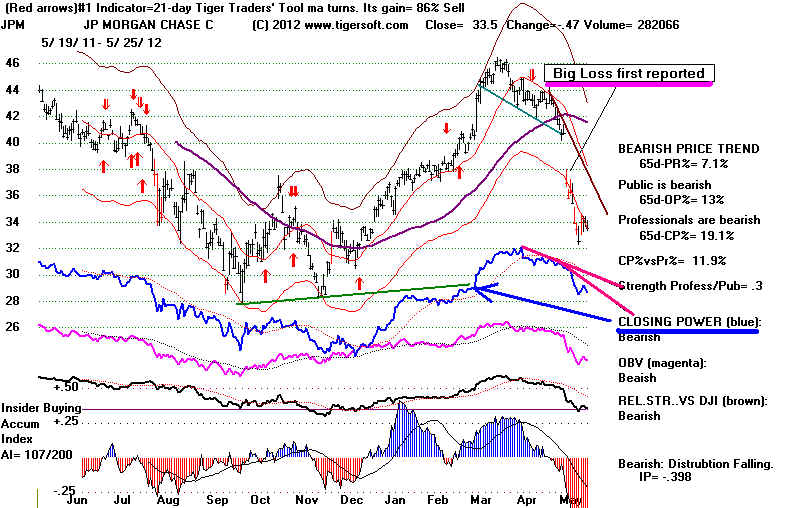
JPM is under renewed Professional selling pressure. Its Closing Power
broke its uptrend.
=====================================================================================
OLDER HOTLINES
=====================================================================================
5/24/2012 TIGERSOFT HOTLINE Judged Sell S10.
Without a new Peerless Buy, the current bounce is not expected to rally much
past 12700.
It seems to be driven mostly by hot money
leaving Europe and going into NYSE dividend
stocks and bonds. A break in the
Closing Power uptrends would invite another test
of 12300. The downside objective is
12100.
5/24/2012 Key Values - Peerless-DJIA -
DJI 12530 +34 la/ma = .976 21dmaROC=
-.519 P= -317 P-Ch -56 IP21=+.002 V= -220 OP= - .469
Key Stocks: AAPL JPM and 6 highest priced DJI stocks : IBM CAT, - CVX - MCD MMM and XOM
KEY TigerSoft CHARTS and
INDUSTRY INDEXES
DIA SPY QQQ DJIA-Peerless
TigerDJI TigerSPY TigerQQQ GLD SLV Crude
Oil IWM-Russell-2000
---> 109 MAXCP
stocks Bullish MAXCP Stocks (5/23) Bullish plurality
--->
93 MINCP stocks
Bearish MINCP Stocks
(5/23)
MAXCP stocks are those showing Tiger Closing Power making new
highs.
This suggests heavy Professional Buying. Applying the Tiger Power Ranker's
"bullish" to the MAXCP stocks find those with heavy insider buying and Blue
institutional accumulation. Bearish
MINCP stocks show the opposite.
Coupling Closing Power new lows with heavy Red Distribution and
red Candle-sticks' predominating easily finds reliably weak stocks to short
when Peerless gives a Sell, with the exception of year-end when
selling pressures end suddenly when tax-loss selling does.
---> 10
new
highs on NASDAQ. 54 new lows on NASDAQ
Bearish plurality
---> 9
new
highs NYSE 31 new lows on NYSE Bearish plurality

Happy Memorial Day
> Monday, a
holiday in the US.
The market most often rallies (70%-85% of the time)
the day before and the
day after a three day weekend. This tendency is weakest at Memorial
Day..
>Overnight and
Early Morning Weakness versus Stronger NY Closes.
A prolonged pattern like this is more likely to be
followed by a decline to
at least the lower band and sometimes much lower. Now that we are
almost down to SPY's lower band, will there be a recovery? The September
2008 and August 2011 cases show a much deeper decline is quite
possible. Circled Tiger Augmented "Buy B7s" register the presence
of a Closing Power which is much stronger than the Opening Power. They also
show us that the real test is apt to come when the rising CLosing Power
breaks its current uptrend.
Current SPY
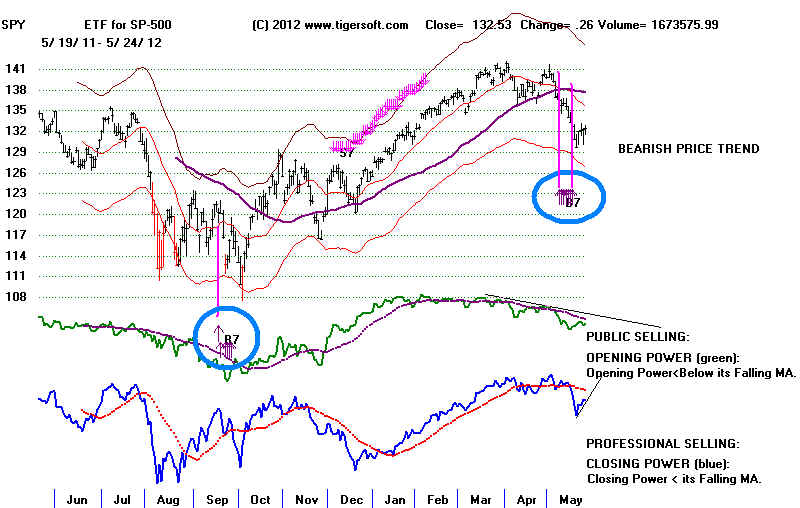 |
September
2008 - SPY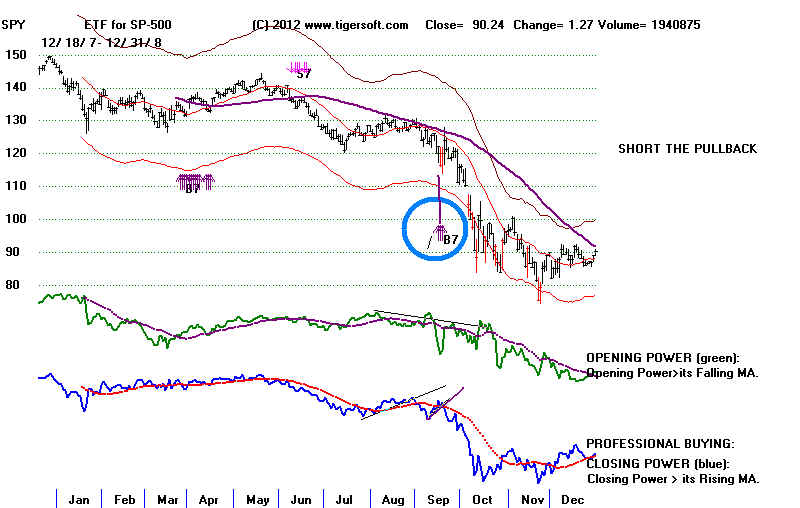 |
August 2011
- SPY
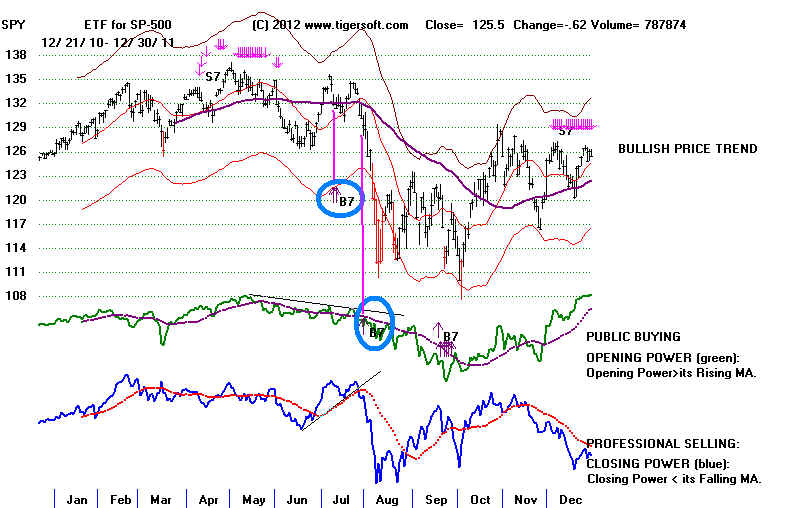 |
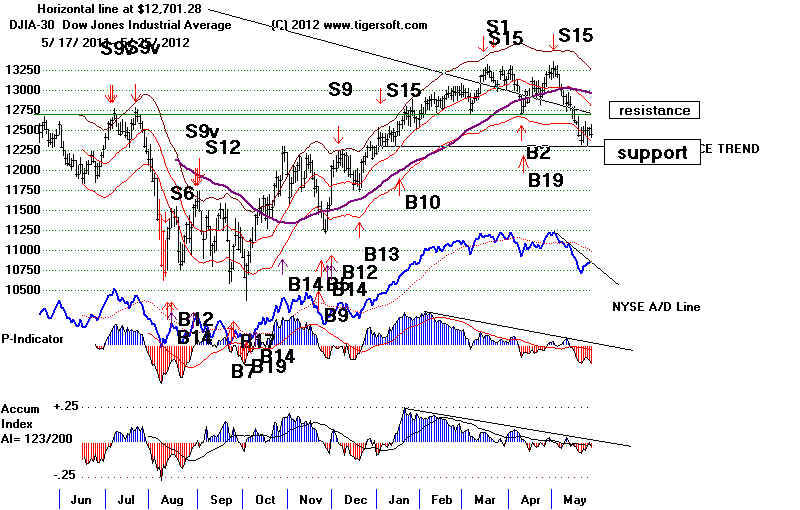
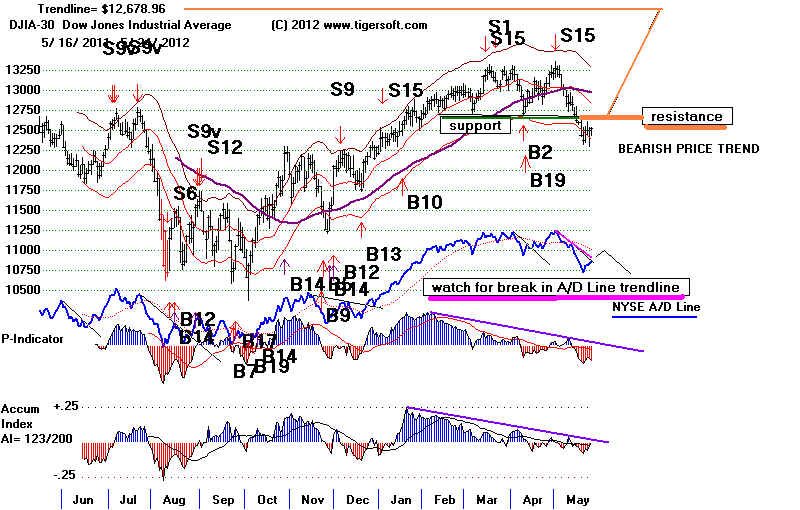
>Watch the A/D Line
downtrend. A violation of it should
bring a rally
back to the point of breakdown in the DJI, 12700.
Recently, the ratio of advances ot declines
has been favorable. And now one
more good day will break the NYSE A/D Line downtrend.
>Contradictions.
See how the briefly rising Closing Power (CP) Lines for the QQQ
has been
broken but the CP for the IWM (Russell-2000) is rising. The
market is still sorting
out the news and technical consequences of the broken support at 12700.
There is also a contradiction between Crude Oil's continued
weakness and XOM's
CP resilience.
The one thing that is clear: The Euro is much weaker than the Dollar and
hot, flight capital is leaving Europeon investments for safer, dividend paying
US Stocks. This can hold the US markets up for a while. Keep in mind that
usually the DJI takes 6 months of more months to complete a truly bearish top,
actually multiple tops, before it can break key support 10%-15% down and
then starts a long bear market..
-------------------------------------------------------------------------------------------------------------------------
What Happened in The Past.
When The Peerless Key Values Were The Same as now.
The DJI is now 2.4% below its 21- day ma and show the following key values:
Are there any cases in market history that show a positive IP21, as now,
but negative P-I and V-I readings plus a fairly steeply declining 21-dma,
showing an annualized rate of decesnt of -.519. Below are all the earlier
cases that
are somewhat similar and what happened.
in 4 of the 5 cases with key values
similar to the DJI's now, a 3% to 14% decline
soon followed. In one case, in December 1991, the DJI was about to
rally 14%.
The odds here are 4:1 in favor of a testing soon of 12100.
DJIA
la/ma aroc
P-I ch P-equiv
IP21 V-I Opct.
12/16/1942 111 .971 -.613 -58 -9 -309
.019 -206 -.378
DJI fell 5% to 106 on 12/23/1942
It then rallied to the upper band and then dropped 18% to an April bottom..
-----------------------------------------------------------------
DJIA
la/ma aroc
P-I ch P-equiv
IP21 V-I Opct.
10/19/1976 950 .976 .544 -169 -19
-.006 -4
-.297
DJI fell to a bottom at 920 (3%) three weeks later.
-------------------------------------------------------------------------------------------
DJIA
la/ma aroc
P-I
ch P-equiv IP21
V-I Opct.
12/10/1992 2864 .974 -.734 -194 -27
-357 -.006 -29 -.363
This was a bottom just before a 14%
rally in 11 weeks.
But there was less overhead resistance than now and it was December.
--------------------------------------------------------------------------------------------------
DJIA
la/ma aroc
P-I
ch P-equiv
IP21 V-I Opct.
3/2/2001 10466 .974 -.466 -34
19 -33 -.017 -167 -.314
There was a 2% rally but then
the DJI then fell 14% in 3 weeks where a Buy B9 occurred.
----------------------------------------------------------------------------------------------
DJIA
la/ma aroc
P-I
ch P-equiv
IP21 V-I
Opct.
5/27/2010 10259 .97 -.882
-377 99 -366 -.007 -420 -.365
DJI fell to 9940 on 6/8/2010 (3%) before rallying to the upper band..
------------------------------------------------------------------------------------------------------------------
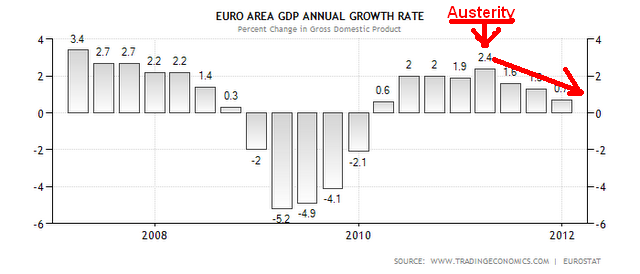
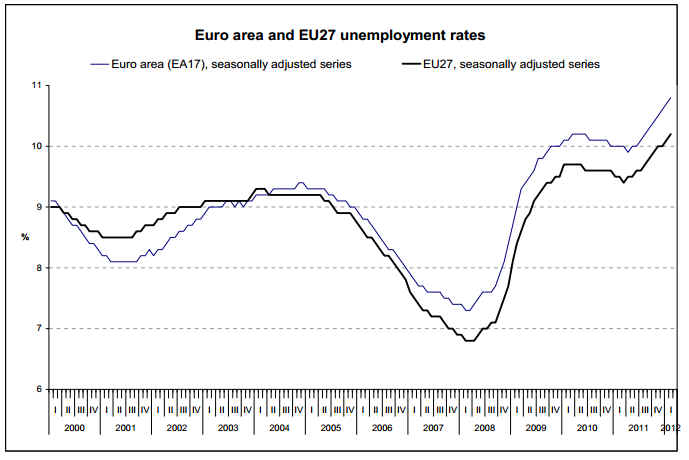
"Muddlers"
Rule.
Something to ponder: which group is dumber: big bankers or the
politicians who listen to them? It's clear now that "Austerity
" has again
created a down-hill spiral for Europe's economies. Austerity has created
the worst of all world's: rising unemployment, rising interest rates and a
steady currency decline, which many now consider will end in an
eventual EURO collapse.. |
.
Austerity Still Reigns Supreme in Washington, London and Berlin
It's clear now that the big bankers who convinced the Europeon politicians
to apply the fiscal regiment of "Austerity" have, in fact,
"stupidly" worked
against their own best interests just as much as the Labour Government in
England did in1929-1931 when it accepted the orthodoxy of the central bankers
and the Bank of England and applied "Austerity" to "re-build
confidence"
in an era of high unemployment, thereby actually causing a sharp acceleration
of British unemployment as well as dramatically weakening of the Pound Sterling.
Given the colossal "stupidity" of the US big bankers in fostering and not
foreseeing the Housing Bubble and JPM's mammouth trading losses now
in a rising stock market, one can only be impressed with the contiunuing
lack of backbone, ignorance and disastrous dullness of the political leadership
here, as they cozy up to Wall Street and defend it from prosecution or
anti-trust action. English leaders kept talking about "muddling through"
in the 1930s,
as though it were a virtue. So do some Europeons now. But none of our leaders
in America challenge the assumptions of the orthodoxy of Austerity. So,
Americans seem doomed to repeat the 1930s' unless some new technology
boom saves us as cars and radio did in the early 1920s. With the DJI
boosted by low interest rates almost to its highs of 2007, there would
seem to be a lot of downside risk. The DJI is twice as over-extended as
it was in 1929, when we compare the 25-year percent gains from 1905 to 1929,
with those of 1982-2007. I do not see how "muddling through" and refusing
to
directly challenge to the orthodoxy of Austerity will keep us from a severe
stock market decline in the next 12 months.
For a discussion of the Earlier Consequences of Austerity, please see:
8/3/2011 - TigerSoft
Blog - Keynes Revisited and Ignoring Econmic History
====================================================================================
OLDER HOTLINES
====================================================================================
5/23/2012 TIGERSOFT
HOTLINE
5/23/2012 Key Values - Peerless-DJIA -
DJI 12496 -7 la/ma = .971 21dmaROC=
-.467 P= -262 P-Ch -20 IP21= -.027 V= -201 OP= - .442
Key Stocks: AAPL JPM and 6 highest priced DJI stocks : IBM CAT, - CVX - MCD MMM and XOM
KY TigerSoft CHARTS and
INDUSTRY INDEXES
DIA SPY QQQ DJIA-Peerless
TigerDJI TigerSPY TigerQQQ GLD SLV Crude
Oil IWM-Russell-2000
---> 75 MAXCP
stocks Bullish MAXCP Stocks Bullish plurality
--->
54 MINCP stocks
Bearish
MINCP Stocks
MAXCP stocks are those showing Tiger Closing Power making new
highs.
This suggests heavy Professional Buying. Applying the Tiger Power Ranker's
"bullish" to the MAXCP stocks find those with heavy insider buying and Blue
institutional accumulation. Bearish
MINCP stocks show the opposite.
Coupling Closing Power new lows with heavy Red Distribution and
red Candle-sticks' predominating easily finds reliably weak stocks to short
when Peerless gives a Sell, with the exception of year-end when
selling pressures end suddenly when tax-loss selling does.
---> 10
new
highs on NASDAQ. 54 new lows on NASDAQ
Bearish plurality
---> 9
new
highs NYSE 31 new lows on NYSE Bearish plurality
Judged
Sell S10.
Watch the A/D Line
downtrend. A violation of it should
bring a rally
back to the point of breakdown in the DJI, 12740.
Wednesday did
bring a successful re-test of the lows. This and
the now not very
negative Current Accum. Index are short-term
bullish.
 DJI
Futures up +51 at this writing. They are
DJI
Futures up +51 at this writing. They are
disregaring the negative news about Facebook lawsuits and a big HPQ lay-off.
Is the FED up to something?
Overnight and early NY selling Wednesday
was too much for the bulls.
But the DJI did put in a trading "double-bottom" reversal on the hourly
DJI. See the chart I have borrowed below. If time permits, I may start adding
the hourly DJI data to our nightly download, but for now I call your attention
to it at http://bullandbearmash.com/index/djia/
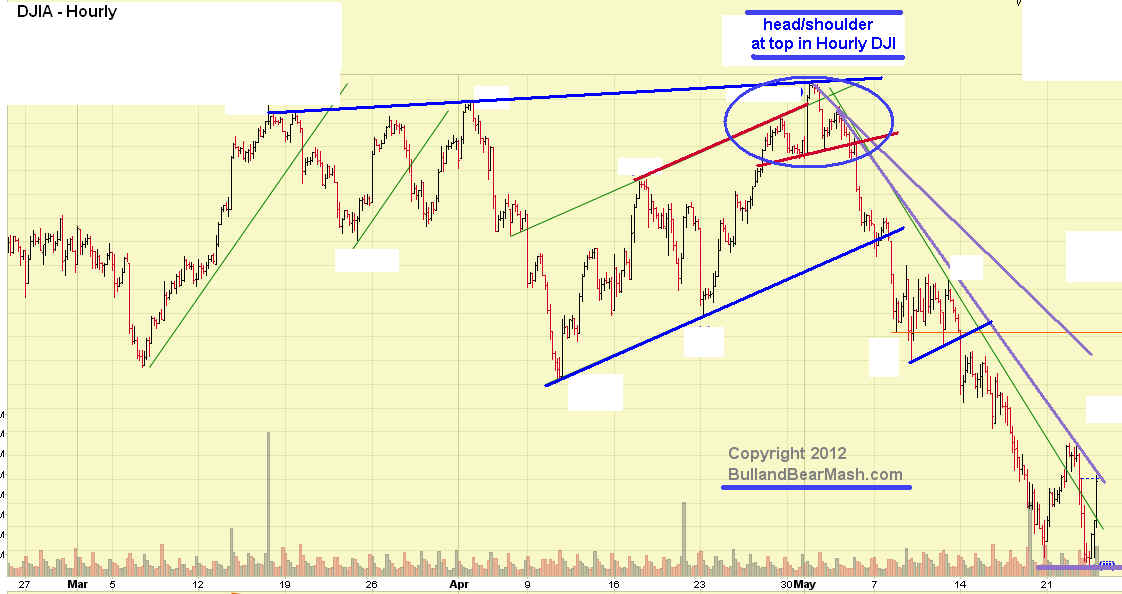
As long as the DJI does not go below the support-line, near 12300, shown
in the Hourly DJI above, there is a good chance that the DJI will get past the
resistance-line shown above and then the A/D Line downtrend will be broken,
which should, in turn, lead to a challenging of 12750, the point of breakdown.
Such a rally could then stop and a DJI decline would then be expected to
follow which would drop the DJI to the 12100 target area we have calculated
by subtracting the height of the trading range before the breakown from the
point of breakdown. It is on this rally and its apparent failure that I would think
we will get our next good shorting opportunity.
Internediate-term traders should stay short or hedged. Without a Peerless Buy signal
any DJI rally will probbaly not get past the 1.5% upper band above the 21-day ma.
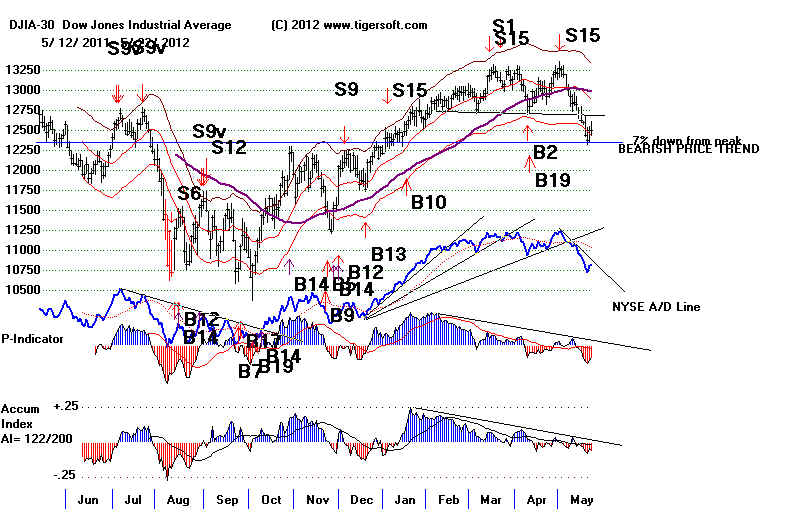
(See last night's study of DJI declines of 7%-8% from 12 month highs.)
I will say it is bullish that
the Accumulation Index has risen to
-.027. But we
have no buy signals that occur simply because the IP21 alone is positive
at the lower band. More of a sell-off will probably be needed. I will talk
more
Thursday night about what levels the IP21 (current AI) must be to be bullish
with the DJI 3%-4% below the 21-day ma, as now. .
AAPL's prices and Closing Power are rising. That will
help the NASDAQ.
News for Tomorrow's Opening.
NYT"
Regional leaders meeting in Brussels failed to signal concrete steps to stimulate the
economy
or
resolve the competing agendas of the German chancellor and the French president."
=====================================================================================
OLDER HOTLINES
=====================================================================================
5/22/2012 TIGERSOFT HOTLINE
Key Values - Peerless-DJIA -
DJI 12503 -2 la/ma = .97 21dmaROC=
-.391 P= -242 P-Ch +71 IP21= -.057 V= -196 OP= - .378
Key Stocks: AAPL JPM and 6 highest priced DJI stocks : IBM CAT, - CVX - MCD MMM and XOM
KEY TigerSoft CHARTS and
INDUSTRY INDEXES
DIA SPY QQQ DJIA-Peerless
TigerDJI TigerSPY TigerQQQ GLD SLV Crude
Oil IWM-Russell-2000
--->
38 MAXCP stocks
Bullish MAXCP Stocks
--->
93 MINCP stocks
Bearish
MINCP Stocks Bearish plurality
MAXCP stocks are those showing Tiger Closing Power making new
highs.
This suggests heavy Professional Buying. Applying the Tiger Power Ranker's
"bullish" to the MAXCP stocks find those with heavy insider buying and Blue
institutional accumulation. Bearish
MINCP stocks show the opposite.
Coupling Closing Power new lows with heavy Red Distribution and
red Candle-sticks' predominating easily finds reliably weak stocks to short
when Peerless gives a Sell, with the exception of year-end when
selling pressures end suddenly when tax-loss selling does.
---> 10
new
highs on NASDAQ. 52 new lows on NASDAQ
Bearish plurality
---> 8
new
highs NYSE 35 new lows on NYSE Bearish plurality
Judged Sell S10.
Oversold Bounce-Back and
Short-Covering Came To A Quick End
DJI Futures - 80......Mildly
bearish NT Times headlines tomorrow AM:
Merkel Defensive Amid Fresh Calls for Bonds
Dell Misses Estimates as Computer Sales Slump
The last hour retreat of the DJI is more warning
that the decline from DJI 13300
is
most probably not over and all we are
seeing is a brief technical rebound from
an
oversold condition. Watch the NYSE A/D Line. As long its DOWN-trendline
remains
intact, expect more general market weakness. If the A/D Line DOWN-trendline
is
violated to the upside, then expect a 3%-5% recovery to 12700. The possibility
of a
rally is increased by the current Accumulation Index (IP21) not being very negative.
It stands at - .057.
A decline
from here will be discouraging to the bulls, but as long as the recent lows
are not
violated by much, a rebound closer to the DJI's neckline at 12700 is possible
A rally to
that level should be used to add short positions on the general market ETFs.
Our study
of all 7%-8% DJI sell-offs from new 12 month highs with a recovery
back above
the 21-day ma shows that without a Peerless Buy signal the odds are
very low of
a rally past the upper band and only 2 in 7 of a rally to it. Instead, we
should only
expect any recovery to only reach the 1.5% upper band.
Advances after 7% to 8% Declines from The DJI Peak
The
DJI was down 7% at its closing last Friday from its high, so far. A DJI
decline of 7%-8% most often breaks the upward momentum of the market
and
sets up only a weak technical rebound unless Peerless gives a Buy or
the
IP21 or OPct are positive or nearly so at the 7%-8% down closing.. Often
it
takes a successful test or two of the low closing to allow a rally to occur
past
the moving average to take place.
Right
now the market needs a Peerless Buy signal and a more improved IP21 and
OPct
to let us predict a rally back up to the recent highs. A successful test
of
Friday's lows will also help bring a better rebound.
I did
a study tonight of all the 7%-8% declines from a recent DJI high with
the
DJI then turning upwards above its 21-day ma to see what indicator readings
and
signal predicted the rally and how far it went. One thing that one sees
quickly in the data is that the next
rally often falters without even reaching the
upper band
and always brings a significant decline if there in now Peerless Buy.
32 Cases of 7%-8% DJI Declines from Their and Turns Upward
1928-2012:
Tests of Support, Peerless Signals, IP21, OPct and Outcome
In 7 of these 32 cases there was no Peerless buy signal on the rebound from
down 7%-8%. All later declined sharply. In only 2 cases did the DJI reach
the upper 3.5% band. It did rally to at least the 1.5% upper band in each case
if it got past the 21-day ma. A mildly negative IP21 reading, like we see now,
below -.05 occurred in
1939. This was one of the two cases where the DJI
reached the upper band.
The OPct we saw Friday (-.376) was bearishly below its level in all other of the
31 cases. Its low value is a result of the 12/14 streak of down days. Very low
OPct values on a 7%-8% sell-off below -.30 can lose their bearishness if
Peerless gives a Buy.
tests signals
IP21
Opct
Outcome
11/25/1939
1 NONE
-.049
-.007 Rally
to Upper band and then steep decline.
1/16/1940
4 NONE
-.14
-.143
Weak
rally to 2.5% upper
band and
collapse.
8/2/1943
2
NONE
-.161 -.214
Rally to upper band and then another 8% decline
7/23/1946
NONE
-.124 -.119
Weak rally to 1.5% upper band and collapse.
3/8/1966
1
NONE
-.223 -.29 Weak rally to
1.5% upper band and collapse.
6/23/1971
1 NONE
-.101 .04
Weak rally to 1.5% upper band and sell-off.
2/9/1977 NONE
-.072
-.215 Weak
rally to 1.5% upper band and collapse.
ALL CASES OF 7%-8% DJI SELL-OFFS
AND RECOVERIES BACK ABOVE THE 21-DMA
Date
Later Tests
Peerless IP21
OPct
Outcome
of Support Signals
5/21/2012
NONE -.045
-.376
not very weak weak
-------------------------------------------------------------------------------------------------------------------------------------
1 6/12/1928
2
B2
--------
-.303 NHs (new highs) followed
2 3/26/1929
2
B19
-.073 -.116 NHs followed
3 11/25/1939
1
NONE
-.049
-.007 Rally to UB and then steep decline.
4 1/16/1940
4
NONE
-.14
-.143
Weak rally to
2.5% upper band and
collapse.
5 12/23/1940
0.
B13
-.128
-.027 Weak rally to 1.5%
upper band and collapse.
6 8/2/1943
2
NONE
-.161
-.214 Rally to upper band and then another 8% decline
7 7/23/1946
NONE
-.124
-.119 Weak rally to 1.5% upper band and collapse.
Thie rally here occurred just after a broken neckline in H/S.
A rally in our present case might fail and bring a collapse, as shown here.
8 6/29/1951 on 5th test
B17
- .102 -.229 NHs followed
9 11/7/1951
1
B17
-.068 -.311 NHs followed
10 3/14/1955
B19
-.131
.023 NHs followed
11 3/8/1966
1 NONE
-.223 -.29 Weak
rally to 1.5% upper band and collapse.
12 6/23/1971 1
NONE
-.101 .04
Weak rally to 1.5% upper band and sell-off.
13 10/12/1976 1
B2/B9
-.026
-.333
Weak rally to 1.0% upper band and new low
and then upper band,
14 2/9/1977
NONE
-.072
-.215
Weak rally to 1.5% upper band and collapse.
15 7/5/1978
Buy B5
-.242
-.184 NHs followed
16 11/23/1982
Buy B5/B9 .009 .066 NHs followed
17 8/8/1983
Buy B5/B9
-.029
-.042
NHs followed
18 7/15/1986 2
Buy B9/B5/B17 -.051
-.028
Rally back to recent high.
19 9/12/1986 2 Buy B1
.041 -.171 Rally back to recent high.
20 9/21/1987
Buy B17
-.206
-.307
Weak rally to 3.0%
upper band and collapse.
21 10/13/1989
1
Buy B17
.007
.135
Rally back to recent high.
22 10/9/1992
Buy B17
-.032 -.338
Rally back to recent high.
23 7/16/1996
Buy B2/B17
.004
-.017
NHs followed
24 8/18/1997 2
Buy B9
.012 .128
Rally back to upper band and then
collapse.
25 1/9/1998
earlier Buys
-.037
-.32 NHs
followed
26 5/14/2004
Buy B2
-.061 -.046
Rally back to upper band and then further decline.
27 4/18/2005 1
Buy B19
-.206
-.266
Weak rally to1,5%
upper band and test of lows.
28 6/13/2006
Buy B14
-.132
-.092 Weak rally to 1.5% upper band and test of
lows.
29 7/14/2006
Buy B9
-.087
-.092
NHs followed
30 8/16/2007
Buy B14 followed -.088 -.182
Rally back to recent high.
31 7/10/2009
Buy B14 followed -.12
-.205
NHs followed
32 6/16/2011
Buy B17
-.111 -.046
Rally back to
upper band and then further sell-off.
.
=====================================================================================
OLDER HOTLINES
=====================================================================================
5/21/2012 TIGERSOFT HOTLINE
Key Values - Peerless-DJIA -
DJI 12504 +135 la/ma = .968 21dmaROC=
-.483 P= -313 P-Ch +58 IP21= -.045 V= -218 OP= - .357
Key Stocks: AAPL JPM and 6 highest priced DJI stocks : IBM CAT, - CVX - MCD MMM and XOM
KEY TigerSoft CHARTS and
INDUSTRY INDEXES
DIA SPY QQQ DJIA-Peerless
TigerDJI TigerSPY TigerQQQ GLD SLV Crude
Oil IWM-Russell-2000
--->
13 MAXCP stocks
Bullish MAXCP Stocks
--->
89 MINCP stocks
Bearish
MINCP Stocks Bearish plurality
MAXCP stocks are those showing Tiger Closing Power making new
highs.
This suggests heavy Professional Buying. Applying the Tiger Power Ranker's
"bullish" to the MAXCP stocks find those with heavy insider buying and Blue
institutional accumulation. Bearish
MINCP stocks show the opposite.
Coupling Closing Power new lows with heavy Red Distribution and
red Candle-sticks' predominating easily finds reliably weak stocks to short
when Peerless gives a Sell, with the exception of year-end when
selling pressures end suddenly when tax-loss selling does.
---> 10
new
highs on NASDAQ. 34 new lows on NASDAQ
Bearish plurality
---> 9
new
highs NYSE 20 new lows on NYSE Bearish plurality
Judged Sell S10.
Today Saw an Oversold Bounce-Back and
Short-Covering
It is very important for the bulls that the DJI not
quickly turn back down.
That
would leave more buyers stuck in prices above current levels and it would
have
run-in some of the shorts, reducing the buying cushion they represent.
The odds do
favor more of a rally. The Tiger Accumulation Index (IP21) and OPct Indicator
on the DJIA
chart are probably not negative enough now to bring another sell-off
until the
present rally fails near 12700. A break in the steep NYSE A/D Line downtrend
will spur
some short-covering by us. There is precedent (1977
and 1979)
for a
4%-5% rally in these conditions without a Peerless Buy. Waiting
for a
Peerless Buy signal usually works out best if you can ride out a brief
jump to
resistance which will most likely succeed and be followed by a deeper
decline.
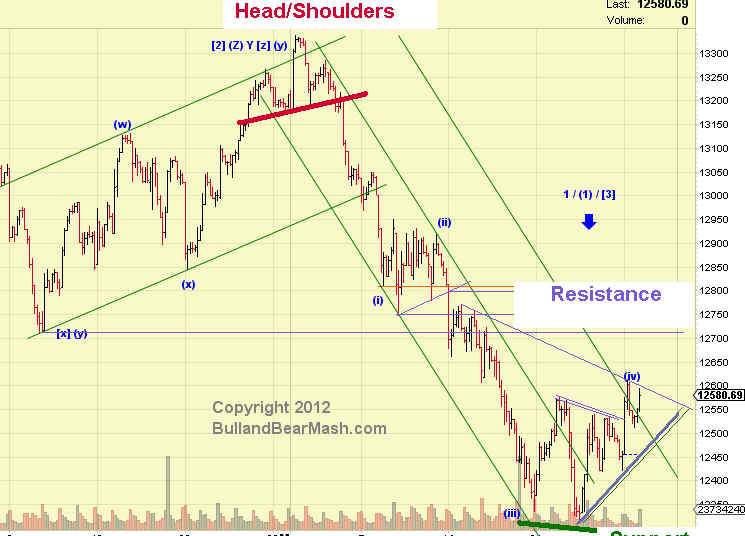
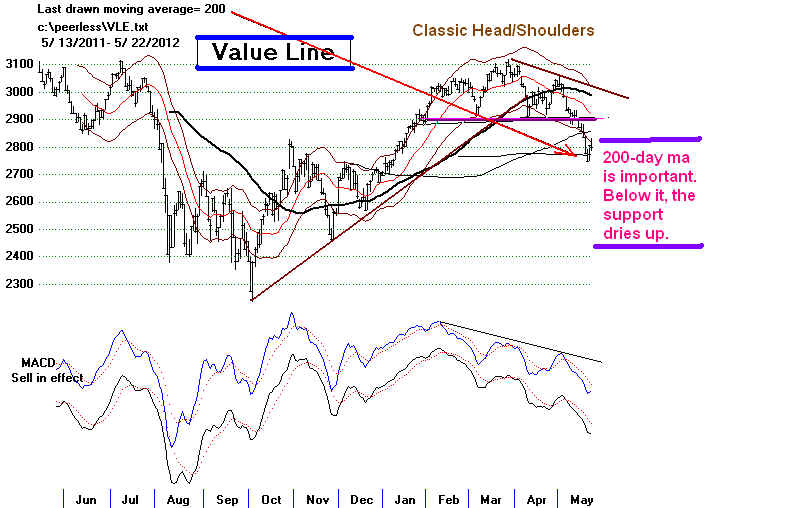
The head and shoulers patterns in the broad-based Value Line,
Russell-2000
and NYSE are clearly bearish. The minimum downside objective
has not been
reached by the DJI.
That would take a decline to 12200 approximately. In most cases,
it is not safe for
intermediate-term traders to buy until this lower level has been reached.
Seasonality is still
bearish. Since 1965, the DJI has risen only 43.5% of the
time in the week
following May 21st. This will work against a bigger recovery.
Facebook fizzled
today. That dampens the attraction of the market to the broader public.
It hurts other
underwritings and damages
JP Morgan's reputation further, as they
were
the lead underwriter and pushed for the high initial offering price of $38.
"It is an unusual situation for
the bank to find itself in. In the last year, it led the biggest technology
offerings, including those of LinkedIn, Groupon and Zynga. The activity has
been lucrative for the firm,
with the Facebook I.P.O. alone bringing in an estimated $67.8 million..."
Tiger Index of Big Banks.
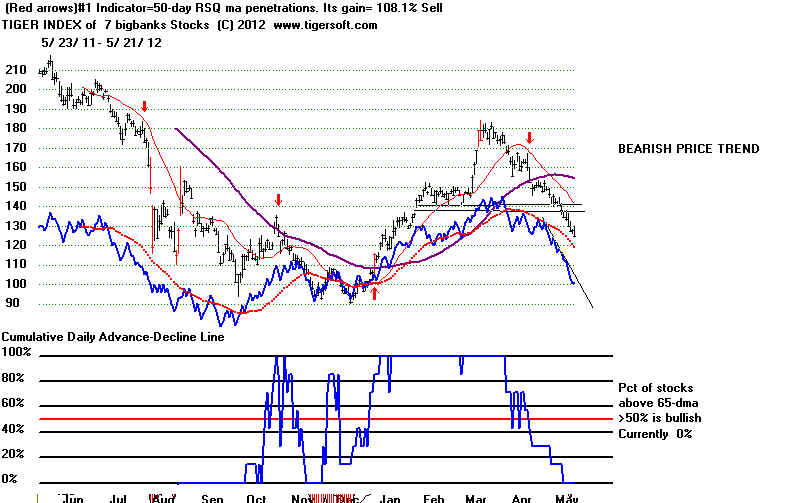
The Tiger Big
Banks Index and JPM fell today. I
would say that the big banks' stocks are
the key here. Fear that JPM's situation could worsen is a
significant fear-factor for the market.
The big banks
control so much of the trading. If they are under further pressure and
are forced, or
decide, to liquidate long positions, the markets will tumble. The circumstances
that could
produce this have not been changed by today's recovery, nor would they
even by a rally
back up to the 12700 resistance. These circumstances include:
1) Defaults in Greece, Spain, Ireland or Italy which would hurt the big banks that
sold credit
default swaps on this debt or own it outright;
2) US regulatory requirement changes to reduce the banks' use of leverage
when trading for
their own account so long as they are government back-stopped
as commercial and
public savings' banks that are too big to faill;
3) A government shut-down in August, caused by a breakdown in negotiations
between the
Republican Congress and the Obama Administration about raising the US
federal debt
ceiling.
 4)
More and more we hear from supporters for taxing
4)
More and more we hear from supporters for taxing
Wall Street short-term
trading profits and high
frequency trading.
Should
we raise taxes on Wall Street? - The Washington Post
AFL-CIO,
Dems push new Wall Street tax - TheHill.com
http://www.washingtonpost.com/blogs/ezra-klein/post/should-we-raise-taxes-on-wall-street/2012/05/19/gIQAX4BIZU_blog.html
http://economix.blogs.nytimes.com/2011/08/22/a-sales-tax-on-wall-street-transactions/
http://topics.nytimes.com/topics/reference/timestopics/subjects/h/high_frequency_algorithmic_trading/index.html
http://www.thefiscaltimes.com/Articles/2011/10/30/The-Tax-Plan-That-Occupy-Wall-Street-Loves.aspx#page1
This, of course, is not something either of the two
major Presidential candidates will even
mention,
but it has been enacted in the UK and in some countries in Europe. It might
be very
popular on Main Street and make many big bank stocks go into a dive.
On the positive side, I would say that it is definitely bullish that the DJI's
Peerless
internal strength indicators are not so negative now as they were in most of
the cases
where the DJI fell 12 of 14 days and then fell in 8 of these 12 earlier cases
of negative
streaking.
A 4%-5%
rally becomes quite possible when the steep NYSE A/D Line is violated, even
without a
Peerless Buy Signal. See the cases of 1977 and 1979.
I
have looked more closely back at the cases where the DJI fell 12 of 14 days,
as
now. The Accumulation Index is
much higher now than in all but one of
these 14
cases
and that one produced a rally. (1968). There is
not so much red distribution
now.
That could easily allow prices to rise back up to the broken resistance level
at
12750. The OPct indicator
is higher now than in all but 4 of the
12 earlier cases.
These
4 exceptions saw DJI rallies in 3 cases.
Below
are the details, if you are so inclined in this little study and links to their
charts.
In
four of the 12 negative streaking (12 of 14 days down for DJI, the DJI
immediately rallied. In one case, the DJI fell only 2.0% and then rallied.
Simply waiting for a Peerless Buy signal or a break
in the steep NYSE A/ D Line
worked very well in these cases in calling bottoms and long trading
opportunities. These are the cases.
1.===>
1967 12 of 14 days down on 11/8/1967. DJI rallied 7% in 2
months.
In this case there was a timely Peerless Buy B17 after the steep NYSE A/D Line
down-trend was penetrated. Chart
2. ===>
1968 10 of 12 days down on 8/5/1968. DJI then
rose 13% over next 16 weeks
Chart
3 ===> 1975
12 of 14 days down on 8/5/1974. DJI fell quickly from 810 to
791 and then rallied to UB
Chart
4.===>
1977 12 of 14 days down on 4/7/1977. DJI rallied 4% over
4 days
Chart
5 ===> 1979 12 of 14 days down on
10/26/1979. DJI rallied for 5 months.
Chart
--------------------------------- More Details of Study
------------------------------------------------------------------------------
Cases where DJI fell 12
of 14 days:
Streaking Down as Predictor: 8 declines 4 rallies.
Current case
2012 (12 of 14 days down on 5/21/2012.)
la/ma = .968 This is higher
than all but 3 of the 14 caases. 2/3 of these produced declines.
21dmaROC= -.483 This is lower than all
but 2 of the 14 cases. 1/2 of these produced declines.
OP= - .357 This is lower than all but 5 of
the 14 cases. 3/5 of these produced rallies.
IP21= -.045 This is significantly
lower than all but one of the cases and it produced a rally.
DJI did not rally on 14th day.
Signs:
Red = Bearishly below current key value
Green = Bullishly above current key value
1. ===> 1921 (12 of 14 days down on 5/25/1921. DJI then fell from 74 to 66 in 12 weeks.
DJI did not rally on 14th.
LA/MA = .936 (verus LA/MA = .968 now)
21dmaROC= -.702 (verus 21dmaROC= -.483 now)
Opct = -.542 (verus OPct= - .357 now)
---------------------------------------------------------------------------------------------------------------------------
2.===> 1932 (12 of 14 days down on 4/11/1932.
DJI then fell from 62 to 41 in 11 weeks,
DJI did not rally on 14th day.
LA/MA = .829 (verus LA/MA = .968 now)
21dmaROC= -3.809 (verus 21dmaROC=
-.483 now)
Opct = -.542 (verus OPct= -
.357 now)
IP21= -.214 (verus IP21= - .045 now)
---------------------------------------------------------------------------------------------------------------------------
3.===> 1962 (12 of 14 days down on 4/4/1962. DJI then fell from 696 to 534 in 11 weeks.
DJI did not rally on 14th day.
LA/MA = .977 (verus LA/MA = .968 now)
21dmaROC= -.189 (verus 21dmaROC=
-.483 now)
OPct = -.205 (verus OP= - .357 now)
IP21= -.094 (verus IP21= - .045 now)
---------------------------------------------------------------------------------------------------------------------------
4. ===> 1966 (12 of 14 days down on 3/3/1966. DJI then fell from 936 to 868 in 10 weeks,
DJI did not rally on 14th day.
LA/MA = .964 (verus LA/MA = .968 now)
21dmaROC= -.484 (verus 21dmaROC= -.483
now)
Opct = -.225 (verus OPct= -
.357 now)
IP21= -.148 (verus IP21= - .045
now)
---------------------------------------------------------------------------------------------------------------------------
5.===> 1967
(12 of 14 days down on 11/8/1967. DJI rallied 7% in 2 months.
DJI did not rally on 14th day.
LA/MA = .954 (verus LA/MA = .968 now)
21dmaROC= -1.114
(verus 21dmaROC= -.483 now)
Opct = -.686 (verus OPct= -
.357 now)
IP21= -.276 (verus IP21= - .045
now)
---------------------------------------------------------------------------------------------------------------------------
6. ===> 1968
10 of 12 days down on 8/51968. DJI then rose 13%
over next 16 weeks
DJI did not rally on 14th day.
LA/MA = .969 (verus LA/MA = .968 now)
21dmaROC= -.346
(verus 21dmaROC= -.483 now)
OPct = -.154 (verus
OPct= - .357 now)
IP21= -.043 (verus IP21= - .045
now)
---------------------------------------------------------------------------------------------------------------------------
7.===> 1973 12 of 14 days down on 2/8/1973. DJI started long 1973-1974 bear market
DJI did not rally on 14th day.
LA/MA = .96 (verus
LA/MA = .968 now)
21dmaROC= -.94 (verus 21dmaROC=
-.483 now)
OPct = -.597 (verus
OPct= - .357 now)
IP21= -.281 (verus IP21= - .045 now)
(The case of 9/27/1973 occurs 9 months into a bear market and is
not considered here.
It was the second occurrence in 1974.)
---------------------------------------------------------------------------------------------------------------------------
8. ===> 1974 12 of 14 days down on
8/28/1974. DJI fell quickly from 667 to 587 in next five
weeks..
DJI did not rally on 14th day.
LA/MA = .905 (verus
LA/MA = .968 now)
21dmaROC= -1.589 (verus 21dmaROC=
-.483 now)
OPct = -.404 (verus OPct= - .357 now)
IP21= -.295 (verus
IP21= - .045 now)
---------------------------------------------------------------------------------------------------------------------------
9.===> 1975 12 of 14 days down on
8/5/1975. DJI fell quickly from 818 to 791 and then rallied to UB
DJI did not rally on 14th day.
LA/MA = .955 (verus
LA/MA = .968 now)
21dmaROC= -.713 (verus 21dmaROC=
-.483 now)
OPct = -.543 (verus OPct= - .357 now)
IP21= -.169 (verus
IP21= - .045 now)
---------------------------------------------------------------------------------------------------------------------------
10.===> 1977 12 of 14 days down on 4/7/1977. DJI rallied 4% over 4 days
and then resumed year-long bear market.
DJI did not rally on 14th day.
LA/MA = .962 (verus LA/MA = .968 now)
21dmaROC= -.619 (verus 21dmaROC=
-.483 now)
OPct = -.238 (verus
OPct= - .357 now)
IP21= -.169 (verus
IP21= - .045 now)
---------------------------------------------------------------------------------------------------------------------------
11 ===> 1979 12 of 14 days down on
10/26/1979. DJI rallied for 5 months.
DJI did not rally on 14th day.
LA/MA = .957 (verus
LA/MA = .968 now)
21dmaROC= -1.095 (verus 21dmaROC=
-.483 now)
OPct = -.489 (verus
OPct= - .357 now)
IP21= -.14 (verus
IP21= - .045 now)
---------------------------------------------------------------------------------------------------------------------------
12 ===> 1981 12 of 14 days down on
7/15/1981. DJI started year-long 1977-1978 bear market.
DJI did not rally on 14th day.
LA/MA = .977 (verus LA/MA = .968 now)
21dmaROC= -.703 (verus 21dmaROC=
-.483 now)
OPct = -.362 (verus
OPct= - .357 now)
IP21= -.165 (verus
IP21= - .045 now)
====================================================================================
OLD HOTLINES
====================================================================================
5/18/2012 TIGERSOFT HOTLINE
Key Values - Peerless-DJIA -
DJI 12369 -73 la/ma = .956 21dmaROC= -.541 P= -371 P-Ch -49 IP21= -.082 V=
-235 OP= - .362
Key Stocks: AAPL JPM and 6 highest priced DJI stocks : IBM CAT, - CVX - MCD MMM and XOM
KEY TigerSoft CHARTS and
INDUSTRY INDEXES
> Minimum
Downside Objective Has Not Been Reached.
> Rising
200-day ma support is at 12212, 147 points lower.
> Volume has
not reached panic or climax levels.
> An up-day is
likely, but without a Buy Signal, stay mostly short if hedged.
> 12 of 14
down-days is twice as likely to signal a deeper decline than a rally of of 4% or more.
> Big Banks
have made Great Short Sales when Peerless gives a Sell.
> New update available to show Peerless signals' trading results of all
stocks in a directory.
No Buy B2s allowed with 35 trading days of each other. See bottom of this day's
report.
DIA SPY QQQ DJIA-Peerless
TigerDJI TigerSPY TigerQQQ GLD SLV Crude
Oil IWM-Russell-2000
--->
13 MAXCP stocks
Bullish MAXCP Stocks (none tonight)
Traders should probably
concentrate buyiing on highest AI/200 stocks in DJI--30 and SP-500.
that show best gains when Peerless is on a Buy. which we hope is not far away.
DJI HD AI/200=167 DIS AI/200=155 XOM AI/200=154
SP-500 SO AI/200=172 DUK AI/200=172 EFX AI/200=171
--->
343 MINCP stocks
Bearish
MINCP Stocks Bearish plurality
MAXCP stocks are those showing Tiger Closing Power making new
highs.
This suggests heavy Professional Buying. Applying the Tiger Power Ranker's
"bullish" to the MAXCP stocks find those with heavy insider buying and Blue
institutional accumulation. Bearish
MINCP stocks show the opposite.
Coupling Closing Power new lows with heavy Red Distribution and
red Candle-sticks' predominating easily finds reliably weak stocks to short
when Peerless gives a Sell, with the exception of year-end when
selling pressures end suddenly when tax-loss selling does.
---> 3
new
highs on NASDAQ. 135 new lows on NASDAQ
Bearish plurality
---> 5
new
highs NYSE 111 new lows on NYSE Bearish plurality
Judged Sell S10. Key Well-Tested Support Has Failed.
The head and shoulers patterns in the Value Line, Russell-2000 and NYSE now are
classic.
The left and right
shoulders are nearly symmetrical. The necklines are nearly flat
and they have been
decisively penetrated. Compare the current charts of these
indexes with the DJI's
most symmetrical head/shoulders patterns since 1886.
as shown on
http://tigersoft.com/PeerInst-2012/HS-SellS10/index.html
Typically when the neckline is decisively violated in the
DJI, there is no rally back to the
neckline until the
minimum downside objective has been reaached. Remember that the
minimum downside
objective is represented by the height of the pattern before the violation
subtracted form the
neckline. Here i reckon the DJI's downside objective is 12100.
This was so in 5 of the 7 cases where a classic
head/shoulders pattern formed.
1895 - Minimum downside objective reached and then DJI rallied back slightly above
neckline, churned for 3
months and then collapsed.
1903 - Minimum downside objective reached and then DJI rallied back slightly above
neckline, churned for 3
months and then collapsed.
1913 - DJI declined 2x the minimum downside objective and then recoverd 50% of decline
and then collapsed.
June 1930 - Minimum downside objective reached and DJI rallied back 33% of decline
and then collapsed.
October 1932 - DJI fell 10% below neckline and then rallied back to neckline and
then declined for 6
months.
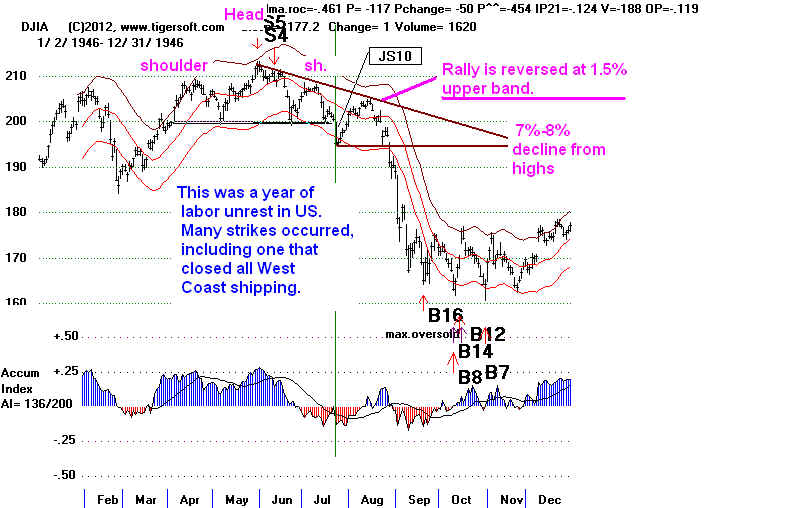
July 1946 - DJI fell 3% below neckline and then rallied back to 21-day ma, formed"
another head/shoulders and
fell sharply far below minimum downside objective.
July 1971 - DJI fell 3% below neckline and then rallied back to 21-day ma, formed
another head/shoulders and
fell down to minimum downside objective.
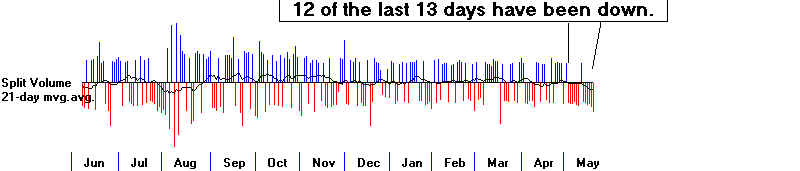
The DJI has now fallen 12 of the last 13 days. If we assume that it
rallies on Monday - and
that seems likely
because there are no previous cases of the DJI declining 13 of 14 days -
then bere are the cases
since 1915 where the DJI fell 12 of 14 days.
Streaking Down as
Predictor: 8 declines 4 rallies.
===> 1921 (12 of 14 days down on
5/25/1921. DJI then fell from 74 to 66 in 12
weeks. ,
===> 1932 (12 of 14 days down on 4/11/1932. DJI then fell from 62 to 41 in 11 weeks. ,
===> 1962 (12 of 14 days down on 4/4/1962. DJI then fell from 696 to 534 in 11 weeks.
===> 1966 (12 of 14 days down on 3/3/1966. DJI then fell from 936 to 868 in 10 weeks.
===>
1967 (12 of 14 days down on 11/8/1967. DJI rallied 7% in 2
months.
===> 1968
10 of 12 days down on 8/51968. DJI then rose 13%
over next 16 weeks
===> 1973 12 of 14 days down on 2/8/1973.
DJI started long 1973-1974 bear market
===> 1974
12 of 14 days down on 8/28/1974. DJI fell quickly from 667 to
587 in next five weeks..
===> 1975 12 of 14 days down
on 8/28/1974. DJI fell quickly from 818 to 791
===> 1977 12 of 14 days down on 4/7/1977. DJI rallied 4% over 4 days
and then resumed year-long bear market.
===> 1979 12 of 14 days down on
10/26/1979. DJI rallied for 5 months.
===> 1981 12 of 14 days down on 7/15/1981. DJI started year-long 1977-1978 bear market.
Big Banks
have made Great Short Sales
when Peerless gives a Sell for the last year.
I have written new software to let users see which
stocks are traded most effectively
when using the Peerless
reversing Buys and Sells. Elite Subscribers can
download the
latest Peerless.exe
now. Instructions are there. It produces a table like
the one shown below
for all the stock in a
directory. Gains of more than 50% would have been achieved for the last
12 months using only
the Peerless Sells to Buys, where we go short of the Sells and cover on
the Buys. The tables now show the number of
winning and losing trades and the number of
trades, long or short,
showed a paper loss of more than 5% or 10%. With JPM, there
were no paper losses of
more than 10% on the short side, but two between 5% and 6.7%,
using th enext day's
opening prices to take and close out positiions. This update also
does not allow Peerless
B2s to occur within 30 trading days of each other. Users of the
Tiger Power Ranker and
Peerless dated later than 2010 can get this update for $75.
It is $295 for
others. Email me if interested.
When bad news hits a stock. You can usually trade it
short profitably
for so long as Professionals agree and the Closing Power is falling.
Peerless Signals and Trading Gains Starting with $10000
-------------------------------------------------------
Directory=C:\bigbanks
 5/ 23/ 11 - 5/ 18/ 12
Number of Symbols= 7
Symbol        $10000.       Biggest--     Gains/Losses  5% Stops-    10% Stops
------        becomes       Paper----     ------------  triggered    triggered
------        -------       Loss Pct
============================================================================
BAC Long       12418         22.4          3   3         4            2
BAC Short      15012         25.3          5   2         2            2
C Long         14266         18.6          4   2         2            2
C Short        19091         16            5   2         2           1
GS Long        11171         13.9          3   3         3            2
GS Short       14261         13            5   2         3            1
JPM Long       13827         13            4   2         2            1
JPM Short      15209        6.7           5   2         2
MS Long        10621         18            3   3         4            2
MS Short       15674        18.2          5   2         4            2
WFC Long       13423         8.7           5   1         3
WFC Short      11825         7.6           4   3         2
MET Long       12631         11.3          4   2         3           1
MET Short      16152        13.6          5   2         2           1


====================================================================================
                                                         OLDER HOTLINES

        5/17/2012    TIGERSOFT HOTLINE
       Key Values - Peerless-DJIA -
       DJI  12442 -156 la/ma = .96   21dmaROC= -.541  P= -321   P-Ch =59  IP21= -.029  V= -105  OP= - .304

   KEY TigerSoft CHARTS and INDUSTRY INDEXES
     DIA    SPY    QQQ    DJIA-Peerless     TigerDJI   TigerSPY   TigerQQQ   GLD   SLV  Crude Oil  IWM-Russell-2000


       Key Stocks: AAPL  JPM and 5 highest priced DJI stocks: IBM    CAT, -  CVX -   MCD  MMM and XOM

    --->     23 MAXCP stocks     Bullish MAXCP Stocks (none tonight)
       --->       288   MINCP stocks      Bearish MINCP Stocks      Bearish plurality
                                 MAXCP stocks are those showing Tiger Closing Power making new highs.
                                This suggests heavy Professional Buying.  Applying the Tiger Power Ranker's
                                "bullish" to the MAXCP stocks find those with heavy insider buying and Blue
                                 institutional accumulation.  Bearish MINCP stocks show the opposite.
                                 Coupling Closing Power new lows with heavy Red Distribution and
                                 red Candle-sticks' predominating easily finds reliably weak stocks to short
                                 when Peerless gives a Sell, with the exception of year-end when
                                 selling pressures end suddenly when tax-loss selling does.

       --->  5   new highs on NASDAQ. 124 new lows on NASDAQ    Bearish plurality
        --->  3    new highs NYSE  128 new lows on NYSE   Bearish plurality

               Judged Sell S10.  Key Well-Tested Support Has Failed.
    The DJI is now confirming the breakdowns in the broader based
    Indexes like, the NYSE and Value Line/

    A Perfect Storm seems to be descending on us.  Expect a brutal,
    and nasty Presidential Election campaign.  This will hurt confidence
    even more.  If you thought the Debt Ceiling Crisis was bad last year
    when the DJI fell 16%, wait until you see what it can do this
    year from a higher diving board.

                     Falling Prices Are often Self-Cascading because:

                       1)   Leveraged positions must be reversed by banks and traders;

                       2)   It is only when prices fall sharply that we seem to learn of the
                             Fraud, Lies and Dangers that always become imbedded in a long rally;
                            (Now JPM's trading losses may reach $5 bil)

                       3)   Stock Market trends always vector too far, too fast and the high performance
                             trend-chasing traders' Game of Musical Chairs" always ends in a selling rush.

                       4)   Experienced traders know that they must anticipate the reactions of
                             others.   In a bear market, first there is denial and paralysis.  Only when
                             the "deer in the headlights" phase passes, does the real panic occur.

                       5) Margin calls can force over-extended traders to liquidate all their positions,
                             especially if they have made the mistake of doubling-down and using
                             too much leverage..

               Reinstate the Sell S15.  Consider the "Buy B2" a mistake that should have
       been avoided.  Waiting one more day after a Buy B2 was suggested.  Employing a
       second Buy B2 so soon after an earlier B2, especially when there existed a well-tested
       support that could dangerously give way, should have been emphasized more.

                       Now we are seeing the selling produced by a key support failure in an 36 month-
       old bull market that looks dangerously over-extended.   A Decline simply to 12050-12100
       would only achieve the Minimum Downside Target.  Without new Peerless Buy signals,
       we cannot rule out another bigger sell-off like in 1920, 1932 (I surely hope not) or 1960,
       when the economies were in recession and the DJI declined badly.

                      Add More Shorts on A Friday recovery.  Monday's Usually Bring More
       Declines in Sell-offs.

       I would not look for much of a recovery yet.   There is still more downside risk than upside
       potential, until Peerless gives a Buy, or we see breaks in the declining trends of the
       CLosing Power and the A/D Line.  12650 is the resistance now.  It was the point of DJI breakdown.
       12100 is the expected support.

       The DJI has now fallen 11 of the last 12 days.  I can find  one other case like this in the past,
       For the years that I have had time to look at,. the odds are 7:3 in favor of a substantial decline
       when we see 10 of 13 days down.  If we see 11 of 14 down days, the odds are then 5: 3 for
       a further substantial decline with little or no rally.  On this basis a rally Friday and Monday
       would not tilt the odds very much to the upside.   Stay hedged.

            More of these numbers in the next few days....

          ===>    1929 (10 of 13 days down on 10/9/1929.  DJI then fell from 347 to 200 in 5 weeks.
                       1930 (9 of 12 days down on 5/8/1930.  DJI then rose 3% over next 3 weeks and
                                 then fell from 274.5 on 6/2/1930 to 160  in 6 months.
          ===>     1931 (11 of 13 days down on 4/9/1931.  DJI then fell from 169 to 130  in 8 weeks.
           ===>  1932 (12 of 14 days down on 4/11/1932.  DJI then fell from 62 to 41  in 11 weeks.
                       1933 (8 of 10 days down on 3/31/1933.  DJI advanced from 55 to 109 in 3 months.
           ===>  1937 (11 of 13 days down on 9/3/1937.  DJI then fell from 172 to 113 in 10 weeks.
          ===> >1938 (10 of 13 days down on 3/8/1938.  DJI then fell from 110 to 101 in one week..
                       1940 (8 of 11 days down on 5/24/1940.  DJI then rallied 21% to peak on  11/7/1940.
           ===>   1941 (11 of 14 days down on 12/23/1941 - DJI rallied 7% to upper band and then fell 18% more.
           ===>   1946 (11 of 14 days down on 6/21/1946 - DJI rallied 3.5% and then fell 22% more.
                       1947 (9 of 10 days down on 5/20/1947.  DJI then rose 14% over next 9 weeks
          ===>   1962  (12 of 14 days down on 4/4/1962.  DJI then fell from 696 to 534  in 11 weeks.
           ===>   1966 (12 of 14 days down on 3/3/1966.  DJI then fell from 936 to 868  in 10 weeks.
           ===>   1967 (12 of 13 days down on 11/8/1967.  DJI rallied 7% in 2 months.
           To be continued...
            ===>  1968    10 of 12 days down on 8/51968.  DJI then rose 13% over next 16 weeks
             ===>  1969 15 of 17 days down on 6/3/1968. DJI started 1969-1970 bear market.
                       1970 (11 of 14 days down on 10/8/1970.  DJI  rose 7% over next 2 weeks and
                                 then fell 26% in 6.5 months.
            ===>  1972   13 of 15 days down on 9/21/1972.  DJI rallied from 939 to 1951 in 11 weeks.
             ===>  1973  12 of 14 days down on 2/8/1973.  DJI started long 1973-1974 bear market.
             ===> 1974   10 of 13 days down on 5/30/1975.  DJI rallied 7% and then fell 32% in 15 weeks..
                       1978
                       1979
                       1980
                       1982
                       1986
                       1987   (9 of 11 days down on 10/19/1987.  DJI then rallied 13% before re-testing lows.
                       1990
                       1997
                       1998
                       1999
                       2000
                       2001
                       2002
                       2007
                       2008
                       2009
       But will look some more after the basic hotline here is done.   The minimum downside target is
       obtained by finding the difference between the DJI's closing high recently,  13286  and the DJI's
       level at neckline if line dropped down tron high, 12686.  This is 600 points.  Next subtract
       this difference, the height of the previous price pattern,  600 points, from the point of breakdown,
       which I reckon to be 12650.  The resulting number, 12050, is the minimum downside target.

                                                 Can We Hope for Some, Any Good News?

        This decline could certainly get much worse. There are so many dark clouds.
.
        Could Obama's Administration being preparing a "rally round the flag" attack on Iran?
        U.S. Envoy to Israel Says Nation Is Ready on Iran By NY Times
        Dan Shapiro told the Israeli bar association that preparations had been made for a possible attack.

        Greece could default soon on its debt to the big banks.  US banks would be hit hard.
        A Greek Exit? Euro Zone May Be Ready    By  NY Times
        Years of foot-dragging and brinkmanship have prepared the currency union for life without Greece.
Key Stocks: AAPL JPM and 5 highest priced DJI stocks: IBM CAT, - CVX - MCD MMM and XOM
---> 23 MAXCP stocks Bullish MAXCP Stocks (none tonight)
---> 288 MINCP stocks Bearish MINCP Stocks Bearish plurality
MAXCP stocks are those showing Tiger Closing Power making new highs.
This suggests heavy Professional Buying. Applying the Tiger Power Ranker's
"bullish" to the MAXCP stocks find those with heavy insider buying and Blue
institutional accumulation. Bearish MINCP stocks show the opposite.
Coupling Closing Power new lows with heavy Red Distribution and
red Candle-sticks' predominating easily finds reliably weak stocks to short
when Peerless gives a Sell, with the exception of year-end when
selling pressures end suddenly when tax-loss selling does.
---> 5 new highs on NASDAQ. 124 new lows on NASDAQ Bearish plurality
---> 3 new highs NYSE 128 new lows on NYSE Bearish plurality
Judged Sell S10. Key Well-Tested Support Has Failed.
The DJI is now confirming the breakdowns in the broader based
Indexes like, the NYSE and Value Line/
A Perfect Storm seems to be descending on us. Expect a brutal,
and nasty Presidential Election campaign. This will hurt confidence
even more. If you thought the Debt Ceiling Crisis was bad last year
when the DJI fell 16%, wait until you see what it can do this
year from a higher diving board.
Falling Prices Are often Self-Cascading because:
1) Leveraged positions must be reversed by banks and traders;
2) It is only when prices fall sharply that we seem to learn of the
Fraud, Lies and Dangers that always become imbedded in a long rally;
(Now JPM's trading losses may reach $5 bil)
3) Stock Market trends always vector too far, too fast and the high performance
trend-chasing traders' Game of Musical Chairs" always ends in a selling rush.
4) Experienced traders know that they must anticipate the reactions of
others. In a bear market, first there is denial and paralysis. Only when
the "deer in the headlights" phase passes, does the real panic occur.
5) Margin calls can force over-extended traders to liquidate all their positions,
especially if they have made the mistake of doubling-down and using
too much leverage..
Reinstate the Sell S15. Consider the "Buy B2" a mistake that should have
been avoided. Waiting one more day after a Buy B2 was suggested. Employing a
second Buy B2 so soon after an earlier B2, especially when there existed a well-tested
support that could dangerously give way, should have been emphasized more.
Now we are seeing the selling produced by a key support failure in an 36 month-
old bull market that looks dangerously over-extended. A Decline simply to 12050-12100
would only achieve the Minimum Downside Target. Without new Peerless Buy signals,
we cannot rule out another bigger sell-off like in 1920, 1932 (I surely hope not) or 1960,
when the economies were in recession and the DJI declined badly.
Add More Shorts on A Friday recovery. Monday's Usually Bring More
Declines in Sell-offs.
I would not look for much of a recovery yet. There is still more downside risk than upside
potential, until Peerless gives a Buy, or we see breaks in the declining trends of the
CLosing Power and the A/D Line. 12650 is the resistance now. It was the point of DJI breakdown.
12100 is the expected support.
The DJI has now fallen 11 of the last 12 days. I can find one other case like this in the past,
For the years that I have had time to look at,. the odds are 7:3 in favor of a substantial decline
when we see 10 of 13 days down. If we see 11 of 14 down days, the odds are then 5: 3 for
a further substantial decline with little or no rally. On this basis a rally Friday and Monday
would not tilt the odds very much to the upside. Stay hedged.
More of these numbers in the next few days....
===> 1929 (10 of 13 days down on 10/9/1929. DJI then fell from 347 to 200 in 5 weeks.
1930 (9 of 12 days down on 5/8/1930. DJI then rose 3% over next 3 weeks and
then fell from 274.5 on 6/2/1930 to 160 in 6 months.
===> 1931 (11 of 13 days down on 4/9/1931. DJI then fell from 169 to 130 in 8 weeks.
===> 1932 (12 of 14 days down on 4/11/1932. DJI then fell from 62 to 41 in 11 weeks.
1933 (8 of 10 days down on 3/31/1933. DJI advanced from 55 to 109 in 3 months.
===> 1937 (11 of 13 days down on 9/3/1937. DJI then fell from 172 to 113 in 10 weeks.
===> >1938 (10 of 13 days down on 3/8/1938. DJI then fell from 110 to 101 in one week..
1940 (8 of 11 days down on 5/24/1940. DJI then rallied 21% to peak on 11/7/1940.
===> 1941 (11 of 14 days down on 12/23/1941 - DJI rallied 7% to upper band and then fell 18% more.
===> 1946 (11 of 14 days down on 6/21/1946 - DJI rallied 3.5% and then fell 22% more.
1947 (9 of 10 days down on 5/20/1947. DJI then rose 14% over next 9 weeks
===> 1962 (12 of 14 days down on 4/4/1962. DJI then fell from 696 to 534 in 11 weeks.
===> 1966 (12 of 14 days down on 3/3/1966. DJI then fell from 936 to 868 in 10 weeks.
===> 1967 (12 of 13 days down on 11/8/1967. DJI rallied 7% in 2 months.
To be continued...
===> 1968 10 of 12 days down on 8/51968. DJI then rose 13% over next 16 weeks
===> 1969 15 of 17 days down on 6/3/1968. DJI started 1969-1970 bear market.
1970 (11 of 14 days down on 10/8/1970. DJI rose 7% over next 2 weeks and
then fell 26% in 6.5 months.
===> 1972 13 of 15 days down on 9/21/1972. DJI rallied from 939 to 1951 in 11 weeks.
===> 1973 12 of 14 days down on 2/8/1973. DJI started long 1973-1974 bear market.
===> 1974 10 of 13 days down on 5/30/1975. DJI rallied 7% and then fell 32% in 15 weeks..
1978
1979
1980
1982
1986
1987 (9 of 11 days down on 10/19/1987. DJI then rallied 13% before re-testing lows.
1990
1997
1998
1999
2000
2001
2002
2007
2008
2009
But will look some more after the basic hotline here is done. The minimum downside target is
obtained by finding the difference between the DJI's closing high recently, 13286 and the DJI's
level at neckline if line dropped down tron high, 12686. This is 600 points. Next subtract
this difference, the height of the previous price pattern, 600 points, from the point of breakdown,
which I reckon to be 12650. The resulting number, 12050, is the minimum downside target.
Can We Hope for Some, Any Good News?
This decline could certainly get much worse. There are so many dark clouds.
.
Could Obama's Administration being preparing a "rally round the flag" attack on Iran?
U.S. Envoy to Israel Says Nation Is Ready on Iran By NY Times
Dan Shapiro told the Israeli bar association that preparations had been made for a possible attack.
Greece could default soon on its debt to the big banks. US banks would be hit hard.
A Greek Exit? Euro Zone May Be Ready By NY Times
Years of foot-dragging and brinkmanship have prepared the currency union for life without Greece.
Spain's credit rating has just been
lowered. Its borrowing costs will rise higher. The Spanish
Government says it is determined to take the
Greek path of the last two years, namely banker-
enforced austerity. But with 50% youth
unemployment, it is doubtful it dare persist. So, Spain, too,
is likely to default. And that will lead
to Italy. This you have been told by the mainstream media.
Mainstream
Media Omissions
Will US become even more of a haven for
flight and hot money from Europe? The strength of the
Dollar shows this is important.
But, the US banks may not be all that safe. If JP Morgan
is the premier US banks, in Obama's
opinion, at least, and was hurt least among the big banks
in the 2008-9 financial nightmare, what
does it say now, when their unregulated trading overseas
has become dangerously out of control?
They bet heavily that interest rates could not go lower.
The Fed probably told them that this was
a safe bet. But, interest rates have dropped a lot in the
last two weeks. Investment capital,
the world over, is scared by developments in Europoe and
by the rapid fall in US stock prices .
It swishes into Bonds and US Treasuries, just as it did in 2008.
But this hurts JP Morgan, which has bet
heavily that interest rates will not fall. And so JPM
plunges. Is this another Lehman
Brothers? JPMorgan is different. It is a huge commercial
bank. Its decline and collapse
would strain the FDIC to a breaking point. Another bank bailout
might be needed. Their capital
reserve requirements will force them to sell off many of their
investments. We are probably seeing
this now.
A perfect economic storm is gathering butthere is no
real leadersip that will face up to the
challenges and demand shared sacrifices. If
miraculously there was a leader, I would expect
the Senate to block any such leader's program by a
fillibuster and its anti-democratic 60%
vote requirement. And if the Senate did pass a new
programs, odds are the Supreme Court
would rule it unconstitutional.
Romney rise in the polls is not cheering Wall Street.
I think this is because they are smart
enough to know form the European experience, at
least, that applying Draconian austerity
cuts now to government spending in a recession could
produce a disastrous drop in Demand for
Goods and Services, a lot more lay-offs, far less
consumption, investor fear and still more
lay-offs as well as reduced tax revenue and still
more Austerity until we reached a social breaking
point like Greece and Spain may be now.
No one in the US, except academics mention this.
In DC, the policy-makers who dominate both parties do
not know or want to admit the mistakes
of their outdated economic policies.
Now Fear and Nationalism are on the rise again.
A New Deal with Government created jobs
is not want Americans want. Right now Main
Street's confidence in Government is
approaching absolute zero on Main Street.
They do not trust Washington. Most Americans,
judging from the polls, want a dramatically reduced
military budget. But neither party supports
that idea. Most Americans did not want the big
banks to be bailed out or to be allowed to speculate
wildly with the government subsidized loans and Main
Street savings, but both parties's leaders
refuse the obvious, which is to break up the big
banks and re-establish Glass Steagall.
====================================================================================
OLDER HOTLINE
====================================================================================
5/16/2012 TIGERSOFT
HOTLINE
Key Values - Peerless-DJIA -
DJI 12599 -33 la/ma = .97 21dmaROC= -.473 P= -263 P-Ch =129 IP21= -.032 V= -201 OP= - .323
Dubious Buy B2 vs Judged Sell S10
The DJI has now fallen
10 of the last 11 days. It is OVER-SOLD.
See DJI's Stochastic-20 below.
But it is also highly unusual for the DJI to show
such pronounced weakness.
If the DJI fails to rally Thursday the 17th, we'll
see if there are past cases so dismal.
>Marginal DJI Judged S10 (JS10).
Penetration
here is of well-tested support using DJI Closing Prices,
not Intra-Day or Hypothetical Highs and Lows.
>The Lower Band Did Hold. 15% of Head/Shoulders and Judged S10s do fail.
See all the Judged Sell
S10s since 1915. This is a work in progress.
It will help us see how reliable a judged S10 is and how better to
recognize how they fail.
I would not use a marginal Judged S10 like this to go short. A more decisive
penetration is needed or, even better another rally that fails.
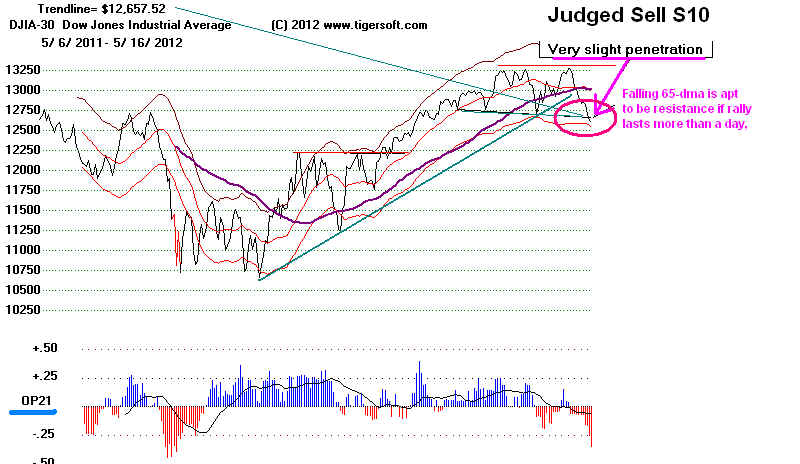
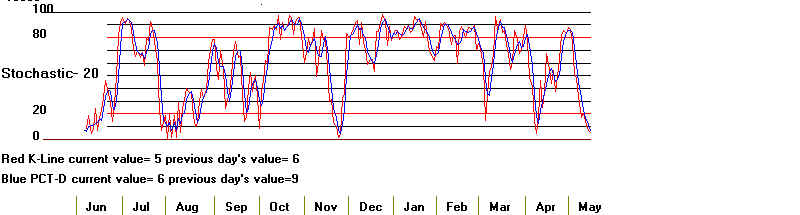
Key Stocks: AAPL JPM and 5 highest priced DJI stocks: IBM CAT, - CVX - MCD MMM and XOM
--->
96 MAXCP stocks
Bullish MAXCP Stocks Bearish plurality
--->
204 MINCP stocks
Bearish
MINCP Stocks
MAXCP stocks are those showing Tiger Closing Power making new
highs.
This suggests heavy Professional Buying. Applying the Tiger Power Ranker's
"bullish" to the MAXCP stocks find those with heavy insider buying and
institutional accumulation. Bearish
MINCP stocks show the opposite.
Coupling Closing Power new lows with heavy red Distribution and
red Candle-sticks' predominating easily finds reliably weak stocks to short
when Peerless gives a Sell, with the exception of year-end when
selling pressures end suddenly when tax-loss selling does.
---> 11 new
highs on NASDAQ. 94 new lows on NASDAQ
Bearish plurality
---> 13
new
highs NYSE 104 new lows on NYSE Bearish plurality
A Facebook Rally?
A rally to 12900 would set up a
more symmetrical, more dangerous Head/Shoulders.
On Friday, Facebook goes public.
Wall Street will make a lot of money in this.
It does not want to spoil
Facebook's debut. A rally
seems most likely.
Facebook's success is needed to
bring small investors back into the market.
And its success may boost stock
prices for a few trading days or a week afterwards.
On the other hand, if Facebook's
offer were to disappoint, it would be bearish.
Facebook hype: Symbol will be "FB". Opening price $38/share.
Facebook
IPO frenzy 'has gone viral'
Facebook
IPO triggers retail investors craze, expert sees up to 30% jump on debut
Facebook
Offers More Shares in Stock Debut
NYSE
Beefs Up Electronic Systems For Facebook Debut
>Can a Rebound in the DJI start a rally that goes
high enough to bring
a timely reversing
Peerless Sell. The risk here is that any rally will be snuffed
out between 12700 and 12950.
That would set up a "two-heads and shoulders pattern,
which could set off a
another sell-off. Rallies that fail at the falling 65-day ma
with the Accumulation
index negative usually make very good short sales.
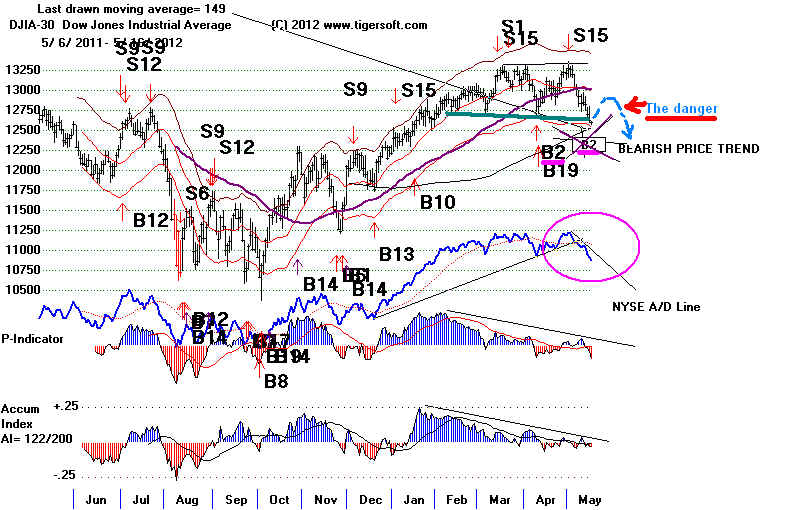
DJIA is at lower band, just below broken well-tested Support
but without a reliable Buy from
Peerless except the dubious "B2".
>We Need a New Buy Signal to
believe any rally will be significant.
But shorting at the
lower band is not wise and risky now.
>Stay Hedged with a mix of bullish
MAXCP and Bearish MINCP Stocks.
> A Minor Short-Term Bouce is Likely.
>Completed
H/S in NYSE, VALUE LIne, NASDAQ,
SP-500 are usually bearish.
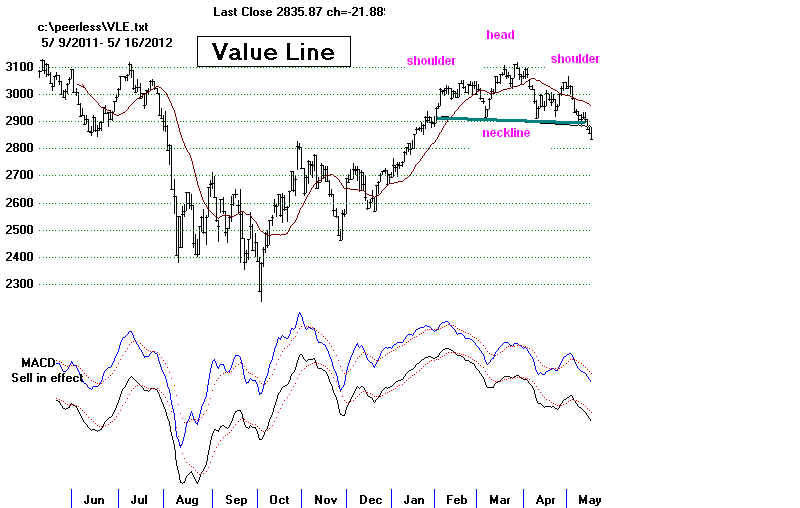
>Closing Power Uptrends were broken.
Professionals will have to switch to being
net buyer after the Opening to
reverse CP downtrend.
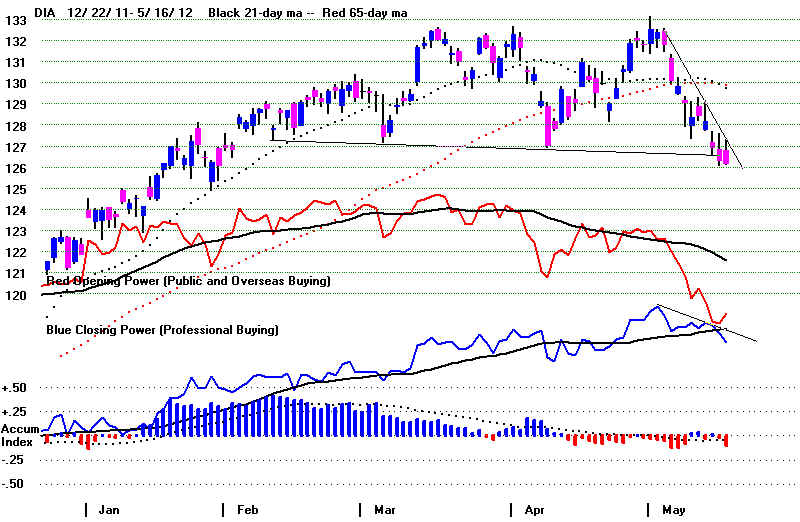
News to Watch for:
> A new Greek Govt in June could take Greece out
of Euro Zone.
Greece's
anti-bailout SYRIZA leftists lead in poll
In Parliamentary elections there, the leading party is awarded 50 extra seats
to help it form goverment. There are 300 seats. The May 6 elections
saw SYRIZA get 16.8% of votes while the two pro-Bailout Parties
got 18.9% (New Democracy) and 13.2% (Socialists). The Syriza would
still need to find a coalition partner. But the odds are that there would
enough votes elsewhere from the other anti-balout parties to let them
form a government. Source
ECB
move on Greek banks hits euro confidence
Greek
radical left leader rejects coalition talks
>Will Fed Help Market?
Bernanke
Hedges Bets: Fed Ready For QE3 But Only If Economy Falters
Kiwi
moves upward as Fed minutes renew prospects of QE3
Several Federal Reserve policy makers said a loss of momentum in growth or increased risks
to their economic outlook could warrant additional action — implying a
“QE3,” or a third round of quantitative easing, may be in the offing. The
members of the rate-setting Federal Open Market Committee “indicated that additional
monetary policy accommodation could be necessary,” according to minutes of the
panel’s April 24-25 meeting released yesterday in Washington, DC.
>Will There Be Another Political Stand-off
like in 2011 on Raising Debt Limit.
Obama,
Republicans clash over US debt limit increase
Republicans
Pledge New Standoff on Debt Limit
===================================================================================
OLDER STOCKS
===================================================================================
5/15/2012 TIGERSOFT HOTLINE
Key Values - Peerless-DJIA -
DJI 12632 -63 la/ma = .97 21dmaROC= -.264 P= -135 P-Ch =-64 IP21= -.027 V= -162 OP= - .239
The DJI has now fallen 9 of the last 10 days.
Key Stocks: AAPL and 4 highest priced DJI stocks: IBM CAT, - CVX - MCD and XOM
--->
166 MAXCP
stocks Bullish MAXCP Stocks Bullish plurality
--->
164 MINCP stocks
Bearish
MINCP Stocks
MAXCP stocks are those showing Tiger Closing Power making new
highs.
This suggests heavy Professional Buying. Applying the Tiger Power Ranker's
"bullish" to the MAXCP stocks find those with heavy insider buying and
institutional accumulation. Bearish
MINCP stocks show the opposite.
Coupling Closing Power new lows with heavy red Distribution and
red Candle-sticks' predominating easily finds reliably weak stocks to short
when Peerless gives a Sell, with the exception of year-end when
selling pressures end suddenly when tax-loss selling does.
---> 17 new
highs on NASDAQ. 81 new lows on NASDAQ
Bearish plurality
---> 18
new
highs NYSE 112 new lows on NYSE Bearish plurality
Peerless Buy B2 Is Giving Way to A Judged Sell S10.
DJI, QQQ and IWM Show Slight Breakdowns
below Major Support.
If there is no Fed-QE3 and a strong opening tomorrow, I think we have to Sell
and work with a
Judged S10 on a close below 12600. My advise last night
was to sell
general market long positions if the DJI closed below 12640.
Today it did.
A more decisive
violation would be a Judged Sell S10. Judging an S10 is a
necessary
precaution because the computer program cannot always
correctly detect
the true neckline support that we can more easily see.
It is bearish
that the SPY has broken its rising neckline support. The NYSE
and
Value Line have completed very bearish looking head/shoulders,
as have the Tiger
Index of Military Stocks and Auto
Stocks in the last few days..
No automatic Sell
S10 signal has appeared so far, even though the DJI has
slightly broken
below its well-tested neckline support. The automatic Sell S10
requires the
internal strength indicators, (the NYSE A/D Line, P-Indicator
and the
Accumulation Index) to make new lows that correspond to the price low.
Cancel the Buy B2?
I want to revise the Buy B2 to not allow it to reappear so soon after
following an
earlier one. That would mean we are still waiting for a reliable bottom.
But having
covered the shorts today, I would not take new short positions on the
overall market.
It's not looking
good for the Buy B2s. But there is hope. As I said last night, the Buy B2
is very often a
day, two or three early. This is true 75% of the time when the Buy B2 occurs on
a day when the
decliners outnummber advancers on the NYSE. Strictly speaking, one
could still give
the Buy B2 a little more chance. I mentioned working with a 5%
stop loss and a
stop at DJI - 12640, too. If you are still long general market ETFs, consider any
close below 12600
to be a judged Sell S10 and Sell. We could get whipsawed.
So, if
you sell, use any
close back above 12700 to go long again.
There is some
chance that the FED will act quickly here, as it did in 2010 when the
DJI plunged 15%
after only a very quick head/shoulders pattern. Google QE3
and watch for
breaking news. "The Fed's policymaking Federal Open
Market Committee
bases its
monetary stance primarily on domestic considerations, but officials say a negative,
external shock
large enough to impinge on U.S. growth, jobs and inflation could sway the
FOMC to provide
additional stimulus."
Investors
still hope for QE3 as Europe keeps mkts on edge
Fed
Officials:Euro Threat To Econ Could Tip Balance Towrd QE3
Why This Buy B2 Should Probably Be Dropped
Technically, this
Buy B2 is flawed. I mentioned last night I did not like that this Buy B2
follows less than
a month after an earlier Buy B2. The danger is clear here. The first Buy B2
correctly shows
weakness where a rally can still follow even if a head and shoulders top is in
the making.
The second Buy B2, however, if it follows too closely the first, can come just as
the right
shoulder has been
completed. That is what has happened here. This creates maximum risk
if the neckline
is violated.
.
So,
even if this Buy signal works out, I think it it will be best to change Peerless to not
allow
a second Buy B2 for, at
least 6-weeks after an earlier one. This means I think the Buy B2
should probably be
withdrawn and we should wait for more evidence of a bottom.
What to do?
I would add some new shorts from among the bearish MINCP stocks
and sell bullish
MAXCP stocks if they break their Closing Power uptrend-lines.
If
you are nervous, as I am, close out any long general market position if the DJI
opens down. It
is the European sellers overnight that are having the most impact
on the market.
If they let up, a recovery becomes possible.
The top patterns make the
market look quite dangerous. Read up on Sell S10s in the
past. A closing by the
DJI below a well-tested (4x or more) support-line going through
the hypothetical lows of the
last 40 days is what the Peerless software tries to look for.
The Risks Are Clear Enough....The Reasons to be Bullsh Seem Much Smaller
I linked a
review of the number of scarier aspects of the current market environment.
Here are the highlights.
1. Bear markets are getting deeper and longer.
This is not the 1990s anymore.
The 2001-2003 bear market lasted 24 months and the DJI in the 2007-2009 bear
market fell 51%, the most since the 89% bear market of 1929-1932.
2.
The DJI rose twice as much in the 25 years from 1982 to 2007 as it did in the
25 years from 1905 to 1929. It may be unsustainably high.|
3.
Wall Street has had a 37 month long bull market, as of May 2012.
That often
is about as long as a bull market can last.
4.
Austerity in a Recession brought on the 1930's
Depression. That is what the
Republicans' choice of economic policies is now and Obama does not argue
forcefully against Austerity. The Europeons are now mired in high unemployment
and tense, increasilngly dangerous times for its stock markets.
5.
. Low interest rates can only help the stock market so long.
If banks do not
make loans to consumers, the low interest rates mostly help speculators
in stocks. At some point, corporations cannot keep buying their own stock,
buying out other companies or laying off their workers to boost earnngs per share.
Ultimately, they must create jobs in the US to sustain demand for what these
companies produce. In a long and deep economic slump, dividends will be
cut or dropped altogether. Then even the safest stocks go down.
6 . The danger is not inflation. It is another deflationary spiral. Prices fall for stocks
and commodities. There are no hqvens, but there are lots of margin calls.
Right now State and local governments are laying off lots more workers than
the private sector is hiring. Budget Deficits do not shrink as public workers
are laid off. Only the tax base does.
7. 2008 showed that the stock market can go far
below the lower band in a Presidential
Election year. Actually, so does 1920 and 1932 when Unemployment was very high.
8. The French have elected a Socialist as President. When a Socialist was earlier
elected President of France, Mitterand in May 1981, a 14 month bear market
started a month later.
Considering the way the
market bearishly lost its early gains and closed down near its
lows, I would think the odds
favor the DJI, QQQ and IWM breaking their necklines
conclusively. But the
lower band may hold just as it did in on past Buy B2s.
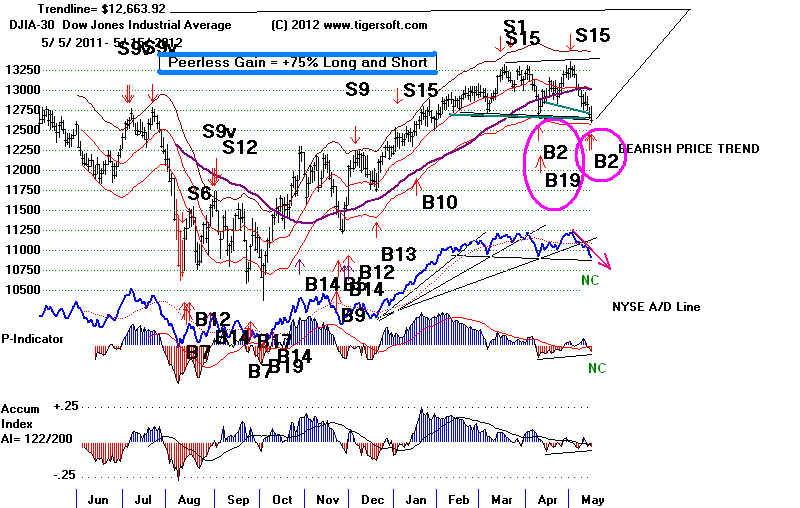
SP-500 Neckline Support Broken.

QQQ Neckline Support "Holding by a Thread"
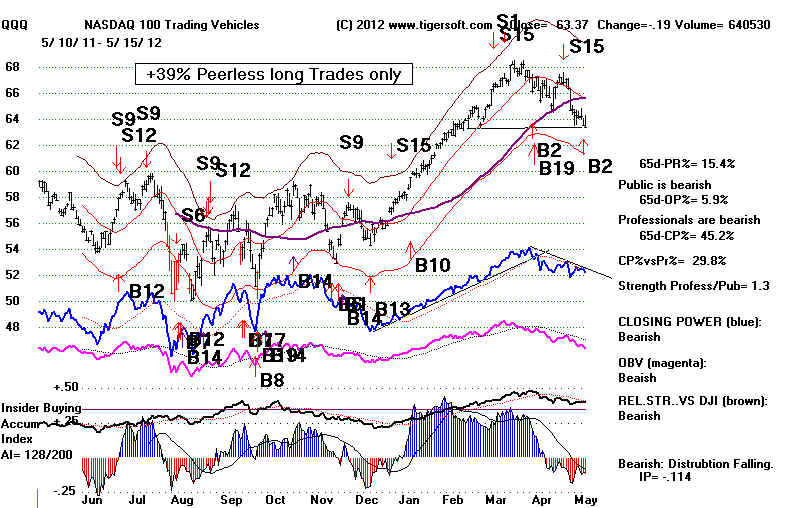
IWM Neckline Support "Holding by a Thread"
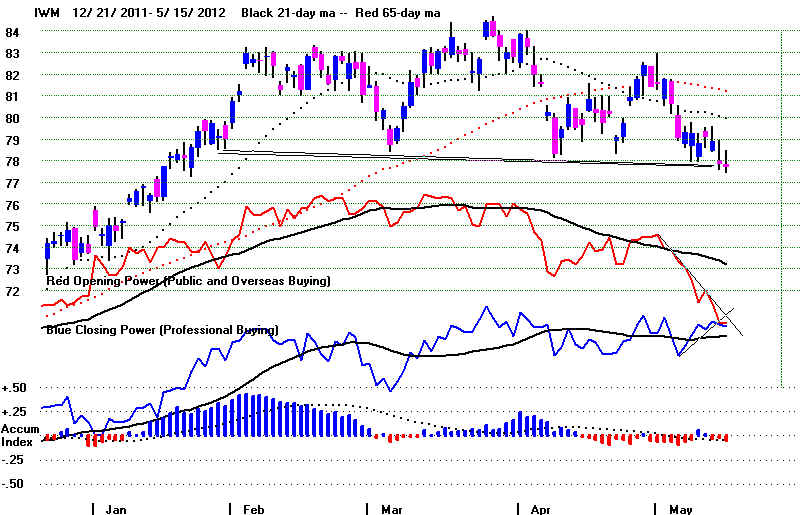
=====================================================================================
OLDER HOTLINES
=====================================================================================
5/14/2012 TIGERSOFT
HOTLINE
Key Values - Peerless-DJIA -
DJI 12695 -125 la/ma = .974 21dmaROC= -.141 P= -72 P-Ch =-25 IP21= -.016 V= -137 OP= - .15
New Peerless Buy B2
Obama's Message To Big Wall Street Campaign
Contributors: "Don't Worry"
This
is a very different message than they are getting in Europe. The
US is setting
out
to be be the new haven for Flight and Hot Money. Presidential Politics is working its
magic
once again to prevent a big drop in the US stock market in 2012. Let's
see
if 2012 DJI chart takes on the appearance more and more of 1972. The
difficulties
the US markets face this year are not going to go away quickly.
Trading with
Peerless remains highly advisable, rather than long-term holding. .
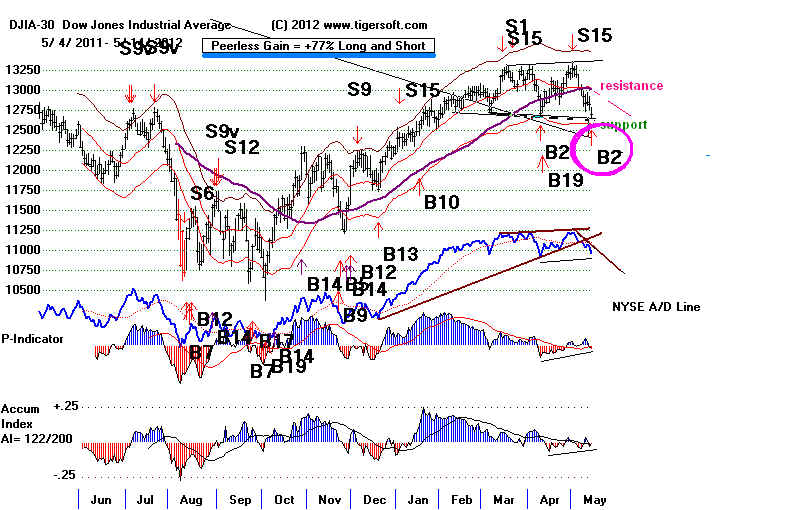
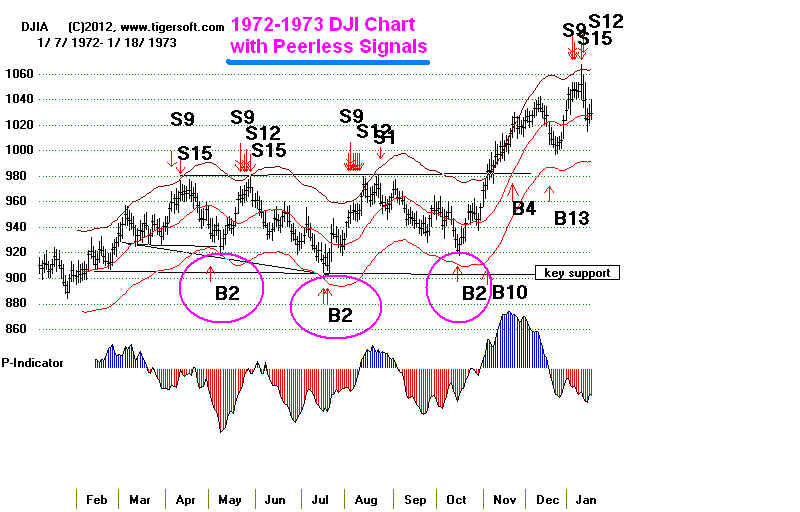
SP-500 Has Broken Its Neckline
Peerless Signals Super-Imposed
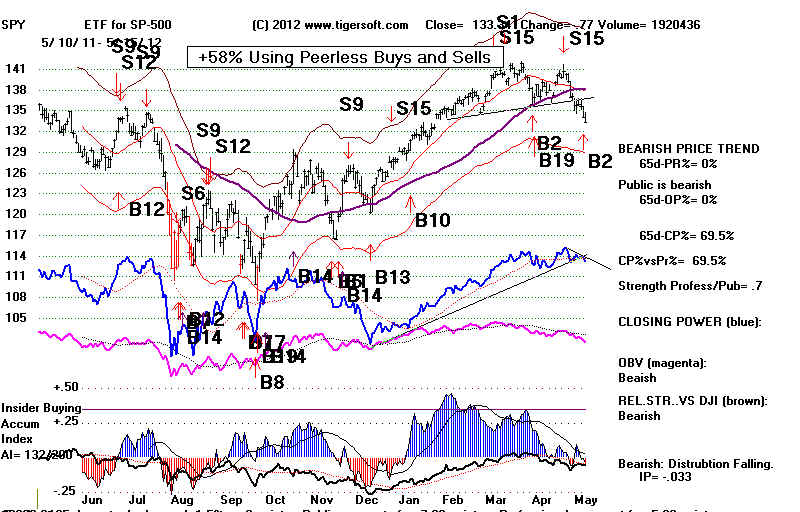
Peerless New Buy B2
The sell-off today could not break the support at 12650.
That is, in itself, bullish enough to cause short-term traders
to buy now. The Buy B2 today is a reliable signal, if you don't
mind riding out paper losses that in 4 of 16 past reversing B2
cases were beyween 5% and 9%. This is high, so I would
suggest using a 5% stop loss here on newly taken long index ETF
positions, or alternatively, sell such
long ETFs if the DJI looks like
it will close below 12640. We can
always come back in on the long
side in this case, if the 12700 level is gotten quickly back above.
In 13 of the 16 reversing Buy B2 cases, the day of the signal saw
more down than up on the NYSE, like today. In 9 of these 13 cases
the DJI fell, at least, another day before turning up. So, if the DJI opens
lower I would think waiting an additonal day to Buy would be
reasonable. Presumably, it woud give a chance for the DJI to
test support at 12650 again.
If the DJI opens higher Tuesday, the Buy B2 may appear to be
like the B2 of a month ago. In that case, the overseas Selling pressure
dried up and the NYSE buyers who have been pushing up the
Tiger CLosing Power will probably continue to buy. The best
way to know that the selling pressure from Europe is ending
long enough to give us a good rally back towards the upper band
would be if the DIA Opening Power would break its downtrend.
There are no cases of 2 separate Buy B2s occurring so close together.
This makes me nervous because it would seem to make buying
on weakness at essential the same price level very easy, But if
am right that Wall Street Professionals are supporting the market
now, then it's best to cover most of the shorts. I say the Professionals
are buying because the Tiger CLosing Powers are still rising for the
DIA, SPY, QQQ and IWM. In
addition, there are many more individual
stocks making CLosing Power new highs than CP new lows. Check
some of these out as Buys for the recovery the Buy B2 tells us to
expect.
The DJI made a 40 day low, but it was unconfirmed by all the
key Peerless Indicators: the P-Indicator, the A/D Line and the
Accumulation Index. This makes the Buy B2 more reliable.
It shows steady professional accumulation on weakness.
The Dollar was very strong today while the Euro was weak,
despite the drop in 10-year interest rates. The FED is
not being
pressured by inflation. Grains, Oil and precious metals were
especially weak. All this helps make US stocks seems relatively
attractive and gives the FED more latitude to bolster the sagging market
as needed.
And it's true, the US Indexes have held up better than most Foreign
ETFs, except those of Thailand, Singapore, Indonesia and Germany.
See the performance rankings of 2012 here:
http://tigersoft.com/Tiger-Blogs/5-14-2012/index.html
Obama Signals Wall Street He WIll Not
Exploit
the anti-Wall Street Sentiment (if Wall
Street Professionals
will hold up the stock market until after the Election.)
I noticed that President Obama made a point of saying publiclly
that JP Morgan was one of the most respected and better managed
big banks. "Jamie Dimon, the head of it, is one of the smartest bankers".
While he declared that rules on derivatives' "reforms" are needed, he still
got the endorsements and a lot of money ($7.8 million,
so far) from
Wall Street investment bankers and hedge fund managers this weekend. It is
reported
that he told them that he would "not make Wall Street look
bad during his election campaign."
(The JPM-Chase $2 billion trading loss will hang over the
big bank stocks for some time. I would not go long them.)
NY Times: Red
Flags on Bets Said to Go Unheeded by Chase Bosses
Sunday, 60 people from Wall Street paid $35,000 each to hear Obama say:
“The financial system, although
still healing, is obviously in much better
shape than it was in 2007 and 2008. We’ve made some progress. But the
reason I’m running is we still have a long way to go,... I believe the free
market is the greatest wealth generator devised by man.. Risk takers and
innovators should be rewarded because we all benefit from free-enterprise."
(Obama made no mention of 'moral hazard', wherein on Wall Street
performance is rewarded but much of the ultimate risk is born by the tax-payer.)
The unspoken "back-room Deal" between Obama and Wall Street is that if
Wall Street Professionals will hold up the market in 2012, Obama
will not make them a big campaign issue. My belief remains that Obama
missed a vital opportunity to bring about much needed reforms of
investment banking after the Financial Crash. He decided instead not
prosecute aggressively, not to demand salary cuts of their CEOs and
not to break up the "too big to fail" banks. He preferred thereby to
encourage, with Bernanke's help, a big recovery in stock prices.
Obama:
'JPMorgan one of the best managed banks
KEY TigerSoft CHARTS and
INDUSTRY INDEXES
DIA SPY QQQ DJIA-Peerless
TigerDJI TigerSPY TigerQQQ GLD SLV Crude
Oil IWM-Russell-2000
Key Stocks: AAPL and 4 highest priced DJI stocks: IBM CAT, - CVX - MCD and XOM
--->
209 MAXCP
stocks Bullish MAXCP Stocks Bullish plurality
--->
117 MINCP stocks
Bearish
MINCP Stocks
MAXCP stocks are those showing Tiger Closing Power making new
highs.
This suggests heavy Professional Buying. Applying the Tiger Power Ranker's
"bullish" to the MAXCP stocks find those with heavy insider buying and
institutional accumulation. Bearish
MINCP stocks show the opposite.
Coupling Closing Power new lows with heavy red Distribution and
red Candle-sticks' predominating easily finds reliably weak stocks to short
when Peerless gives a Sell, with the exception of year-end when
selling pressures end suddenly when tax-loss selling does.
---> 20
new
highs on NASDAQ. 77 new lows on NASDAQ
Bearish plurality
---> 8
new
highs NYSE 73 new lows on NYSE Bearish plurality
=====================================================================================
OLDER HOTLINES
=====================================================================================
5/11/2012 TIGERSOFT
HOTLINE
Peerless Sell S15 Still Operative
Austerity, the dominant "Economic Wisdom" of our times is breaking down.
Fear and
Uncertainty are naturally the first to fill the void. Another 40% Sell-Off
and a Depression
can probably be avoided. But economic ignorance and
a total lack of
leadership will make it very close race. At this hour the Futures
are down 94,
below 12700, where the DJI's key neckline crosses.
Key Values - Peerless-DJIA -
DJI 12855 -34 la/ma = .985 21dmaROC== .045 P= +76 P-Ch=-51 IP21= .013 V= -96 OP= - .066
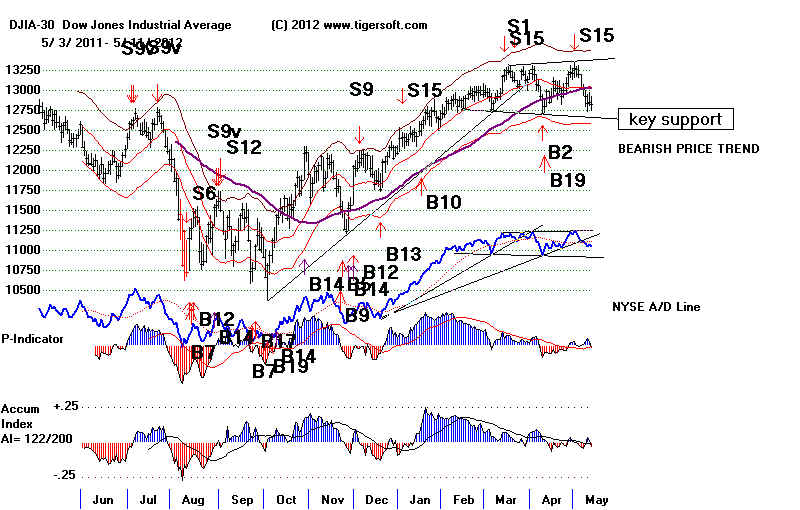
KEY TigerSoft CHARTS and
INDUSTRY INDEXES
DIA SPY QQQ DJIA-Peerless
TigerDJI TigerSPY TigerQQQ GLD SLV Crude
Oil IWM-Russell-2000
Key Stocks: AAPL and 4 highest priced DJI stocks: IBM CAT, - CVX - MCD and XOM
--->
244 MAXCP
stocks Bullish MAXCP Stocks Bullish plurality
--->
98 MINCP stocks
Bearish
MINCP Stocks
MAXCP stocks are those showing Tiger Closing Power making new
highs.
This suggests heavy Professional Buying. Applying the Tiger Power Ranker's
"bullish" to the MAXCP stocks find those with heavy insider buying and
institutional accumulation. Bearish
MINCP stocks show the opposite.
Coupling Closing Power new lows with heavy red Distribution and
red Candle-sticks' predominating easily finds reliably weak stocks to short
when Peerless gives a Sell, with the exception of year-end when
selling pressures end suddenly when tax-loss selling does.
---> 18
new
highs on NASDAQ. 46 new lows on NASDAQ
Bearish plurality
--->
30 new
highs NYSE 35 new lows on NYSE Bearish plurality
The Head and Shoulders
patterns are bearish warnings but the H/S patterns for the
DJI, SPY, IWM and NASDAQ have
not yet been completed on a closing basis.
Their necklines will have to
be closed decisively below. A decline only to 12700
will likely bring a Buy
B2. But a deeper decline will probably bring a Sell S10,
which would cancel any Buy
B2. Do not be surprised if Monday brings a very big
sell-off. The news this
weekend from Europe was very bad for the status quo.
And technically, many folks
will sell when they see the 12700 has been violated.
Stay preponderately short.
Peerless Sell S15 Sell S15s normally bring only a decline to the lower
band.
but a break in the DJI's
neckline at 2670 would set up a minimum downside target
near 12100.
Europe vs Wall Street Professsionals
Europe is bearish and
worried. That is the reason the openings have been so
weak recently and why the
Tiger Opening Power Line on DIA and SPY have turned
down. 300,000-500,000
protestors filled the streets of Madrid and Barcelona
to protest continued
government "Austerity" despite the 23.7% official unemployment.
levels. Prime Minister
Mariano Rajoy bravely says his policies are "necessary".
Massive Spanish protest against austerity and 24% Unemployment
My prediction is that
discontent and rage will surely grow. An uprising and a revolution seem
more and more probable, if
the police and the army waver and the PM continues his course
and Spain's economiy
continues to slide downhill. Meanwhile, there is no popular
basis for a Greek government,
except one that ditches its national debt and abandons
the Euro. Today,
Germany's largest Stadt, North
Rhine-Westphalia voted out the
Christian
Democrats, Angela Merkel's party. The winning SPD described the vote
as a referendum on the German
Chancellor's European policies, which demand local
Auserity in return for
central European bank loans. Last week the French voted
a Socialist in and Austerity
out. As I mentioned last week, the last time a Socialist
was elected in France a bear
market foloowed in the US for 14 months.
Austerity under Attack
Where has Austerity ever
worked in the middle of a recession? Some say
US President Warren Harding
pulled it off in 1921. But Europe needed to rebuild.
Banks loaned money for this
purpose. And new radios and cars were about to
create whole new
industries.
1921
and All That - NYTimes.com Free
Banking » An Austere Recovery
This 1921 case can be argued,
but a Depression was
actually predicted by the
economist Keynes, when
Churchill (as Chancellor of the Exchequer) chose austerity
and went back on the Gold
Standard in 1925. Most economists now agree that trying to
balance the US government's
budget in the weak economic environments of 1930-1931
and again in 1937 were
utterly disastrous.
That
Giant Sucking Sound Is a Hoover
http://neweconomicperspectives.org/2012/05/new-york-times-reporters-need-to-read-krugmans-columns.html
Does The American Political System Work
Well Enough
To Bring about Needed Changes?
We are in trouble. The
stock market reflects this. Sugar coating this will not help
you as investors.
Wthout new economic
leadership for Europe and the US, one that escapes the mind-set
of balancing the budget at
all costs in the middle of a recession, a stock market CRASH |
could certainly occur
again. We definitely should
remain mostly short until Peerless
gives us a Buy signal.
Obama's silence on the
economic subject of Austerity is deafening. Small wonder
he will not release his
college transcripts. in state after state, city after city,
we see public employees being
laid off in the US. School teachers, fire fighters, health and
social services' workers.
It does not matter. The Austerity chopping block does not care.
Jobs' report after jobs'
report, we see that Private Employment is not picking up
the slack.
Naturally, most consumers are holding back, either by choice or by necessity.
Low interest rates can only
encourage a stock market rally so long. If the rising prices
do not bring real investments
that bring work to Main Street, there cannot be enough
aggragate Consumption to prop
even the stock market up. Big companies can only
buy their own shares so long
and lay off or send overseas just so many employees.
Eventually their earnings per
share suffer and so does the value of their stocks. If they
pay dividends, their stocks
may hold up longer. But bad economic times can end,or cause
cuts in, dividends, too.
Only the national government
in the form of a second New Deal seems to offer an alternative
to the worsening dismal
spiral of Deflation. But President does not know what to say
and he is no FDR.
Meanwhile, the Republican House proudly proclaims Hoover as
their model of economic
leadership. The Senate is only good at one thing, bottle-necking
change by their silly 60%
vote requirement. And, if by a miracle, economic leadership were
somehow shown, the Supreme
Court would probably declare it unconstitutional.
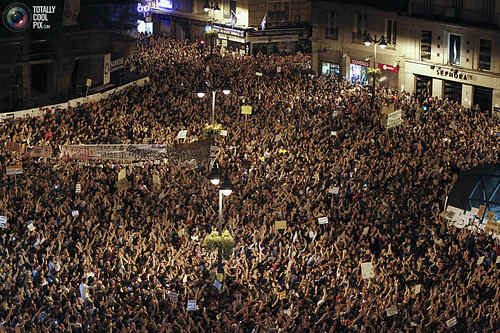
Massive Spanish protest against austerity and 24% Unemployment
http://www.google.com/search?q=spanish%20protests&oe=utf-8&rls=org.mozilla:en-US:official&client=firefox-a&um=1&ie=UTF-8&hl=en&tbm=isch&source=og&sa=N&tab=wi&ei=JTywT5GTGamciAKQz-yKBA&biw=758&bih=446&sei=JzywT57UOMiRiAKo9O2sBA
Americans are a world away, by in large from Europe. Many are unaffected by and most
are
unaware of the amount of
popular anger at central banks in Greece and Spain.
The big US banks are the
exception. They feel the dangers. They own large amounts
of the European "Sovereign
Debt". And, to boot, JPM's $2 billion trading loss will make
the case stronger for more
financial regulation, reinstatement of Glass Steagall
and
reduced leverage for trading purposes.
A "breakup of banks too big to fail" is not
something Congress will
willingly vote for. But the Big US Banks have lots to be worried
about and their stocks show
it.
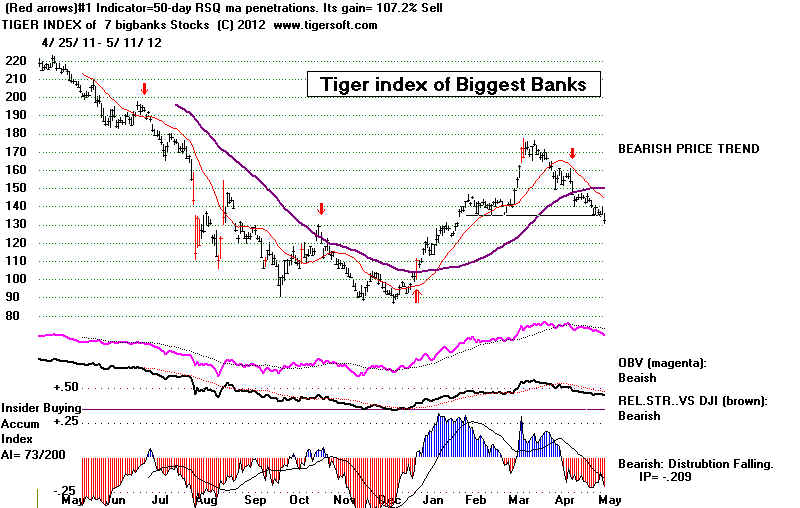
Wall Street Pros are buying this dip, mostly high priced
stocks, dividend paying REITs
plus the one third of the
SP-500 stocks still above their 65-day ma. The Pros have been
buying DIA and SPY, if not
QQQ. We see this in the Tiger Buy "B7s" that now are
appearing again in the DIA
and SPY charts. These signals advise us that Closing Power is
much stronger than Opening
Power and Prices. This, we think, shows Professional
buying, as opposed to public
or European buying, which mostly occurs over-night
or at the opening.
Will Professionals be proven correct in buying SPY and DIA still? Without a
Peerless Buy signal, I have
to say "probably not."
DIA Buy B7s produced immediate declines
in 7 of 9 cases.
Good rallies followed in 6 cases.
Bear market continued or occurred in 4
of 9 cases.
DIA
10/10/01 92.55 recovery
continued after 9/11
6/30/02 86.52 DJI fell to
73.12 as bear market continued with more B7s as it fell.
3/27/03 82.03 DIA fell to
69.82 and then started bull market.
9/30/2004 100.87 DIA fell to
97.76 and then began surge to new highs.
3/28/2008 123.97 DIA rallied to
130.73 on 6/2 and then collapsed.
9/17/2008 116.61 Market collapsed
two weeks later.
8/1610 103.28 DJI fell to 99.93 and then market rallied.
7/29/2011 121.13 but market
collapsed.
9/19/11 113.72 DIA fell
to 107.07 and then
rallied strongly.
? 5.9.12 128.34 DIA is trying to
hold up despite weak openings.
SPY
10/2/91 105.58 recovery continued
after 9/11
9/23/2002 83.66 Fell to 78.10 and then rallied.
3/27/03 87.15 SPY fell only
to 86.71 and then started bull market.
3/26/2008 133.28 SPY rallied
to 143.05 on 5/19 and then collapsed.
9/16/2008 110.66 Market collapsed
two weeks later.
5/24/10 107.71 Easly
bottom in bottom formation.
8/16/10 108.26 DIA fell only from 108.26 to 106.86 a week later and then rallied strongly.
7/11/2011 131.97 Market
collapsed two weeks later.
7/29/2011 129.33 Market
iimmediately collapsed.
9/19/2011 120.31 SPY fell to 112.34 on 10/4/2011 and then rallied.
? 5.9.12 135.74 SPY is trying to
hold up despite weak openings.
QQQ
10/25/01 38.91 recovery
continued after 9/11
8/22/02 26.16 declined to
20.20 on 10/8 before rallying.
3/28/03 26.08 QQQ rallied as new
bull market started.
9/13/2011 54.28 QQQ fell to 52.19 on 10/4/2011 and then rallied.
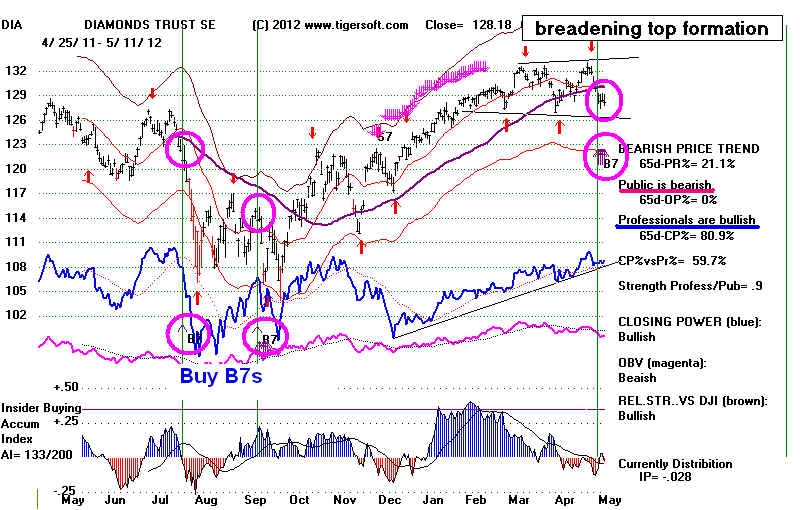 |
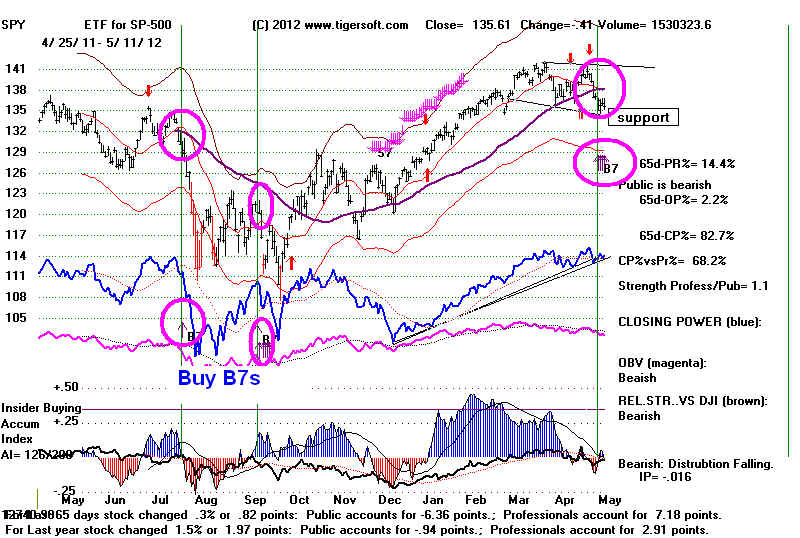 |
The history of Buy B7s for the DIA, SPY and QQQ does not show that these
B7s are very good at
giving exact buy points. Usually they are premature for at least
a week. These are
show in BLACK. Sometimes, they are "dead-wrong". These are
shown in Red.
Real Professionals are not stubborn. They tend to quickly change their
mind if they see that
they are on the wrong side of a trade. A decline below 12650
might be the turning
point and get them to turn bearish. If they did switch to the sell
side we would then see
lower openings and still lower closes, the worst of all worlds.
=====================================================================================
OLDER HOTLINES
=====================================================================================
5/10/2012 TIGERSOFT
HOTLINE
Peerless Sell
S15 Still Operative
Wall Street
can be expected to try to shore up the stock market until gargantuan ($96
billion)
Facebook's
public stock offering is profitably concluded, probably next Friday. Rumor
has it
that it is
the Public that has over-subscribed it. Insitutions are much more "concerned
about the
company’s growth prospects.,
Key Values -
Peerless-DJIA -
DJI 12855 -20 la/ma = .985 21dmaROC== .045 P= +76 P-Ch=-51 IP21= -.013 V= -96 OP= - .063
KEY TigerSoft CHARTS and
INDUSTRY INDEXES
DIA SPY QQQ DJIA-Peerless
TigerDJI TigerSPY TigerQQQ GLD SLV Crude
Oil IWM-Russell-2000
Key Stocks: AAPL and 4 highest priced DJI stocks: IBM CAT, - CVX - MCD and XOM
--->
202 MAXCP
stocks Bullish MAXCP Stocks Bullish plurality
--->
92 MINCP stocks
Bearish
MINCP Stocks
MAXCP stocks are those showing Tiger Closing Power making new
highs.
This suggests heavy Professional Buying. Applying the Tiger Power Ranker's
"bullish" to the MAXCP stocks find those with heavy insider buying and
institutional accumulation. Bearish
MINCP stocks show the opposite.
Coupling Closing Power new lows with heavy red Distribution and
red Candle-sticks' predominating easily finds reliably weak stocks to short
when Peerless gives a Sell, with the exception of year-end when
selling pressures end suddenly when tax-loss selling does.
---> 24
new
highs on NASDAQ. 39 new lows on NASDAQ Bearish plurality
--->
34 new
highs NYSE 16 new lows on NYSE Bullish plurality
The Head and Shoulders Patterns Are Bearish Warnings>
A DJI drop and close at 12700 will likely bring a Buy B2.
A Deeper Drop will probably cause a Sell S10 and this will cancel any Buy B2.
Peerless Sell S15 Sell S15s normally bring only a decline to the lower
band.
but a break in the DJI's
neckline at 2670 would set up a minimum downside target
near 12100. A
reliable chart rule says "take the height of the top pattern and subtract
that from the point of
breakdown to get the minimum downside objective. Head and
shoulders patterns sometimes
produce much deeper declines. These patterns are
the market's way of digesting
sudden or soon-to-break unexpectedly bearish news.
The DJI does not show a head
and shoulders, but the broader indexes, the NYSE,
SP-500, Value Line, NASDAQ
and Russell-2000 surely do.
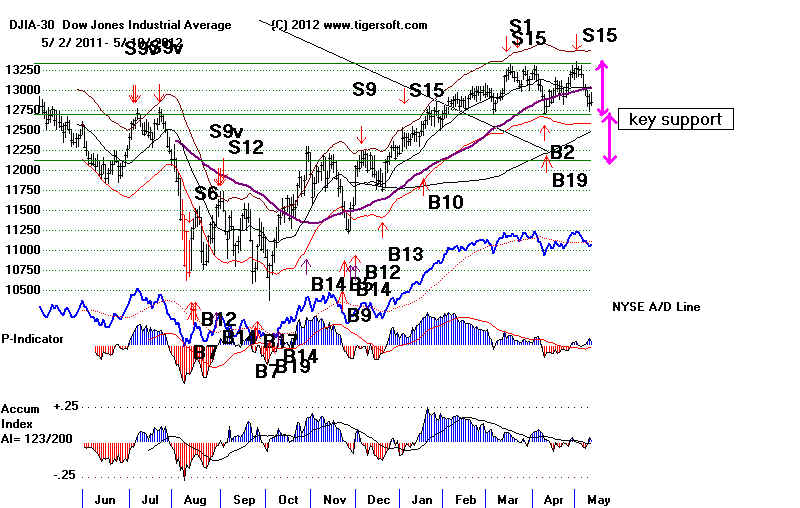
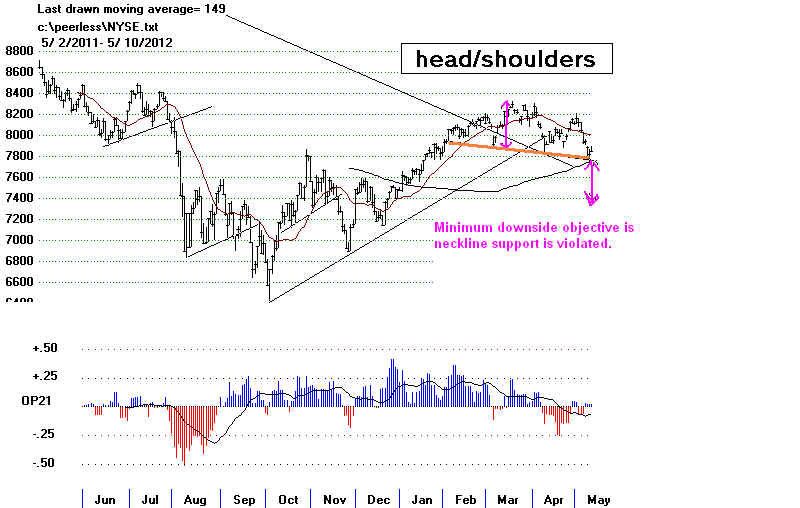
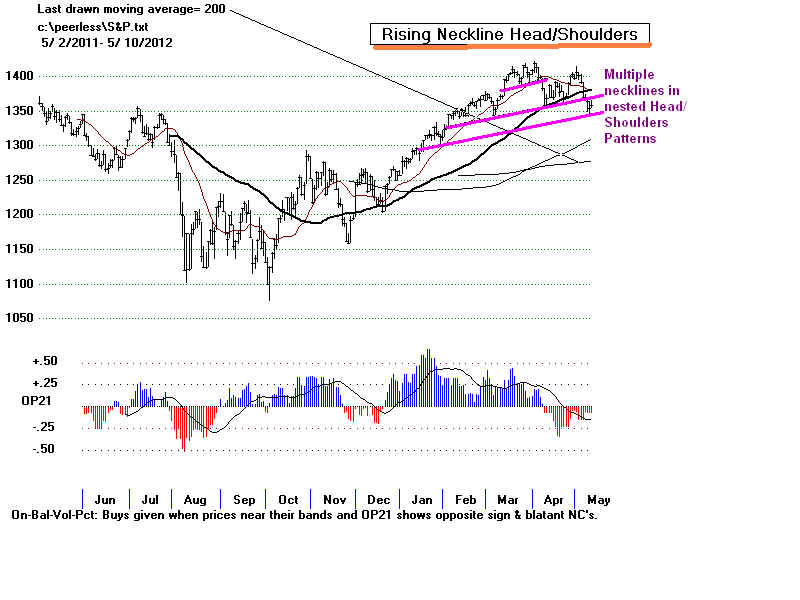
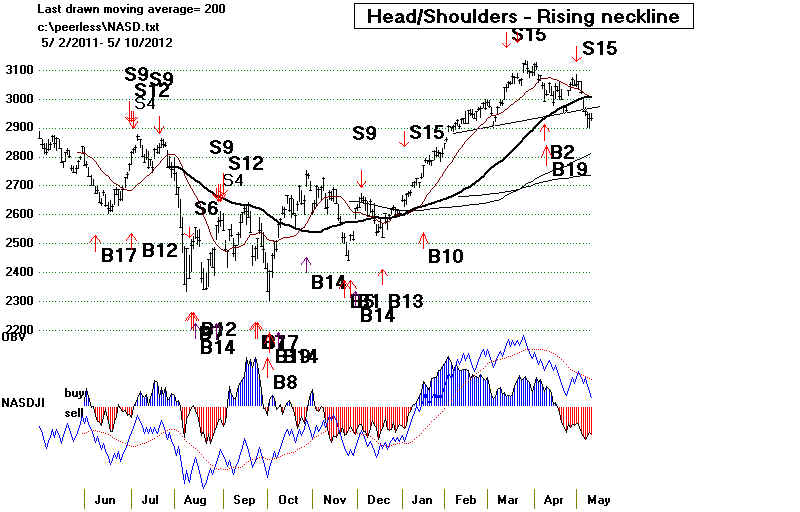
THE DANGERS OF DOUBLING DOWN
WHEN A DECLINE STARTS SNOW-BALLING


In Las Vegas, the most dangerous money management system one can employ is
doubling down when one
loses, thinking that Red, for example, cannot possibly repeat a
7th, 8th, 9th or 10th
time. But every pit boss will tell you it can, does and will again
and again.
Professional stock traders when they get desperate are sorely tempted
to double down.
After all, it's often not their money and one big win will wipe the slate
clean. It
was the unexpectedly deep decline in 2008, with no rebounds, that took
everything down, Gold
included, that wiped out whole hedge funds and caused massive
margin calls.
This is what we have to worry about now. Downtrends can last longer
that most of us can
remain solvent if we yield to the tempation of doubling down on
every 50% decline or
20% decline, fully margined.
Example where margin calls are not an issue.
Start with a $50,000 position in XYZ stock @ $100.
It drops to $50, the double-downer will then buy another $50,000 of the stock.
At $25, he must buy $100,000 more if he wants again to double-down, totaling $200,000
At $12.5. he must buy $200,000 more.
At $6.25, he must buy $400,000 more
At $3.125 he must buy $800,000 more.
If a man bought the first position using 50% margin, he will get a maintenance margin call
when the stock drops to just $80. His equity will have fallen below 40%. To
double down
on margin, his position will have to be doubled approximately on each 20% loss.
@100 $50,000
@80 $100,000
@64 $200,000
@
51 $400,000
@40 $800,000
@32 $1,600,000 .
The recent greater
weakness in the NASDAQ reflects big money's move to safer blue chip
stocks that pay
dividends. But safer stocks will eventually drop if investors are forced to
sell out everything or
anticipate others will have to sell out everything because of margin
calls.
Today's announcement
from JP
Morgan of a $2 billion trading "blunder"
can only serve to
reinforce fears that
the big banks are dangerously leveraging customers' funds. "Market making"
and "hedging"
may sound respectably conservative, but "Where were the safeguards against
abuse with depositors'
money?", regulators will demand to know.
One wonders how many
additional severe losses will occur if the markets breakdown from
here below their
necklines. The only "real stress test" is when everyone is selling and
prices are plunging.
It is in declining markets that most of the swindlers are exposed.
That makes doubling
down highly dangerous in a falling market.
.
The rising Closing
Powers suggest that Professionals in the US do not expect this.
But they may be
overtaken by events overseas. I doubt if the US markets have fully
factored in the domino
effect for Spain and Italy if Greece defaults. How much would
the big NY banks lose
if these countries defaulted on their bonds? It has to be worrisome
that they are not
saying. Roubini:
EU To Break Up Once Contagion Hits Italy And Spain
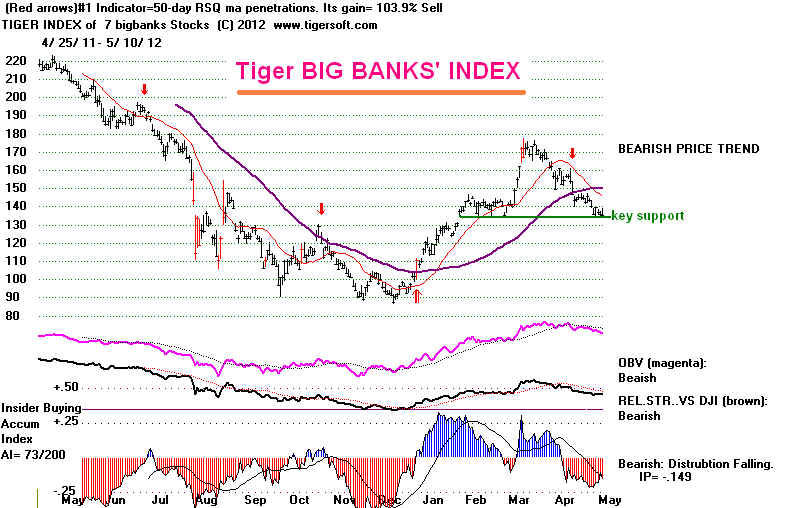
Foreign swindlers, like
Ivar Krueger, the Swedish Match King of
the 1920s and 1930s
can do grave harm to
the US. When the scope of their deceptions are revealed, the ensuing
financial panic is made
much worse and can become a world depression when financial
credibility and
confidence all but totally disappear.
=====================================================================================
OLDER HOTLINES
=====================================================================================
5/9/2012 TIGERSOFT HOTLINE
Key Values -
Peerless-DJIA -
DJI 12835 -97 la/ma = .984 21dmaROC== .109 P= +179 P-Ch= +29 IP21= -.037 V= -30 OP= - .093
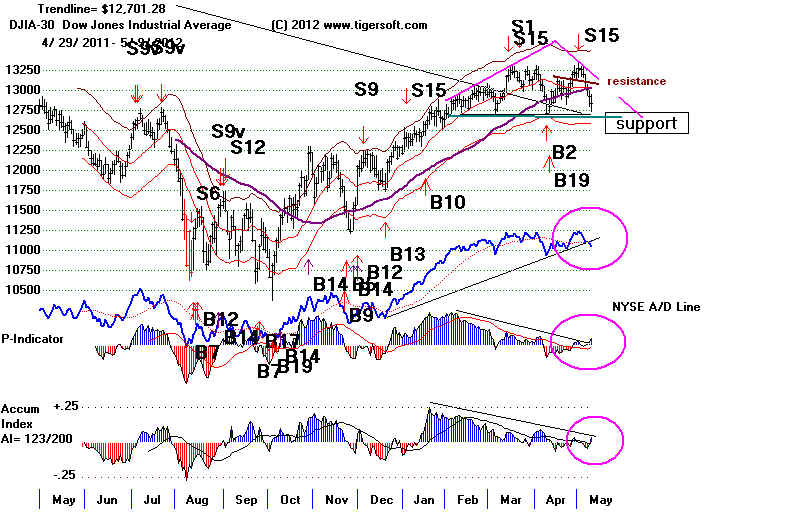
KEY TigerSoft CHARTS and
INDUSTRY INDEXES
DIA SPY QQQ DJIA-Peerless
TigerDJI TigerSPY TigerQQQ GLD SLV Crude
Oil IWM-Russell-2000
Key Stocks: AAPL and 4 highest priced DJI stocks: IBM CAT, - CVX - MCD and XOM
--->
270 (+77) MAXCP
stocks Bullish MAXCP Stocks Bullish plurality
--->
97 MINCP stocks
Bearish
MINCP Stocks
MAXCP stocks are those showing Tiger Closing Power making new
highs.
This suggests heavy Professional Buying. Applying the Tiger Power Ranker's
"bullish" to the MAXCP stocks find those with heavy insider buying and
institutional accumulation. Bearish
MINCP stocks show the opposite.
Coupling Closing Power new lows with heavy red Distribution and
red Candle-sticks' predominating easily finds reliably weak stocks to short
when Peerless gives a Sell, with the exception of year-end when
selling pressures end suddenly when tax-loss selling does.
---> 45
new
highs on NASDAQ. 64 new lows on NASDAQ Bearish plurality
--->
31 new
highs NYSE 54 new lows on NYSE Bearish plurality
The Head and Shoulders Patterns Are Bearish Warnings
Peerless Sell S15 Sell S15s normally bring only a decline to the lower
band.
A DJI close tomorrow below
12714 (down 121) but above 12650 will probably bring
a Buy B2. A close below
12650 is likely to bring a Sell S10 and possibly also a
Buy B2. These two
signals would then cancel each other out and we would remain on
a Sell.
The Peerless key values have
been improving, so a short-term rally is possible from
12750. The very weak
Openings have been over-powering the positive
Closings. If tomorrow
or Friday open ups, we could get a brief rebound.
That is not apt to change the
Peerless Sell or erase the bearish head and shoulders
patterns.
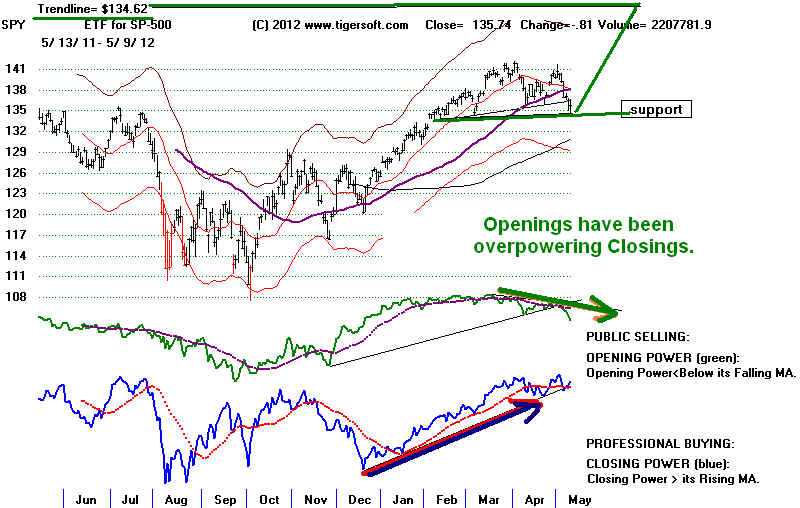
Without a new Peerless
Buy, stocks cannot be expected to advance much, So,
I would stay mostly
short. The head/shoulders
patterns in the Russell-2000 (IWM),
Value Line and NYSE are
dangerous because these are very bread indexes. Such
patterns take a long
time to develop. They cannot be easily created artificially.
If these patterns are
completed with a close clearly below their necklines, it will mean
trouble for the broader
market. See their charts below.
The DJI blue chips, dividend
stocks and bonds may not be able to prop the
general market up for the
rest of the Presidential Election Year. So, we are approaching
an important
"piviot point".
But usually the DJI is the
"last index standing". The DJI is quite capable of
"putting on
appearances" and concealing market weakness for six months and
sometimes longer. The
NYSE A/D Line peaked in October 1928, eleven months
before the DJI did.
Look at the DJI charts of 1956, 1972-1973 and 1999-2000
just below. See how
weak the NYSE A/D Line was for months, but the DJI made it seem to
casual viewers and voters that all
was still well with the stock market and the economy.
In these years, the DJI held up at
its earlier lows' support, only to breakdown the
year after the Presidential
Election.
A 10%-12% correction after the 37
months' advance we have enjoyed should not
come as much of a surprise.
As I have been saying, that the low interest rates work well
to hold up dividend stocks,
especially bonds and REITs. But prolonged giovernment
austerity in the middle of a
recession will probably bring an economic tailspin. It is
not clear that Obama is even aware
of this danger, so focused is he on being just a
shade to the Left of most
Republicans, for political reasons.
What's The Worse Case Scenario if We Got A Sell S9?
I think we should be reminded to
watch for signs that we are again in May of 1930.
The warning signs: Sell S9,
Head/Shoulders Top, NY A/D Line lagging and trend-break,
heavy red-distribution and most
importantly a steep decline once the DJI's neckline
support gave way. The Crash of 1937 is
also most often also blamed on trying to
balance the federal budget while in
a deep recession. In both cases, a Peerless
Sell S9 was present. I am
happy to report we do not have a recent Sell S9.
MAY 1930
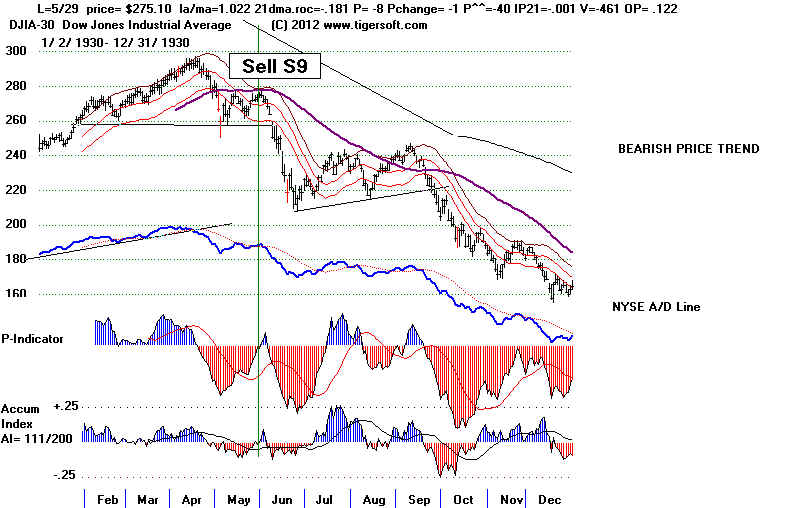
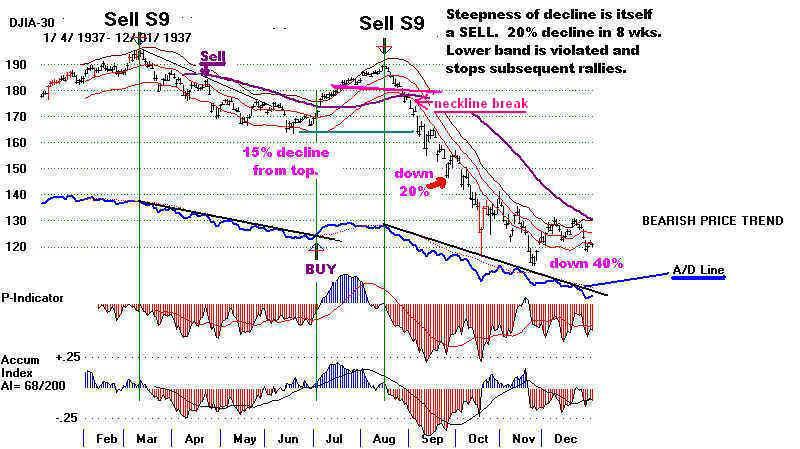

My opinions on the great dangers of
practising Austerity in the middle of a
recession are shared by Nobel Prize
winning Princeton economist Paul Krugman.
May 8, 2012 Austerity
Is So Wrong!
and Nobel
Prize winning Columbia economist Joseph Stiglitz, who wrote Monday:
"Financial leaders, from finance ministers to leaders of private financial
institutions,
reiterated the current
mantra: the crisis countries have to ... bring down their
national debts, undertake
structural reforms, and promote growth. Confidence, it was
repeatedly said, needs to be
restored. It is a little precious to hear such pontifications
from those who, at the helm
of central banks, finance ministries, and private banks,...
created the ongoing mess.
Worse, seldom is it explained
how to square the circle. How can confidence be restored ...
when austerity will almost
surely mean a further decrease in aggregate demand,
sending output and employment
even lower? .
...
The consequences of Europe’s rush to austerity will be
long-lasting and possibly severe.
If the euro survives,
it will come at the price of high unemployment and enormous suffering,
especially in the crisis
countries. And the crisis itself almost surely will spread. The pain that
Europe, especially its poor
and young, is suffering is unnecessary."
..
DJI - 1956
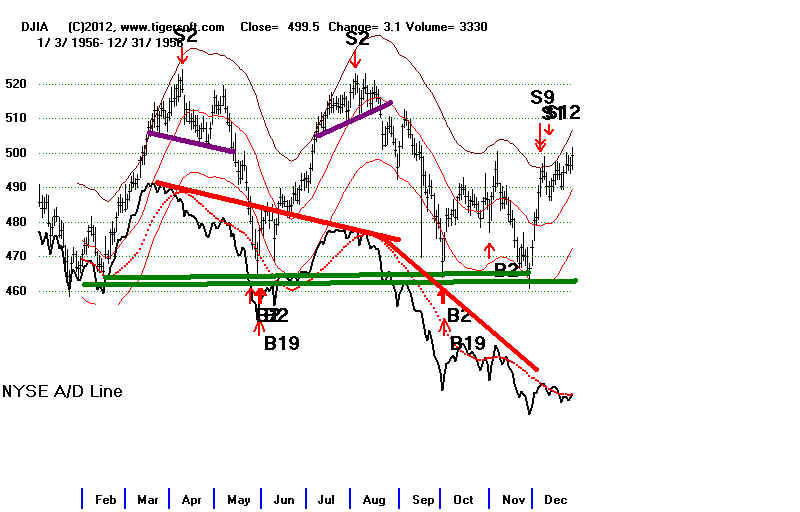 |
DJI - 1972-1973
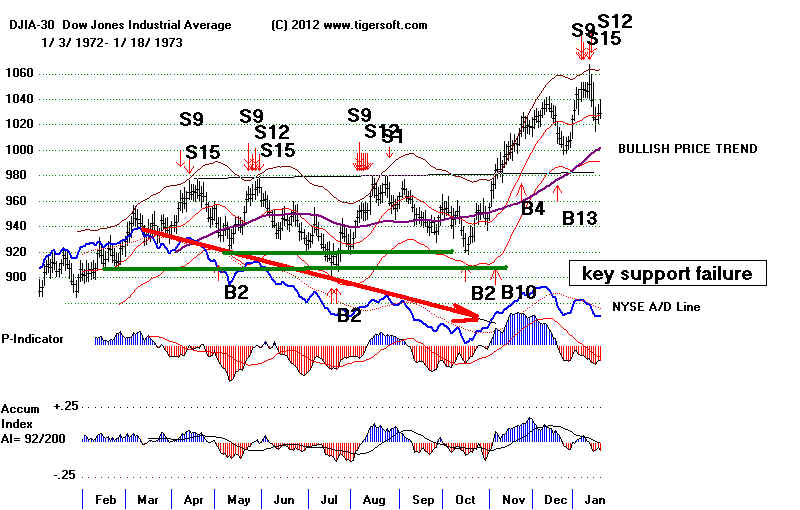 |
DJI - 1999-2000
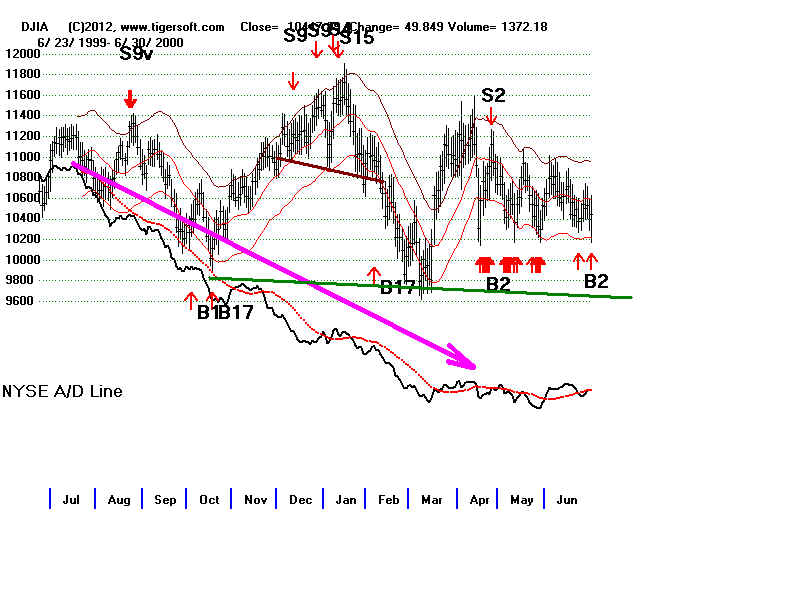 |
BROADER INDEXES AND HEAD/SHOULDERS
Russell-2000
IWM
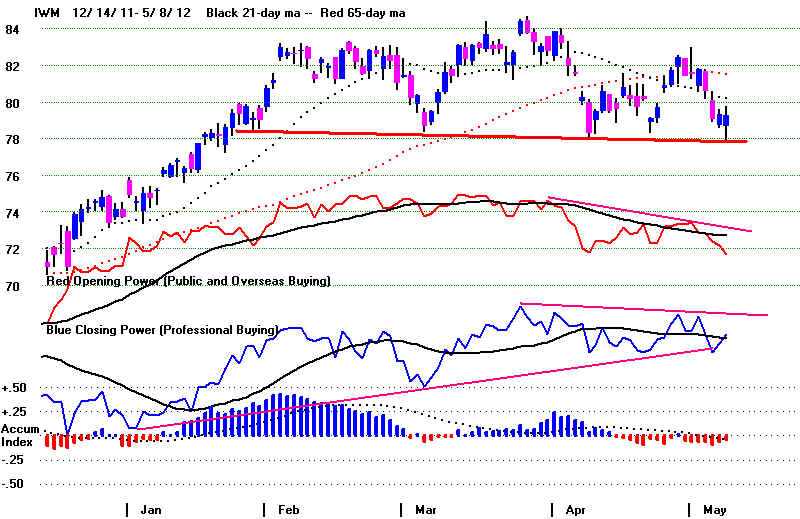 |
Value Line
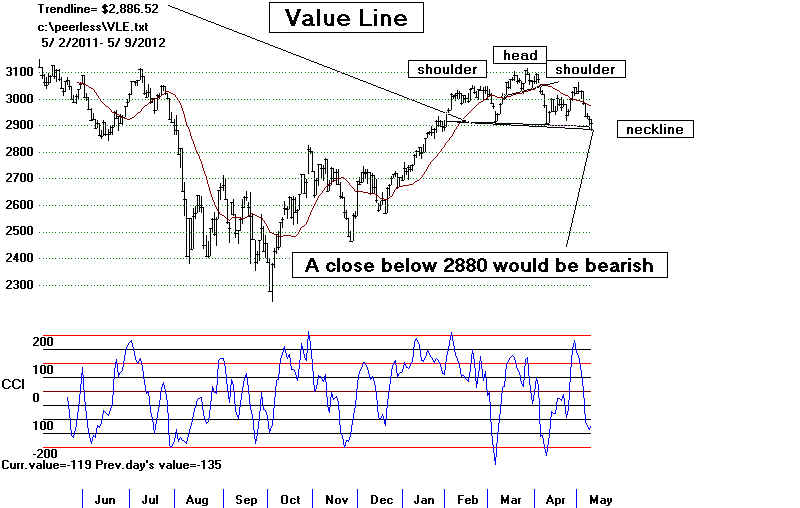 |
NYSE
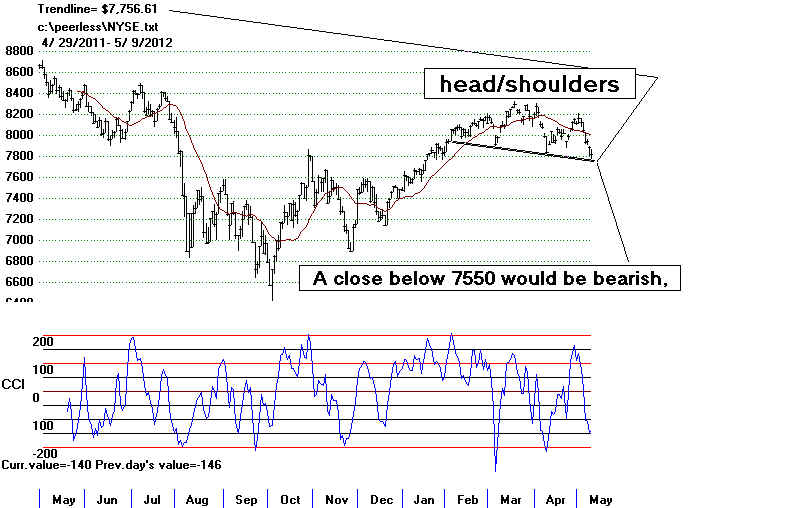 |
=====================================================================================
OLDER HOTLINES
=====================================================================================
5/8/2012 TIGERSOFT HOTLINE
Key Values -
Peerless-DJIA -
DJI 12932 la/ma = .992 21dmaROC== -002 P= +75 P-Ch= +54 IP21= -.012 V= -105 OP= - .067
KEY TigerSoft CHARTS and
INDUSTRY INDEXES
DIA SPY QQQ DJIA-Peerless
TigerDJI TigerSPY TigerQQQ GLD SLV Crude
Oil IWM-Russell-2000
Key Stocks: AAPL and 4 highest priced DJI stocks: IBM CAT, - CVX - MCD and XOM
--->
193 MAXCP
stocks Bullish MAXCP Stocks Bullish plurality
--->
97 MINCP stocks
Bearish
MINCP Stocks
MAXCP stocks are those showing Tiger Closing Power making new
highs.
This suggests heavy Professional Buying. Applying the Tiger Power Ranker's
"bullish" to the MAXCP stocks find those with heavy insider buying and
institutional accumulation. Bearish
MINCP stocks show the opposite.
Coupling Closing Power new lows with heavy red Distribution and
red Candle-sticks' predominating easily finds reliably weak stocks to short
when Peerless gives a Sell, with the exception of year-end when
selling pressures end suddenly when tax-loss selling does.
---> 31
new
highs on NASDAQ. 42 new lows on NASDAQ Bearish plurality
--->
35 new
highs NYSE 48 new lows on NYSE Bearish plurality
Very Weak Openings Are Over-Powering Rallies towards the Close.
Austerity and The Resulting Tensions within The Euro-Zone are Bearish.
US Stocks Will Be Fortunate Not To
Be Brought down by the Tumult to Come:
1) A still more severe Economic Slow Caused by Austerity Measures,
2) Country Defaults on Debts to Big Banks, including Those in the US,
3) Uncertainties about where Public Anger at Incumbents and Banks will lead...
Stay Predominately Short
Peerless
Sell S15 Sell S15s normally bring only a decline to the lower
band.
This is the 3.5% band below the 21-day ma. It is about 12650 now. A 10%
correction
would, however, be in keeping with a bull market that is now 37 months old. Five
Tiger Indexes
of key sectors' stocks show prices at a key neckline in emerging head/shoulders patterns.
Tiger Index of NASDAQ stocks - at neckline and below
65-dma
Tiger Index of SP-500 stocks - at neckline and below
65-dma
Tiger Index of Oil/Gas stocks - at neckline and
below 65-dma
Tiger Index of Finance stocks - just above neckline and
at 65-dma
Tiger
Index of 17 Leading Biotech stocks - at neckline and below 65-dma
If these all were to breakdown, I would think we will see a decline below the lower band.
We will watch them closely here. The charts are also shown in this Hotline at the
bottom
of today's section.
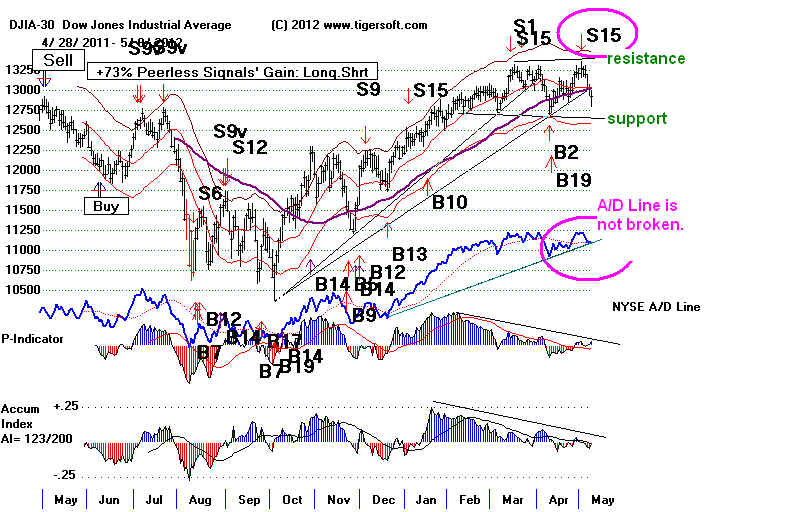
Previous Several nights' Hotlines all still apply. Wait for a Peerless Buy signal.
Most likely the DJI will have to fall to the lower band at 12700 to get a new Buy.
A four to six week decline from the peak is typical at this time of the year.
By more than our 2:1 industry groups show a plurality of their stocks below
the key 65-dma.
Openings have been weak because of selling pressure from Europe. The
post-Opening recoveries have not been strong enough to overcome the
early weakness. This suggests further weakness.
In addition, more and more groups and some individual DJI stocks show completed
head/shoulders patterns. The ones in BLUE have not yet broken down and
so should be watched more closely.
neckline of H/S below 65-dma IP21<0 Closing Power
violation
AA 9.87
yes
-.22 12-month low
CAT 105
yes
-.055 confirming price weakness
CSCO 19
yes
-.117 bullish divergence
CVX 104
yes
-.017 bullish divergence
(GE 19.25 - 19 is neckline ... not completed)
IBM 201
at it
-.143 bullish divergence
(IWM 79.25 - 78 is neckline ... not
completed)
MSFT 31.5
yes
-.21
confirming price weakness
UTX 81
yes
-.116 confirming price weakness
-----------------------------------------------------------------------------------------------------------------
Tiger Index of NASDAQ stocks - at neckline and below 65-dma
Tiger Index of SP-500 stocks - at neckline and below
65-dma
Gold bearishly
below neckline and 65-dma
Silver bearishly below neckline and 65-dma
Tiger Gold Stocks' Index below neckline and 65-dma
Tiger Index of Oil/Gas stocks - at neckline and below
65-dma
Tiger Index of Finance stocks - just above neckline and
at 65-dma
Tiger
Index of 17 Leading Biotech stocks - at neckline and below 65-dma
Tiger
Index of Auto stocks - below neckline and below 65-dma
Tiger Index of Military stocks - at neckline and below
65-dma
Tiger
Index of industrial Materials' Stocks' Index below neckline and 65-dma
Tiger
Index of Chinese Stocks' Index below neckline and 65-dma
Tiger
Index of Pipeline Stocks' Index below neckline and 65-dma
Tiger
Index of Low Priced Stocks' Index below neckline and 65-dma
Tiger Indexes at Key Necklines
of H/S Patterns:
QQQ, SPY, Oil/Gas, Finance and Leading Biotechs
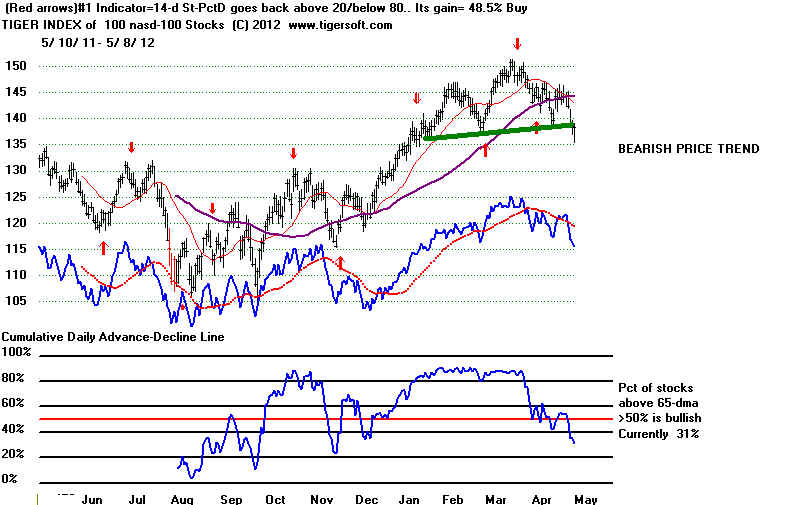
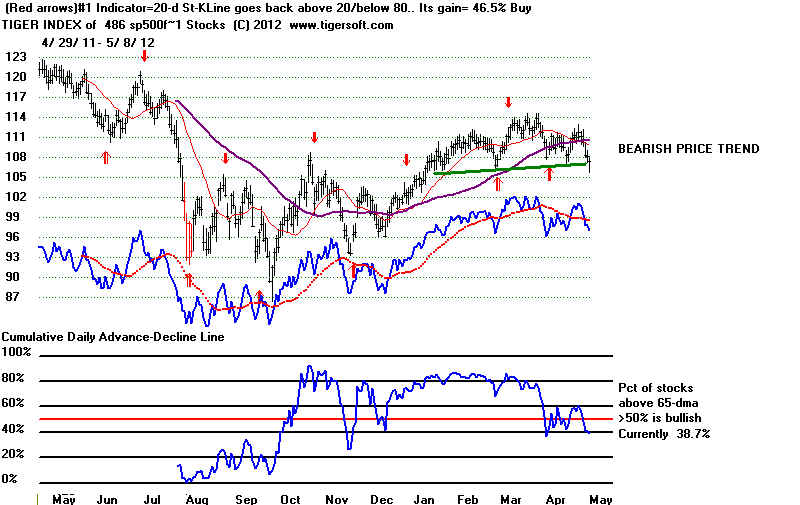
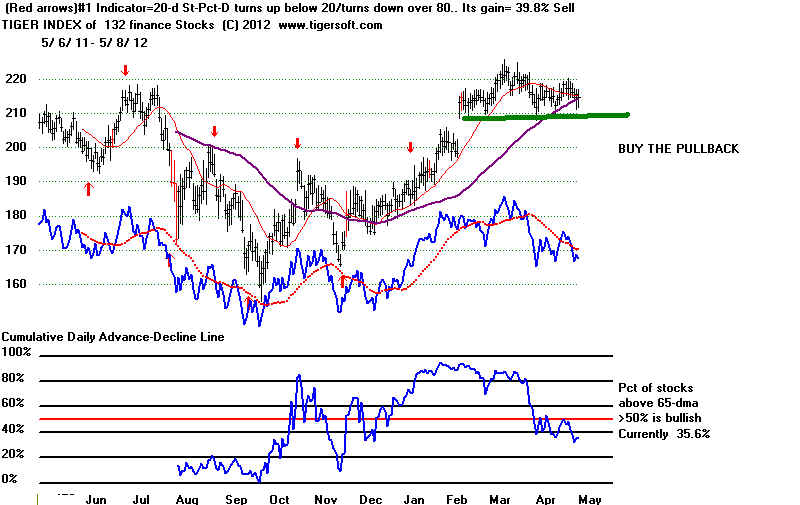
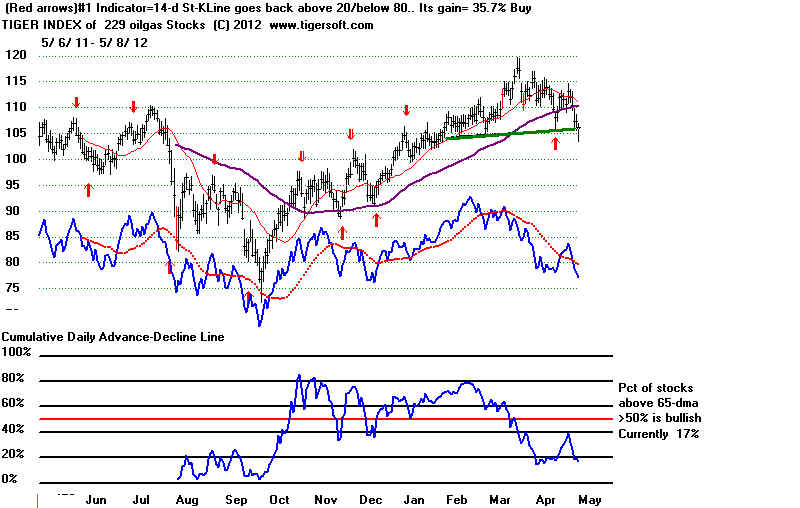
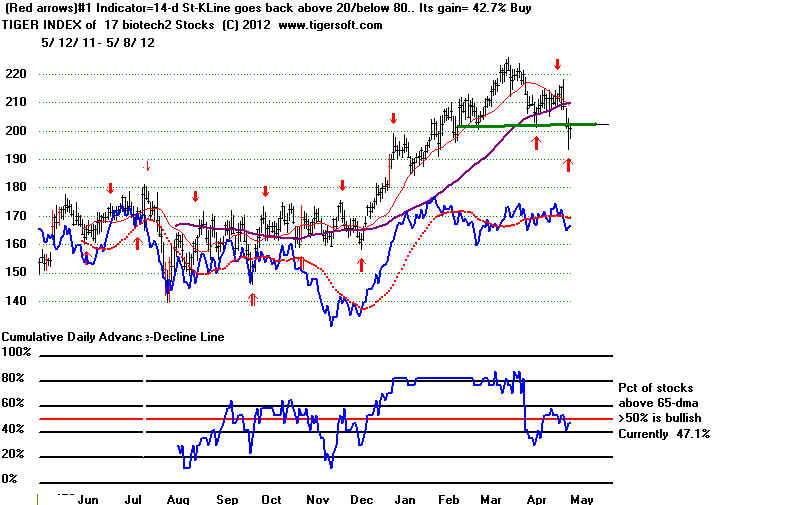
=====================================================================================
OLDER HOTLINES
=====================================================================================
5/7/2012 TIGERSOFT HOTLINE
Key
Values - Peerless-DJIA -
DJI 13009 --30 la/ma = .998 21dmaROC== -047 P= +21 P-Ch= +32 IP21= -.043 V= -112 OP= .059
KEY TigerSoft CHARTS and
INDUSTRY INDEXES
DIA SPY QQQ DJIA-Peerless
TigerDJI TigerSPY TigerQQQ GLD SLV Crude
Oil IWM-Russell-2000
Key Stocks: AAPL and 4 highest priced DJI stocks: IBM CAT, - CVX - MCD and XOM
--->
141 MAXCP
stocks Bullish MAXCP Stocks
---> 140
MINCP stocks
Bearish
MINCP Stocks
MAXCP stocks are those showing Tiger Closing Power making new
highs.
This suggests heavy Professional Buying. Applying the Tiger Power Ranker's
"bullish" to the MAXCP stocks find those with heavy insider buying and
institutional accumulation. Bearish
MINCP stocks show the opposite.
Coupling Closing Power new lows with heavy red Distribution and
red Candle-sticks' predominating easily finds reliably weak stocks to short
when Peerless gives a Sell, with the exception of year-end when
selling pressures end suddenly when tax-loss selling does.
---> 29
new
highs on NASDAQ. 29 new lows on NASDAQ Bearish plurality
--->
29 new
highs NYSE 21 new lows on NYSE Bullish plurality
THE DJIA IS OFTEN THE LAST
TO TOPPLE
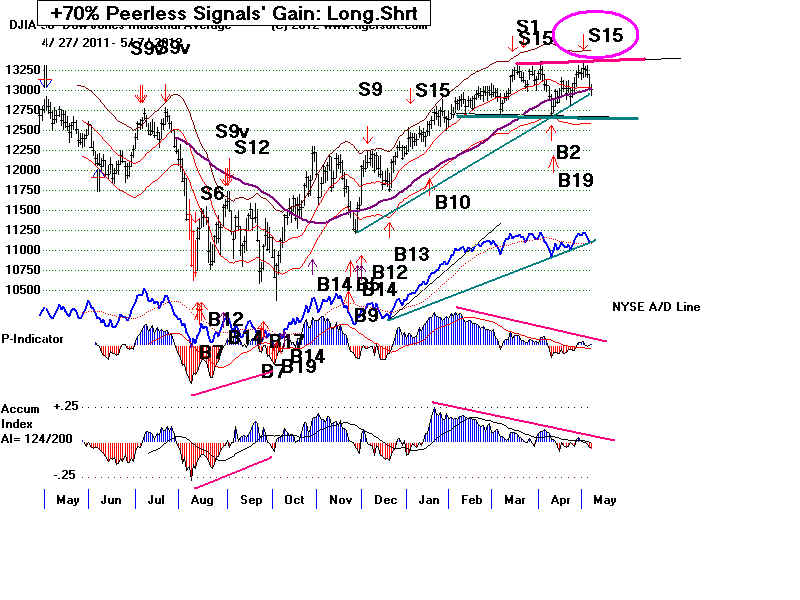
Hotline: Peerless
Sell S15 Sell S15s normally bring only a decline to the lower
band.
This is the 3.5% band below the 21-day ma. It is about 12600 now. This is
about where the
price support for the DJI is. Any move down from here would likely break the still rising
Closing Powers and the NYSE A/D Line and bring such a decline. The markets did turn
around today, but the DJI failed to close positively. There are a number of stocks
we can watch
tomorrow to get an early sense of whether there will be a turnaround this Tuesday.
The
charts of AAPL and Goldman Sachs (GS) below show this.
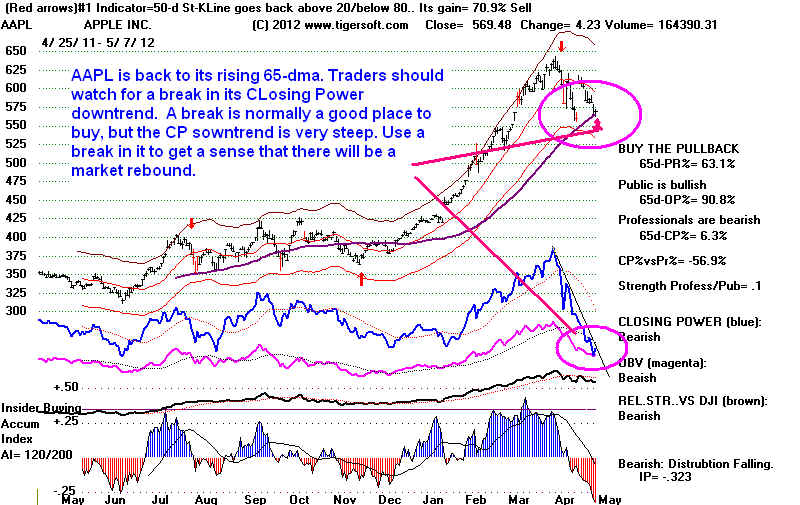
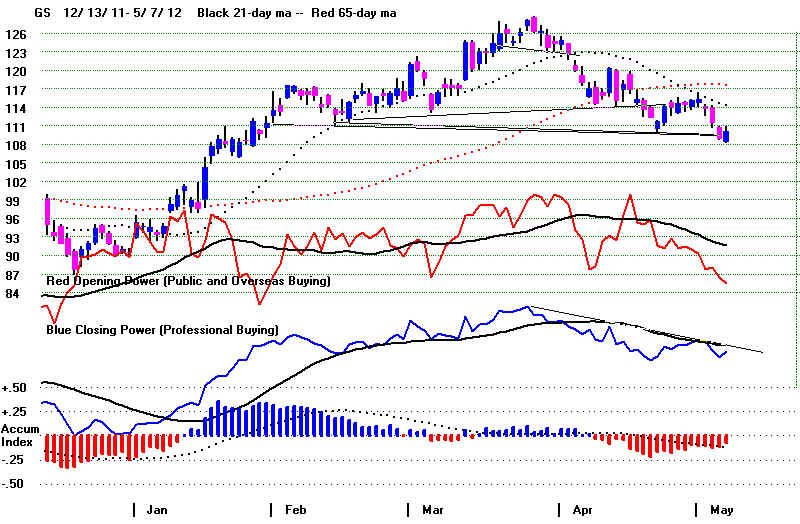
DEFLATION AHEAD?
Will Stocks Be Hit, Too?
From 1994
to 1999, commodity prices fell as stocks rose strongly. Hot money
went into stocks in that Boom. The economy was seen as growing fast
enough to balance
future budgets. Unfortuantely, commodity prices can also fall because
its demand falls
or its supplies increase. It takes a serious world-wide economic
slowdown to
cause the inelastic demand for foods and grains to turn down. I fear
that may
be what is happenng now. That suggests economic troubles ahead.
Once started,
deflationary
spirals are hard to stop. This is also called a "liquidity trap".
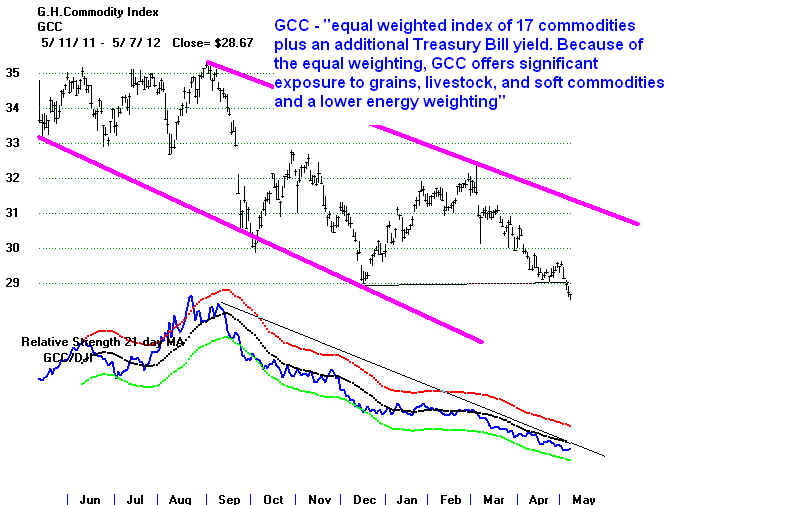
AUSTERITY'S ECONOMIC COST
The Bankers' orthodox cure for economic
ills is always Austerity. It is working,
exactly as designed. It is killing inflation, but by causing higher unemployment
worldwide
and reducing consumer demand. Crude Oil, food prices, precious metals'
stocks
are all weakening. Today, the Dollar jumped as
Europeans see more troubles ahaed
for their single currency region. Bernanke should have no problem keeping interest
rates low in this environment. We know that low interest rates can fuel a stock
market
rally while only a tepid recovery takes place. It is not clear that low interest
rates by
themselves can bring about invesment in Jobs, especially in the US..
WIll the US go into a double-dip recession? Not, if low interest rates can hold up
an
economy. That is what Bernanke is trying to do. But low
interest rates and bank bailouts
worked badly for Japan in the 1990s and the US is more vulnerable to a global
recession The US is less "insular", in a word. It may be more easily
pulled down by
the very real slowdown in Eurupe, though US blue chip stocks will probably
enjoy the arrival of hot money from Europe, as Europe slow down. If you
are interested
in the issue of the limits of monetary policy, see:
http://www.dallasfed.org/news/speeches/fisher/2011/fs110112.cfm
and TigerSoft's
Bog of 2/5/2008 - "The limits of
monetary policy."
Right now, it's mostly dividend and blue chips stocks that are still above their 65-dma.
Less than 40% of the NASDAQ-100 and SP-500 stocks are above their 65-dma. Exactly
half the DJI-30 stocks are still above their 65-dma. If history repeats, I would
expect the
DJI-30 to hold up until after the November election. That does not mean there can
not
be a 10% correction and a decline to 12000 this Summer or pssibly this fall. Last
night
I showed we were due for such a correction if one applied the time-line from the 1982-1987
bull market.
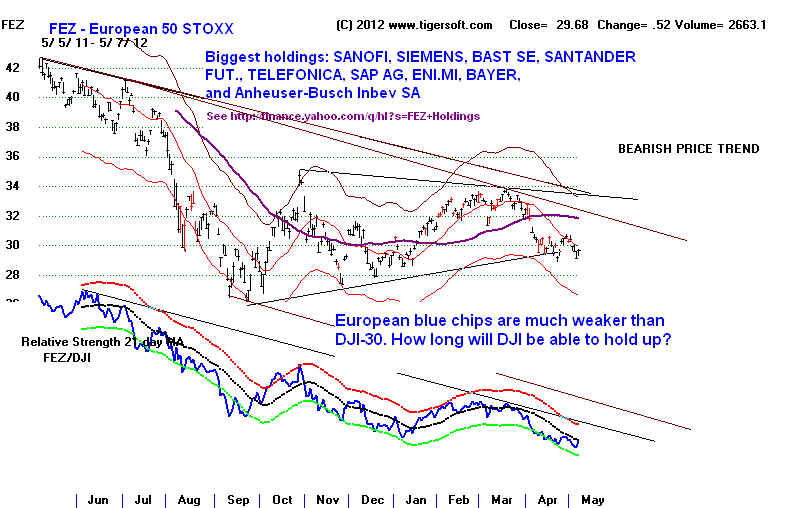
--------------------------------------------------------------------------------------------------------------------------------------------------------
OLDER HOTLINES
--------------------------------------------------------------------------------------------------------------------------------------------------------
5/4/2012 TIGERSOFT HOTLINE
Key
Values - Peerless-DJIA -
DJI 13038 --168 la/ma = 1.00 21dmaROC== -033 P= -11 P-Ch= +15 IP21= -.039 V= -125 OP= .056
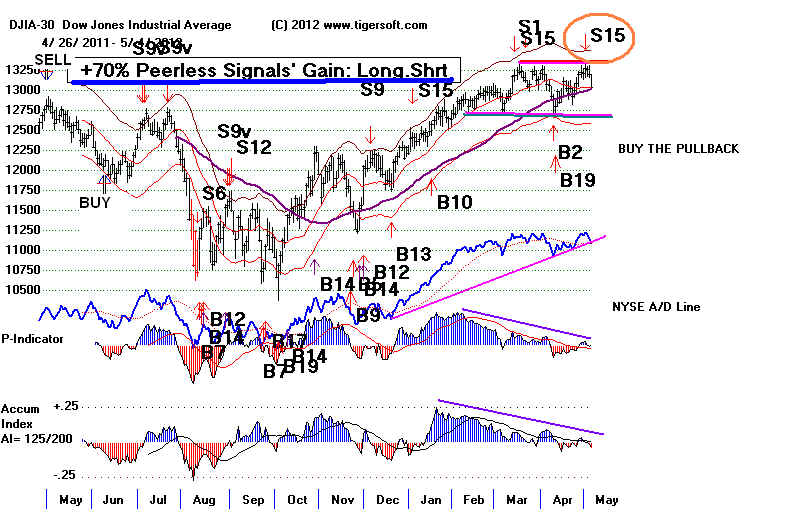
KEY TigerSoft CHARTS and
INDUSTRY INDEXES
DIA SPY QQQ DJIA-Peerless
TigerDJI TigerSPY TigerQQQ GLD SLV Crude
Oil IWM-Russell-2000
Key Stocks: AAPL and 4 highest priced DJI stocks: IBM CAT, - CVX - MCD and XOM
--->
86
MAXCP stocks Bullish MAXCP Stocks
---> 166
MINCP stocks
Bearish
MINCP Stocks Bearish
plurality
MAXCP stocks are those showing
Tiger Closing Power making new highs.
This suggests heavy Professional Buying. Applying the Tiger Power Ranker's
"bullish" to the MAXCP stocks find those with heavy insider buying and
institutional accumulation. Bearish MINCP stocks show the opposite.
---> 19
new
highs on NASDAQ. 57 new lows on NASDAQ Bearish plurality
--->
20 new
highs NYSE 38 new lows on NYSE Bearish plurality
Hotline: Peerless Sell S15. Sell S15s normally bring
only a decline to the lower band.
That would mean a test of 12650-12700 on the DJI. If breadth and volume figures
are not extremely bearish, that could bring a Buy Signal. But Europe is entering a
very uncertain period. A rebound on Tuesday is a possibility, but I think we
have
to wait for a new Peerless Buy. Many thinner stocks that violate their 65-day ma
at this stage in the bull market may well fall at least 20% more before rallying. If
the
DJI support at 12650-12700 should give way, the next support to be tested is 12250.
Expect a lot of selling from Europe overnight.
The Greek people are saying "NO" to their bailout terms. And the last time
a Socialist
Angry Greeks threaten to revive debt
crisis
won the Presidency in France, as
happened this weekend, a year-long bear market was
about to start, although one last 4-week rally did occur first just as after the election.
Things Are Riskier Now.
Expect European bankers to retaliate. One way they may do this is by withdrawing
their "confidence". France could be in for a period of time during which a
lot of wealthy
French money flees the country. Shareholders are likely to be badly hurt if
the banks
and the new Government cannot reach an understanding quickly. This is a story that
has just begun to unfold. When Mitterand was elected in 1981, there was no EURO
and what the new Socialist government did then had very little impact on the rest of
Europe.
Now the Euro may be fighting a two-front war.
FRANCE ETF - EWQ
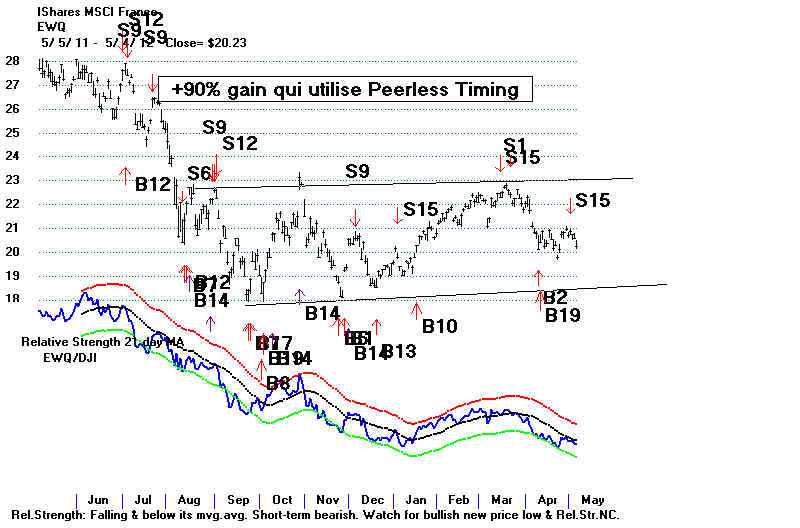
What if a Currency Collapses (Argentina) or the Banks are Nationalized (Iceland)?
Iceland
went bankrupt in late 2008. Its stock market caved in, just as Argenina's did
in 2001. Argentina
recovered three years later. Argentina's unemployment rate is
now
7.9%. At the time of
its currency collapse, its unemployment reached 25%. So, there is
always a better day,
Iceland
is now coming back, too. It's credit rating is rising, too.. Iceland's
unemployment rate
is 7.1%. Its stock market has recovered a good part of what it lost
initially.
Iceland Stock Market until 2010
Iceland Stock Market after 2010
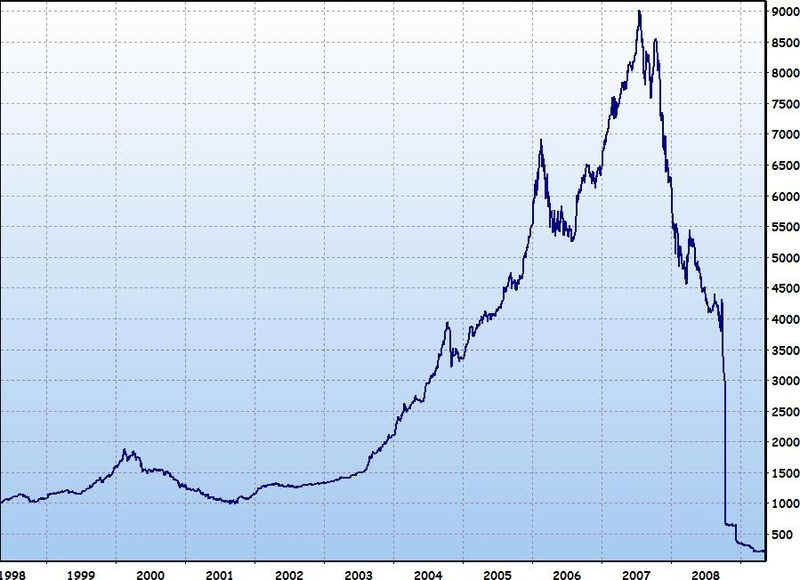
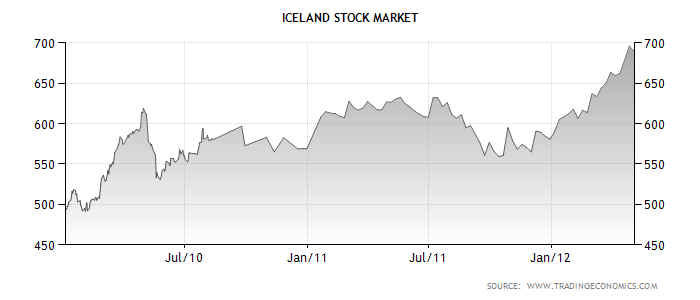
Low Interest Rates in US Are Essential
Bernanke's lower interest rates are essential if the US market is to hold up this year.
The pressure on him from the White House must be unrelenting. Inflationary pressures
for the past year have been subsiding. This makes Bernanke's control of the Fed easier.
What we could use most now is a technogical
breakthrough, like the trains and steam
engines were in the 19th century, cars and radios were in the 1920s, or transistors
were in the 1960s and computers and the internet were in the 1980s and 1990s.
Anyone know of such a breakthrough technology? They are big boosts to a
an economy recovering from a "bust".
TRENDLINE BREAKS AND SUPPORT LEVELS
A break in the uptrend-line of the DJI and DIA tomorrow will almost certainly
bring another test of 12650-12720 on the DJI.
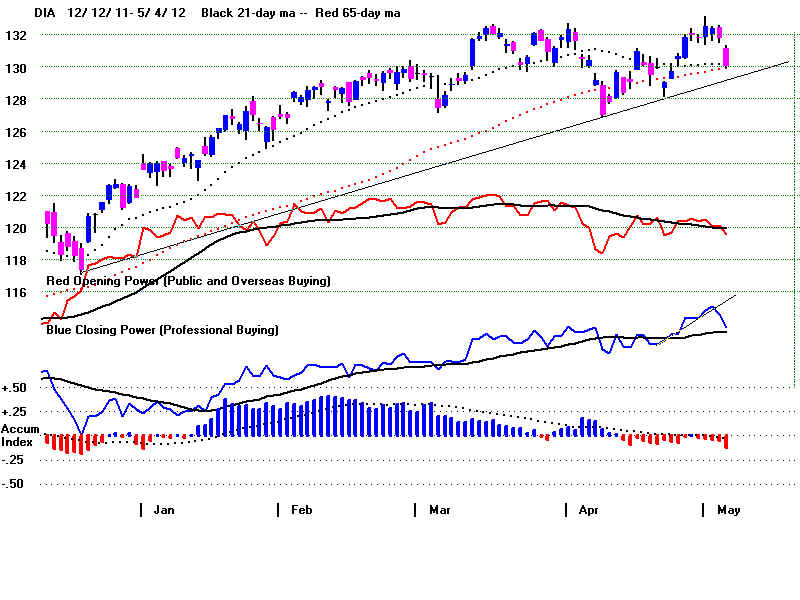
A French Revolution? Not really.
Pundits on CNN are already scaring investors regarding what a moderate socialist
government will mean in France. The early DJI futures are down 100.
My own hope is that it will mean the beginning of an end to the bank-led austerity
policies
that now dominate Europe and are driving up Enemployment and Interest Rates. Such a
change would be a boost for the world economy and American corporations. I wrote my
doctoral dissertation at Columbia about how these Austerity policies in a recession
failed in England in the 1920s and 1930s. So, frankly, it frightens me that folks
still fall
for this folly.
Bank stocks are right now to be nervous, though. France will try to curb their ability to
speculate with depositors' money and then be bailed out when their use of excessive
leverage threatens their very viability and the world economic health.
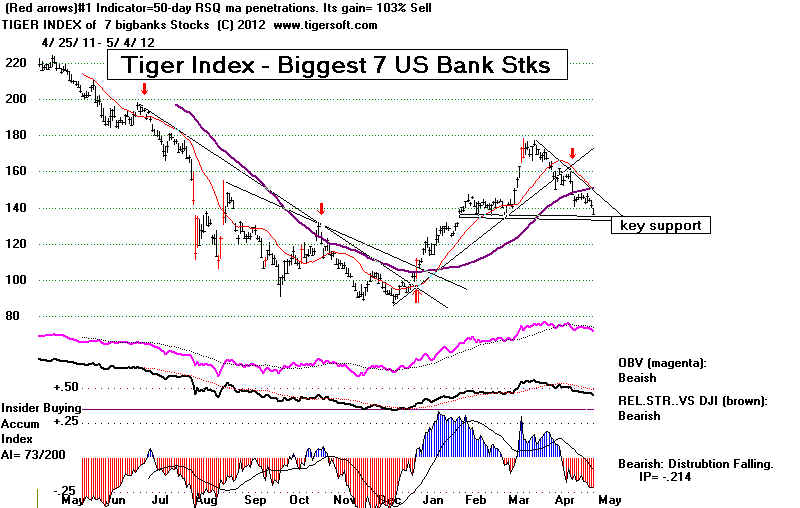
The Lessons of the 1980s
A user at our San Diego meeting this Saturday, Hanry I., asked a great question.
He wondered how the rate of current the US economic recovery, using seasonally
adjusted Unemployment data to measure it, was affecting the stock market recovery
and whether a study of the economic recovery after December 1982, when
Unemployment peaked back then, could teach us something now. Here is essentially
what I wrote him.
Unemployment officially peaked in Dec 1983 at 10.8% and then steadily improved
and reached 5.2% in April 1989. So it took took 5 years and 5 months for Unemployment
to go from peak to trough and almost reach the 5% level that economists consider
"full employment".
Civilian seasonally adjusted unemplyment peaked at 10,0% in 10-1-2009, This was
7 months after the stock market bottomed. (In 1982, unemployment bottomed 4 months
after the early August low on the DJI at 787. ) It is now 8.1% on 4-1-2012 , two years
and 6 months after unemployment's peak. After this much time in the earlier period,
we would be in Juie 1986, a period of 10% ups and downs in the stock market.
We may be starting a broad trading range now, perhaps 13300 and 12100, though
I think we will get a Peerless Buy at the lower band because we are now in a
Presidential Election year.
DJI 1986: Note April-November Trading Range.
We are at the same point in our own economic recovery now
that the market was back in the middle of 1986.
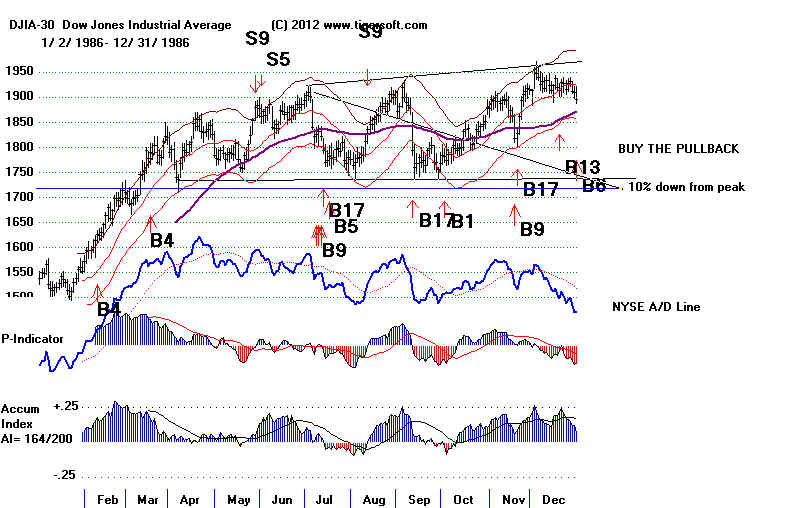
Unemployment in the 1980s had fallen from 10.8% to 6.9%, a 29% decline
while the DJI back then rose 148%, going from 780 to 1900. By comparison now,
the DJI has risen from a low of 6547 to a high of 13200. This is essentially a double.
In our case, the same unemployment numbers have fallen from 10% to 8.1%, only
a 19% drop in the rate from the peak.
Does this mean the stock market is
going up too fast now or just about right, given the
more gradual return to full employment?
The big difference now is probably
the low interest rates of interest. So, we have to watch them closely. The October
1987 DJI 34% Crash occurred soon after the then newly appointed Federal Reserve
chairman, Greenspan, saw gold rising in the Summer of 1987 and started nervously
raising short-term interest rates. It is my view that the October 1987 Crash
was precipitated by Greeenspan's starting to raise the fed Fund's rate, back then
from 6.58% in July 1987 to 7.22% in September 1987. The Crash back then was easily
foreseen by Peerless users and our Hotline.
( See http://www.tigersoft.com/tiger-blogs/8-18-2003/index.htm
)
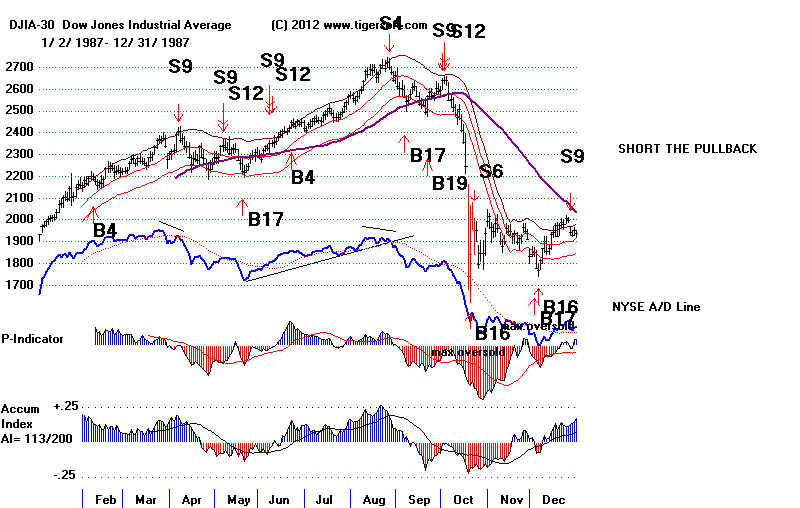
September 1987 was a bad time for Greenspan to act so swiftly. Seasonal weakness for
September and October is always a concern. The stock market was already up a long ways;
so profit-taking was bound to become clumsy and wild. And, thirdly, computerized
index option trading was in its prime. And it was mostly unregulated. My own research
has made me think that a .64% rise in the Fed Funds' rate is associated with market
sell-offs. This is worth studying and then watching when rates are more normal. The
data comes from http://www.harpfinancial.com/InterestRateHistory/FederalFundsRate3.htm
The October 1987 crash occurred 5 years and 2 months after the bottom August 1982
bottom. Adding that length of time to our more recent bottom, March 2009. would
seem to invite a "crash" in May 2014, if exactly the same time-line applied.
So, I think we have to watch interest rates very closely. Bernanke's opponents in
the Fed and outside woukd be boosted if there were new signs of significant inflation.
The yearly trends do not show it, I have stated here. That's why we look at Food prices,
Crude Oil, Gold and Silver. In addition, we have to watch for new budget balancing
initiatives. They are deflationary. In a recession, such policies run the risk of
making a bad economy much worse. This can be seen in 1920, 1930-1932 and 1937
in the US and in Britain in 1924-1926, 1930-1937, Germany 1930-1932 and
Italy and Spain in the last two years. For more information, see the Blogs that
I have written on this:
Will Obama Cause Another 1937
CRASH?
TigerSoft Blog - Keynes
Revisited:
Also: Recession of
1937–1938 - Wikipedia
Post–World
War I recession - Wikipedia
===================================================================================
5/3/2012 Hotline: Peerless Sell
S15 Sell S15s normally
bring only
a decline to the lower band. But the last time a Socialist won the Presidency in
France, back in 1981, a bear market started.
Of course, Bernanke's approach to interest rates is completely different
than Paul Volker's. In June 1981, Volcker raised the federal
funds rate,
which had averaged 11.2% in 1979, to a peak of 20%. He raised the prime rate
to 21.5% in 1981. He wanted a recession and he got one. Unemployment
rose
sharply, jumping from 6.9% in April 1980 to 10.8% in November and December
1982, the highest rates since the Great Depression until 2009.
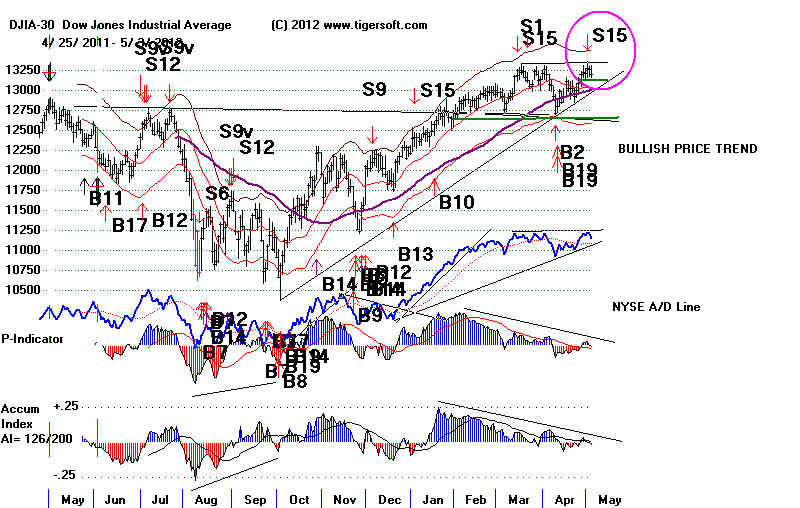
Key Values - Peerless-DJIA -
DJI 13207 -62
la/ma = 1.013 21dmaROC== -006 P= -27 P-Ch= -15 IP21= -.016 V= -125 OP= .057
KEY TigerSoft CHARTS and
INDUSTRY INDEXES
DIA SPY QQQ DJIA-Peerless
TigerDJI TigerSPY TigerQQQ GLD SLV Crude
Oil IWM-Russell-2000
Key Stocks: AAPL and 4 highest priced DJI stocks: IBM CAT, - CVX - MCD and XOM
--->
211 MAXCP
stocks Bullish MAXCP Stocks
Bullish plurality
---> 126
MINCP stocks
Bearish
MINCP Stocks
MAXCP stocks are those showing
Tiger Closing Power making new highs.
This suggests heavy Professional Buying. Applying the Tiger Power Ranker's
"bullish" to the MAXCP stocks find those with heavy insider buying and
institutional accumulation. Bearish MINCP stocks show the opposite.
---> 39
new
highs on NASDAQ. 39 new lows on NASDAQ
--->
48 new
highs NYSE 29 new lows on NYSE Bullish plurality
Hotline Sell S15 and
Flat Top Resistance Argue for a DJI Decline
The technicals we have been discussing
all this week. Why fundamentally
is the market going down? The
stock market does not like it when a Socialist
wins office in a major country.
Below is DJI chart for 1981.
The last time a Socialist became President
of France was in 1981. Mitterand was in
office until 1987. It is normal
for investor confidence to be
weakened initially in these circumstances.
"Big Finance"
demands concessions, assurances and respect, or else....
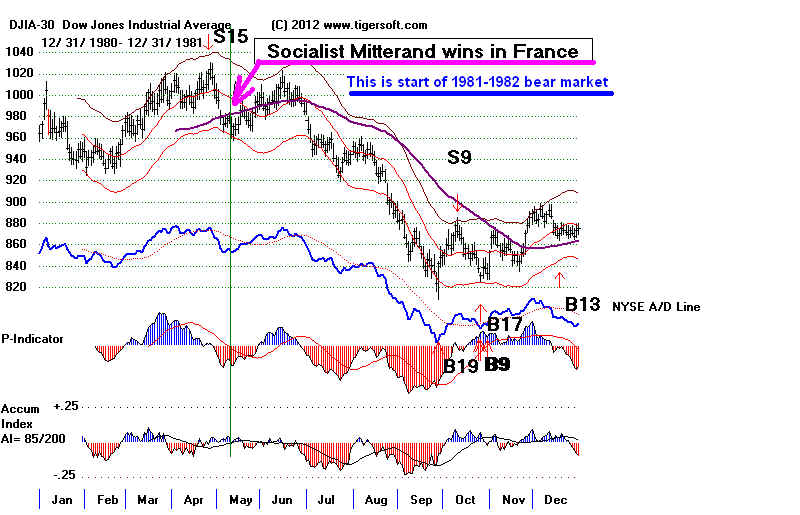
Finance Stocks in the US are now very troubled by the likelihood this Sunday
night
that a Socialist might soon again be taking power in France and
BIGGEST US BANKS' INDEX
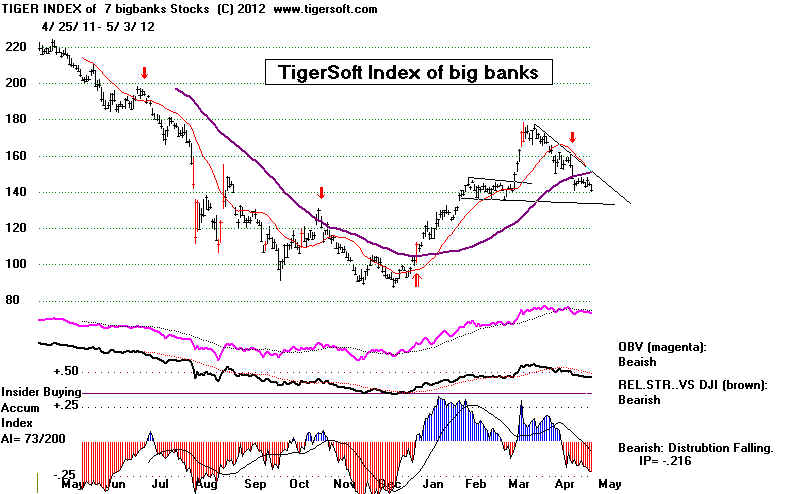
setting up a publicly run investment bank to create jobs, abandon the
"austerity"
path taken by the conservative Pres. Sarkhozy and threaten the dominance that
big private banks have over European central finance and political choices.
See Francois
Hollande, French President Candidate, On Brink Of Victory
"He (the French socialist
candidate Hollande) has identified the world of finance
as his true enemy, but his proposals are more Glass-Steagall than Lenin. His main plan
for French banks calls for a separation of their trading and commercial operations.
He calls for a new European emphasis on growth, but his solutions are mild" :
(1) bigger investment by a French government development bank,
(2) roll back on Sarkozy’s pension reform,
(3) hire tens of thousands of new teachers and
(4) raise the minimum wage.
http://blogs.reuters.com/great-debate/2012/05/03/what-happens-if-hollande-wins/
"Austerity" has clearly not helped
stocks in Spain and Italy. Shorting EWP (Spain)
Eand WI (Italy) when Peerless has been on a Sell has been very profitable. Perhaps,
an expansionist reversal of course and an abandonment of austerity will eventually
help create more jobs in France while the private sector holds back. A change
would seem hardly capable of being worse for Spanish and Italisn stocks. But an
end to austerity is not being offered Spanish and Italian voters.
How would an end to austerity's control of the US Congress affect US stocks?
Would the Dollar collapse? Would there be rampant inflation? Would consumers
have more money to start buying again? A Sociaiist in France may soon show us
the powers and policies that can be employed by a progressive in the context
of a recession and a dominant international financial elite. . If I have time in
next few weeks I will look back at how Mitterand's socialist vistory in May 1981
affected French markets and stocks world wide. US stocks went into a big
decline about a month after his surprise victory in 1981. This time a more moderate
Sociaist is expected to win.
SPAIN
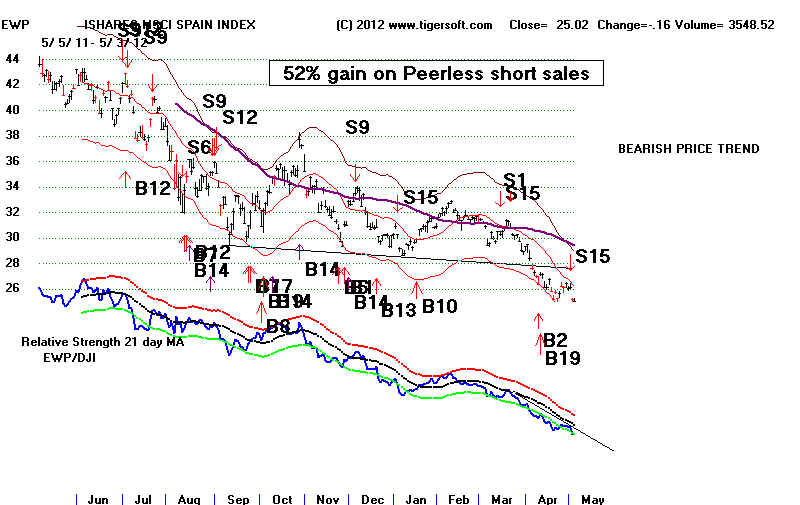 |
ITALY
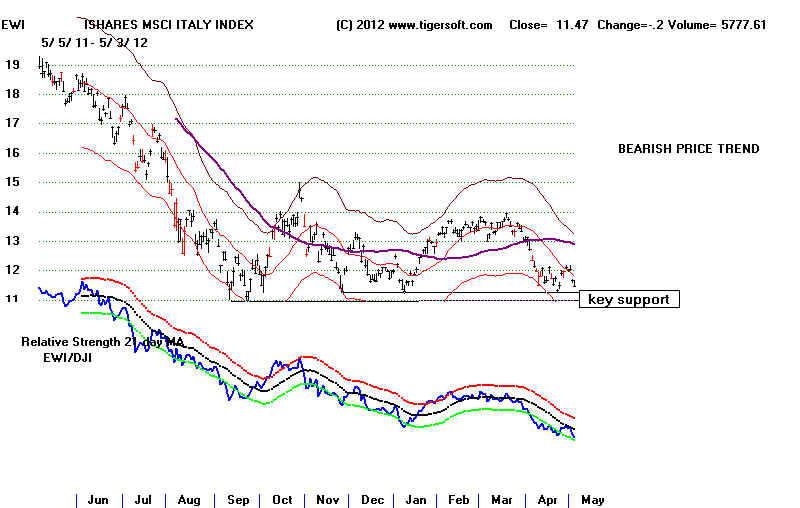 |
The Russell-2000 (IWM - its ETF) is clearly forming a bearish head and shoulders
pattern. Smaller stocks are the most vulnerable this index's weakness suggests.
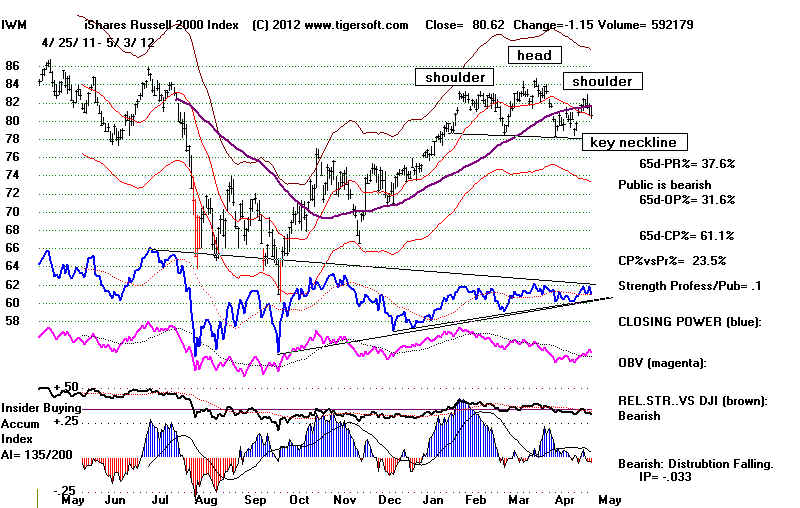
DIA is still above linor support 131.4. The Closing Power uptrend is being tested.
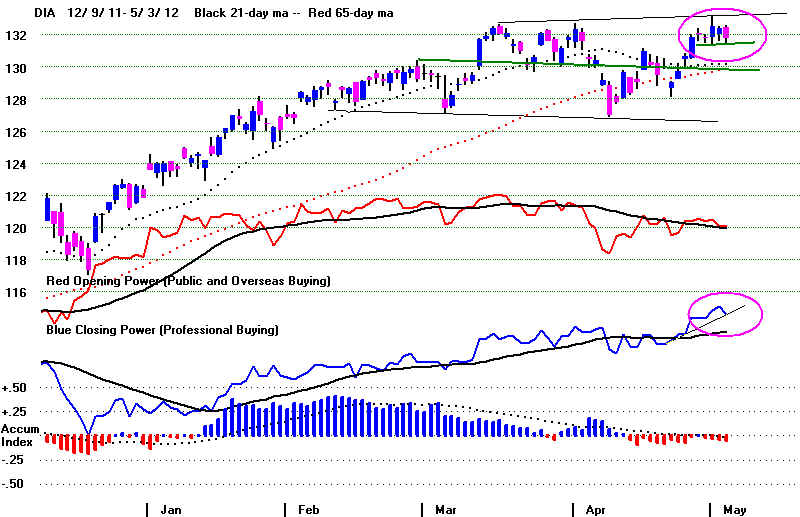
====================================================================================
OLDER HOTLINES
====================================================================================
5/2/2012 Hotline: Peerless Sell S15
Key Values - Peerless-DJIA -
DJI 13279
+66 la/ma = 1.017 21dmaROC== -004 P= -12 P-Ch= -91 IP21= -.001 V= -118 OP= .053
KEY TigerSoft CHARTS and
INDUSTRY INDEXES
DIA SPY QQQ DJIA-Peerless
TigerDJI TigerSPY TigerQQQ GLD SLV Crude
Oil IWM-Russell-2000
Key Stocks: AAPL and 4 highest priced DJI stocks: IBM CAT, - CVX - MCD and XOM
--->
338 MAXCP
stocks Bullish MAXCP Stocks
Bullish plurality
---> 85
MINCP stocks
Bearish
MINCP Stocks
MAXCP stocks are those showing
Tiger Closing Power making new highs.
This suggests heavy Professional Buying. Applying the Tiger Power Ranker's
"bullish" to the MAXCP stocks find those with heavy insider buying and
institutional accumulation. Bearish MINCP stocks show the opposite.
---> 54
new
highs on NASDAQ. 23 new lows on NASDAQ Bullish
plurality
--->
58 new
highs NYSE 17 new lows on NYSE Bullish plurality
Hotline Sell S15 and
Flat Top Resistance Argue for a DJI Decline
The Peerless Sell S15 and 3x tested flat resistance are most apt to bring a shallow
decline
to the
rising 65-day ma. Of course, a run to the upper band, at 13500, is still a
possibility,
though that
will probably take a month or more of DJI re-grouping and consolidation.
If the DJI
were at an all-time high, the threat of a breakout run would be much greater.
The Flat Top Is 2.5 X More Likley to Bring a Decline than A
Breakout
Note
that only short-term market tops are usually made when several
intra-day highs line up almost
exactly, as now, over a 3-6 week period.. Usually there is then a
direct decline to the lower band
rather than a breakout. Sometimes, too, there is a false breakout and a jump
only to the
upper
band and then a decline to the lower band. Looking out
one to two months,
the
odds of a decline nearly to or below the lower band are 4.5 greater than that there
will be
a
strong breakout advance past the upper band. This
is because once traders see that
a
certain level can not readily be surpassed and tend to take profits and even sell
short
waiting for the market to prove itself by reversing back upward from a lower point.
It is on that
rally
that a breakout more often occurs. .
DJIA
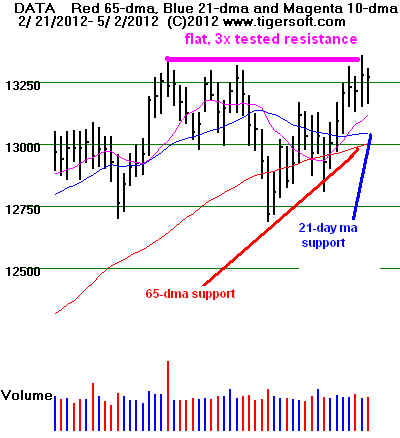
What happens after third test of
3-wk to 6-wk DJIA FLAT 3x tested resistance, as now?
1929-2012
35 cases: The
result was:
6 Breakout runs past the upper band with DJI not dropping much below 21-dma.
4 Breakout runs to the Upper band and then DJI decline lower band or below.
26 Declines to near to or below the lower band without more than a brief 1-2 day breakout.
     2/5/29-3/19/29   decline to lower band.
     8/10/36-9/23/36  decline to rising ma and then BREAKOUT.
     7/25/38-8/25/38  decline to below lower band
     2/3/50-3/6/50  decline to just below rising 21-dma and then BREAKOUT.
     10/5/50-11/20.50  breakout jump to UB and then decline to lower band.

     11/16/55-1/3/56  decline to lower band.
     3/13/59-4/6/59   decline only slightly below rising 21-dma
                      and then BREAKOUT.
     4/11/61-5/5/61 - breakout jump to UB abd then decline to lower band.
     11/16/52-12/13/52 decline to lower band.
     1/19/66-2/10/66  decline below lower band.

     3/24/76-4/22/76  decline to lower band.
     6/10/76-7/13/76  decline to lower band.
     8/16/78-9/21/78  decline below lower band.
     8/12/80-9/10/80  decline to lower band.
     3/3/82-3/31/82   decline almost to LB

     8/10/84-9/12/84  decline to lower band.
     9/17/84-11/7/84  decline to lower band.
     1/30/85-3/1/85   decline nearly to LB
     6/5/85-7/3/85    breakout jump to UB and then decline to lower band.
     5/29/86-6/26/86  1 day false breakout and then decline below LB

     7/18/91-8/8/91   decline to lower band
     10/18/91-11/14/91 decline below lower band.
     1/29/92-3/4/92     decline to lower band
     3/10/92-4/19/92   decline half way to LB from ma and
                       then rally and BREAKOUT.
     7/27/93-8/17/93   false breakout and decline to lower band.

     8/31/94-10/20/94  decline slightly below the lower band.
     7/12/95-8/2/95    decline half way to LB from ma and
                       then rally and BREAKOUT.
     9/13/95-10/16/95  decline half way to LB from ma
                       and then rally and BREAKOUT.
     8/7/96-9/10/96    BREAKOUT
     4/22/98-5/13/98   decline to lower band.

     6/17/05-7/28/05   decline to lower band.
     11/25/06-1/6/07   one day false breakout and decline half way to LB from MA
     6/4/2007-7/9/07   Breakout jump to UB and then
                       decline below the lower band.
     11/5/2010-12/21/2011 BREAKOUT
     10/28/2011-12/8/2011 pullback to rising 21-dma and then BREAKOUT.
|
OTHER TECHNICALS
Sell S15s can bring bigger declines. But in a Presidential Election year, a decline
to the rising 65-day ma would be most typical.
Today among the number of Sectors we follow, more groups have a majority
of their components above their 65-day ma than the reverse. This improves
yesterday's
opposite plurality.
Professionals have not turned bearish, judging from the rising Closing Powers
and the much larger number of MAXCP than MINCP stocks. This will act as a buffer
against any bigger decline.
The DJI and the major market ETFs all reversed from a weak opening today and
clawed their way back to almost even. So, Closing Powers are rising. In
particular,
the Closing Power for the DIA stands out. Breaking out
above a year-long resistance,
flat ressitance is usually quite bullish. You can look back at the old ETF charts to
see
some past cases.
The market's problem now is that the DJI is getting ahead of the averages. This
is usually a danger sign when the NYSE A/D Line also lags. But the NYSE A/D Line
is NOT lagging now. The biggest market declines do typically occur when the DJI
reaches
an over-bought condition at the upper band and the A/D Line fails widely to confirm.
So, a decline bigger than to the rising 65-day ma seems unlikely.
What To Trade with Peerless
The 65-day ma trend is your friend/
The results of trading Peerless vary according to what vehicle you choose to
use. Simply super-imposing the Peerless signals on your candidates cam help you
ascertain which is best. For the last 11 months, we get these results:
RSX (Russia) +117% IWM +78% EWZ (Brazil) +76%
IWM +78%
DIA +78% SPY +58% QQQ +40%
However. I would generally prefer to short somethng below its 65-day ma
and, on a Peerless Buy, go long an ETF that is above its 65-day ma, if that is possible.
Accordingly, RSX looks like a good ETF to
short now. The rising
Closing Power
is not as important with an ETF far away from NY.
RSX (Russia)
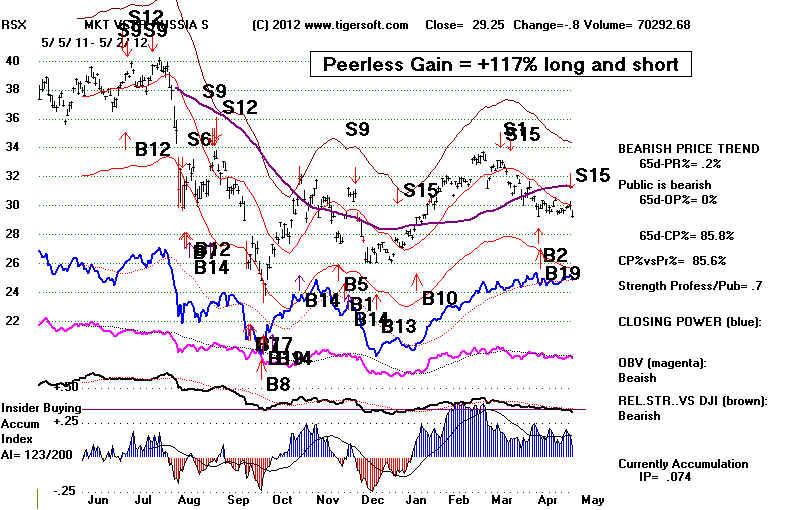 |
EWZ (Brazil)
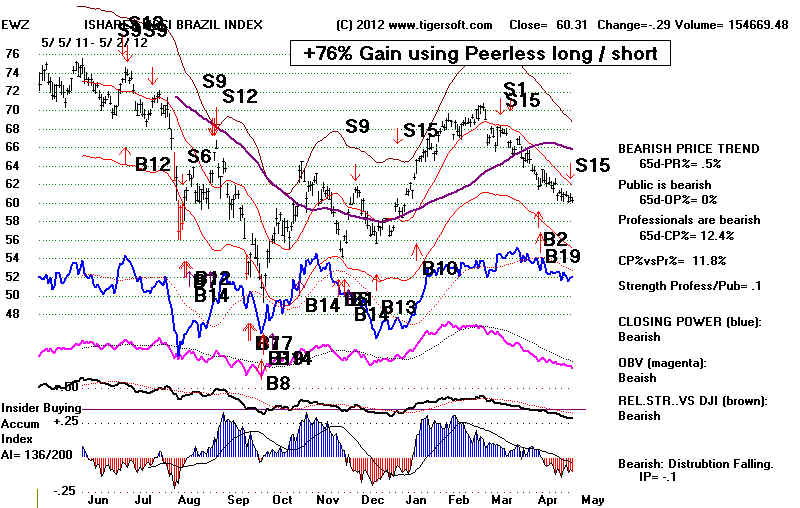 |
TRADING DOG - The Inverse of DIA - ON PEERLESS SELLS
DOG can be bought to hedge or short a retirement account.
Look at the bearish ETF, DOG, below.
Think of it as a stock you might buy. It is
at support and shows a positive Accumulation Index. But it is in a downtrend and any
rebound is likely to get stopped by the falling 65-dma. I placed in red the
points where
Peerless gave a Sell. A more significant rally in DOG would normally be expected if
its Closing Power had just broken its downtrend-line. Instead the CP is still
in an uptrend.
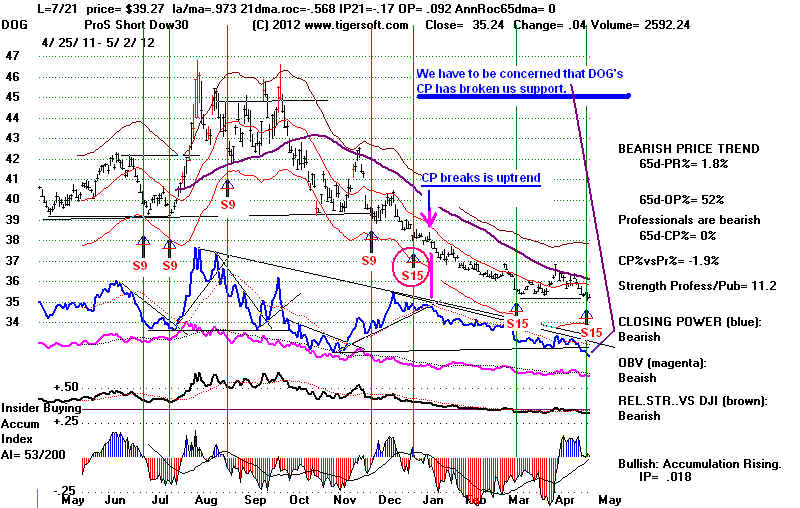
.
HOW MUCH IS LOST BUYING AN INVERTED ETF COMPARED TO
SHORTING THE LONG
EQUIVALENT ETF?
This is a question I've
long had. Going back to 2007, it looks like about 2%-3%
a year is lost.
RETURNS TRADING DOG (and
SHORTING DIA)
USING PEERLESS SELLS TO TAKE POSIITONS
AND THE NEST PEERLESS BUYS TO CLOSE IT.The results in BLUE were computed by reversing the S's to B's
and B's to S's when charting DOG and using the TigerSoft
calculation of trading results, at the close of the day
of the signal and the next day's opening. $40 commission
was assume don a round trip trade. $10,000 was started with.
at the beginning of the year. In parenthesies, I
show the results when shorting DIA instead of buying DOG.
------- TRADING GAINS --------
Buying DOG Shorting DIA Advantage
When Peerless When Peerless Trading
Short at OPNGS Short at OPNGS DIA over DOG
--------------------------------- -------------[
2007 15.96% 14.81% -1.15%
2008 35.62% 39.62% +4.00%
2009 9.8% 11.26% +1.46%
2010 10.18% 10.4% +0.28%
2011 20.36% 22.49% +2.13%
Conclusions:
1. Trade DIA not DOG if you have a choice. The difference is
per year about 2% since 2008.
2. Shorting at the close the day of the signal was
more profitable, but takes a lot more effort.
Advantage Trading
At Close over Next Day's Opening
---------------------------------------
2007 14.8% vs 16.0% -2.0%
2008 40.5% vs 35.3% +5.2%
2009 12.2% vs 9.8% +4.4%
2010 10.4% vs 10.2% +0.2%
2011 23.8% vs 20.4% +3.4%
-------------------------------
20.5% 18.3% +2.2%
3. DOG Paper losses were limited t0 6.2% and under trading DOG
at the next day's opening. Working with a 6.5% stop loss
would have worked well. The biggest paper loss in the
last five years was 6.4%. If this is too big, a maximimum
paper loss of 5% would have worked well except in the
wild year of 2008.
      Shorts                                                                     Shorts
               entered at                                                               entered at
               Close of Signal                                                     Opening the day after the signal
-------------------------------------------------------------------------------
2007  +14.84% (+13.88%)                +15.96% (vs +14.81%)
 3% was biggest paper loss (vs 1.4%)   4% was biggest paper loss (vs 4.8%)
---------------------------------------------------------------------------------
2008  40.47% (+46.8%)                  +35.25% (vs +39.62%)
 5.3% was biggest paperloss (vs 4.8%)  4.9% was biggest paper loss (vs 4.8%)
-----------------------------------------------------------------------------------
2009  12.23% (+12.86%)                 +9.8% (vs +11.26%)
 6.5% was biggest paperloss (vs 6.0%)  6.4% was biggest paper loss (vs 6.2%)
----------------------------------------------------------------------------------
2010  10.35% (+10.32%)                 +10.18% (+10.4%)
 1.8% was biggest paperloss (vs 1.7%)  1.5% was biggest paper loss (vs 1.4%)
----------------------------------------------------------------------------------
2011  23.77% (+25.06%)                  +20.36% (+22.49%)
 1.7% was biggest paperloss (vs 1.6%)   1.8% was biggest paper loss (vs 1.6%)
------------------------------------------------------------------------------
|
===================================================================================
OLDER HOTLINES
===================================================================================
5/1/2012 Hotline: New Peerless Sell
S15
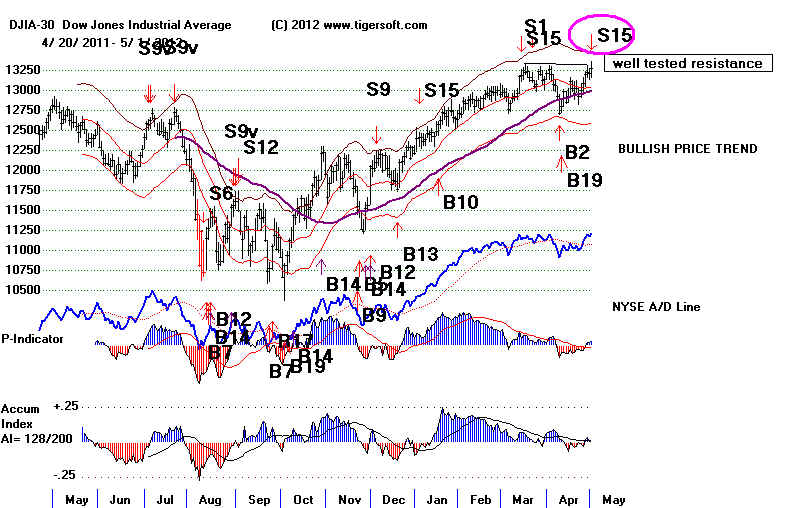
Key Values - Peerless-DJIA -
DJI 13279
+66 la/ma = 1.018 21dmaROC= .061 P= 78 P-Ch= +18 IP21= -.003 V= -87 OP= .037
KEY TigerSoft CHARTS and
INDUSTRY INDEXES
DIA SPY QQQ DJIA-Peerless
TigerDJI TigerSPY TigerQQQ GLD SLV Crude
Oil IWM-Russell-2000
Key Stocks: AAPL and 4 highest priced DJI stocks: IBM CAT, - CVX - MCD and XOM
--->
221 (+19) MAXCP
stocks Bullish MAXCP Stocks Bullish plurality
--->
Portfolio of 5 low priced high Accumulation
stocks picked on March 2
Up +14% 1/2 position in MNTG and RGEN sold
with 50% gain.
This is being closed now because of Sell from Peerless and weakness in lower priced
stocks.
---> 73
(+26) MINCP stocks
Bearish
MINCP Stocks
MAXCP stocks are those showing
Tiger Closing Power making new highs.
This suggests heavy Professional Buying. Applying the Tiger Power Ranker's
"bullish" to the MAXCP stocks find those with heavy insider buying and
institutional accumulation. Bearish MINCP stocks show the opposite.
---> 92
new
highs on NASDAQ. 16 new lows on NASDAQ Bullish
plurality
---> 129
new
highs NYSE 6 new lows on NYSE Bullish plurality
Hotline
Take Some Profits and Hedge with some shorts.
The new Sell S15 tells us to
expect another test of the rising 65-day ma.
S15s are based on the
V-Indicator flagrantly not confirming a new high with the
Annualized Rate of
Change of the 21-dma being under +.60 and the current
Accum. Index less than
+.10.
Reversing (^) Sell S15s
in a Presidential Election year have averaged gains on the
short side of only
3.3%. There were 7 cases. Small paper losses under 3%
are not uncommon.
This would be in keeping with a possible rise to 13500 and
the upper band,
especially if rising crude oil and gas prices lift XOM and CVX.
Reversing Sell S15s since 1928
Key Peerless Values
When Reversed
date
dji
la/ma
ann roc. P-I P ch AI
V-I
OPct Date
DJI Gain
^2/18/36
153.4 1.029
.608
57
17 .016 -28
.18 5/5/36
148.6 +3.1
^4/6/72
959.44 1.02
.159 -70
15 .036 -1
.086 7/18/72 911.72
+5.0%
^3/24/76 1009.21 1.024
.192 -64
10 -.033 -1
.293 10/5/76
966.76 +4.2%
^4/14/92
3306.13 1.017 .256
-59 40 .033
-10 .231 8/21/92 3254.10 +1.6%
^2/11/2004 10738
1.017 .285 246
22 .093 -6 .136 5/18/04 9968.51 +7.2%
^1/4/2012
12418 1.025 .393
213 -35 .045
-4 .10
7/8/08
11384.21 -1.3%
^ 3/14/2012 13194
1.019 .295
29 -148 .069 -24 .23
4/10/11 12716
+3.6%
-----------------------------------------------------------------------------------------------------------------------
N=7
Avg +3.3%
^5/1/2012 13279 1.018 .061
78 +18 -.003
-87 .037
?
?
?
Weakness is Spreading.
The market is clearly
weakening. Though the DJI is 1.8% over the 21-day ma
the Tiger Accumulation Index
is negative as is the V-Indicaor. The OPCT is
only +.037. This
signifies that any breakout above 13325 will take place on light volume.
While a breakout run to 13500
and the upper band cannot be excluded as a possibility,
such a move would have to
deal with a lot of over-head supply, so much so that
it could bring a Sell S12 or
Sell S9v. The number of groups of stocks with a majority of
their compenents above the
65-day ma is now in a minority, despite the DJI advance to
a new 12-month high.
High priced REITs, bond funds and the institutionally favored high
priced stocks are getting too
far above nearly all the other groups. This naturally occurs
as nervous traders favor and
hold longer the stocks still doing well, especially if they pay
dividends. Presently, I
would not say that the divergences here are so great as to
present a much of a threat to
the market. But, as we mentioned two nights agi, seasonality
turns weaker in May.
The DJI's new high was
not confirmed by the QQQ, NASDAQ, SP-500. NYSE, OEX
or Value Line/Russell-2000/IWM. These last two, which broadly
represent most stocks,"
show bearish head and
shoulders patterns, still.
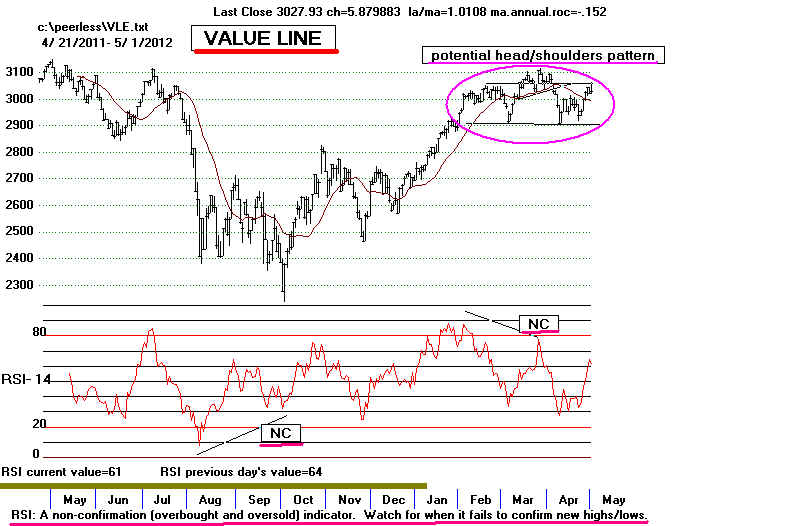
The DJI may get a bit of
strength here, since its Closing Power is rising and its Opening
Power is above its 21-day ma.
In addition, natural gas prices are receovering from
a deep price slump and crude oil prices are moving up technically. This
boosted
XOM
and CVX in the DJI today. As high priced DJI-30 stocks,
these two have a proportionally
greater power to move the
DJI-30.
I take it as significant that
so many of the industry groups we follow now show
a majority of their
compenents below the 65-day ma.
Pct of Stocks over 65-dma by Industry/Market
Sector
5/1/2012
----------------------------
BestREITs NH
100%
Bond Funds
79% +12%
HighPrice Stks NH 71% +1%
DJI-30 stocks 70% +7%
Home Bldg
68% +4%
Utility Stocks 68% +6%
Super 2011 Stks 67% -4%
SP-500 stocks 61% +2%
Chem
56%
Nasdaq-100
54%-1%
Retails
54% -4%
Biotech All 51% -2%
=========================
Foreign ETFs
50% +8%
Gaming
50% -15%
=========================
Finance Stocks 49% -1%
Transport Stock 48% -3%
Military 48%
Biotech 17
47% -6%
Software
47% -3%
Computer Eq 46%
Ind. Materials
44%
Pipelines
43%
Oil stocks ..
39% +9%
Chinese Stocks 37% +2%
Green Stks
35% -5%
Low Priced
34% -2%
Food Commodi 30% -10%
Auto Stocks
26% -3%
Gold/Silver Stks 16% +2%
This table regularly appears
at http://tigersoft.com/2012-AprilHL/charts/index.html
DIA's Closing Power is still rising and DIA has not broken
above resistance-line going through trading highs.
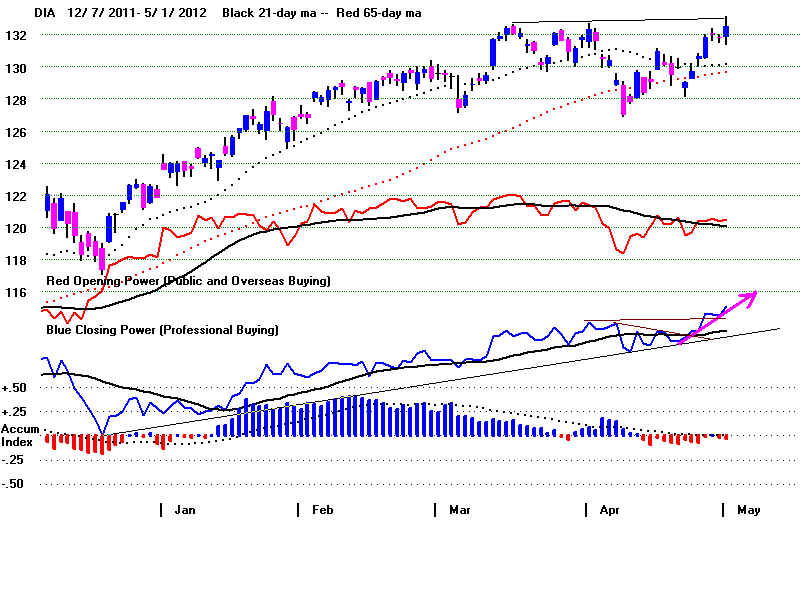
===================================================================================
Older Hotlines
===================================================================================
4/30/2012 Hotline: Still on Peerless Buys
Operating Signals: Reversing Buy B2
Reinforcing Buy B19
Key Values - Peerless-DJIA -
DJI 13214 +15
la/ma = 1.013 21dmaROC= .062 P= 59 P-Ch=-2
IP21=-.042 V= -88 OP= .047
KEY TigerSoft CHARTS and
INDUSTRY INDEXES
DIA SPY QQQ DJIA-Peerless
TigerDJI TigerSPY TigerQQQ GLD SLV Crude
Oil IWM-Russell-2000
Key Stocks: AAPL and 4 highest priced DJI stocks: IBM CAT, - CVX - MCD and XOM
---> 202 MAXCP stocks Bullish MAXCP Stocks Bullish plurality
--->
Portfolio of 5 low priced high Accumulation
stocks picked on March 2
Up +14% 1/2 position in MNTG and RGENN sold
with 50% gain.
---> 46
MINCP stocks
Bearish
MINCP Stocks
MAXCP stocks are those showing
Tiger Closing Power making new highs.
This suggests heavy Professional Buying. Applying the Tiger Power Ranker's
"bullish" to the MAXCP stocks find those with heavy insider buying and
institutional accumulation. Bearish MINCP stocks show the opposite.
---> 92
new
highs on NASDAQ. 16 new lows on NASDAQ Bullish
plurality
---> 129
new
highs NYSE 6 new lows on NYSE Bullish plurality
Hotline
No Sell but We Have Reached Resistance
Just Holding Now... We could get a Bullish Breakout Buy B10
But a Sell S15 is more likely. The May Day
99%ers' Protest Is Not Expected
to Shake up the Market. But
the Technicals Are weakening and some profit-taking
seems reasonable. If you
choose to hedge with some short sales, consider shorting
stocks showing very heavy red Distribution and a very weak Closing Power.
I usually
advise waiting for such
stocks to break below their 65-day ma. Tonight, I am posting
some short sales ideas at the
bottom of tonight's hotline that have not yet penetrated their
65-day ma. I will do a
follow-up on them.
Buying "Inverse Funds" in a
Retirement Account to Go Short.
We do
not have a Sell signal yet. When we do, you might want to look at buying
in a retirement account an
"Inverse fund". The data for these in the Tiger Data
download
"SHORTETF". Be careful with these. Some are very thin. Look
at DOG's
chart when considering what to do.
I don't see a lot of upside potential here, because
the falling 65-day ma will act as
resistance and the blue Closing Power is still falling.
In addition, the falling 21-day ma
will also act as resistance.
In
the next few days I will post the DOG charts back to 2008 when they began and,
possibly figure a way we can
super-impose the Peerless signals reversed, so that we
can see how well
short-selling works with DOG, and perhaps others, when we
get a Peerless Sell. .
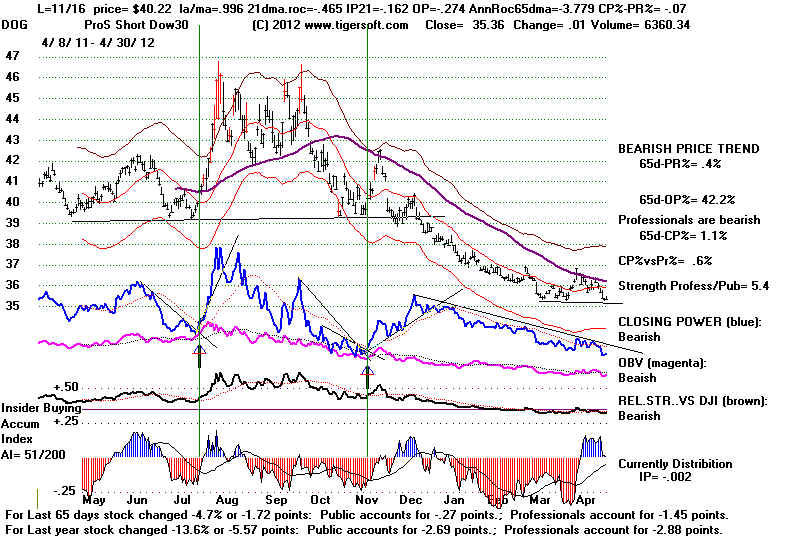
|
Direxion
- Direxion Financial Bear 3X - NYSE: FAZ
- Direxion Technology Bear 3x - NYSE: TYP
- Direxion Russell 1000 Bear 3x - NYSE: BGZ
- Direxion Russell 2000 Bear 3x - NYSE: TZA
- Direxion Russell MidCap Bear 3x - NYSE: MWN
ProShares
- ProShares Short Dow 30 - NYSE: DOG
- ProShares Short S&P 500 - NYSE: SH
- ProShares Short S&P MidCap 400 - NYSE: MYY
- ProShares Short S&P SmallCap 600 - NYSE: SBB
- ProShares Short Nasdaq 100 - NYSE: PSQ
- ProShares Short Russell 2000 - NYSE: RWM
- ProShares S&P 500 Bear 3x - NYSE: SPXU
Horizons BetaPro
- HBP S&P/TSX 60 Bear Plus ETF - TSX: HXD
- HBP S&P/TSX Capped Energy Bear Plus ETF - TSX: HED
- HBP S&P/TSX Capped Financials Bear Plus ETF - TSX: HFD
- HBP S&P/TSX Global Gold Bear Plus ETF - TSX: HGD
- HBP S&P/TSX Global Mining ETF - TSX: HMD
- HBP NYMEX Crude Oil Bear Plus ETF - TSX: HOD
- HBP NYMEX Natural Gas Bear Plus ETF - TSX: HND
- HBP COMEX Gold Bullion Bear Plus ETF - TSX: HBD
- HBP S&P500 Bear Plus ETF - TSX: HSD
- HBP NASDAQ-100 Bear Plus ETF - TSX: HQD
- HBP U.S. Dollar Bear Plus ETF - TSX: HDD
- HBP MSCI Emerging Markets Bear Plus ETF - TSX: HJD
- HBP DJ-AIG Agricultural Grains Bear Plus ETF - TSX: HAD
- HBP U.S. 30yr Bond Bear Plus ETF - TSX: HT
Source: http://en.wikipedia.org/wiki/Inverse_exchange-traded_fund
|
INTERNAL STRENGTH NUMBERS
The numbers being dropped off in the calculation of Peerless and Tiger indicators
are as important as the ones
being added. Whatever breadth, volume and Accumulation
numbers tomorrow brings, it
may be helpful to know that the Peerless data of
21-days ago is equally as
important in calculating the tomorrow's P-Indicator, V-Indicator,
OPct and Accum. indicator as
is tomorrow's. This is the nature of using 21-day mvg.
avgs. to smooth out the
monthly market cycle as we calculate tomorrow's P-Indicator,
V-Indicator, OPct and
Accum. indicator.
21-days ago we saw the
following data:
Date
DJI high low
close advances
declines up volume down volume
---------------------------------------------------------------------------------------------------------------------
3/30/ 2012
12249 13128 13212
1750 1290
641.58
317.06
The data 21 trading
days ago was for a day that the DJI rallied 67 points
and showed a 3:2 ratio
of for breadth, a 2:1 ratio for up to down volume and
the DJI closed much
nearer its highs than lows, thus lifting the Accumulation Index.
This means that for the
key Peerless Indicators to rise tomorrow, we will need to
see an even better day
than occurred on March 30th. This
means that any close
by the DJI above 13265
will bring a Sell S15. That is only 51 points higher. Taking
some trading profits on
strength tomorrow would seem reasonable,
but a big
drop is not expected.
But what about a flat
topped breakout? How bullish would that be? Flat-topped
breakouts nearly always
cause a rush to buy for a day or two, at least. Such a price
breakout here should
boost prices. But, probably only to the upper 3.5% band.
That would mean a 2%
move up from here.
And what if the market
just retreats from here?
A minor retreat to the
lower band that does not rupture the 12700 support
is the most that can be
predicted now without a new Peerless Sell or using the old
Sell S2 from the
2006-Peerless. (See the last hotline).
Are Flat Topped Breakouts to be trusted in early May?
I have counted 31 Buy
B10s since 1942. Only 2 occurred in May. Only
one of these took place
in a Presidential Election. The two May B10s
both showed current AI
(IP21) values more than double those now.
The Opct and V-i are
much lower now than in these cases, too.
Key Peerless Values
LA/MA ROC
P-I PIch IP21
V-I Opct
Currently
1.013 .062 59 -2
-.042 -88 .047
Gain
LA/MA ROC P-I
PIch IP21 V-I Opct
5/19/1948 188.3 +2.1%
1.027 .494 108 13
.211 138 .40
Also a Buy B18. DJI rallied immediately but only for 3 weeks. It was
Reversed on 6/16/48 at 192.3 by S1
A bearish head and shoulders top pattern should not appear so quickly after a
valid Buy B10.
Gain
LA/MA ROC
P-I PIch IP21
V-I Opct
5/26/1993
3540.16 +12.1% 1.022 .428 105 28
.138 15 .204
This Buy was reversed at 3967.66 on 2/3/94 by S4
Are Flat Topped
Breakouts to be trusted when key Peerless Parameters are
not very high, as now?
Probably not. The current V-I is a -88. There are no
cases of Buy B10s when the
V-I is below 0. The current Opct is +.047. There
is only one case where the
Opct was as low as +,05, In all other cases it was,
at least +.15. IP21s
are normally above +.10 on Buy B10s, but there is one case
where it was almost negative.
In that case, 8/17/1965, the other internals were all
moderately higher than
now. It also is different from now in that there had just
been a 10% sell-off.
Gain
LA/MA ROC P-I
IP21 V-I Opct
8/171965 894 +10.2%
1.019 .19
88
.011 +4
+..042
This was a reversing
Buy after an intermediate decline of 10%.
.The DJI continued high and was reversed at 985.41 on 1/10/66 by S4
STOCKS
Will these S7s (bearish
Closing Power divergence stocks) break the support
of their 65-day?
I suspect they will if the DJI sells off here.
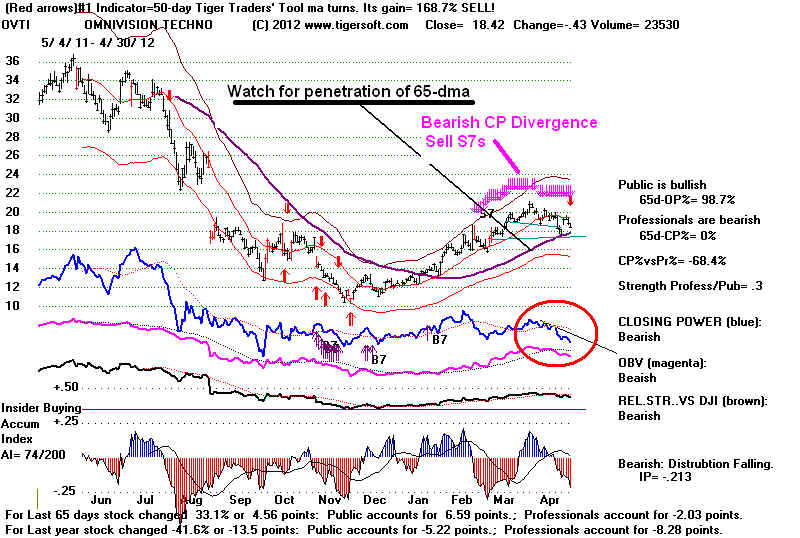
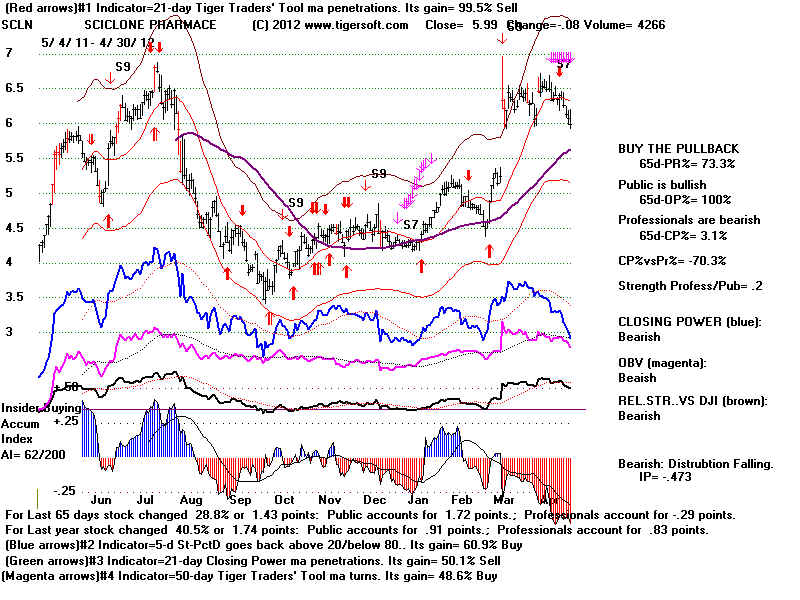
=====================================================================================
OLDER HOTLINES
=====================================================================================
4/27/2012 Hotline: Still on Peerless Buys
Operating Signals: Reversing Buy B2
Reinforcing Buy B19
Key Values - Peerless-DJIA -
DJI 13228
+24 la/ma = 1.015 21dmaROC= .093 P= 61 P-Ch=86 IP21=-.065 V= -83 OP= .149
KEY TigerSoft CHARTS and
INDUSTRY INDEXES
DIA SPY QQQ DJIA-Peerless
TigerDJI TigerSPY TigerQQQ GLD SLV Crude
Oil IWM-Russell-2000
Key Stocks: AAPL and 4 highest priced DJI stocks: IBM CAT, - CVX - MCD and XOM
---> 337 MAXCP stocks Bullish
MAXCP Stocks Bullish plurality
--->
Portfolio of 5 low priced high Accumulation
stocks picked on March 2
Up +15% 1/2 position in MNTG and RGENN sold
with 50% gain.
---> 48
MINCP stocks
Bearish
MINCP Stocks
MAXCP stocks are those showing
Tiger Closing Power making new highs.
This suggests heavy Professional Buying. Applying the Tiger Power Ranker's
"bullish" to the MAXCP stocks find those with heavy insider buying and
institutional accumulation. Bearish MINCP stocks show the opposite.
---> 92
new
highs on NASDAQ. 16 new lows on NASDAQ Bullish
plurality
---> 129
new
highs NYSE 6 new lows on NYSE Bullish plurality
Hotline
No Sell but We Have Reached Resistance
Just Holding Now... We could get a Bullish Breakout Buy B10
Be careful now, as another 35 point
rally by the DJI with mediocre
breadth could bring a reversing Sell S15. At the same time, a hesitation
here while internal strength indicators become more positive could
bring a bullish breakout above the flat resistance we have seen
for a month.
It should be considered quite bullish that the Tiger CLosing Power
for the DIA has burst past a series of old highs. But the DJI has now
reached the resistance at its recent highs and a May decline is just as likely
in a Presidential Election year as a DJI advance. Wait to see how good
the internals are tomottow and what signal they produce. There were some very
big gains in some computer and QQQ stocks Friday. Shorts seem to be
very nervous in CRAY up 27%, EXPE
up 23%, AMZN up 15%, all in only one day.
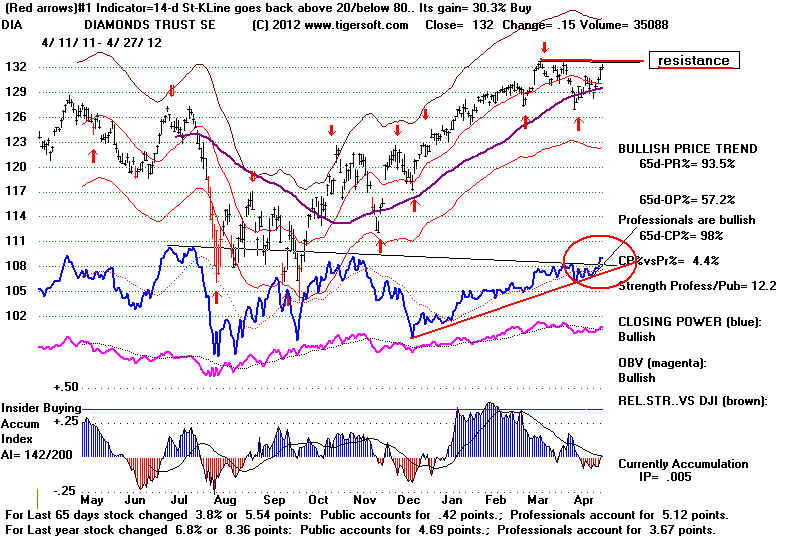
I got an email about the older Peerless system's recent Sell S2..
The older Peerless system, used in 2007, did give a Sell S2 on Thursday.
The Help section of the older software says that this is a "Sell at well-tested
resistance in the Summer during a Presidential Election year." I do not
have the source code to give more information about its basis. But, we can now
learn from it. Though it would have been profitable in 4 earlier cases, it
must be over-ridden if the DJI makes a clear breakout above flat resistance.
Such a clear breakout might occur if the DJI closes above 13330.
Not seeing its limitation, would have meant having to endure a 23.7% loss
from the bad S2s that would have occurred on 8/8/1928, if one had not closed out
short sales and bought on the well-tested breakout that soon followed.
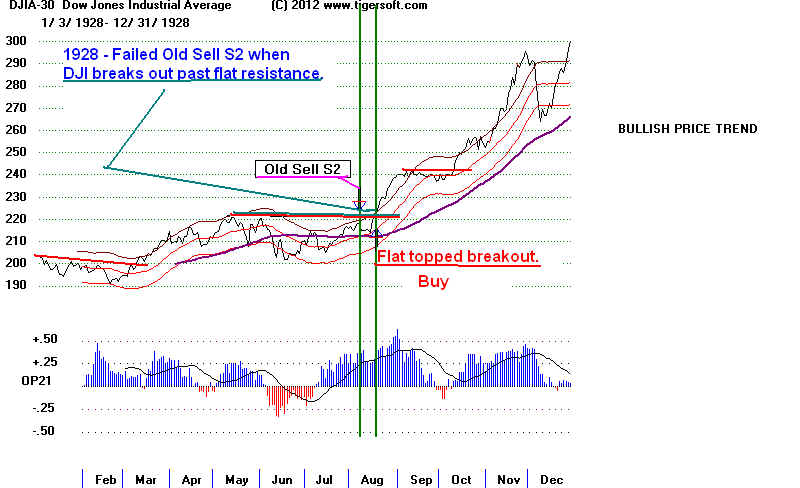
There were a total of only 4 good "OLD S2s":
7/22/1952 DJI=276. Rose to 280.30 on 8/11/1952 and then fell to 263.10 on
10/22/1952
8/14/1972 DJI=973.51 This was peak. DJI fell to 921.66 on 10/16/1972
7/12/1976 DJI=1011.21 This was peak. DJI fell to 960.44 on 8/26/1976
7/31/1992 DJI=3393.70 This was peak. DJI fell to 3228.17 on 8/24/1992
This is not enough to place a lot of confidence in.
Stocks
It only takes one or two super stocks to bright up a portfolio.
Here is my study of the top Dozen Best performing stocks for 2012, thus far.
All but one are US stocks. 10 of 12 showed bulges of insider buying,
IP21>.37, just before or at the start of their advance. Major Tiger Buys
(B10, B12, B20 and B24) were also present. This shows you will want
to watch the new high list for these conditions. But you might also want
to look at all stocks showing recnet Accum. Index bulges and stocks
advancing on record volume from long bases.
http://tigersoft.com/Tiger-Blogs/4-27-2012/index.html
I frequently mention that the best performers "out of the gate", as it were
do the best. The gate in effect goes up when Peerless gives a major
reversing Buy after a general market decline. The best performers are
often low priced stocks. So, one needs to buy a sample of 5 or 6. Add to
positions on pullbacks when the Closing Power hooks back up and when
there are breakouts above flat topped resistance.
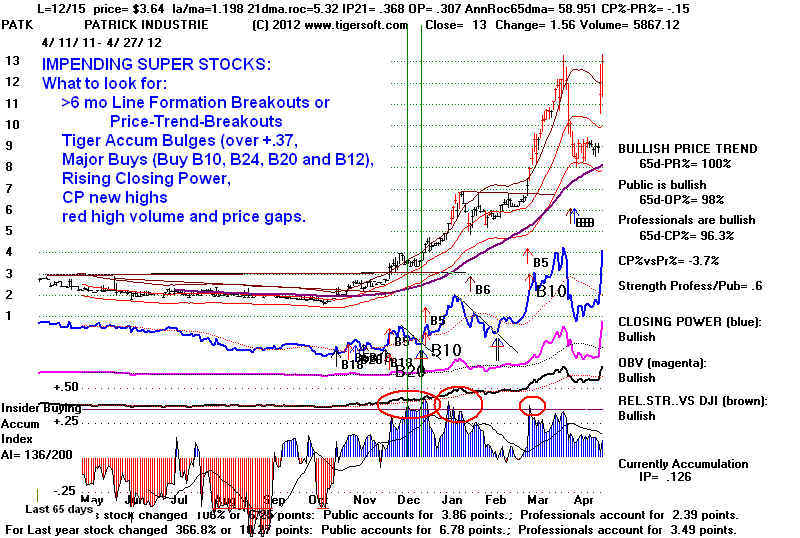
More comments Sunday night.
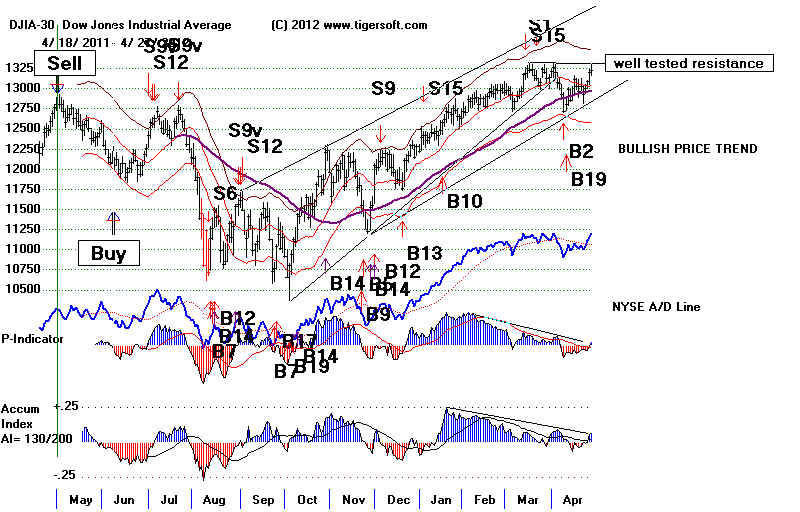
DIA SPY QQQ DJIA-Peerless
TigerDJI TigerSPY TigerQQQ GLD SLV Crude
Oil IWM-Russell-2000
BREADTH STATISTICS: Advance= 2037
Declines= 979 UpVol
=453.61 DownVol= 321.7
=====================================================================================
OLDER HOTLINES
=====================================================================================
4/26/2012 Hotline:
Operating Signals: Reversing Buy B2
Reinforcing Buy B19
Any Quick +120 Point Rally Past
13320 (+116) Will Probably Bring A Peerless Sell.
Mays Tend to be Bearish in Presidential Election Years.
Bullishly, the potential Head and Shoulders
has been destroyed with today's advance. Any right
shoulder that develps now will not be
sufficiently symmetrical to the right shoulder to consider such pattern
to be present.
12650-12700, however, is still important well-tested
support; any closing violation would probably
bring a Sell S10.
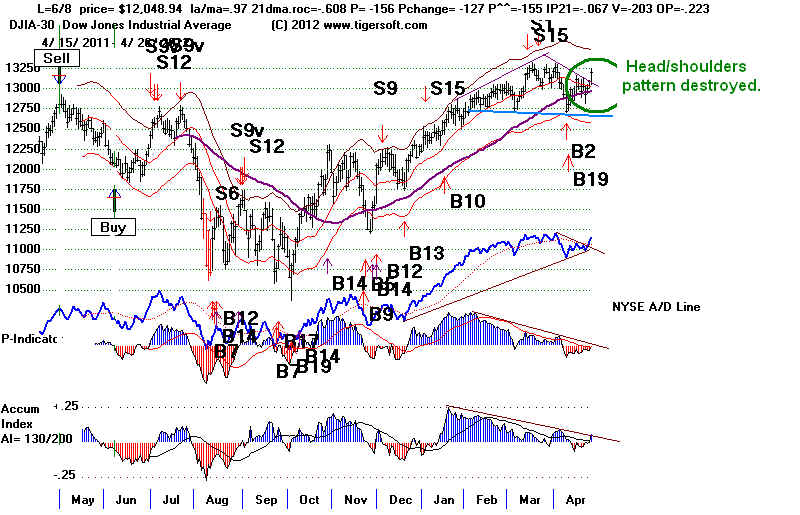
A Contructive Hesitation:
Futures Down 56 Now.
Pundits often say that the most "bullish
thing" the market can do is "to advance". That is not true now.
A DJI run tomorrow to 13328 or higher, using the
hypothetical highs, will likely bring a Sell S15. That is
124 points above today's close. (We get these
get these results by dummying in hypothetical numbers
for tomorrow's trading into "c:\peerless\DATA.txt".) The
chart shows a zone of resistance is being
set up now at the recent closing highs in the
vicinity of 13230 and the hypothetical highs at 13300.
The DJI would do better if it let the internal
strength readings improve. Tonight, despite the DJI being
1.3% over the 21-day ma, the P-Indicator stands
at -24 and the V-Indicator - 104.
A DJI rally now
to the upper 3.5% price band at 13480 would
bring a Sell S9. So some weakness in the DJI should
be considered healthy. It would also be
in keeping with the pattern shown since 1965 of the DJI
rising only 45.7% of the time in the 3 trading
days at the end of April.
"Go Away in May"
This axiom worked very well in 2010 and 2011.
The peaked on 4/26/2010 and then fell 13.5%.
In 2011, the NASDAQ peaked on May 2 and then
fell 18.5%. One
researcher writes
when all the historical data going back to 1896
is aggregated, "the Dow hits a peak on May 6th
and pulls back an average of 1.33% by May 25th...By
October 27th, the Dow has advanced
just 0.34% from May 6th. This means that
the market is nearly flat for slightly more than
one-third of the year".
My
own work shows that since 1944, the DJI is more than 3+ times as likely NOT to trade
more widely
than 12% from its high to its low from April to
September in a Presidential Election year, as to trade
more widely. You might want to keep this table.
It appears in
http://tigersoftware.com/2011-EXPLO/Seasonality/index.html
Monthly Gains in
The Presidential Election Year
1916-2008
              Avg.Pct       Number of Losses    Comments
                            in the 24 cases
-------------------------------------------------------------------------
January       -.2            11 11/25           Up in 2012
February      -.8            12 12/25           Up in 2012
March          1.2            8   8/25           Bullish Up in 2012
April         -1.4           14 ?                Bearish  ?
May           -1.3           12                  Bearish
June           .7            10
July           1.5           12                  Bullish
August         2.8               8                   Very Bullish
September     -.2            15
October       -.1             8
November       .8            10
December       1.1            9                  Bullish
--------------------------------------------------------------------------------------------------------------------------------------------
EquityClock.com
has excellent graphs for DJIA seasonality data for All Years
and for
Presidential Election Years. It is based
on the period 1928-2009. Its chart shows DJI weakness
is much more pronounced in Presidential Election
years from early April to mid-July than generally
in this period.
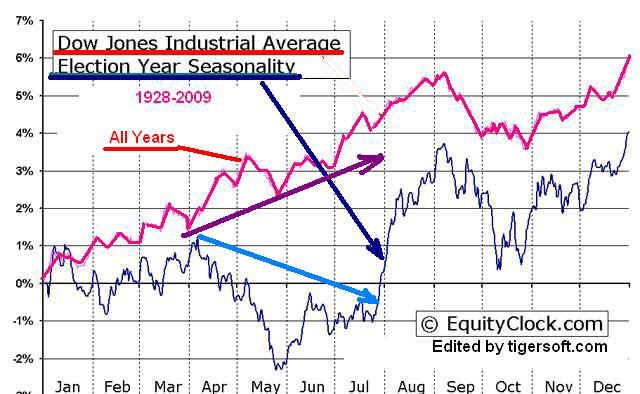
Key Values - Peerless-DJIA -
DJI 13205
+113 la/ma = 1.013 21dmaROC=
.006 P= -26 P-Ch= 75
IP21=-.057 V=
104 OP= .054
BREADTH STATISTICS: Advance= 2059
Declines= 969 UpVol
=523.15 DownVol= 245.9
Key Stocks: AAPL and 4 highest priced DJI stocks: IBM CAT, - CVX - MCD and XOM
---> 275 MAXCP stocks Bullish
MAXCP Stocks Bullish plurality
--->
Portfolio of 5 low priced high Accumulation
stocks picked on March 2
Up +17% 1/2 position in MNTG and RGENN sold
with 50% gain.
---> 52
MINCP stocks
Bearish
MINCP Stocks
MAXCP stocks are those showing
Tiger Closing Power making new highs.
This suggests heavy Professional Buying. Applying the Tiger Power Ranker's
"bullish" to the MAXCP stocks find those with heavy insider buying and
institutional accumulation. Bearish MINCP stocks show the opposite.
---> 64
new
highs on NASDAQ. 16 new lows on NASDAQ Bullish
plurality
---> 97
new
highs NYSE 12 new lows on NYSE Bullish plurality
====================================================================================
OLDER HOTLINES
====================================================================================
4/25/2012 Hotline: Operating Signals: Reversing Buy B2
Reinforcing Buy B19
Head and
Shoulders S10 DJI's
Neckline support now is at 12660. I suggest placing a
closing stop below 12650.
Key Values -
Peerless-DJIA -
DJI 13091
+89 la/ma = 1.005 21dmaROC= -.138 P= -102 P-Ch= +2 IP21=- .0 V= -129 OP= -..036
BREADTH STATISTICS: Advance= 2350
Declines= 706 UpVol
= 644.54 DownVol= 169.63
Key Stocks: AAPL -1.28 and 4 highest priced DJI
stocks: IBM -.98 CAT, -.83 CVX -.08, MCD -.75 and XOM-.39
---> 170 MAXCP stocks Bullish
MAXCP Stocks Bullish plurality
--->
Portfolio of 5 low priced high Accumulation
stocks picked on March 2
Up +19% 1/2 position in MNTG sold with 50%
gain. These have been creeping
higher. I take that as a sign that they have further to run.
---> 58
MINCP stocks
Bearish
MINCP Stocks
MAXCP stocks are those showing
Tiger Closing Power making new highs.
This suggests heavy Professional Buying. Applying the Tiger Power Ranker's
"bullish" to the MAXCP stocks find those with heavy insider buying and
institutional accumulation. Bearish MINCP stocks show the opposite.
---> 52
new
highs on NASDAQ. 13 new lows on NASDAQ Bullish
plurality
---> 83
new
highs NYSE 6 new lows on NYSE Bullish plurality
Peerless remains a on a buy signal. The markets need to keep
advancing to surpass
their resistance levels just above
today's close. The DJI faces a downtrend resistance
line, as shown in the chart below.
See the QQQ and SPY charts below. The P-Indicator
and Accumuation are still not positive.
But bullishly the Closing Power downtrends of the DIA,
SPY and QQQ have been broken.
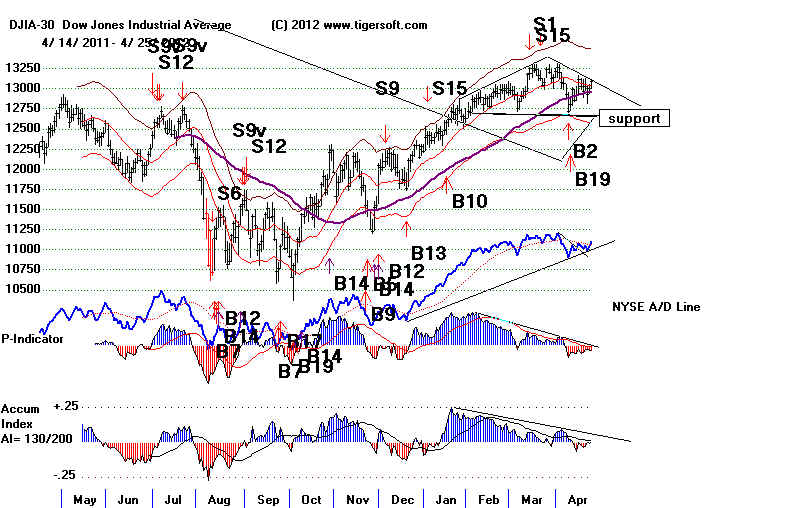
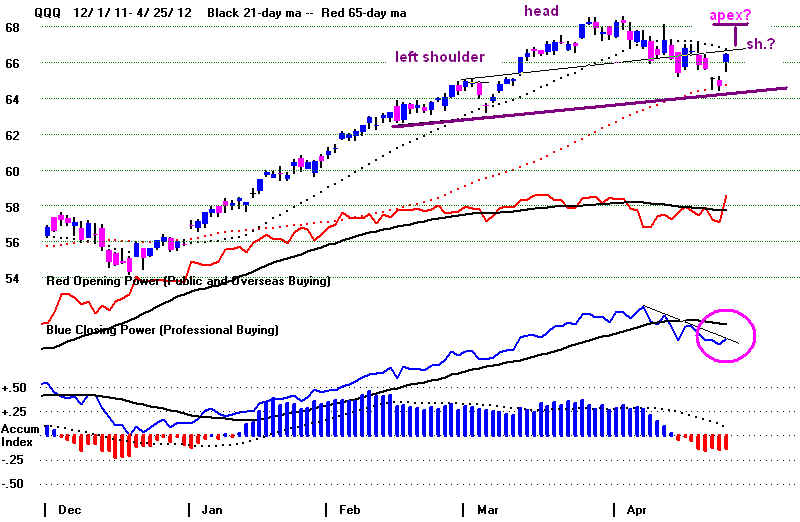
Sometimes it's sunny
and sometimes it rains....
Note: Thursday AM - RGEN opened down 3 points because of an FDA
delay,
At least, the Portfolio has suggested selling half positions when a stock is up 50%, like RGEN
was.
The best early
performers usually turn out to be the big winners if you buy based
on bulges of insider buying. RGEN was picked on March
2nd below 5.
Portfolio of 5 low priced high Accumulation
stocks picked on March 2
RGEN
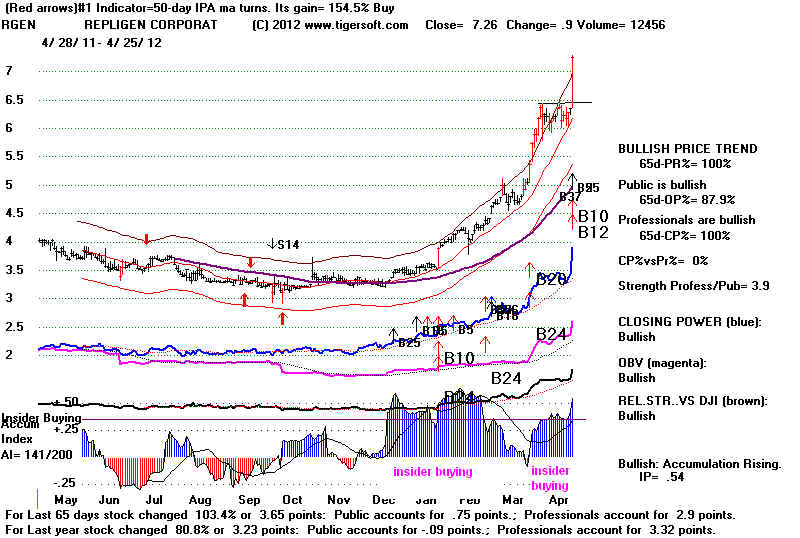
===============================================================================
OLDER HOTLINES
===============================================================================
4/24/2012 Hotline: Operating Signals: Reversing Buy B2
Reinforcing Buy B19
See also the potential for a Head and Shoulders S10
DJI's Neckline
support now is at 12660. I suggest placing a closing stop below 12650.
Key Values -
Peerless-DJIA -
DJI 13002
+74 la/ma = .997 21dmaROC= -.072 P= -105 P-Ch= -12 IP21=- .009 V=
-126 OP= -..037
Peerless remains a on a buy signal. It has to be bullish that
the head/shoulders
pattern is not producing a decline below
the support of the 65-day ma. The NYSE
A/D Line uptrendline is still intact.
The Closing Power downtrends are weakening
and could be broken by strength after the
opening tomorrow. That may difficult,
because a much higher opening seems
assured.
Tomorrow morning AAPL's
just released good earnings will boost the recently
weak NASDAQ up from its own 65-day ma
support. What happens after the opening
will show us whether professionals will
be using this strength to sell and distribute.
Because of the Peerless buy signal, we
should expect the H/S pattern not to be
completed. There are only 4 cases
since 1928 of a H/S pattern being decisively
completed while Peerless was on a Buy,
and one of those was in an on-going
bear market, something which does not
apply now and another saw less than
a 1.5% decline below the neckline (1945).
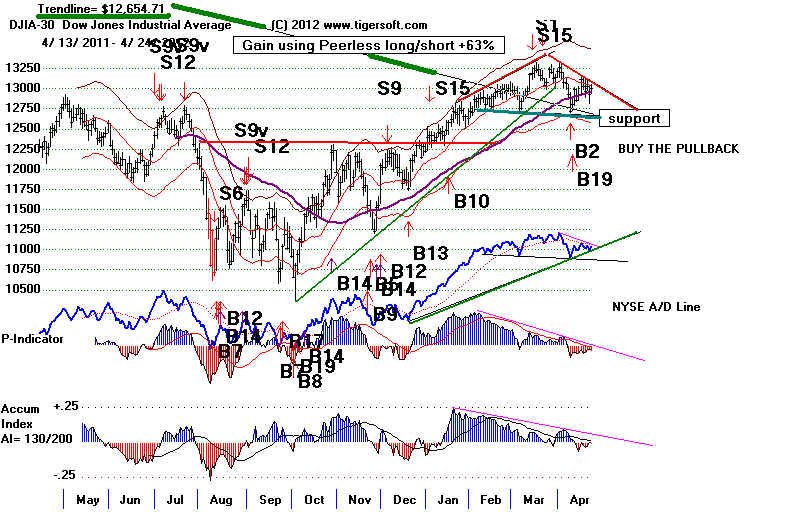
KEY CHARTS and INDUSTRY INDEXES
DIA SPY QQQ DJIA-Peerless
TigerDJI TigerSPY TigerQQQ GLD SLV Crude
Oil IWM-Russell-2000
SPY
SPY's Closing
Power Downtrend was slighlty Broken today. This is bullish
but the CP needs to continue to rise. Prices are
testing SPY's rising 65-dma.
Distribution still looks minor. But a bearish
head/shoulders pattern is still a
possibility here and its neckline's breaking would be
bearish.
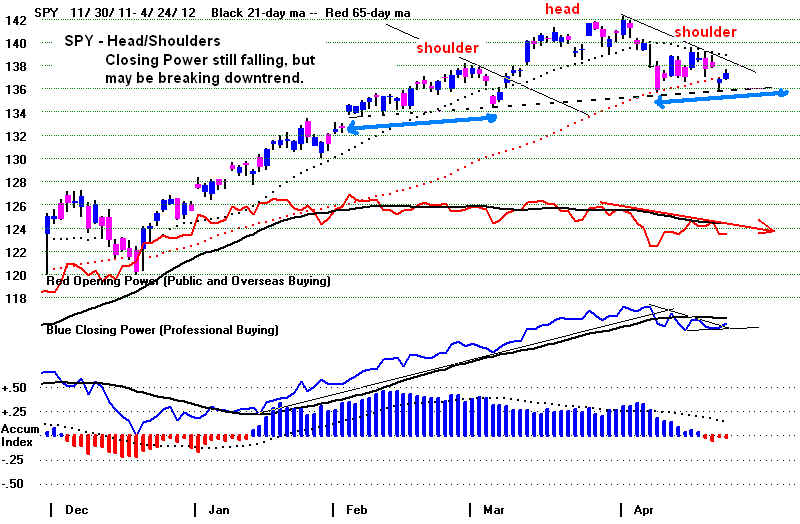
BREADTH STATISTICS: Advance= 823 Declines= 2226 UpVol = 117.82 DownVol= 656.04
Key Stocks: AAPL -1.28 and 4 highest priced DJI
stocks: IBM -.98 CAT, -.83 CVX -.08, MCD -.75 and XOM-.39
---> 151 MAXCP stocks Bullish
MAXCP Stocks Bullish plurality
--->
Portfolio of 5 low priced high Accumulation
stocks picked on March 2
Up +19% 1/2 position in MNTG sold with 50%
gain. These have been creeping
higher. I take that as a sign that they have further to run.
---> 81
MINCP stocks
Bearish
MINCP Stocks
MAXCP stocks are those showing
Tiger Closing Power making new highs.
This suggests heavy Professional Buying. Applying the Tiger Power Ranker's
"bullish" to the MAXCP stocks find those with heavy insider buying and
institutional accumulation. Bearish MINCP stocks show the opposite.
---> 33
new
highs on NASDAQ. 19 new lows on NASDAQ Bullish
plurality
---> 35
new
highs NYSE 10 new lows on NYSE Bullish plurality
=================================================================================
OLDER HOTLINES
=================================================================================
4/23/2012 Hotline Reversing Buy B2
Reinforcing Buy B19
See also recently revised Head and Shoulders S10
Peerless remains a on a buy signal and the Accumulion Index is only
slightly
negative. The odds are still
favorable despite today's sell-off that the support
at 12660-12700 will hold. It is
very rare for a head and shoulders pattern's neckline to be
decisively violated with Peerless on a
Buy. There are only four cases in more than
83 years: March 1945, 1977 in a bear
market, May 1999 and May 2010. A very
marginal penetration is more a
possibility. The
futures have the DJI at 12904 at this time.
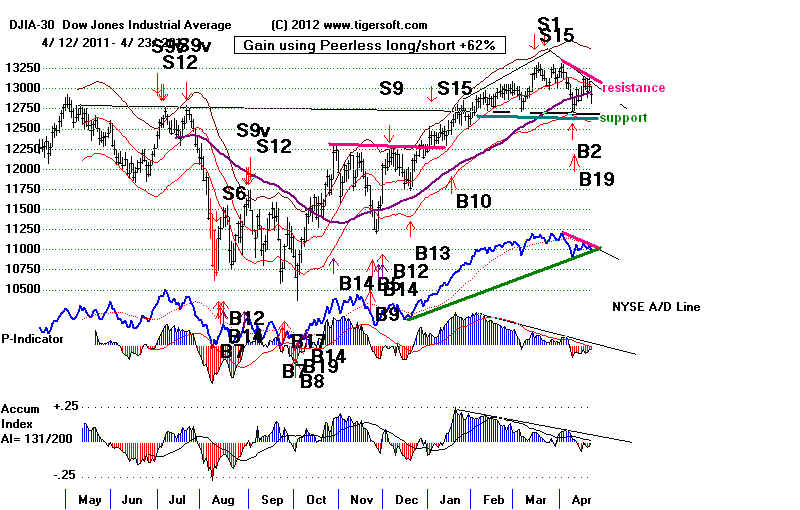
Watch NYSE A/D Line Uptrend.
A Violation Would Be Bearish, Possibly A Judged Sell
S6 for Aggressive Traders.
Let's See if the DJI can
move above 13200 and Destroy the Bearish H/S Pattern.
A Close below 12690 would be taken to be a Sell S10.
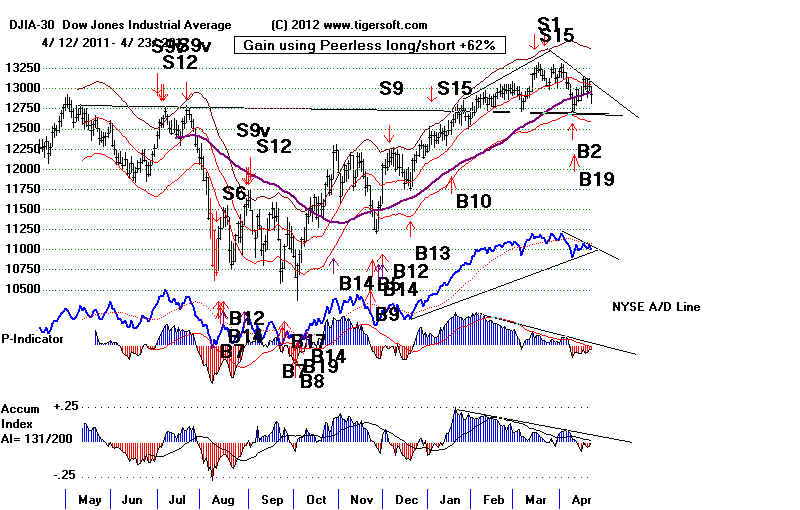
KEY CHARTS and INDUSTRY INDEXES
DIA SPY QQQ DJIA-Peerless
TigerDJI TigerSPY TigerQQQ GLD SLV Crude
Oil IWM-Russell-2000
QQQ
Falling Closing Power. Prices Are Testing Rising 65-dma.
Distribution still looks Minor.
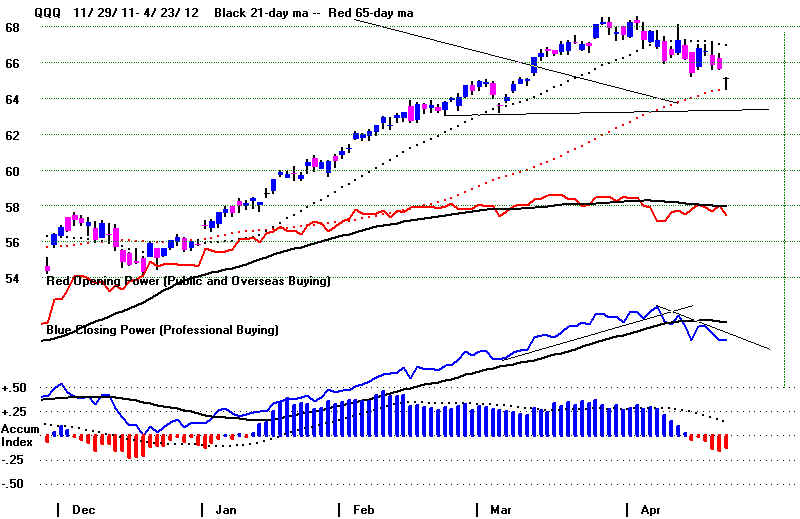
Key Values - Peerless-DJIA -
DJI 13029
+65 la/ma = .999 21dmaROC= -.087 P= -95 P-Ch= +46 IP21=- .026 V= -125 OP= -..038
BREADTH STATISTICS: Advance= 823 Declines= 2226 UpVol = 117.82 DownVol= 656.04
Key Stocks: AAPL -1.28 and 4 highest priced DJI
stocks: IBM -.98 CAT, -.83 CVX -.08, MCD -.75 and XOM-.39
---> 114 MAXCP stocks Bullish
MAXCP Stocks
--->
Portfolio of 5 low priced high Accumulation
stocks picked on March 2
Up +19% 1/2 position in MNTG sold with 50%
gain. These have been creeping
higher. I take that as a sign that they have further to run.
---> 125
MINCP stocks
Bearish
MINCP Stocks Bearish plurality
MAXCP stocks are those showing
Tiger Closing Power making new highs.
This suggests heavy Professional Buying. Applying the Tiger Power Ranker's
"bullish" to the MAXCP stocks find those with heavy insider buying and
institutional accumulation. Bearish MINCP stocks show the opposite.
---> 11
new
highs on NASDAQ. 38 new lows on NASDAQ Bearish
plurality
---> 13
new
highs NYSE 39 new lows on NYSE Bearish plurality
Tonight's Study:
HEAD AND SHOULDERS' PATTERNS' NECKLINES THAT ARE
COMPLETED
DESPITE PEERLESS BEING ON A MAJOR BUY.
There were only 4 in the 84 years since 1928.
=====================================================================================
OLDER HOTLINES
=====================================================================================
4/20/2012
Hotline Reversing Buy B2
Reinforcing Buy B19
See also recently revised Head and Shoulders S10
Hold Longs but watch NYSE A/D Line Uptrend.
A Violation Would Be Bearish, Possibly A Judged Sell
S6 for Aggressive Traders.
Let's See if the DJI can
move above 13200 and Destroy the Bearish H/S Pattern.
A Close below 12690 would be taken to be a Sell S10.
Futures are weak and
NASDAQ-100's Closing Power is Falling
Dummying in bad,
potential numbers ahead for next week, we see that a one day
drop to 12600 would
bring a Buy B2
and not a Sell S10 automatically. If that happens, the two contradictory signals
would cancel
themselves out. A two day drop to 12600 would bring an
automatic Sell S10 and no Buy.
A lot depends on
the internals, too. We just have to wait... Of course, 12700 may not even
be tested again.
If the stock market were about to fall sharply, I would think gold and silver
stocks would be
acting better. These mining stocks are weakest group I follow, other than
natural gas
producers. Such Gold/Silver stock weakness is more
likely to happen at the start of
a major bull
market. If interest rates were about to rise sharply, I would not expect to find the
best
REITs as the strongest group, as they are now.
( I suggest using a Closing Sell Stop at
12690. Sell Stop ideas posted on 4/19/2012's Hotline.)
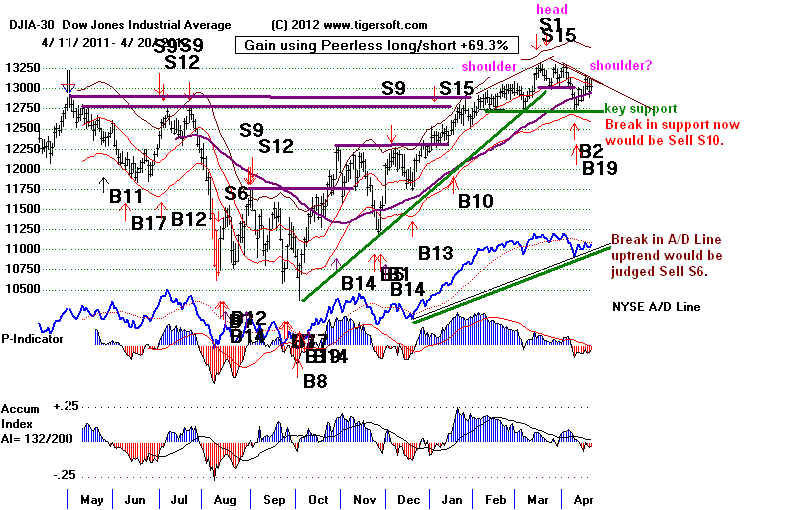
KEY CHARTS and INDUSTRY INDEXES
DIA SPY QQQ DJIA-Peerless
TigerDJI TigerSPY TigerQQQ GLD SLV Crude
Oil IWM-Russell-2000
QQQ
Falling Closing Power but Prices Are above Rising 65-dma.
Distribution still looks Minor.
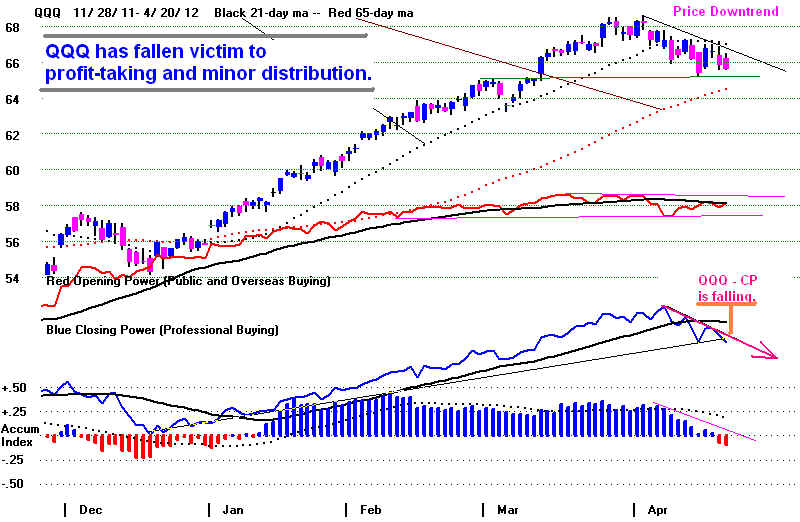
Key Values - Peerless-DJIA -
DJI 13029
+65 la/ma = .999 21dmaROC= -.087 P= -95 P-Ch= +46 IP21=- .026 V= -125 OP= -..038
BREADTH STATISTICS: Advance= 2002 Declines= 1059 UpVol = 551.65 DownVol= 406.07
Key Stocks: AAPL and 4 highest priced DJI
stocks: IBM, CAT, CVX, MCD and XOM
---> 106 MAXCP stocks Bullish
MAXCP Stocks
--->
Portfolio of 5 low priced high Accumulation
stocks picked on March 2
Up +21% 1/2 position in MNTG sold with 50%
gain. These have been creeping
higher. I take that as a sign that they have further to run.
---> 141
MINCP stocks
Bearish
MINCP Stocks Bearish plurality
MAXCP stocks are those showing
Tiger Closing Power making new highs.
This suggests heavy Professional Buying. Applying the Tiger Power Ranker's
"bullish" to the MAXCP stocks find those with heavy insider buying and
institutional accumulation. Bearish MINCP stocks show the opposite.
---> 26
new
highs on NASDAQ. 20 new lows on NASDAQ Bullish plurality.
---> 63
new
highs NYSE 21 new lows on NYSE Bullish plurality.
Hotline 4/20/2012 Reversing Buy B2
Reinforcing Buy B19
See also recently revised Head and Shoulders S10
Hold long positions.
Our Stocks' Hotline has a 2.5:1 ratio of longs to shorts.
Politics Will Likely Heavily Impact Stock Market Trends in 2012.
The stock
market, it is said, anticipates future earnings. Clearly, the 37 month advance is
predicting a recovery,
But a recovery in corporate profits, especially in a world where
companies are multinational
and global, does not mean Full Employment or, perhaps even
7% or 8% unemployment.
This is Obama's dilema. He has bet that a Wall Street recovery
would bring a Main Street
recovery and it has not happened, at least, not yet. Republicans
have a lot of public
discontent to seize upon. And though Obama can try to scare the poor and the
elderly about what Republican
budget cutting will do to social programs, it is far from clear
that he will motivate them
enough to vote in large numbers, as they did in 2008, since
he has accomplished very
little of what he promised them in 2008.
We and Wall Street must now
watch for signs about how the Presidential Election will play
out in November. Based
on my economic training , studies and experience, I believe a
Republican victory will mean
an Austerity Revolution and a steep stock market decline,
which will start before 2013.
Sadly for bulls, a Democratic victory will probably also bring
a steep stock market decline
in 2013 for even more reasons. A key element here is that
social discontent will likely
boil over. It is the dashing of hopes after expectations have been
raised that often brings the
strongest reaction. There is no draft as in the 1960s but economic
conditions are worse.
1/2 of all US colege graduates are not getting the jobs they expected.
A rude awakening for college graduates.
The first round
of the French Presidential Election is today. It will show whether European
conservatives pursuing
austerity measures amidst rising unemployment can stay in office.
http://www.time.com/time/world/article/0,8599,2112782,00.html
Discontent about austerity
has caused protests in many
European cities, but it remains to be seen if this causes a bigger
conservative backlash among
voters OR brings in a new more progressive government. Though
conservative Nicholas Sarkozy
lost by a thin margin to Socialist challenger Francois Hollande,
25.8% to 28.4%, Marine Le
Pen, an extreme conservative, came in third with about 20 percent.
There will be final round
between Sarkhozy and Hollande on May 6th. (Source
)
April 21, 2011 Tens
of thousands of Czechs protest budget cuts
March 29, 2012
Spanish
general strike protesters clash with police
April 20, 2011 Italian
museum burns artworks in protest at cuts
April 5, 2012 Greek
suicide sparks protests and clashes with police
Occupy Wall Street plans to start protesting again in
New York's Union Square on May 1,
May Day. Stocks
sometimes rise and try to thumb their nose at such protests. But if the
protests are too big and too
widespread, I would expect stocks to be weak.
One of the easiest to spot
Head and Shoulders patterns in history occured in mid-1946.
As now, the top in the DJI in
1946 WAS confirmed by the A/D Line. But in June-July of that year,
the NYSE A/D Line uptrend was
broken, the P-Indicator and Accumulation Index turned
negative and a right shoulder
formed. A completed head and shoulders pattern now could be
occurring for somewhat
similar reasons, though, of course, unions are much weaker now.
"1946 saw more labor strikes than in any year in American history. Corporate
profits
and Wall Street
felt threatened. Union membership doubled, from 7.2 million in 1940 to 14.5
million at the
end of World War II. There had been a no strike pledge during the war.
After the war,
pent-up grievances found expression in strikes. A wave of strikes spread
seeeminly
everywhere and from oil workers to railroad workers and coal miners. Then
in September
1946, longshoremen shut down most of the entire West coast and a general
strike was called
in Oakland in December 1946." ( http://tigersoft.com/PeerInst-2012/HS-SellS10/index.html
)
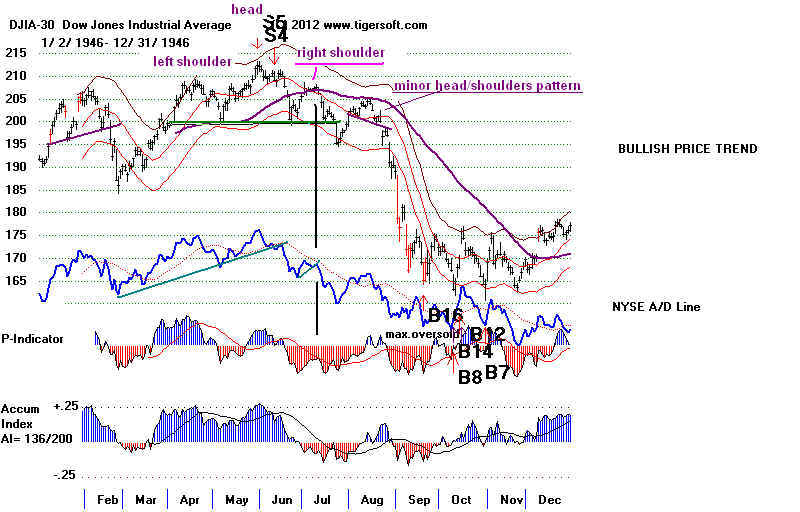
=====================================================================================
OLDER HOTLINES
=====================================================================================
4/19/2012
Hotline Reversing Buy B2
Reinforcing Buy B19
Hold Longs but watch NYSE A/D Line Uptrend.
A Violation Would Be
Bearish, Possibly A Judged Sell S6 for Aggressive Traders.
A Close below 12700 would be taken to be a Sell S10.
The
real reason the stock market has turned down, in my opinion, is because it foresees
another budgetary impasse ahead, like last Summer. Europe's economies are
worsening
and
it is not clear that the US will be able to escape being dragged under if it employs the
very
same
fiscal policies that are taking such a toll there. It's been 80 years since
the Great
Depression. Its economic lessons may have to be learned all over again if we are
not very careful.
It is
far from clear that Obama's version of "trickle down", wherein the rising stock
market
fosters an economic recovery, will work. What clearly will not work, is trying to
balance
the
budget singlemindedly when unemployment is high and mass consumer demand is weak.
This
danger may also bring a steep stock market decline. Sell S9s and Sell S12s usually
call
market tops, but Head/Shoulder patterns can, too. We must be careful now.
See
the historical potency of Head and Shoulders S10
It is rare that there is a head/shoulders
top
without a Peerless Sell first, but it has happened, most recently in April 2010.
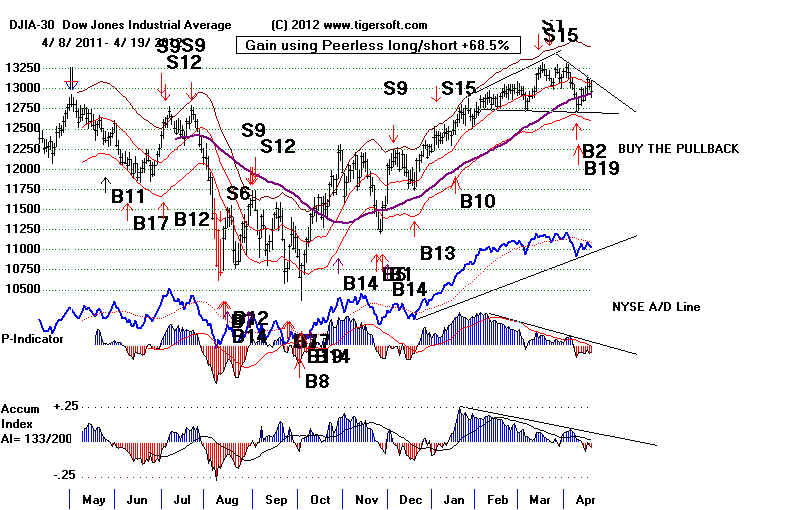
KEY CHARTS and INDUSTRY INDEXES
DIA SPY QQQ DJIA-Peerless
TigerDJI TigerSPY TigerQQQ GLD SLV Crude
Oil IWM-Russell-2000
QQQ
Negative Internals, Falling Closing Power but above rising 65-dma
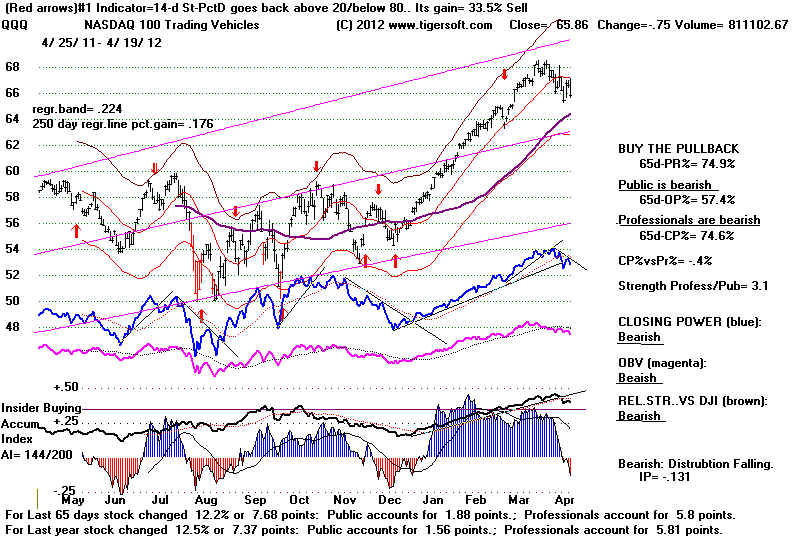
Key Values - Peerless-DJIA -
DJI 12964 -69 la/ma = .993 21dmaROC= -.188 P= -141 P-Ch= +24 IP21=- .036 V= -134 OP= -.135
BREADTH STATISTICS: Advance= 1247 Declines= 1767 UpVol = 280.12 DownVol= 528.03
Key Stocks: AAPL and 4 highest priced DJI
stocks: IBM, CAT, CVX, MCD and XOM
---> 99 MAXCP stocks Bullish
MAXCP Stocks .
--->
Portfolio of 5 low priced high Accumulation
stocks picked on March 2
Up +22% 1/2 position in MNTG sold with 50%
gain. These are creeping
higher. I take that as a sign that they have further to run.
---> 113
MINCP stocks
Bearish
MINCP Stocks Bearish plurality
MAXCP stocks are those showing
Tiger Closing Power making new highs.
This suggests heavy Professional Buying. Applying the Tiger Power Ranker's
"bullish" to the MAXCP stocks find those with heavy insider buying and
institutional accumulation. Bearish MINCP stocks show the opposite.
---> 27
new
highs on NASDAQ. 33 new lows on NASDAQ Bearish plurality.
---> 25
new
highs NYSE 26 new lows on NYSE Bearish plurality.
Hotline
4/19/2012 Reversing Buy B2
Reinforcing Buy B19
Why was the DJI so weak today? Some
of the most spotlighted heavy-hitters in the NASDAQ
and QQQ missed badly today. AAPL
(587) lost 21 and now shows a head/shoulders neckline at
574. GOOG (599) lost 8 and is
testing its head/shoulders neckline at 594. PCLN (717) lost 17
and will be seen as completing a
head/shoulders pattern if it closes below 696. Head and shoulders
patterns have often appeared at past AAPL
tops. APPLE's
Key Tops since 1987 - TigerSoft
We, therefore, again have to
be nervous that the DJI might complete its own top, an asymmetrical
head/shoulders. This I would take
to be a Sell S10, whether the signal appears automatically or not.
But these penetrations of the neckline
supports have not yet occurred. Seasonality is surprisingly
bullish for the next two weeks.
Since 1965, the DJI has risen 63% of the time over the next two
weeks and averaged a gain of .8% on the
DJI.
Hedging Against A Bigger Decline
Peerless has been very accurate for the
last year. But something unprecedented could
happen. Something that takes the
market by surprise. Head and shoulders patterns are a primary
way the stock market telegraphs us that
somethng bad that was not expected is about
occur. So, again, I warn that we
must heed a violation of the DJI's neckline at 12700 and Sell.
Normally, as soon as there is a new
reversing Peerless Buy signal I would suggest users look
at the history of past signals like the
one that reversed the earlier Sell. The current Buy B2
does show four big paper losses, 5% to
8%, for the earlier Buy B2s. The write-up there says we
should be ready for a bigger decline if
well-tested support is broken. Here that means 12700 is
the key level to watch. If that key
support is violated there will likely be a rapid Sell off.
So, one would have to be ready to act
quickly. Another problem is that Peerless requires
a close below 12700 to give us a Sell.
Often the DJI drops quite a bit on such a breakdown.
By the close, the DJI might be down to
12600. One could just sell out on a drop below 12690
and be ready to come right back in on the
long side if the DJI recovers back above 12700
at the close.
Another approach is to look at the
history of the other recent Peerless Buy. This is a Buy B19
"Since
1956 there has not been a single case in the 21 Buy B19s of even a 1% paper loss." If
the DJI were to fall 1% below 12805, the
level of the recent Buy B19, it would be doing something
for which there is no precedent in the
last 55 years. If that were to occur, we would be seeing something
dangerously different than the normal and
we should cut our losses. So, again, a violation of
12700 would be dangerous.
It is true that the Peerless internals on
the DJI and the Tiger internals on the QQQ are now negative.
So some precautions might be taken.
Hedging with some Bearish MINCP Stocks is what I have
suggested on the Tiger Stocks' Hotline.
Watching the A/D Line uptrend has also
been suggested. If the NYSE A/D Line breaks its uptrend,
the odds then favor the neckline of the
DJI at 12700 being violated. One could then go short the
weakest of the three major market ETFs.
That is QQQ for the time being. Very short-term traders,
in fact, could already have decided to go
short on QQQ because it shows a declining CLosing Power trend.
This is convenient, in that if the recent
CP downtrend is broken, one can quickly cover. Our exploded
QQQ chart shows that any close .11 by the
QQQ above its opening will break the downtrend.
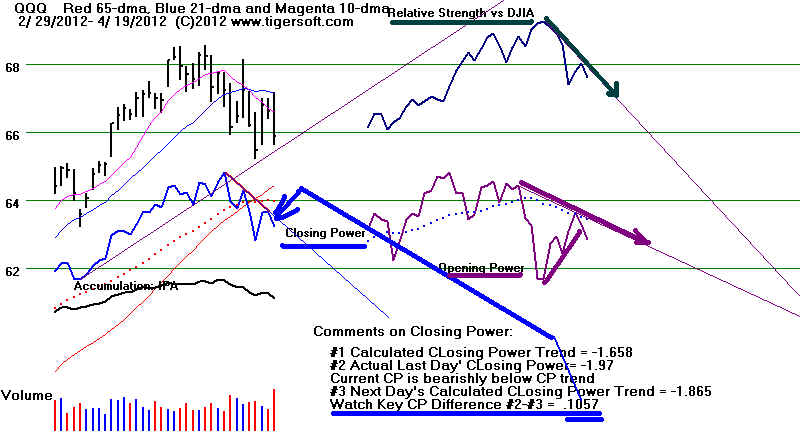
Watch also the SP-500. It shows its own head/shoulders.
A close below 136 would be a violation
of its key
neckline support. Itc CP is also in a downtrend. But its Accum. Index is too
positive
to be seen as
very bearish, just now.
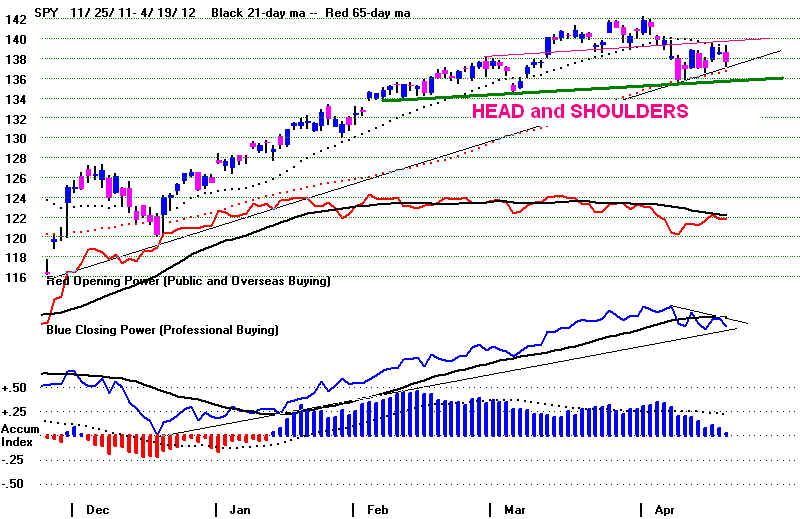
DEFLATION not INFLATION is THE BIGGER
RISK NOW
The rising Dollar chart for the last year does not support the notion that
inflation is a significant
problem now. The conservative
European governments have opted for RETRENCHMENT,
and they have gotten HIGH
UNEMPLOYMENT, RISING INTEREST RATES and
a FALLING EURO, the worst of all worlds. In a deflationary
environment, GOLD is not
a good hedge. Short Selling
would be a better approach, I think.
UNEMPLOYMENT IS RISING TO NEW HIGHS IN EUROPE
23.6% in Spain
21% in Greece
10% in France
9.3% in Italy
8.3% in UK
Of course, things could change.
But the DOLLAR has been rising at a +9.5%
annualized rate, using the slope of
its least squares line for the last year. Food for the
last year shows a falling least
squares line, as does SILVER, GAS,
the EURO and OIL STOCKS.
QQQ
is rising at a rate of +17.6%
DOLLAR has been rising at a +9.5%
GOLD
(GLD) is rising at a rate of +9.2%.
CRUDE
OIL (CL1600) is rising at a rate of +8.6%
DIA
is rising at a rate of +7.3%
QQQ is rising at a rate of +6.1%
EURO
is falling at a -11.7% rate.
GOLD
STOCKS are falling at a -15.8% rate.
FOOD COMMODITIES now show a -17.9% annualized slope for the
last year.
SILVER (SLV) is falling at a -23.7% rate
TIGER
INDEX of FOREIGN ETFS is falling at a -25.8% rate.
NATURAL GAS (UNG) is falling at a rate of -68.5%
=====================================================================================
OLDER HOTLINES
=====================================================================================
4/18/2012
Hotline Reversing Buy B2
Reinforcing Buy B19
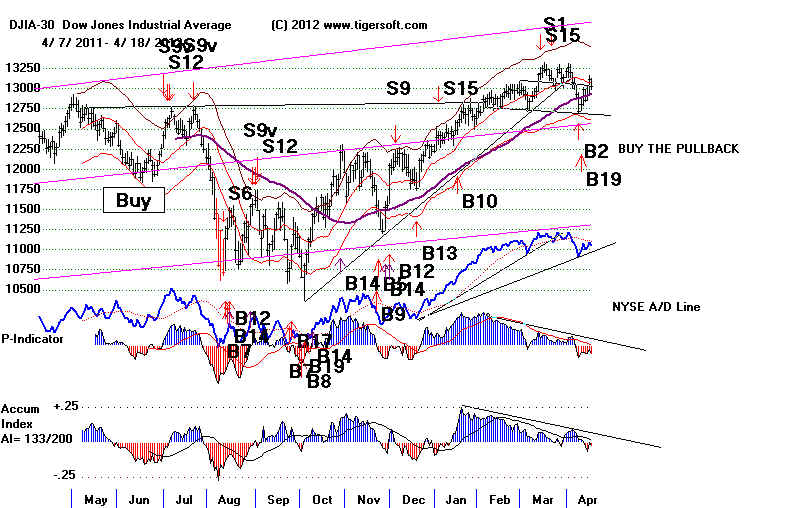
KEY CHARTS and INDUSTRY INDEXES
DIA SPY QQQ DJIA-Peerless
TigerDJI TigerSPY TigerQQQ GLD SLV Crude
Oil IWM-Russell-2000
Key Values - Peerless-DJIA -
DJI 13033 -83 la/ma = .998 21dmaROC= -.188 P= -165 P-Ch= -87 IP21=- .022 V= -132 OP= -.138
BREADTH STATISTICS: Advance= 1003 Declines= 2021 UpVol = 213.54 DownVol= 474.14
Key Stocks: AAPL and 4 highest priced DJI
stocks: IBM, CAT, CVX, MCD and XOM
---> 147 MAXCP stocks Bullish
MAXCP Stocks Bullish plurality.
--->
Portfolio of 5 low priced high Accumulation
stocks picked on March 2
Up +22% 1/2 position in MNTG sold with 50%
gain. These are creeping
higher. I take that as a sign that they have further to run.
---> 87 MINCP stocks Bearish MINCP Stocks
MAXCP stocks are those showing
Tiger Closing Power making new highs.
This suggests heavy Professional Buying. Applying the Tiger Power Ranker's
"bullish" to the MAXCP stocks find those with heavy insider buying and
institutional accumulation. Bearish MINCP stocks show the opposite.
---> 38
new
highs on NASDAQ. 33 new lows on NASDAQ Bullish plurality.
---> 30
new
highs NYSE 31 new lows on NYSE Bearish plurality.
Hotline 4/18/2012
Reversing
Buy B2 Reinforcing Buy B19
The DJI Should
keep rising because of the Peerless Buys that operate now and
the history of
DJI aborted head and shoulders patterns, but
1) the NASDAQ and QQQ are now lagging;
2) the QQQ's CP is declining;
3) the Peerless internals are now all negative.
4) the broader based SPY still has not destroyed its own head and shoulders pattern..
SPY and Still Extant H/S Pattern
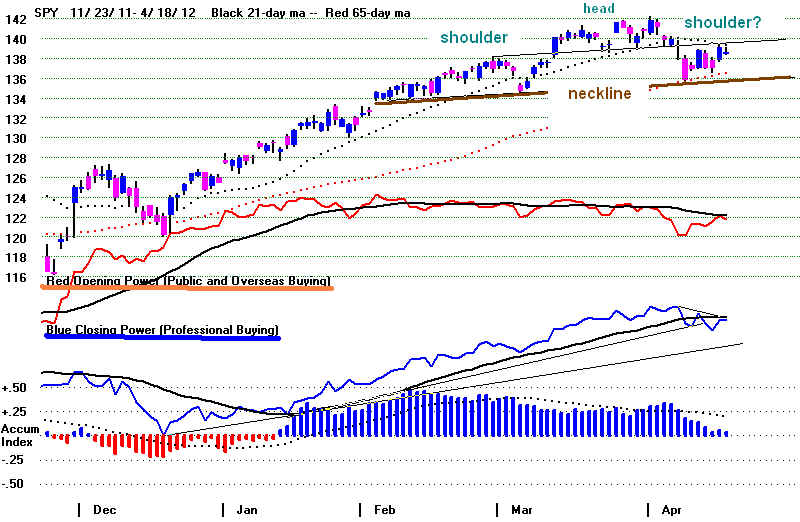
When a
DJI Head/Shoulder pattern has been destroyed with a rally and close
above the
apex of its right shoulder, it is much more common for the
DJI to keep
on rallying until Peerless gives a Sell Signal. Below are the
cases since
1928. In 9 cases the DJI rose. In 2 it fell back to the lower band.
My study
shows that for the advance to run substantially higher, the DJI will need
to NOT
produce any new Peerless Sells and also make a new 12-month high which
IS
confirmed by the A/D Line. We will be watching the A/D Line closely on this rally.
DJI Head/Shoulders Destroyed by Rally
and Close above the Apex of Right Shoulder
1. 8/9/1933 - right shoulder exceeded but DJI falls short term from 99.1 to 94.40
before rallying to peak at 105.70 and then selling off to test neckline, based on
hypothetical low at 85. There were no Peerless
Buys here. The final top occurs
with the DJI above the upper band and the A/D Line failing to confirm the recovery.
The DJI was not able to make a new high on this recovery,
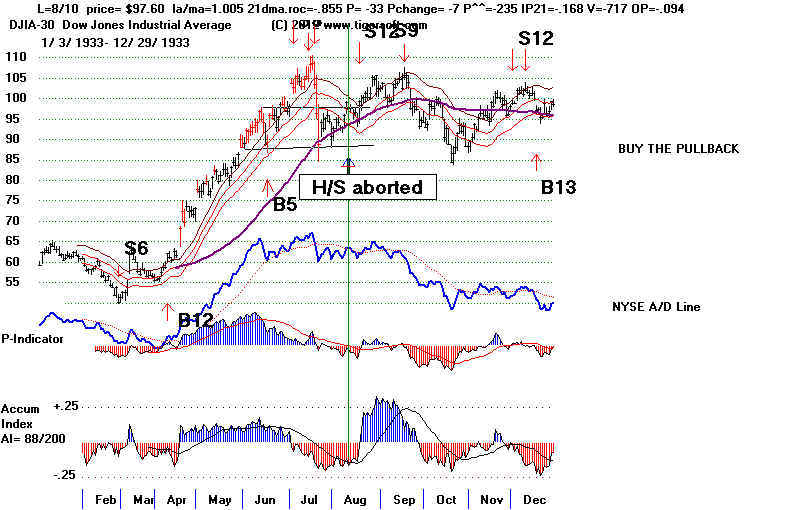
2. 1/15/34 - 103.20 -
right shoulder exceeded and DJI rose directly to 110.20 on 2/6
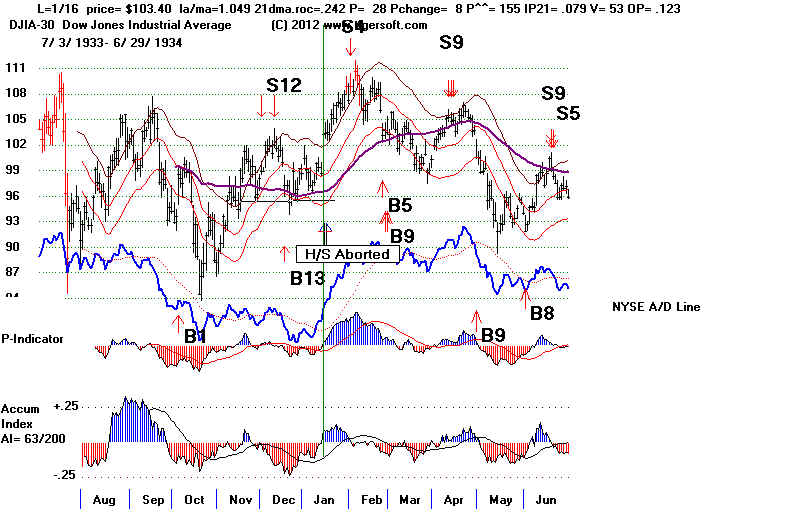
3. 2/8/36
- 146.20 right shoulder exceeded. DJI retested 21-dma at 144.10
and then
rose to 158.80 on 3/6/1936. Multiple Peerless Sells
blunt the subsequent rally. Note the
A/D Line NC as DJI reaches upper band a month later. This brings the reversal.
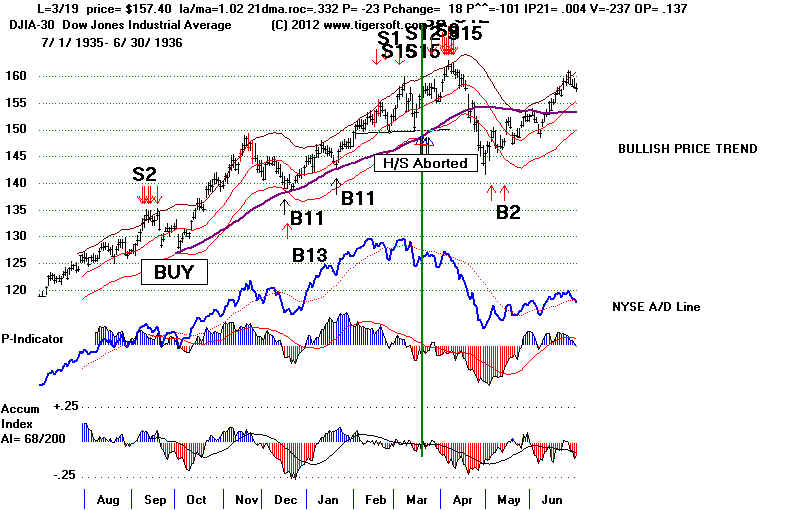
4. 5/21/45
- 166.00 5/21 right shoulder exceeded. Rally to 5/28/45 and Sell S5 at
168.2.
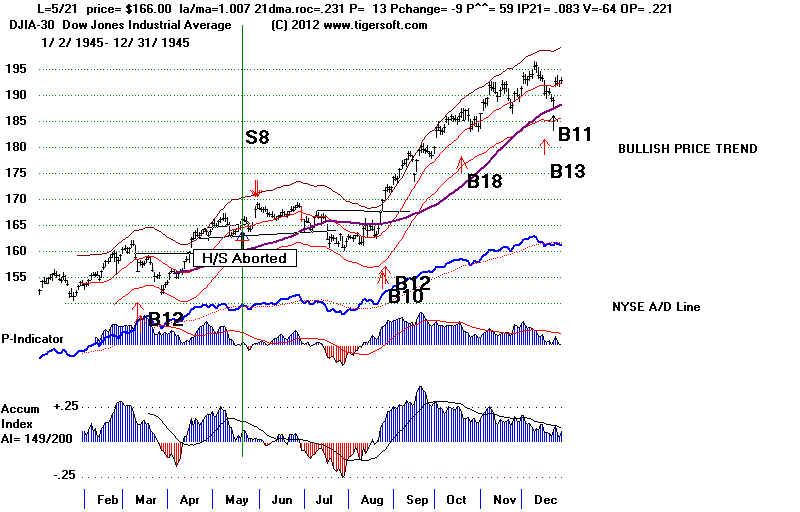
5. 7/25/51
- 258.10 DJI rose steadily to 276.40 on 9/13/1951
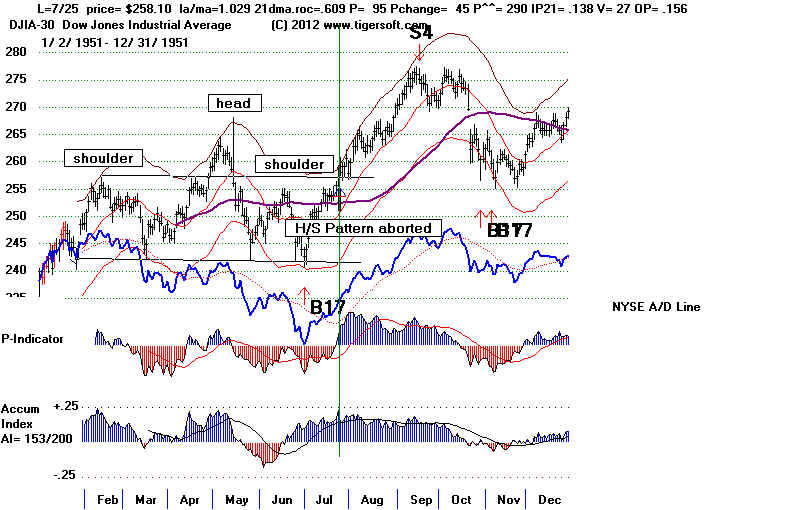
6. 1/31/55
1/26 408.80 DJI rose to 416.80 on 3/7 and then fell to 391.40 on 3/14
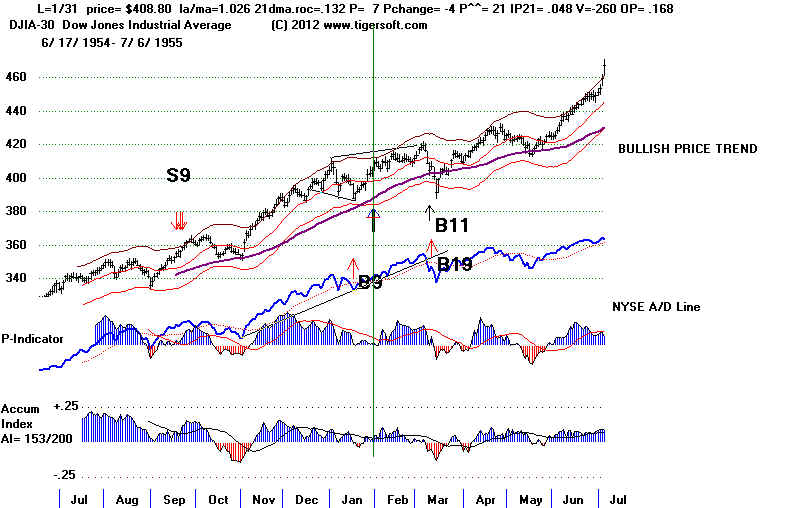
7 8/28/59
663.00 Fakeout. DJI immediately declined to 618.
on 9/21.
Without a Peerless Buy signal
operating, an aborted head/shoulders cannot be
considered a valid Buy.
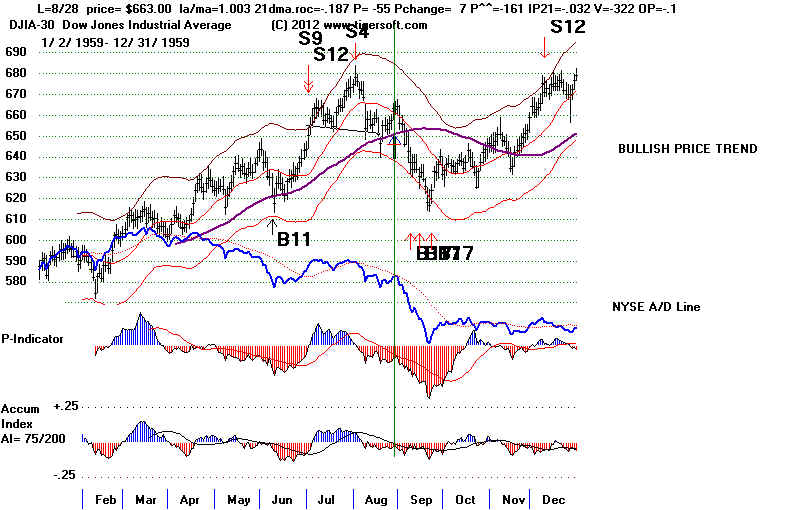
8 1/29/86 1558.94 DJI rose quickly afterwards and reached 1818.,61 on 3/31
before falling below 21-day ma
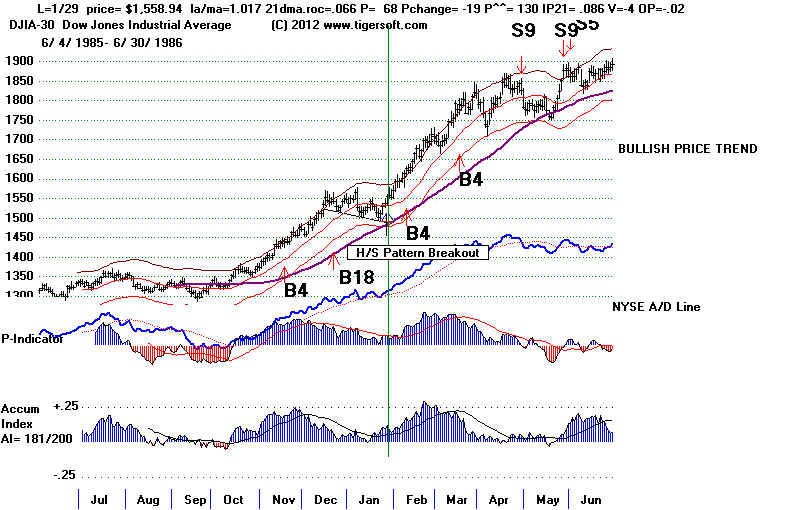
9. 4/17/91 30046.46 Fakeout. DJI immediately declined to LB a month
later.
But in this case, there was still overhead resistance from earlier 12-month
highs. Respect overhead resistance from an earlier 12-month
high even when
a H/S pattern is aborted.
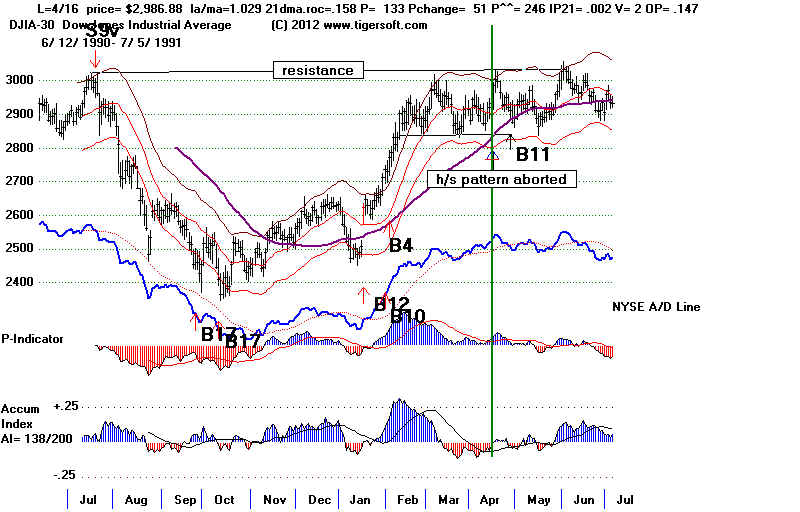
10. 7/16/09 8743.94 DJI rose steadily and advanced 10452.68 on 12/2
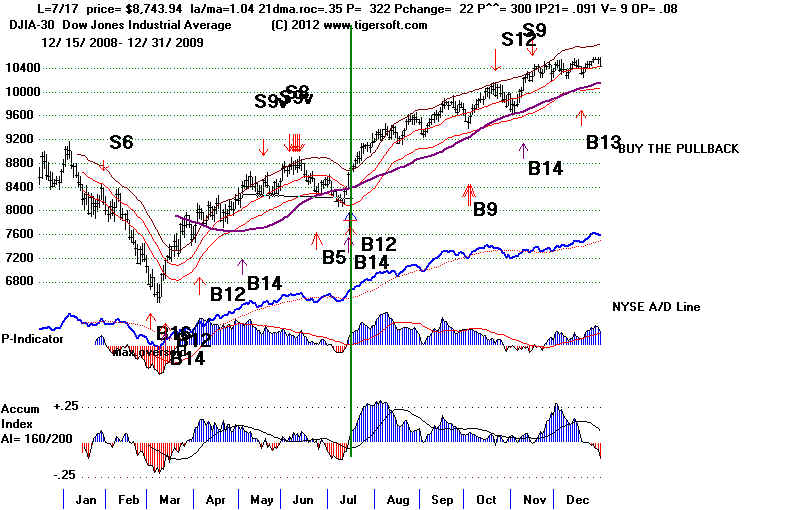
11. 12/2/10
11362.41 DJI rose steadily to 12391.25 on 2/18/2011 before falling below 21-day ma.
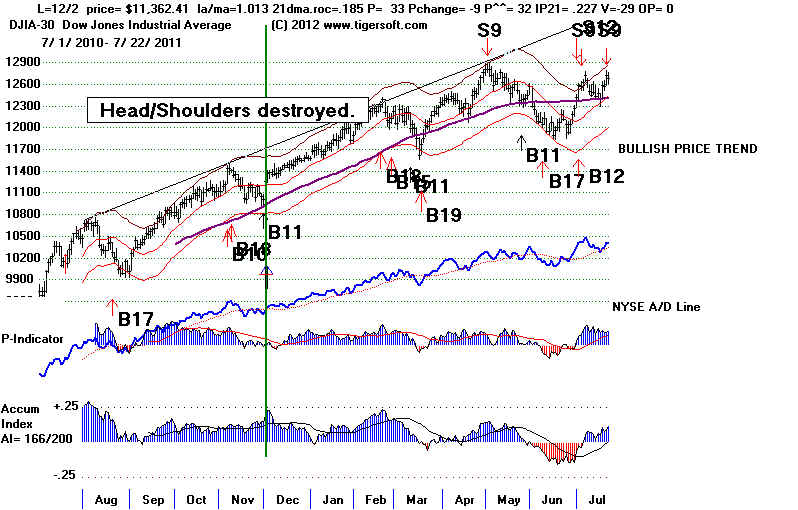 |
===================================================================================
OLDER HOTLINES
4/17/2012 Hotline Reversing Buy B2
Reinforcing Buy B19
The DJI's
Head/Shoulder Pattern has been destroyed by today's rally.
The DJI Should keep rising, but the NASDAQ and QQQ are now lagging.
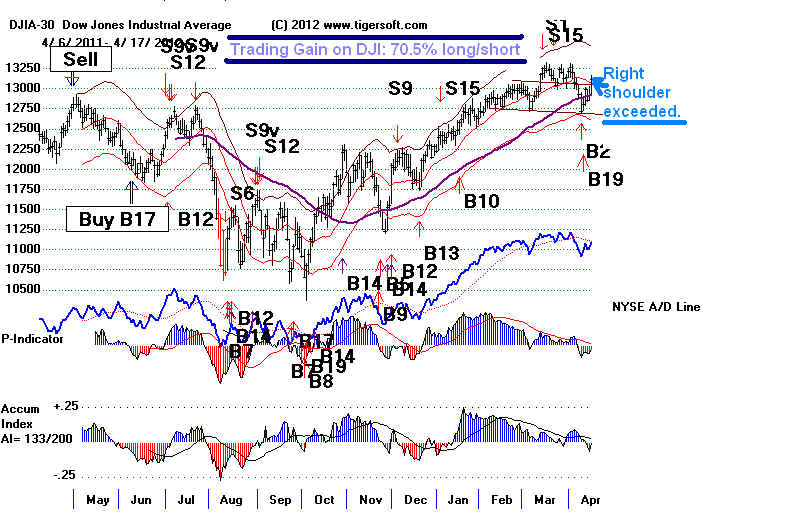
KEY CHARTS and INDUSTRY INDEXES
DIA SPY QQQ DJIA-Peerless
TigerDJI TigerSPY TigerQQQ GLD SLV Crude
Oil IWM-Russell-2000
Key Values - Peerless-DJIA -
DJI 13115 +194 la/ma = 1.003 21dmaROC= -.107 P= 91 P-Ch= -79 IP21=- .003 V= -117 OP= -.051
BREADTH STATISTICS: Advance= 2352 Declines= 698 UpVol = 623.01 DownVol= 81.43
Key Stocks: AAPL and 4 highest priced DJI
stocks: IBM, CAT, CVX, MCD and XOM
---> 137 MAXCP stocks Bullish
MAXCP Stocks Bullish plurality.
--->
Portfolio of 5 low priced high Accumulation
stocks picked on March 2
Up +22% 1/2 position in MNTG sold with 50%
gain. These are creeping
higher. I take that as a sign that they have further to run.
---> 85 MINCP stocks Bearish MINCP
Stocks
MAXCP stocks are those showing
Tiger Closing Power making new highs.
This suggests heavy Professional Buying. Applying the Tiger Power Ranker's
"bullish" to the MAXCP stocks find those with heavy insider buying and
institutional accumulation. Bearish MINCP stocks show the opposite.
---> 35
new
highs on NASDAQ. 13 new lows on NASDAQ Bullish plurality.
---> 46
new
highs NYSE 15 new lows on NYSE Bullish plurality.
Hotline
The DJI exploded past the 13000 right shoulder apex resistance. This forces
the bears to cover. The potential head/shulders pattern has thereby been been
bullishly destroyed. See how rising above the apex of the right shoulder
in December
2011 (chart below) brought an immediate advance which continiued for two more months.
Cases where the DJI quickly falls back below this "right shoulder apex" after it
is
exceeded are very rare. With individual stocks, the fact that a head and shoulders
pattern started to form often is a warning of a bigger, postponed decline. This is
not true with the DJI.
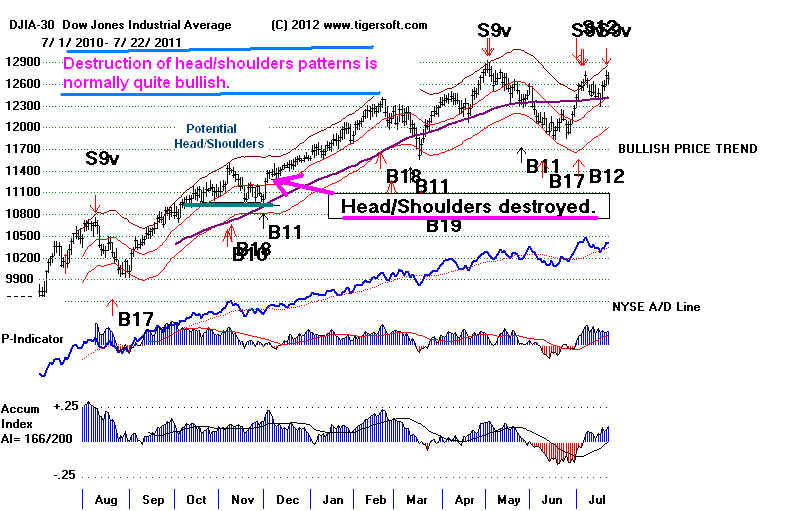
Despite today's rally,
the QQQ is below its 21-day ma. and its CP has not
yet broken its downtrendline. The
DJI or DIA is the place to be, it seems, now
rather than QQQ. No one DJI-30 stock accounted
for the big gain. 7 were up 2%,
including CVX and IBM among the highest priced DJI
stocks, that have a
disproportionate influence on the DJI.
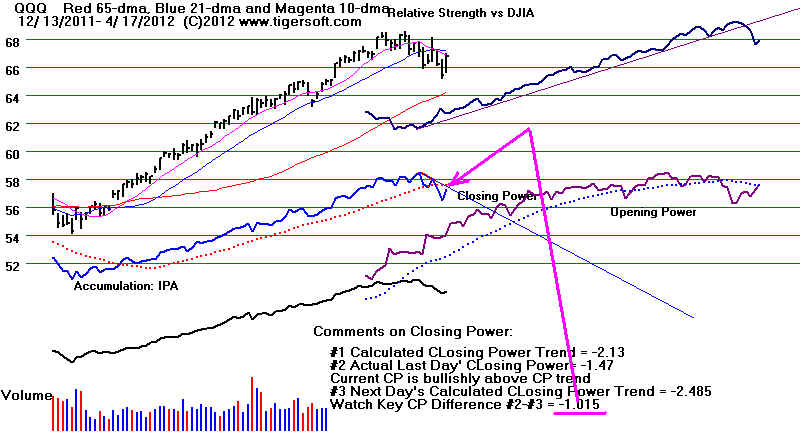
=====================================================================================
OLDER HOTLINES
4/16/2012 Hotline Reversing Buy B2
Reinforcing Buy B19
Watch to see if the DJI continues to form a bearish head/shulders pattern.
It is impressively bullish that the DJI rose even though AAPL fell so sharply.
Profit-taking clipped the wings of some of the NASDAQ's highest fliers. AAPL lost
25.1
but the DJI advanced 72. This bi-directional market can be compared with a misfiring
engine.
The rest of this hotline was inadvertently wiped out. It discussed the usual H/S
pattern
where the left shoulder and right shoulder tend to last the same amount of time. I
said that
a breakdown below 12700 would have to be treated as a Sell S10, but that a DJI surpassing
of 13000 would bullishly destroy this pattern.
I mentioned the fact that the French Elections are this Sunday and the incumbent
conservative is behind int he polls. A victory for the Socialist François
Hollande might
be constured as a threat to the financial markets, just as the Russian Revolution and
the victory of the Bolsheviks was between 1917 and 1921. But Wall Street economists
are pretty smart. They understand that Conservative financial policies of autarchy
and stringent budget cuts are causing unemployment AND borrowing costs to go up
in Spain, Italy, Greece and France. These economists understand that the US recovery
will be made much harder if Europe falls into a deepening recession/depression. The
24%
unemployment Spain is similar to levels in the US in the Depression.
UNEMPLOYMENT IS RISING TO NEW HIGHS IN EUROPE
23.6% in Spain
21% in Greece
10% in France
9.3% in Italy
8.3% in UK
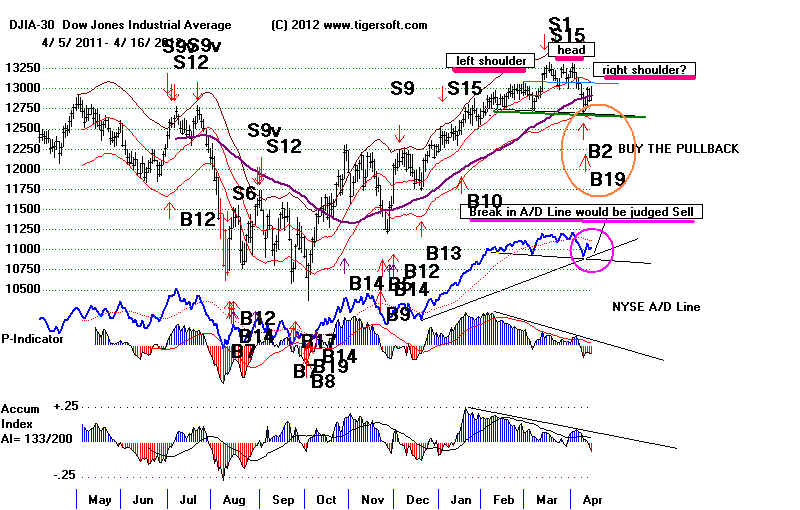
====================================================================================
OLDER HOTLINES
====================================================================================
4/13/2012 Hotline Reversing Buy B2
Reinforcing Buy B19
We remain on a BUY, but Peerless Head and shoulder pattern rules should be applied to
trading ETFs.
Many smaller NASDAQ stocks with bulges of high accumulation advanced
on Friday, although AAPL has
broken its steep uptrend-line. More profit-taking in AAPL will put pressure on tech
stocks, but not
necessarily other high-flyers like CMG, SBUX, MA V and HD, which were all up Friday. As I mentioned,
on Thurday, these have a high UP Pct and high AI/200 scores, both suggesting they are the
new
"nifty-fifty" that should stay strong until a general market top is undeniable.
Interest rates have fallen back into their holding pattern. This can be taken as a
bullish sign
for the market or it can be taken as a sign that the economy is still very weak and the
demand for
business loans is low. Good paying new manufacturing jobs remain scarce for the
existing American
workforce. Lack
of qualified skilled workers is now frequently given as the reason by many
businesses and tech recruiters. Lack of consumer buying power, because the suoer
rich have such a high percent
now of all wealth and income, is also a big factor, too. Whichever reason you like,
it's clear America
is falling behind other countries as technologies change. As a result, the Auto
and mortgage loan defaults rose
in March. Bank card defaults continued to decline, however.
What Could Cause A Big Decline?
The Fed seems to be too divided now to allow Barnanke to provide the type of
liquidity-pumping
and massive US Govt debt and bond buying it did from 2009 to 2011. At
least 3 Fed governors have
demanded more evidence the recovery failing before voting for addition bond buying.
What the
Fed does now is inevitably very political. The Fed will probably try to not become
part of the debates of
this Election Year. Doing nothing more does runs the risk of bring a 10%-15% stock
market decline,
to 12000 this year. But if interest rates are, in fact, to remain low until the end
of 2013, stock speculation
in select groups of stocks will remain much more attractive to investors than going for
the very low dividends
offered by bonds.
A war in the Middle East would bring a bigger decline. We will keep watching Crude Oil futures and
Gold to get clues here. Gold's weakness, being near
ithotmail.com
s 6 month lows, argues, I think, that war risks
there are dimminishing.
Looking ahead, will there be a new Wall street scandal to spook the markets? The
most likely candidate
is the widespread use of Swiss and overseas bank accounts by the wealthy to avoid paying
income taxes.
My guess, though, is that Obama will ultimately choose not to force the Swiss to reveal
the names of
Americans who are avoiding taxes. He needs their campaign contributions. But I
may be wrong. "The US IRS
estimates that these accounts allow Americans to avoid paying over $100 billion in taxes
each year." The
Swiss have shielded the names of 200,000 Americans with Swiss bank accounts. Among them
is Republican Presidential
Candidate Mitt Romney This may prove to be too appealing a target for Democrats.
Romney
will not be releasing his own tax disclosure until he files them in August.
KEY CHARTS and INDUSTRY INDEXES
DIA SPY QQQ DJIA-Peerless
TigerDJI TigerSPY TigerQQQ GLD SLV Crude
Oil IWM-Russell-2000
Key Values - Peerless-DJIA - 4/12/2012
DJI 12850 -137 la/ma = 0.981 21dmaROC= -.313 P= -162 P-Ch= -9 IP21=- .029 V= -120 OP= -.177
BREADTH STATISTICS: Advance= 2505 Declines= 551 UpVol = 677
DownVol= 64
Key Stocks: AAPL and 4 highest priced DJI
stocks: IBM, CAT, CVX, MCD and XOM
---> 110 MAXCP stocks Bullish MAXCP Stocks
Bullish plurality.
--->
Portfolio of 5 low priced high Accumulation
stocks picked on March 2
Up +20.5% vs DJI loss of f .4% 1/2 position in MNTG sold with 50% gain.
---> 71 MINCP stocks Bearish MINCP
Stocks
MAXCP stocks are those showing Tiger Closing Power
making new highs.
This suggests heavy Professional Buying. Applying the Tiger Power Ranker's
"bullish" to the MAXCP stocks find those with heavy insider buying and
institutional accumulation. Bearish MINCP stocks show the opposite.
---> 25
new
highs on NASDAQ. 19 new lows on NASDAQ Bullish plurality.
---> 18
new
highs NYSE 25new lows on NYSE Bearish plurality.
4/13/2012 - Hotline
Today's Sell-Off warns us to be prepared in case the head/shoulders pattern in DJI
develops further
and there is a break in the NYSE A/D Line uptrend. The DJI failed to surpass the
13000, the 21-day ma
and the point of recent breakdown. It may work itself sidewise and out of this
pattern. But head and
shoulders patterns are self-fulfilling if completed, so watch the A/D Line uptrend for a
violation to be safe.
The A/D trendline below is still bullishly intact. Usually there is
time symmetry in these patterns. This
suggests the DJI might go sidewise for the next few weeks without a decisive price
resolution of the
pattern.
left head
right
shoulder
shoulder?
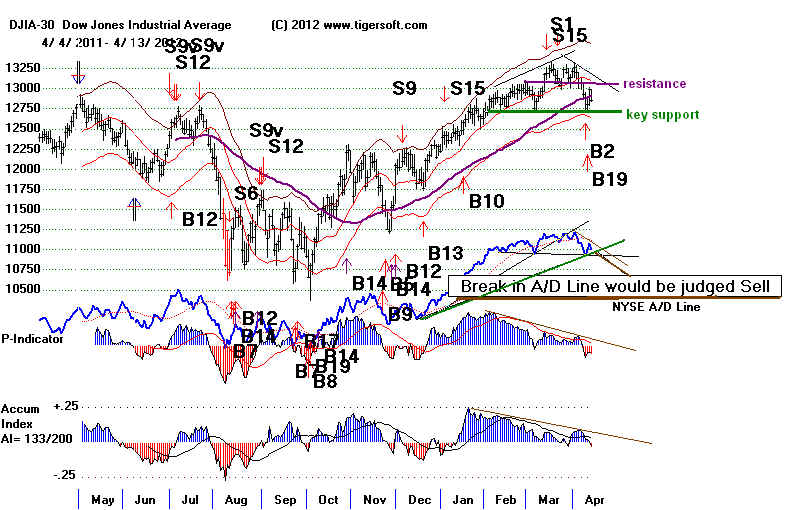
Traders, here is my take on trading the
head/shoulders pattern.
Watch the new A/D Line uptrend. If it is broken, consider the odds high that the
head/shoulders pattern will be completed with a DJI break of the neckline at 12700.
Such a neckline break
would be a Sell S5 or S10, read or automatic, and set up a target of 12200. The idea
of watching
the A/D Line uptrend came alive in a big way as the head/shoulders pattern developed of
April 2010. The completion of the pattern dropped the DJI especially sharply because
of
how much the market was dominated by technical and computer driven trading. I doubt
if the current market environment is any safer or less susceptible to a crazy wave of
computerized selling.
Computerized trading + Head/Shoulders = Flash Crash
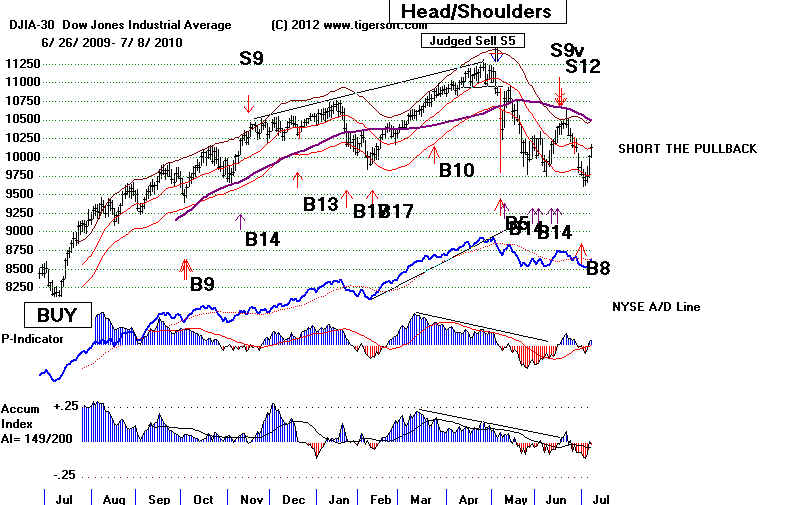 |
Look at the many earlier examples of how importantly bearish were head/shoulders
patterns.
See Head and Shoulders S10
IMPORTANT: To avoid the rush to sell that starts when the neckline support is
broken,
as traders we want to sell and go short if the NYSE A/D Line uptrend is violated when a
potential
left shoulder is in place that can be considered reasonably symetrical to the
head/shoulder
pattern's right shoulder.
=====================================================================================
OLDER HOTLINES
=====================================================================================
4/12/2012 Hotline Reversing Buy B2
Reinforcing Buy B19
...
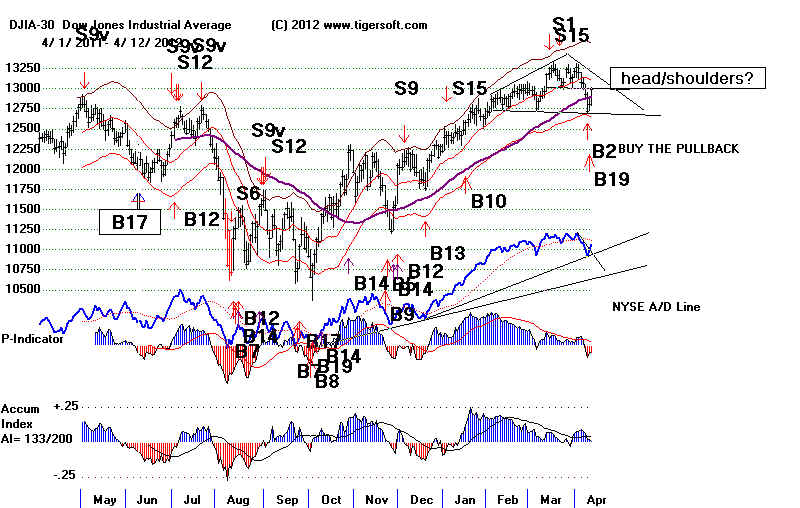
KEY CHARTS and INDUSTRY INDEXES
DIA SPY
QQQ DJIA-Peerless
TigerDJI TigerSPY TigerQQQ
GLD SLV Crude Oil IWM-Russell-2000
Key Values - Peerless-DJIA - 4/12/2012
DJI 12986 +181 la/ma = 0.991
21dmaROC= -.173 P= -154 P-Ch= 2 IP21= .006 V= -106 OP= -.079
BREADTH STATISTICS: Advance= 2505 Declines= 551 UpVol = 677 DownVol= 64
Key Stocks: AAPL and 4 highest
priced DJI stocks: IBM, CAT,
CVX, MCD and XOM
--->
134
MAXCP stocks Bullish MAXCP Stocks
Bullish
plurality.
--->
Portfolio of 5 low
priced high Accumulation stocks picked on March 2
Up +17% vs DJI gain of 0%
---> 49 MINCP stocks Bearish MINCP
Stocks
MAXCP stocks are those showing Tiger Closing Power
making new highs.
This suggests heavy Professional Buying. Applying the Tiger Power Ranker's
"bullish" to the MAXCP stocks find those with heavy insider buying and
institutional accumulation. Bearish MINCP stocks show the opposite.
---> 29
new
highs on NASDAQ. 14 new lows on NASDAQ Bullish
plurality.
---> 36
new
highs NYSE 3 new lows on NYSE
4/12/2012 - Hotline 13000 Is Resistance.
A brief retreat from 13000 should not come as a surprise. Watch Interest Rates tomorrow,
A DJI move much above 13000 will abort the potential for a
head/shoulders pattern.
Such an advance would force more short-covering. However, a
reversal back down
next week will give hope to the bears. The Peerless Buys give us
hope that the 13000
resistance will be overcome, perhaps after a faw days' pause. As
I mentioned last night,
paper losses with Buy B19s are rare. In addition, the
Accumulation Index
is positive. That reduces the odds for a head/shoulders pattern,
too. A few trading
days' hesitation followed by a move and close over 13050 would, I
think, be the most
bullish scenario. Traders will just have to watch events now.
We covered all
but one or two of our many short s on the Buy B2. We are long
some bulging
high Accumulation stocks from the Bullish MAXCP lists.
USING LEVERAGED ETFS
Traders certainly should have been trading the reversing Peerless Buy
and Sell
signals very profitably, especially some of the leveraged ETFs.
While the past year
has worked out about as well as we could reasonably hope, past years
have not
always had such small paper losses. So, be careful before quickly
starting to trading the
3x leveraged ETFs, like 3x Bullish Energy - ERX(+440%) or 3x Bullish Emerging Markets
or 3x leveraged Latin America, LBJ (+313%), etc, look at the
internals and price patterns.
It's a full evenings' work most nights just predicting the DJI for me.
So, you'll have to do a little
work on your own to pick the right ETFs for your needs. They do
all seem move
together with Peerless. So, you have a big advantage compared to
most traders.
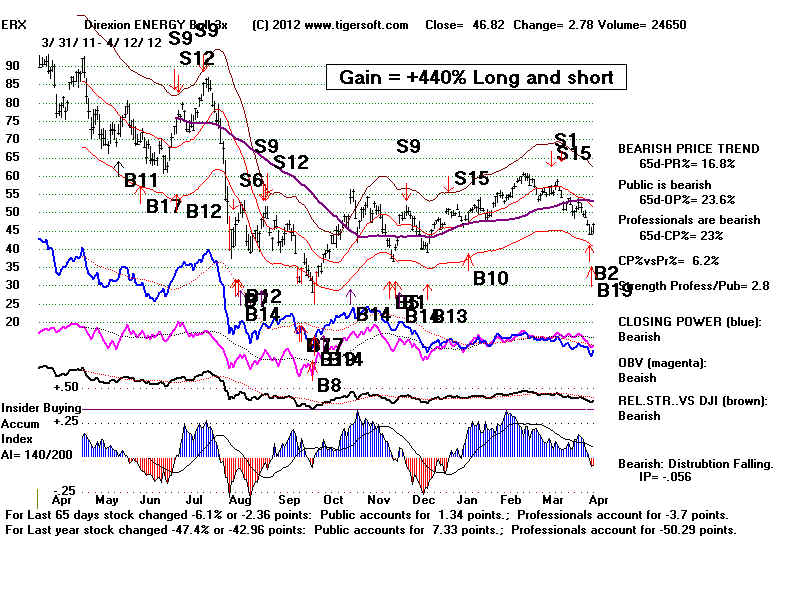 |
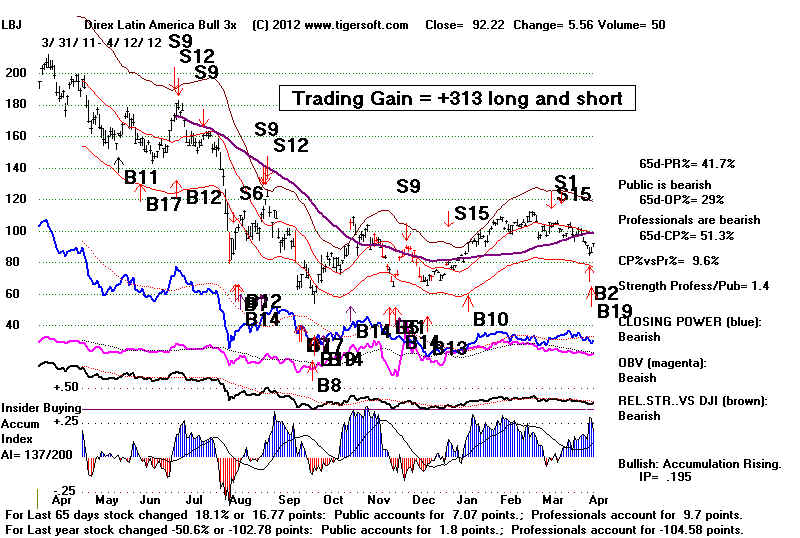 |
See a Blog I am starting to write about why so many self-proclaimed
pundits still spread
the myth that Wall Street cannot be predicted. Certainly, making Main Street folks feel powerless
vis-a-vis Wall Street works to maintain the imblance of power, profits
and priviledges in America,
See http://tigersoft.com/ETFS/
Some of you probably have ideas
about this. I would
enjoying hearing them.
See a good list of leveraged ETFs. http://etf.stock-encyclopedia.com/category/leveraged-etfs.html
The data
for them is in our Tiger Directories SECTORS and SHORTETF
FAS - Direxion Financial Bull 3X -
Triple-Leveraged ETF (FAZ)
Up nicely from rising 65-day ma with high Accumulation and
rising Closing Power trendline.
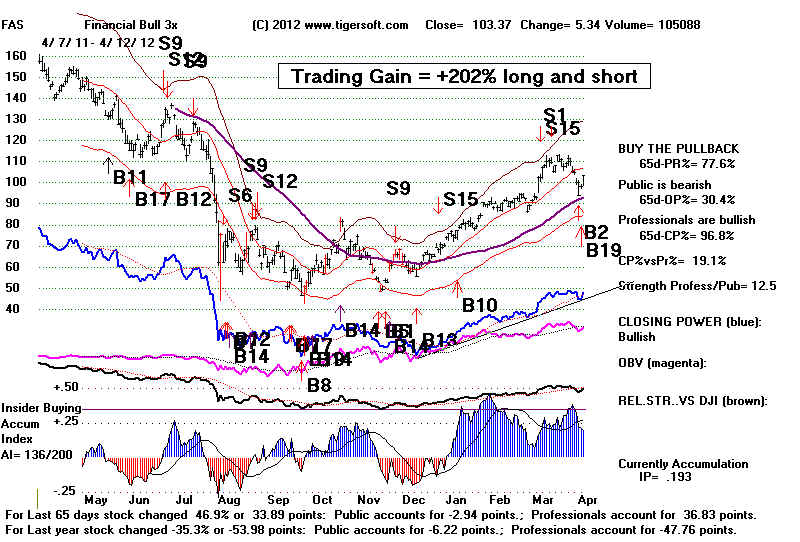
TNA - Direxion Small Cap Bull 3X -
Triple-Leveraged ETF (TNA
Below 65-dma.
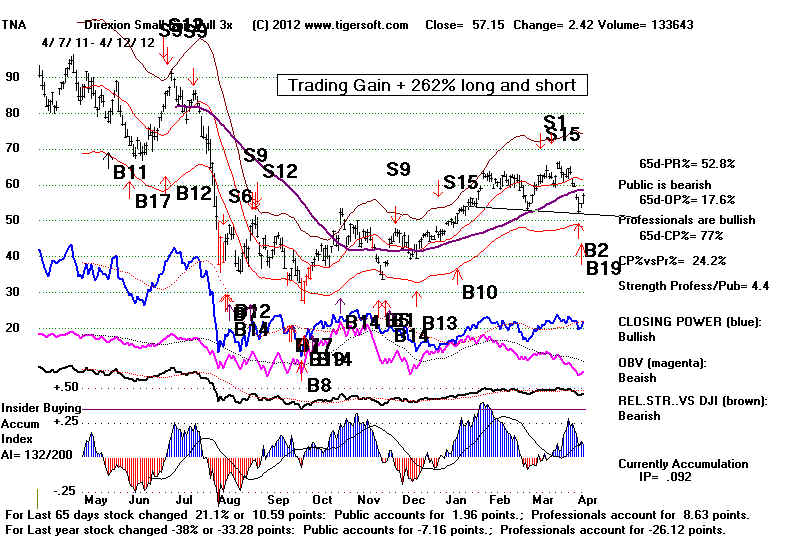
BGU - Direxion Large Cap Bull 3X -
Triple-Leveraged ETF (BGU)
Up nicely from rising 65-day ma with high Accumulation and
rising Closing Power trendline. 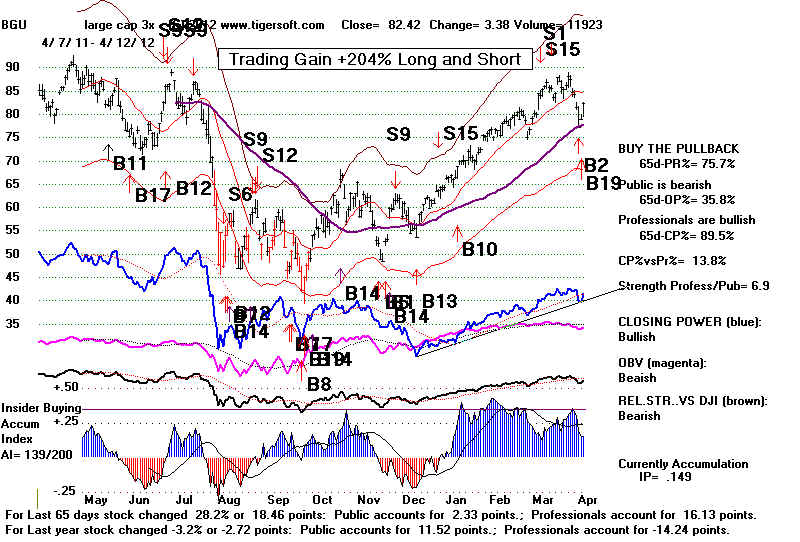
Another Programming Project
I recognize that it would be
helpful to let Tiger users examine a ranking of the Peerless
performance for the last year
for all the stocks in a directory. I will be working on this.
=====================================================================================
OLDER HOTLINES
=====================================================================================
4/11/2012 Hotline
Reinforcing Buy B19
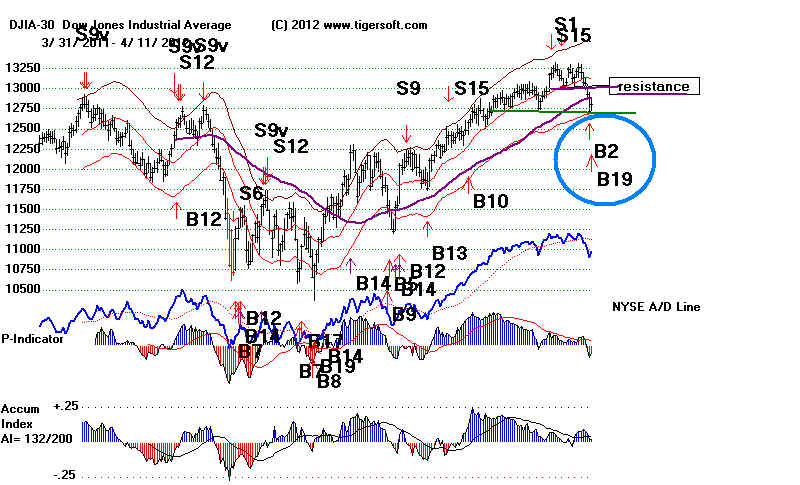
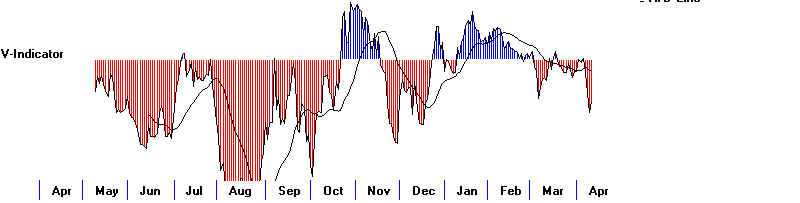
KEY CHARTS and INDUSTRY INDEXES
DIA SPY
QQQ DJIA-Peerless
TigerDJI TigerSPY TigerQQQ
GLD SLV Crude Oil IWM-Russell-2000
Key Values - Peerless-DJIA - 4/11/2012
DJI 12805 +89 la/ma = 0.976
21dmaROC= -.140 P= -253 P-Ch= 96 IP21= .02 V= -100 OP= -.073
BREADTH STATISTICS: Advance= 2433 Declines= 645 UpVol = 631.96 DownVol= 152.89
Key Stocks: AAPL and 4 highest
priced DJI stocks: IBM, CAT,
CVX, MCD and XOM
--->
42
MAXCP stocks Bullish MAXCP Stocks
--->
Portfolio of 5 low
priced high Accumulation stocks picked on March 2
Up +15% vs DJI decline of 1%
---> 149 MINCP stocks Bearish MINCP
Stocks Bearish plurality.
MAXCP stocks are those showing Tiger Closing Power
making new highs.
This suggests heavy Professional Buying. Applying the Tiger Power Ranker's
"bullish" to the MAXCP stocks find those with heavy insider buying and
institutional accumulation. Bearish MINCP stocks show the opposite.
---> 20
new
highs on NASDAQ. 17 new lows on NASDAQ Bullish
plurality.
---> 17
new
highs NYSE 14 new lows on NYSE
4/11/2012 - Hotline ---- Reinforcing Buy B19
Resistance must be expected
at 13000 because for a
potential head/shoulders with that level as the apex of a right shoulder.
Some longer term
investing tactics including Tiger Up Pct.
If the DJI can get up
past 13000, break the resistance there and destroy the potential
for a head/shoulders
with a right shoulder apex at 13000, the B19 suggests a rally of
about 5% more on the
DJI. That the DJI did not recover today one half of what it lost on
Tuesday was always
associated with gains of less than 6%. Were it not for this a gain
of 5.5% to 6.4% might
be expected because the B19 occurred in April and in a Presidential
Election year.
"This is a very helpful signal, in that since 1956 there has not been a
single case in the
21 Buy B19s of even a 1% paper loss. We should note that some of the most recent Buy
B19s
have not been very profitable. It may be that computerized trading has reached a
point where
this signal simply shows their short-term trading activities and intentions.
April B19s
Gain
Date
Market Environment Head/Shoulders? Paper Loss
---------------------------------------------------------------------------------------------------------------------
+ .088
4/21/1947
below 200 day ma
4%
+ .047
4/11/1967
Rising Market
+ .026
4/15/1987
Rising Market
+ .03
4/5/1994
below 200 day ma
+.133
4/21/2005 Rising Market
----------------------------------------------------------------------------------------------------------------------------------------------
Avg.= 6.4%
No = 5
Presidential Election Year B8s:
N= 8 Avg.Gain = 5.5%
LONGER TERM INVESTING LATE IN A BULL MARKET
The current
bull market is 37 months old. Long term investing is probably risky.
But
there is a pattern to take advantage as a bull market ages. This is the tendency
of
big institutions to park more and more of their money in the best performing
high
priced stocks. This can create a "nifty-fiftys" group of stocks which
quickly
recover minor pull-backs in the market and stay strong right until the end of the
bull
market. We have found a good way to find such stocks is to use two creations
of
TigerSoft: the first being the Pct of Days a stock is up, day to day, over the last year
and
the
AI/200 score (the count of days over the last 200 that a stock's Accumulation Index is
positive). Requiring an AI/200 score of 144 and a Pct of Days Up above 55% gives
a
good working list. Try to buy these stocks on retreats to their rising 21-day ma
but
watch out for signs of a top, like head/shoulders, false breakous. serious
non-confirmations
of
new highs and breaks in long well-tested uptrends. The Closing Power should not be
falling. Tiger users can get these results running the Analysis and then from the
Tiger
screen, by clicking Ranking Results + Tiger Up% Ranking + OK
SP-500 and High Priced Stocks with Pct Days Up% and AI/200>144
Other very high Up% Stocks marked with **
Up% AI/200 CLOSE/21-DMA
OpenPwr ClosingPower Last
---------------------------------------------------------------------------------------------------------------------
SPG
59.0% 154
1.00
Down Up
143.36
TNH 59.0%
137
1.10
Up Up
260.48
SBUX 58.8% 147
1.07
Up Up
59.29
CMG 58.6%
157
1.01
Down Up
422.66
**ASPS 57.1% 157
.92
Up Down
57.29
TJX 57.0% 150
1.01
Down Up
39.58
**CIG 56.9% 176
1.06
Up Up
25.42
MCD 56.9% 126
1.01
Down Up
98.56
**PCYC 56.4% 161
.97
Up >
26.55
ARG
56.2% 167
1.01
Down Up
87.84
**PSA
56.0% 169
1.00
Down UJp
136.86
**ACC
55.9% 145
.99
Down Up
43.93
DNB
55.8% 153
.98
Down Down
82.64
**PSMT 55.6% 167
1.05
Down Up
75.23
**BBH 55.5% 158
.99
Up Down
43.02
AAPL
55.1% 127
1.03
Up Up
626.11
HCN 55.0% 158
.98
Down Down
53.07
-------------------------------------------------------------------------------------------------------------------
IBM
54.7%
141
.98
Down
?
202.58
HD
53.2% 154
1.00
Down Up
49.75
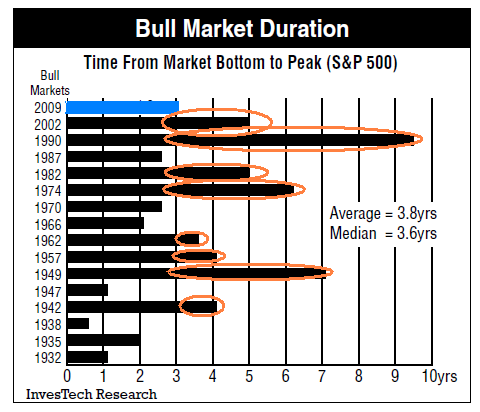
Work in progress.
====================================================================================
OLDER HOTLINES
====================================================================================
4/10/2012 Hotline
Reversing
Buy B2
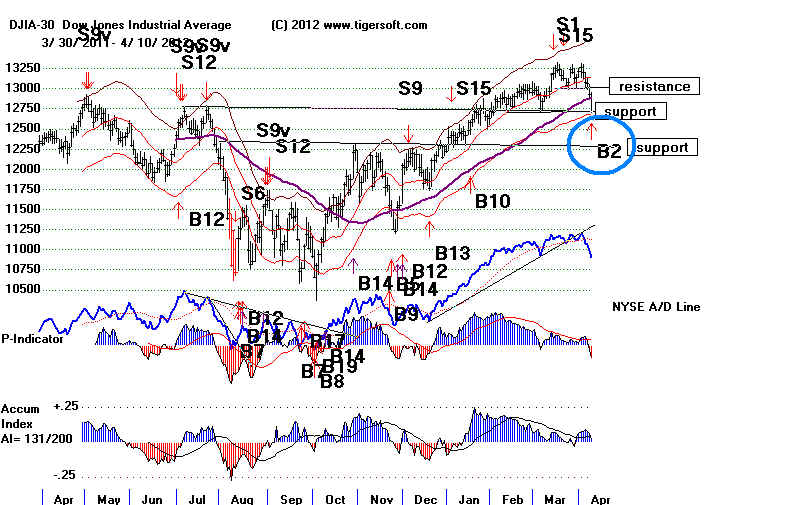
KEY CHARTS and INDUSTRY INDEXES
DIA SPY
QQQ DJIA-Peerless
TigerDJI TigerSPY TigerQQQ
GLD SLV Crude Oil IWM-Russell-2000
Key Values - Peerless-DJIA - 4/10/2012
DJI 12716 -214 la/ma = 0.969
21dmaROC= -.187 P= -253 P-Ch= -160 IP21= .025 V= -126 OP= -.078
BREADTH STATISTICS: Advance= 462 Declines= 2612 UpVol =62.49 DownVol= 898.21
Key Stocks: AAPL and 4 highest
priced DJI stocks: IBM, CAT,
CVX, MCD and XOM
--->
41
MAXCP stocks Bullish MAXCP Stocks
Bearish plurality.
--->
Portfolio of 5 low
priced high Accumulation stocks picked on March 2
Up +14.9% vs DJI decline of 2.0%
--->
157 MINCP stocks
Bearish MINCP Stocks
MAXCP stocks are those showing Tiger Closing Power
making new highs.
This suggests heavy Professional Buying. Applying the Tiger Power Ranker's
"bullish" to the MAXCP stocks find those with heavy insider buying and
institutional accumulation. Bearish MINCP stocks show the opposite.
---> 9
new
highs on NASDAQ. 60 new lows on NASDAQ Bearsh
plurality.
---> 12
new
highs NYSE 51 new lows on NYSE
4/10/2012 - Hotline ---- Reversing Buy B2
The DJI's 213 point decline took it down to the lower band and the level of
the penetrated
highs of last Summer that should act as some support now. The decline
has brought
a reversing Peerless Buy B2. Buy B2s occur when the DJI falls to the
lower band
in a Presidential Election year. The signal takes advantage of
the fact that DJI declines
of more than 10% in a Presidential Election year are rare. This was a
reversing Buy B2.
Reversing Buy B2s averaged 8.6% gains. There are no previous April
reversing Buy B2s.
5 previous April Buy B2s averaged gains of 9.4%. These statistics
bode well for a
recovery, although there is now resistance immediately ahead at 13000 and if
the
DJI were to stall out there on a recovery, it would appear to be forming a
bearish head
and shoulders pattern.
The size of the decline today might seem to warrant hesitation. But
declines of 1% to 2%
on the day of the earlier April Buy B2s did not prevent good recoveries.
The very biggest
paper losses for Buy B2s usually occur in the last half of the year.
That the Accumulation
Index is still positive (+.025) might be seen as a bullish sign. But
those past cases
where the IP21 (current AI) was +.01 to +.042 produces rather disappointing
rallies
and in each of 4 cases showed paper losses of 2% to 5%.
Bulges of Accumulation Do Require Patience
A word about patience. If you choose to buy some of the low priced very high
Accumulation
stocks, you must show patience. We believe these are stocks that insiders are
buying.
The insiders are not trying to make a quick trade. Today, one of our picks,
XRIT, was suddenly
bought out and the stocks jumped 39%. Danaher Corp: Acquisition Of X-Rite at $5.55
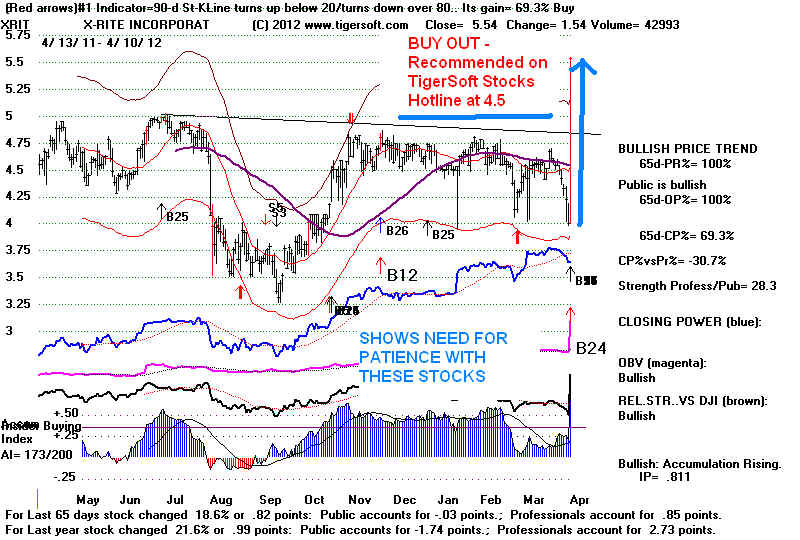
What To Do?
Should we buy DIA? Peerless has recently worked very well doing this.
"Nibble" is my
judgement. Save a little for an addition 2% to 4% decline and a test of the
support at 12300.
CLose out most of the excellent Bearish MINCP short positions. Buy some of
the Bullish
MAXCP stocks tonight. The Bearish MINCP
Stocks have generally declined much more
steeply than the DJI this last month, even allowing for the extra slippage
involved in trading
them. Don't be greedy. Definitely cover them if their Closing Power
downtrendlines are
broken.
10/31/1956
479.90
Gain = +2.7% Paper loss of 3%
LA/MA
MA-ROC P-I
PI-Ch IP21
V-I Opct
.99 .111
-12 -67
.029 -123 -.097
====
DJI fell from 479.90 to a low of 463 on 11/29/1956.
It then rallied to Sell S12 at 492.7 on 12/6/56.
This was not a reversing Buy.
-------------------------------------------------------------------------------------------------------------------------------------
7/22/1988
2066.99
Gain = - 0.1% Paper loss = 4%
LA/MA MA-ROC
P-I PI-Ch
IP21 V-I Opct
.976 -.478
-136 -67
.024 -26 -.209
====
DJI bottomed at 1990 in mid August and then
rallied to 2065.26 and Sell S2 on 9/6/1988.
Not a reversing
Buy.
Another B2 followed on 7/27/2008 that was not used here
in calculations.
----------------------------------------------------------------------------------------------------------------------------------
8/10/1988
2034.14
Gain = +1.5% Paper loss =
5%
LA/MA MA-ROC
P-I PI-Ch
IP21 V-I
Opct
.969 -.331 -153
-28 .042 -15
.084
------[
DJI bottomed at 1990 in mid August and then rallied to 2065.26 and Sell S2 on
9/6/1988.
More B2s followed from 8/11/2008 to 8/23/2008. These were not used here in the
calculations.
---------------------------------------------------------------------------------------------------------------------------------
4/11/1996
5487.07 Gain = + 3.4%
Paper Loss = 2%
LA/MA MA-ROC
P-I PI-Ch
IP21 V-I
Opct
.977 -.205
0
-6 .035
-16 -.067
------
Also a Buy B9
DJI fell to 5400 intra-day on 5/8/96 and then rose to 5673.83 and Sell S1 on
5/29/96
Not a reversing Buy.
---------------------------------------------------------------------------------------------------------------------------------
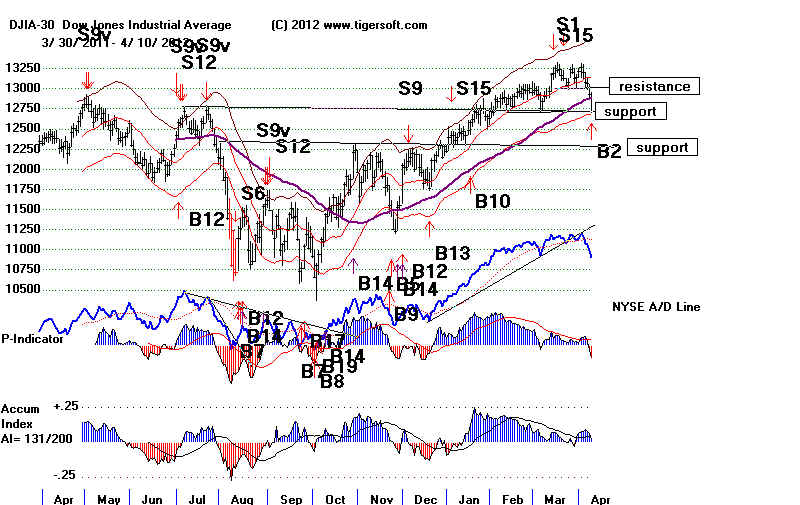
April
Buy B2s in a Presidential Election Year
4/18/1944     135.1      Gain = + 9.5%
   LA/MA    MA-ROC    P-I   PI-Ch    IP21     V-I     Opct
  .976   -.489   -102  -34   -.233  -176    -.296
 1.9% decline on day of Buy B2
 Next sell was on Sell S2 at 147.9 on 6/21/44
   In next week, there were B2s on 4/1944 and 4/21/44
   Not a reversing Buy Signal.  No paper loss.
---------------------------------------------------------------------------------
4/28/1960    604.30      Gain = +7.5%
   LA/MA    MA-ROC    P-I   PI-Ch    IP21     V-I     Opct
  .974    -.307   -93   -16   -.135 -416    -.182
 1.3% decline on day of Buy B2
  DJI bottomed here and rallied to 649.40 and Sell S2 on 6/15/60.
  The simultaneous S7 would have delayed this Buy until 5/2/69
---------------------------------------------------------------------------------
4/3/1980   784.13     Gain =  +21.3%
   LA/MA     MA-ROC    P-I     PI-Ch    IP21    V-I      Opct
   .987    -.907  -293    47  -.066   -10   -.303
   DJI fell to 757 in mid April and then rallied to 950.94 and Sell S2 on 8/7/80.
   Not a reversing Buy. Paper loss = 3%
---------------------------------------------------------------------------------
4/11/1996      5487.07     Gain =  + 3.4%
   LA/MA    MA-ROC    P-I   PI-Ch    IP21    V-I     Opct
   .977   -.205    0   -6    .035   -16    -.067
   Also a Buy B9
   DJI fell to 5400 intra-day on 5/8/96 and then rose to 5673.83 and Sell S1 on 5/29/96
   Not a reversing Buy.  Paper Loss = 2%
----------------------------------------------------------------------------------
4/17/2000   10582.51    Gain =  + 5.1%
   LA/MA    MA-ROC    P-I   PI-Ch    IP21     V-I     Opct
   .964   -.014  -73   -14   -.033    71   -.18
  DJI fell to 10250 intra-day on 6/30/2000 and then rose to 10804.27 and Sell S12 on 7/17/2000
  Not a reversing Buy   Paper Loss = 3%
  More B2s followed from 4/18/2000 to 4/24/2000.  These were not used here in the calculations
------------------------------------------------------------------------------

4/10/2012  12715.93     Gain = ?
   LA/MA    MA-ROC    P-I   PI-Ch    IP21     V-I     Opct
   .969   -.187  -253 -160   .025   -126   -.078
   low                 low    high
April 5 Avg.Gain +9.4%
|
=====================================================================================
OLDER HOTLINES
=====================================================================================
4/9/2012 Hotline
KEY CHARTS and INDUSTRY INDEXES
DIA SPY
QQQ DJIA-Peerless
TigerDJI TigerSPY TigerQQQ
GLD SLV Crude Oil IWM-Russell-2000
Key Values - Peerless-DJIA
DJI 12930
-131 la/ma = 0.984 21dmaROC= .02 P=-93
P-Ch= -172 IP21=.063 V= -78 OP= .015
BREADTH STATISTICS: Advance= 636 Declines= 2420 UpVol =69.17 DownVol= 646.7
Key Stocks: AAPL and 4 highest
priced DJI stocks: IBM, CAT,
CVX, MCD and XOM
--->
238
MAXCP stocks Bullish MAXCP Stocks
Bullish plurality.
--->
111 MINCP stocks
Bearish MINCP Stocks
MAXCP stocks are those showing Tiger Closing Power
making new highs.
This suggests heavy Professional Buying. Applying the Tiger Power Ranker's
"bullish" to the MAXCP stocks find those with heavy insider buying and
institutional accumulation. Bearish MINCP stocks show the opposite.
---> 19
new
highs on NASDAQ. 43new lows on NASDAQ Bearsh
plurality.
---> 10
new
highs NYSE 38 new lows on NYSE
4/9/2012 - Hotline ---- Peerless Sell S1 and Sell S15 Signals Now Operate.
The DJI today broke the 3x-tested 13000 support. The result was a quick
decline to
the next support, the rising 65-day ma. No Buy from Peerless occurred
because of the
recent Sells. Our studies show that after most Peerless sell signals,
the odds favor
a penetration of the 65-day ma, though there may be a short-term rally.
This was true,
for example, after 85% of the Sell S1s. With the Closing Powers
rising, a bounce does
seem likely. But now 13000, the broken support, should act as
resistance.
In the chart below, you can see support exists also at 12750, 12500 and
12300.
It may be the support is too spread out to bring a quick stop to the decline.
In addition,
I noticed how often it usually takes 6 weeks or more for a bottom to be made
after
a peak in a Presidential Election year. At this point, I think we
will see a bottom
nearer the DJI's lower band, now at 13596. The short-term rally is
likely to be led by AAPL
and the few other high-caps and tech stocks that have both their Opening and
CLosing Power
rising..
We have been hedged by shorting bearish MINCP stocks, DIA or the ETFs for
Brazil
or Russia. The CLosing Power of DIA, EWZ and RSX (see bwlow) are
rising quite strongly.
It would be best, I think, to cover these short sales. Without a new
Peerless Buy signal, I would
maintain the bearish MINCP positions and await a better buying opportunity
with more
head room.
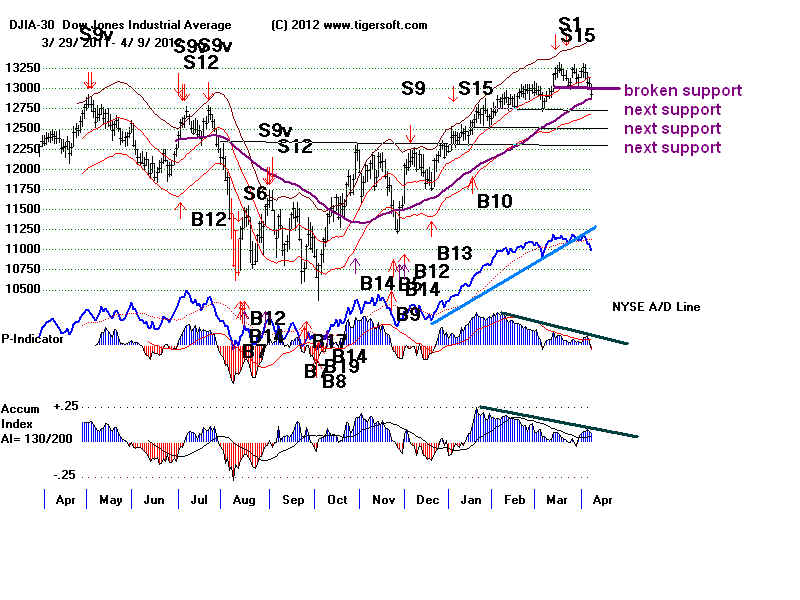
DIA's Closing Power is Rising.
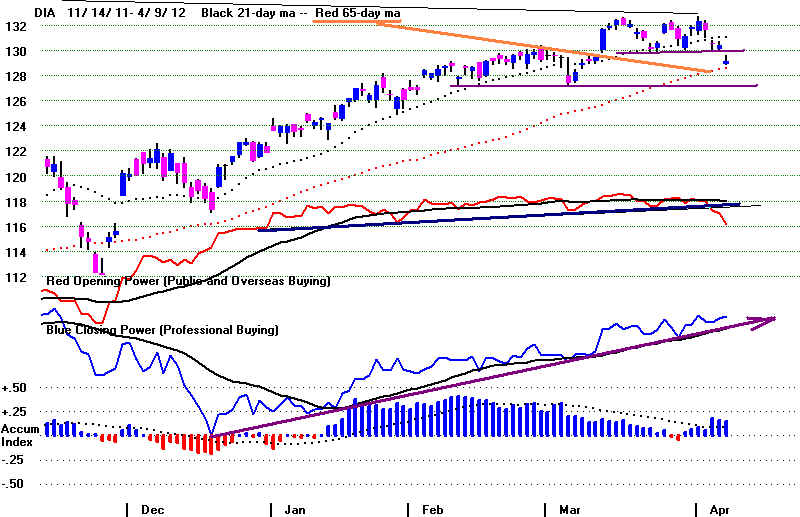
======================================================================================
OLDER HOTLINES
======================================================================================
4/7/2012 Hotline
KEY
CHARTS and INDUSTRY INDEXES
DIA SPY QQQ DJIA-Peerless TigerDJI TigerSPY TigerQQQ GLD SLV
Crude Oil IWM-Russell-2000
Key Values - Peerless-DJIA
DJI 13060 -15 la/ma = 0.994 21dmaROC= .202 P= 78 P-Ch= -103 IP21=.121 V= +14 OP= .129
BREADTH STATISTICS: Advance= 1300 Declines= 1703 UpVol = 230.72 DownVol= 481.63
Key Stocks: AAPL and 4 highest priced DJI
stocks: IBM, CAT, CVX, MCD and XOM
--->
203 MAXCP stocks Bullish MAXCP Stocks Bullish plurality.
--->
96 MINCP stocks
Bearish MINCP Stocks
MAXCP stocks are those showing Tiger Closing Power
making new highs.
This suggests heavy Professional Buying. Applying the Tiger Power Ranker's
"bullish" to the MAXCP stocks find those with heavy insider buying and
institutional accumulation. Bearish MINCP stocks show the opposite.
---> 31
new
highs on NASDAQ. 29 new lows on NASDAQ Bullish
plurality.
---> 28
new
highs NYSE 25 new lows on NYSE
4/7/2012 - Hotline ---- Peerless Sell S1 and Sell S15 Signals Now Operate.
Stay hedged with "bearish MINCP"
stocks or short DIA if you are aggressive.
This has not been a year for DJI declines, yet. Presidential Election
years tend to limit or
postpone declines of more than 10% to the next year. Still it is not
true to say that there
are no significant decliues during a Presidential Election year. Since
1944, there have been
5 declines of more than 10% in the last 10 months of a Presidential Election
year. The period
before 1944 was more volatile. There were 7 such deep declines between
1916 and 1940.
March and April tops since 1980 produced just one drop of more than 10% in
the 5 declines
of more than 5%. These "minor" declines averaged 7.6%
sell-offs. The DJI has, so far,
peaked at 13,233. A 7.6% decline from this peak would bring a drop to
13232, about the point where the
DJI broke out in late Decmber. Such a drop here would have take out the
rising 65-day
ma now at 12879. We are likely to get a Buy B11 on a drop to that point
unless the sell-off
cuts immediately and decisively down below that level. This is a
possibility because 13000 is
setting up as a well-tested support. Its violation is apt to bring more
of a decline than there
would have before the recent tests of it which now have established a
well-tested support below
which Sell Stops will be triggered.
Declines by DJI
Tops Decline
1988 4/13 - 5/19 -8%
1996 3/8 - 5/7 -5%
2000 4/18 - 5/24 -9%
2004 3/7 - 4/19 -8.5%
2008 After Jan-March sell-off, 5/2 -11/20 -42%
Here is their history since 1912.
No. Avg.Decline
1912-2008
March tops
4 13.9%
April tops
6
10.8%
May tops
2
7.0%
June tops
3 10.8%
July tops
3
6.0%
August tops
6 6.25%
September tops 5 `13.2%
October tops
3 8.3%
November tops 5
9.2%
Tops before declines of more than 5%
1912 9/30 - 12/18
-9%
1916 After Jan-July
sell-off, 11/21-12/28 -14.5%
1920 After Jan-Feb
sell-off, 3/15-12/22 -37%
1924 2/5 - 5/28
-13% 8/19 - 10/14 -6%
1928 5/4 - 6/19 -9% 11/28 - 12/10 -11%
1932 After Jan-June sell-off,
9/7 - 12/2 -30%
1936 4/6 to 4/29 -11 % 8/13 - 8/21 -5%
11/17-12/21 -5%
1940 4/8 to 6/10- -26 %
1944 7/10 to 9/14 -5%
1948 6/15 to 9/27 - 9% 10/26 to 11/30 -9%
1952 3/31 to 5/1 -5% 8/8 to 11/22 -6%
1956 4/6 to 5/28 -10% 8/2 to 11/28 -10.5%
1960 4/18 to 4/29 -5% 6/9 to 10/24 -13.5%
1964 no declines of more than
4.5%
1968 After Jan-March
sell-off, 7/15 to 8/9 -6%
1972 5/30 - 7/21 -6% 8/15 - 10/16 -5%
1976 4/21 to 6/9 -5% 9/21 - 11/10 -9%
1980 2/13 to 3/27 -16% 9/22 - 10/30 -6%
11/21-12/11 -9%
1984 After Jan-March sell-off, 5/2
- 7/24 -8.5% 8/21-10/10 -5% 11/5 - 12/7 -6.5%
1988 4/13 - 5/19 -8% 7/6 - 8/23 -8% 10/21 -
11/16 -6.5%
1992 6/2 - 10/9 -10%
1996 3/8 - 5/7 -5% 5/22 - 7/24 -7.5%
2000 After Jan-March sell-off, 4/18
- 5/24 -9% 9/6-10/18 -12%
2004 3/7 - 4/19 -8.5% 7/28 - 10/13 -5%
2008 After Jan-March sell-off,
5/2 -11/20 -42%
2012
Hotline - 4/7/2012
The DJI is at the support of its rectangle pattern. The Closing Powers for
DIA, QQQ and SPY
are all rising. A short-term rally attempt is likely, but with the
Peerless Sell signals, a decline to 12750 and
the rising 65-day ma still lies ahead. The bearish MINCP stocks have
done well for us. I would stay
hedged with them. The exceptional advance seen in AAPL has, no doubt,
boosted the markets. If we
take AAPL out of the NASDAQ-100, we get the Tiger QQQ-99 Index shown below,
in which there has been
no steep advance to a series of new highs. Will AAPL's rise continue?
Professionals are still busy
buying, if we judge from AAPL's still rising Closing Power. The 14-day
ma seems to show how deep only
temporary declines drop the stock. Our theories hold that when BOTH
Opening and CLosing Powers are
rising, a stock is most likely to take-off and escape gravity for a
while. Besides AAPL, there are 5 other
QQQ "Both Up" Stocks.
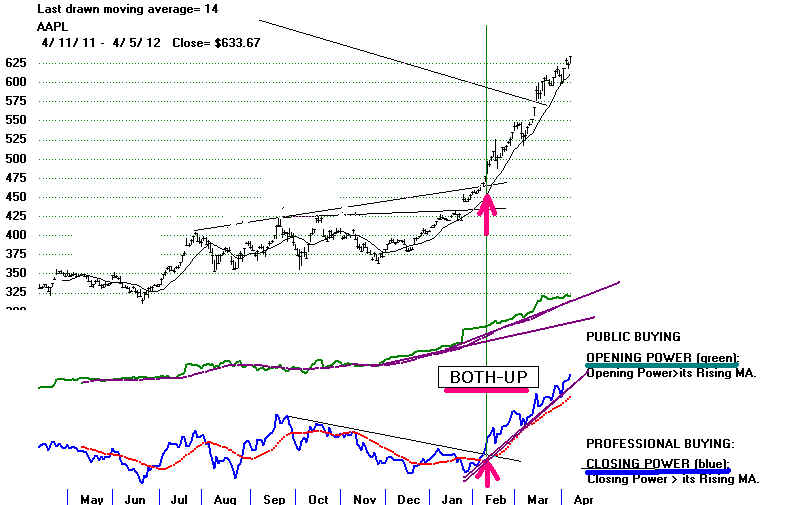
The short-term bullish BOTH-UP condition gives
aggressive traders and call buyers good stocks to play
on the long side until their Closing Power uptrends are broken.
NASDAQ-100 BOTH Up Stocks (A Power-Ranker
Screening Criteria)
BBBY Bed Bath and Beyond AI/200=121 (low) IP21=.278
broke out above top of price channel.
FOSL Fossil Inc - Breakout.
PRGO AI/200=123 (too low), IP21=-.057 (bearish)
ROST- Ross Stores - Powerful uptrend. AI/200=164
(bullish) IP21=.29 (bullish)
SBUX -Starbucks - Running! AI/200=144 (OK)
IP21= +.414 (bullish)
QQQ- without AAPL
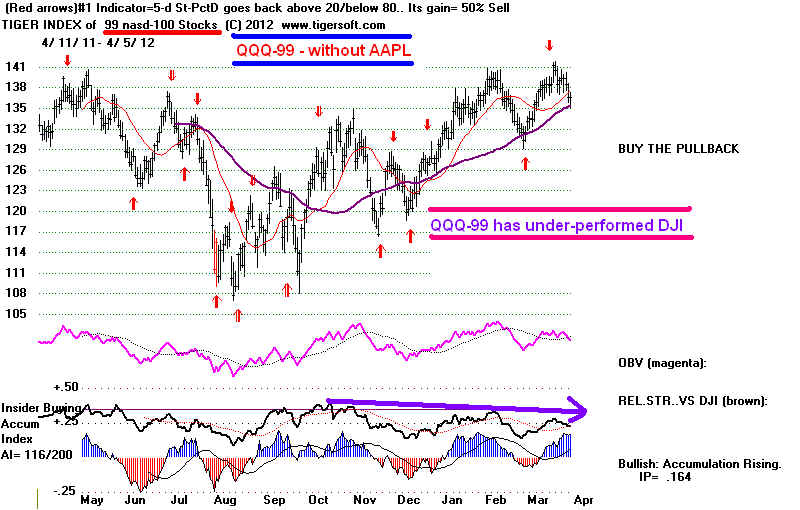
DJI-30

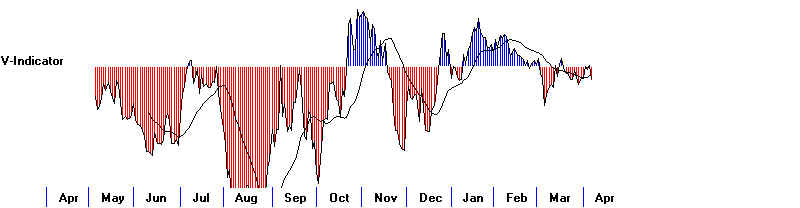
DIA - Rising Closing Power
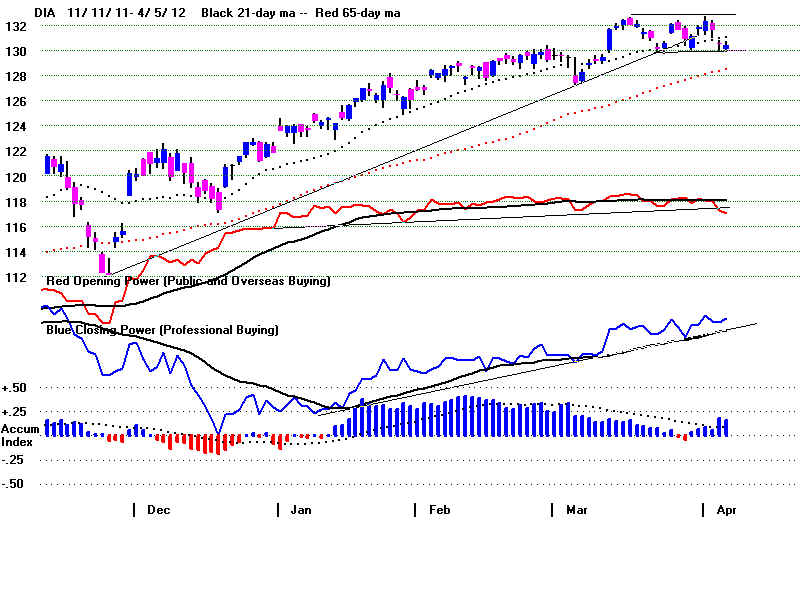
=====================================================================================
OLDER HOTLINES
http://tigersoft.com/10221-THL/
=====================================================================================
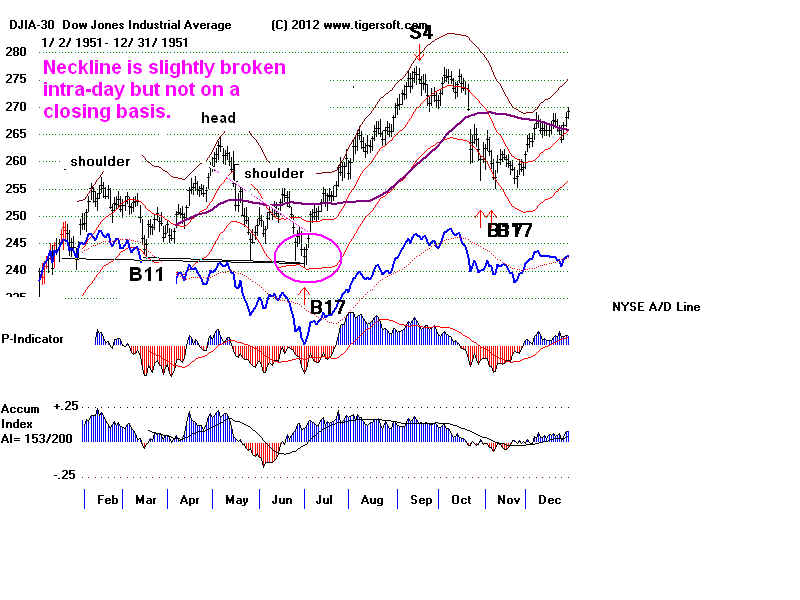
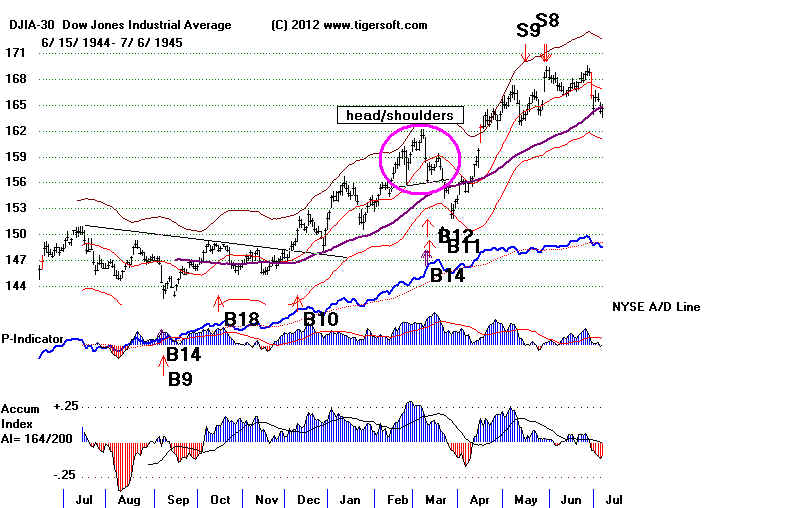
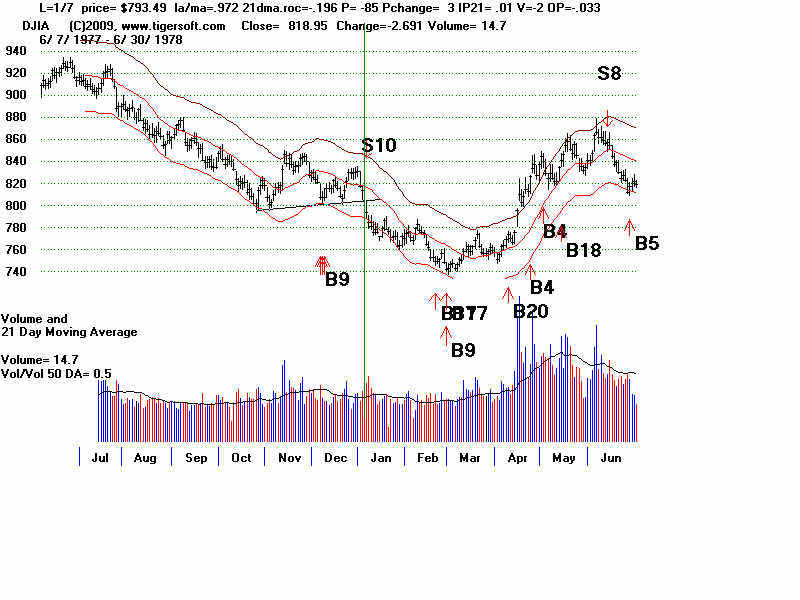
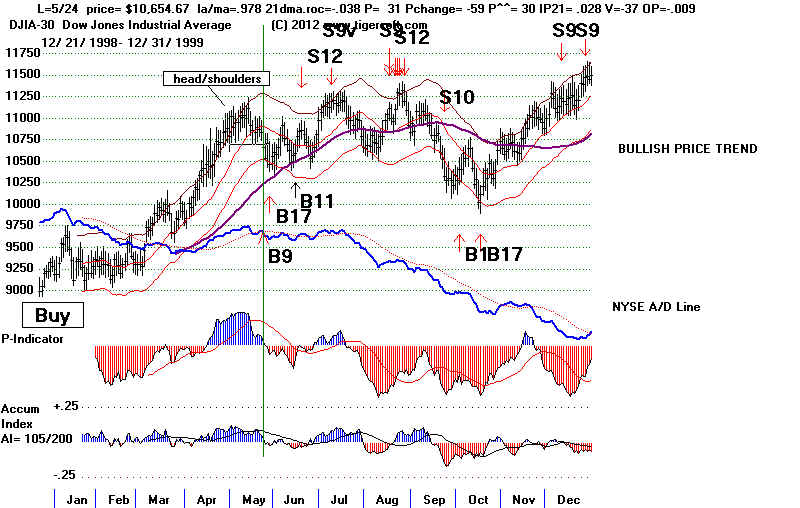
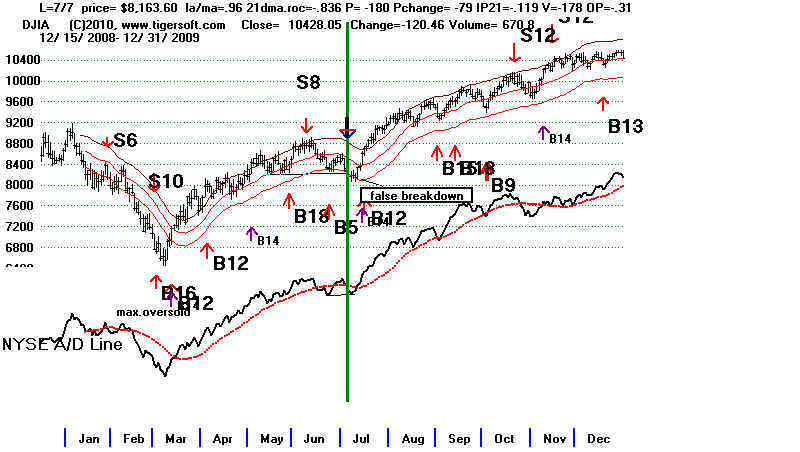
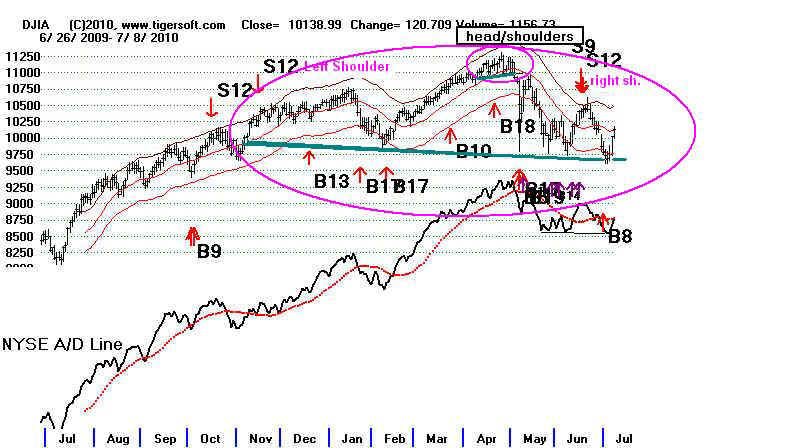
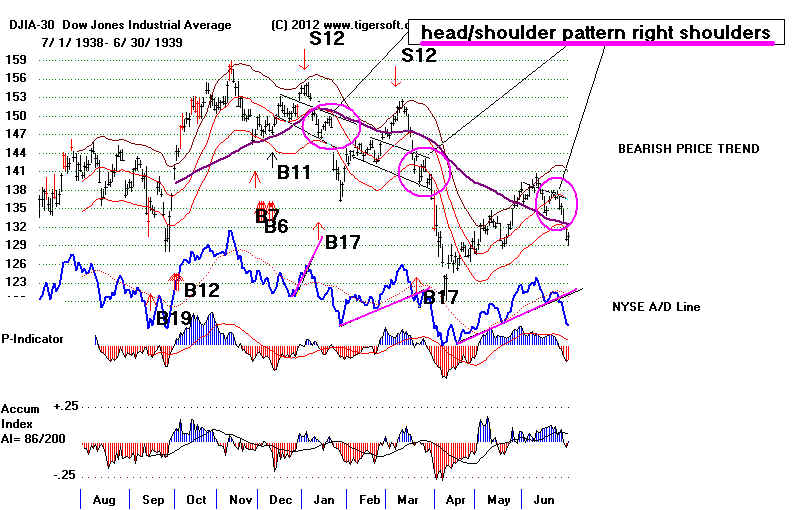
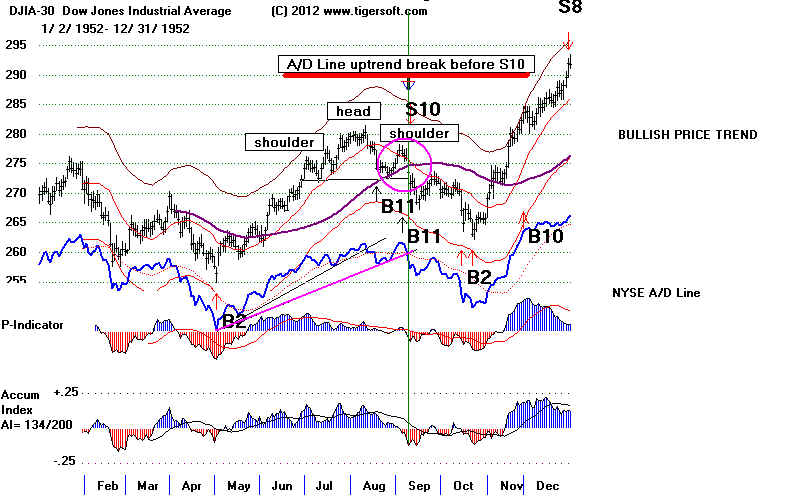
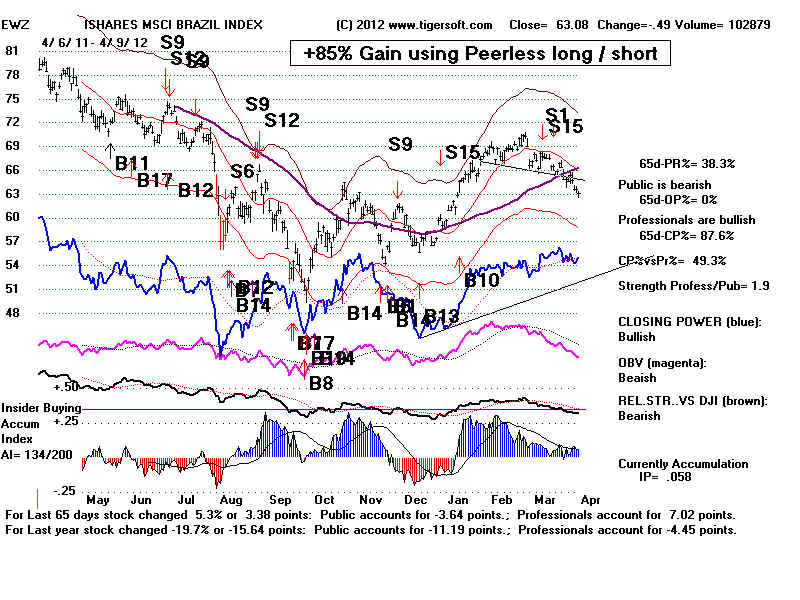
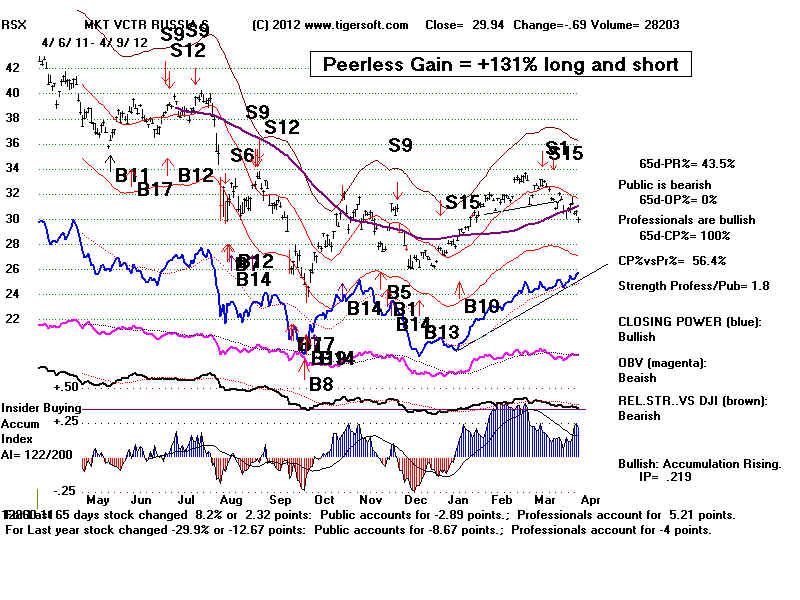
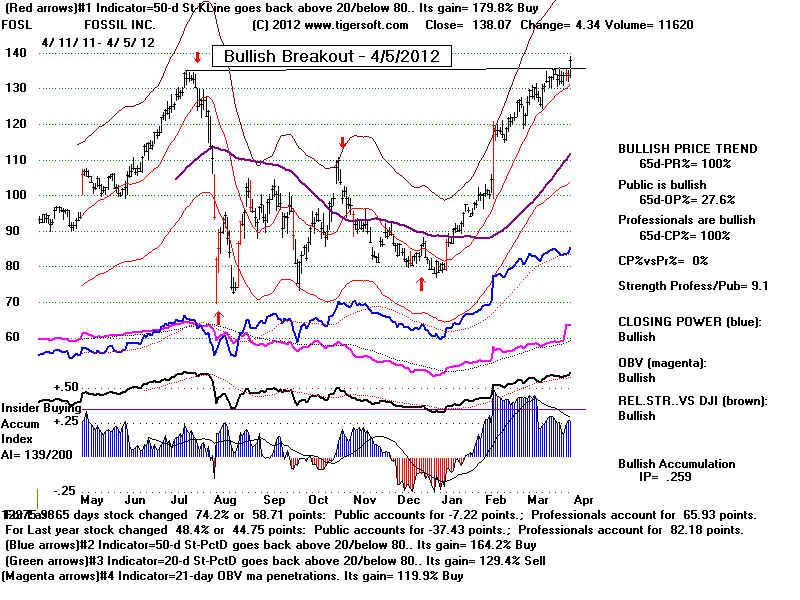
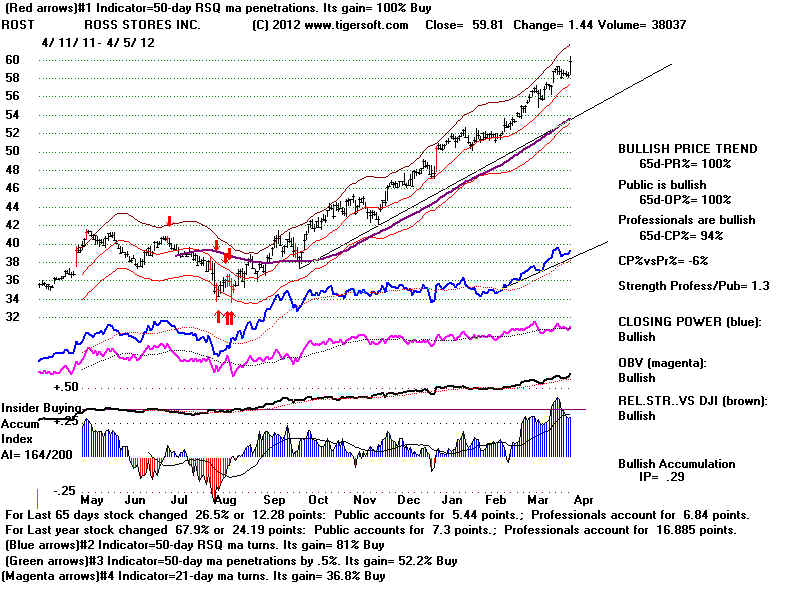
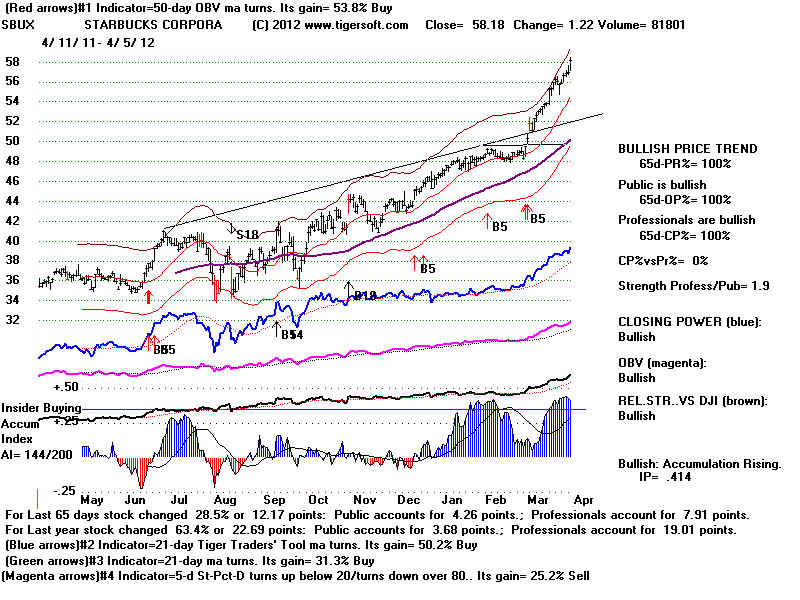
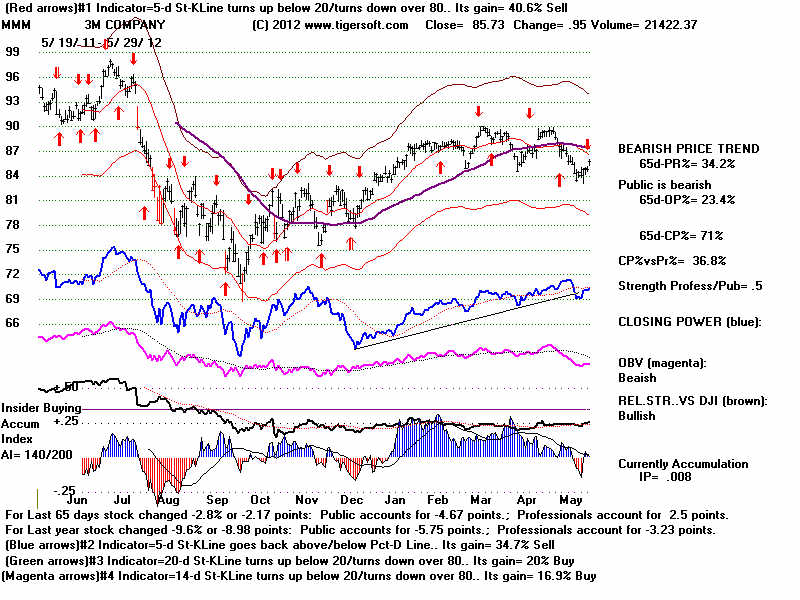
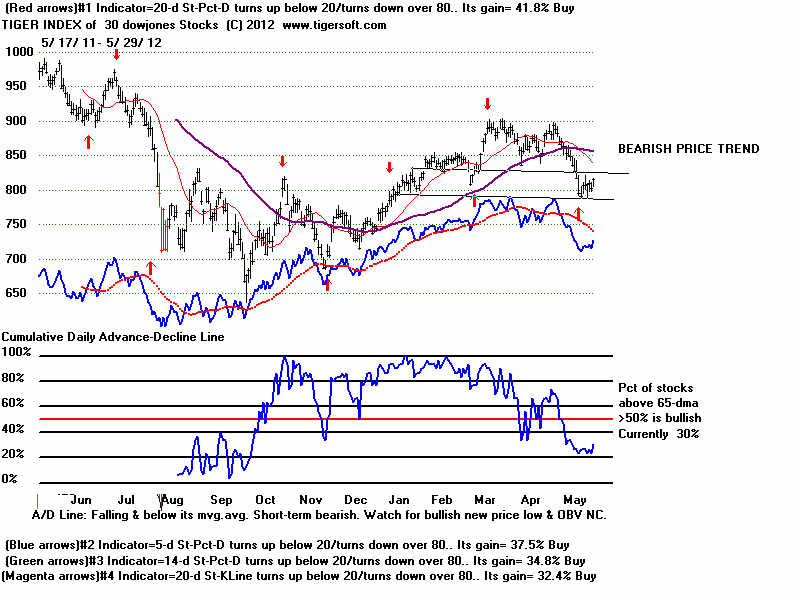
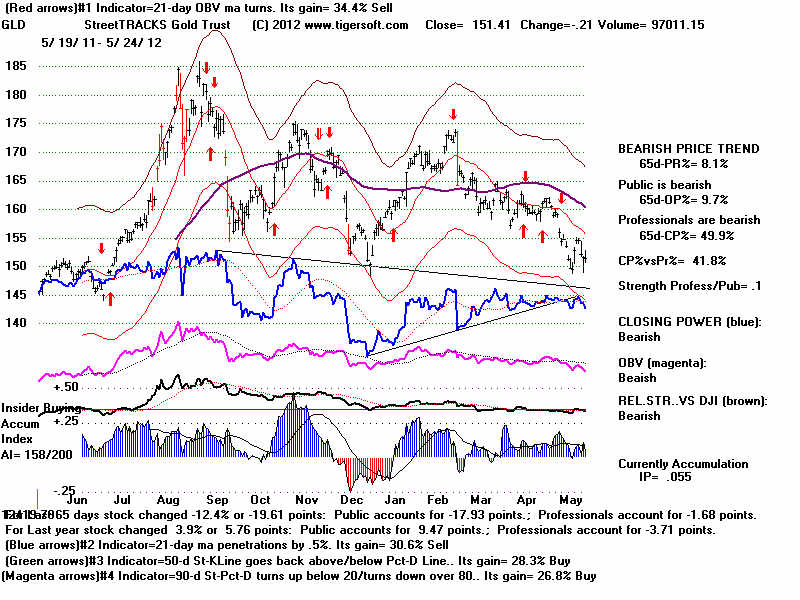
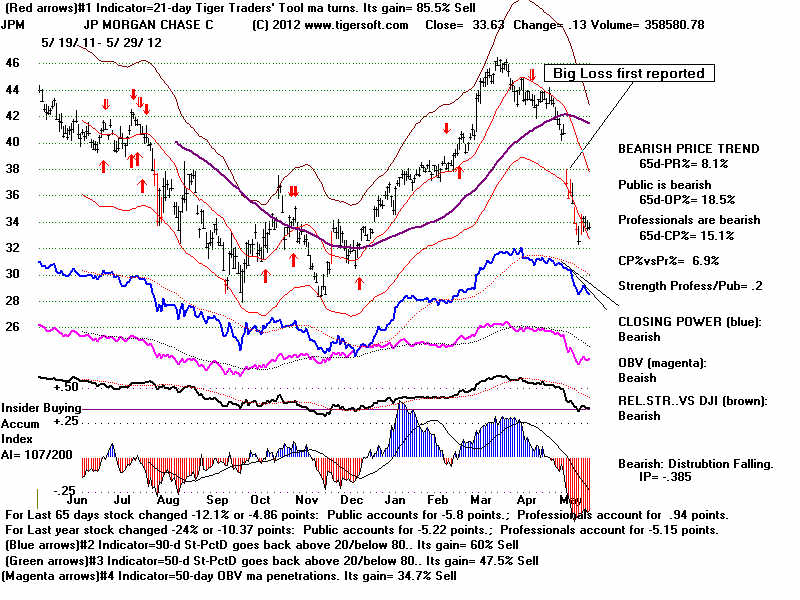
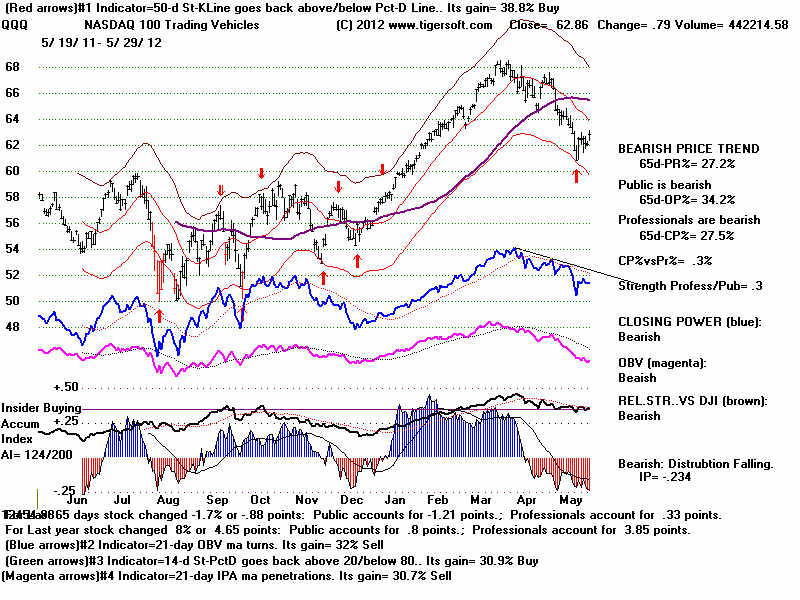
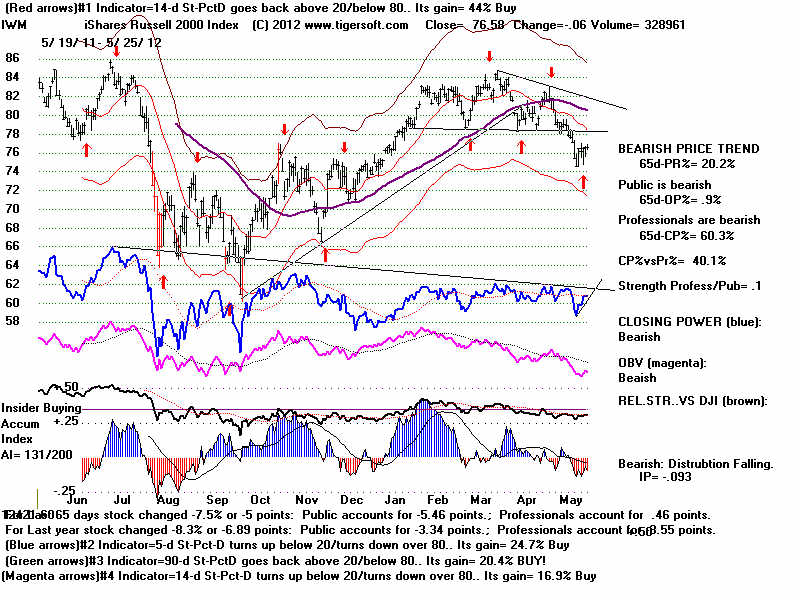
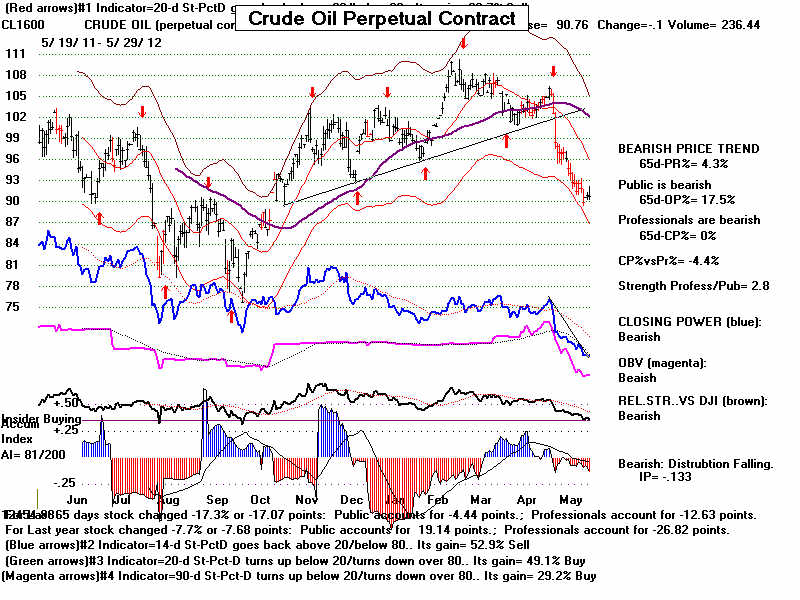
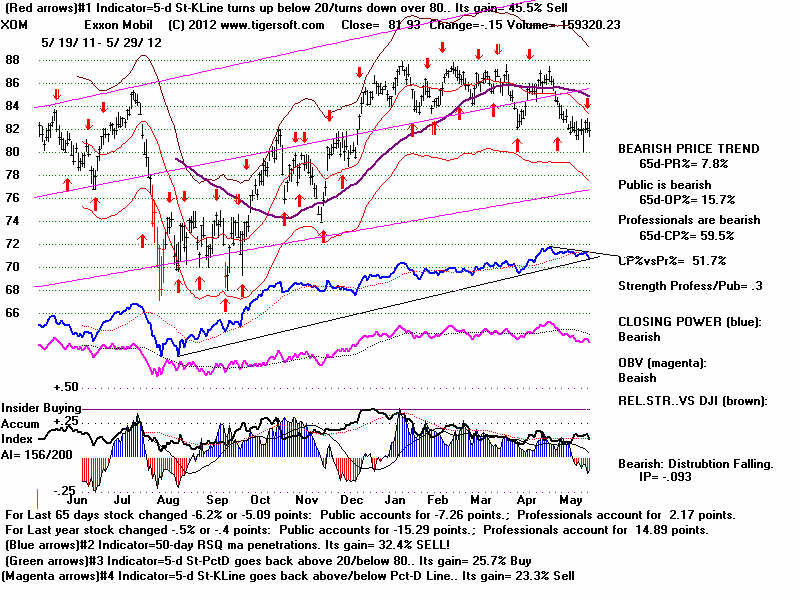
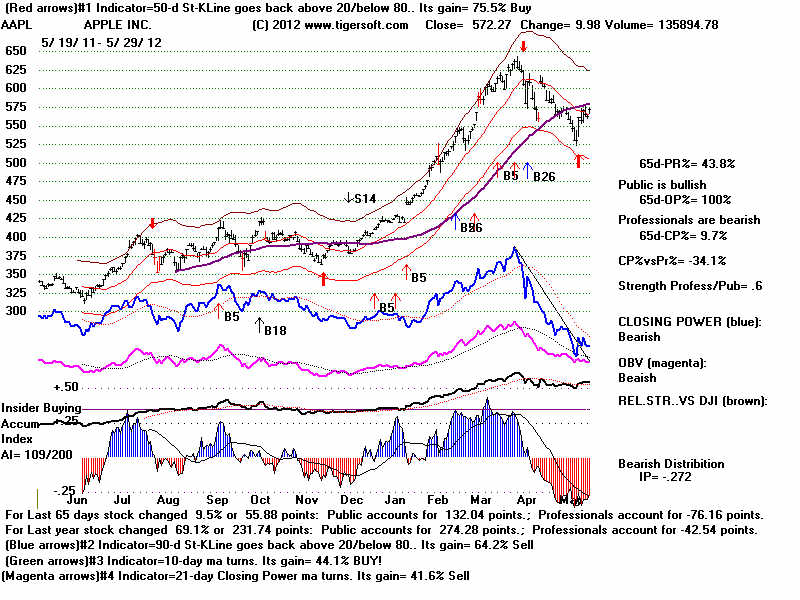
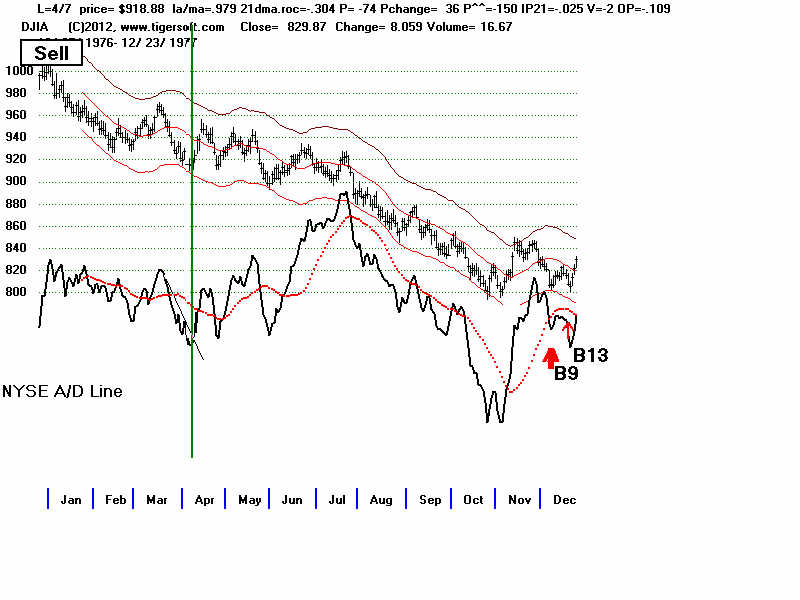
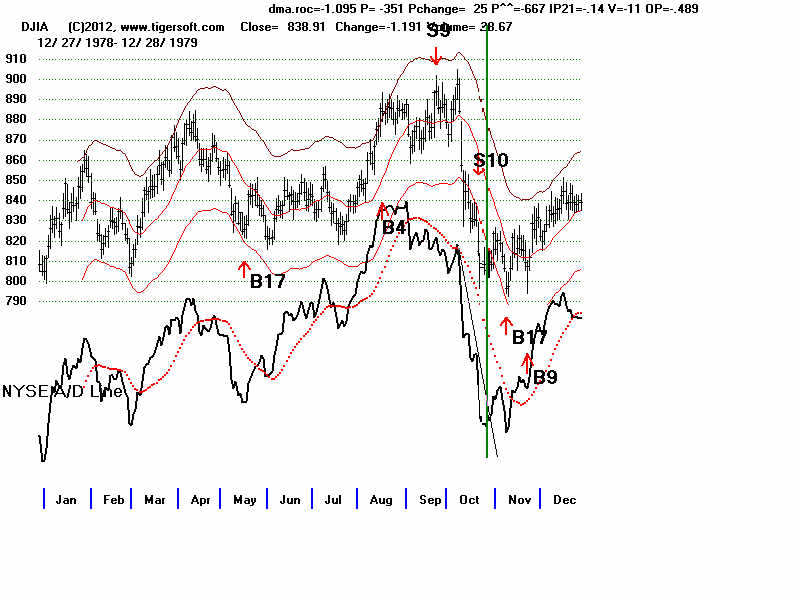
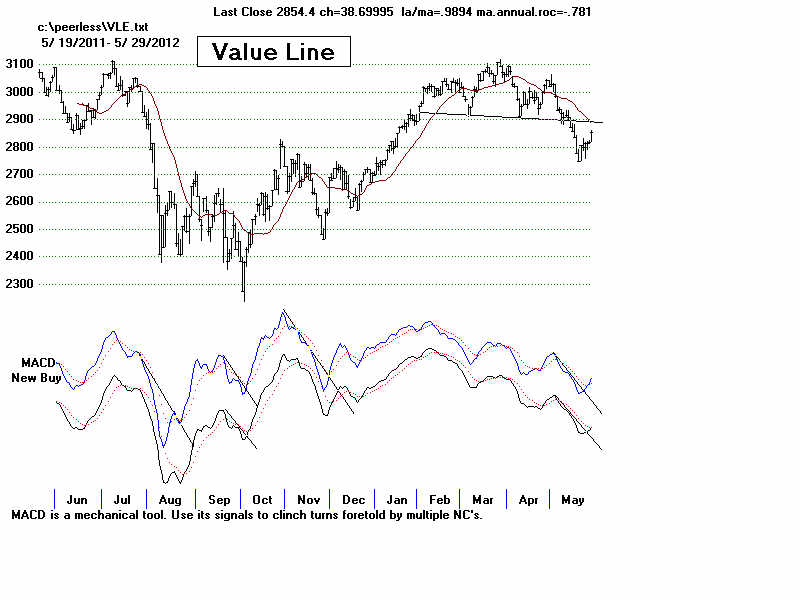
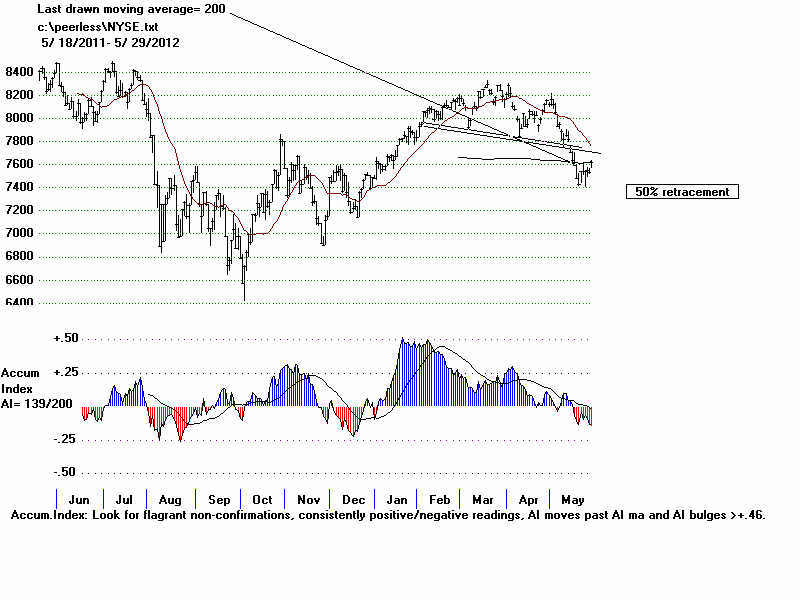
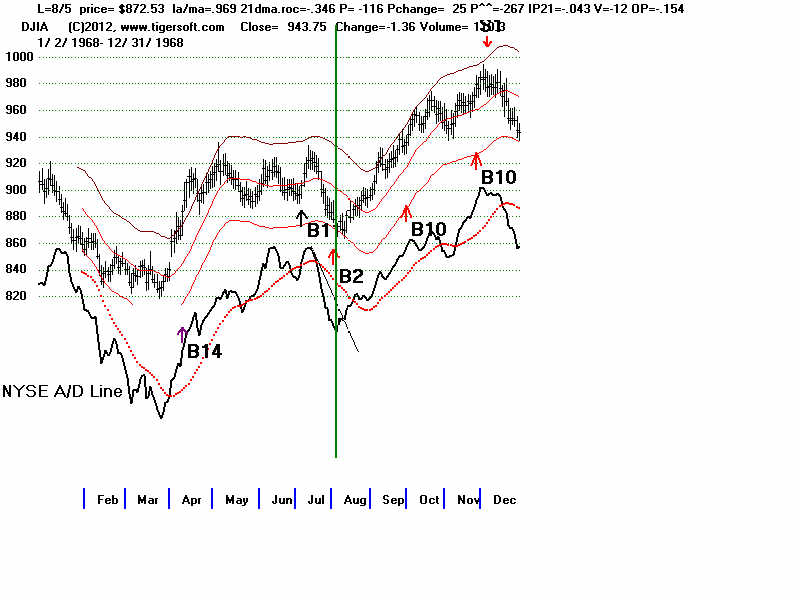
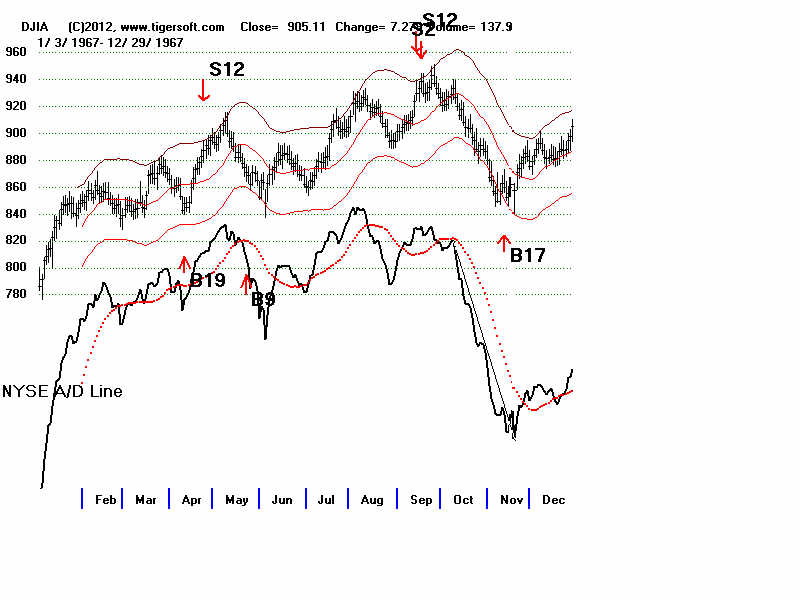
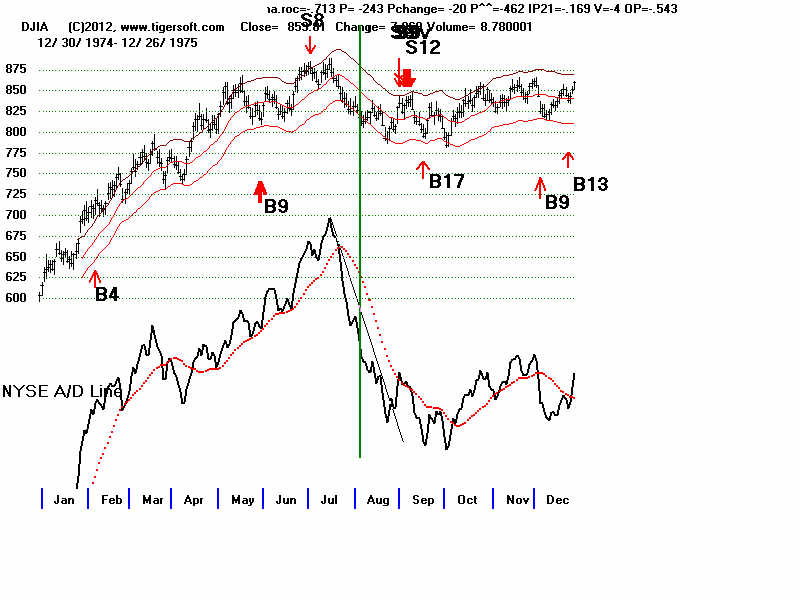
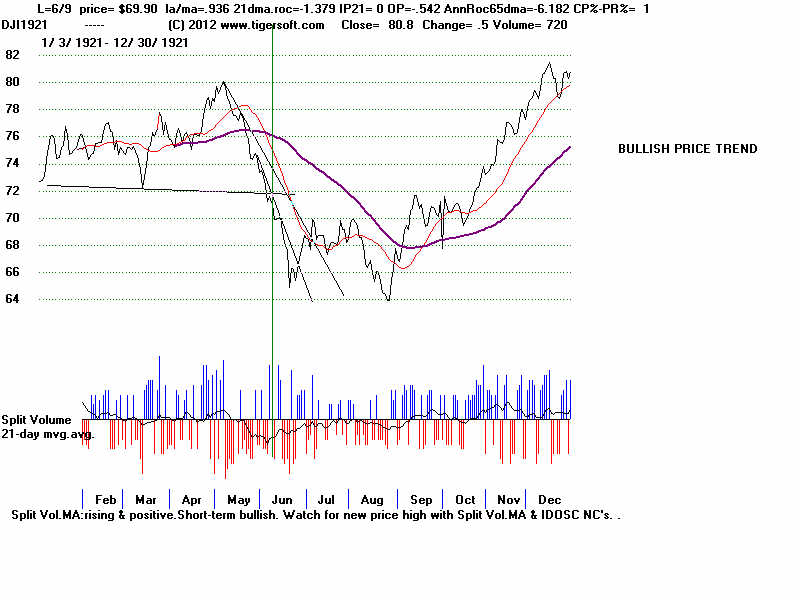
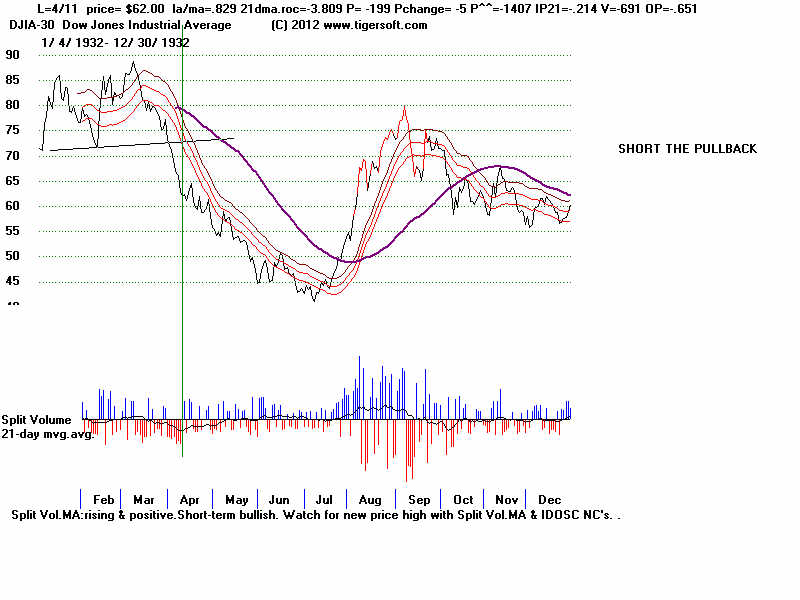
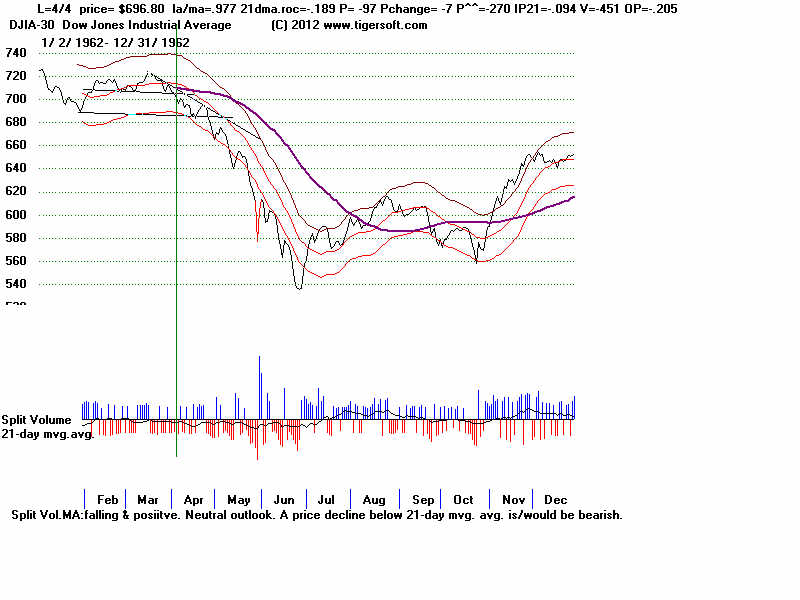
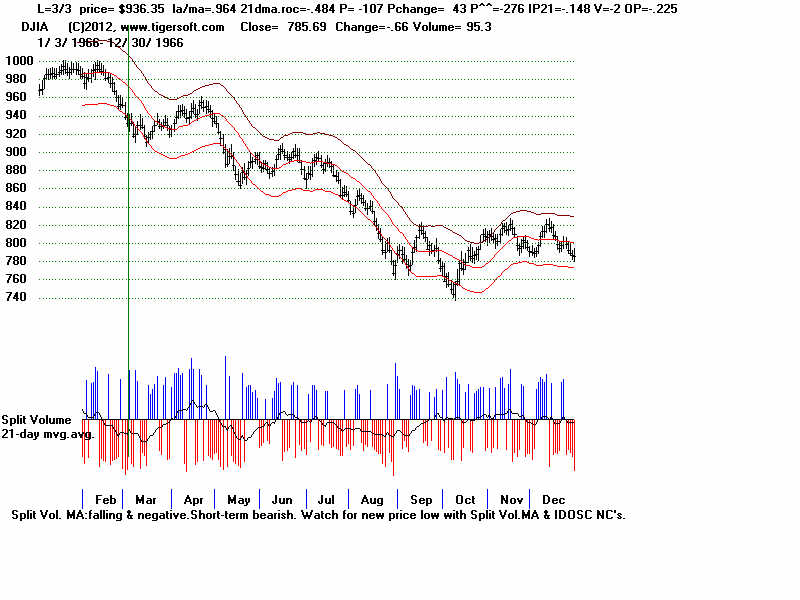
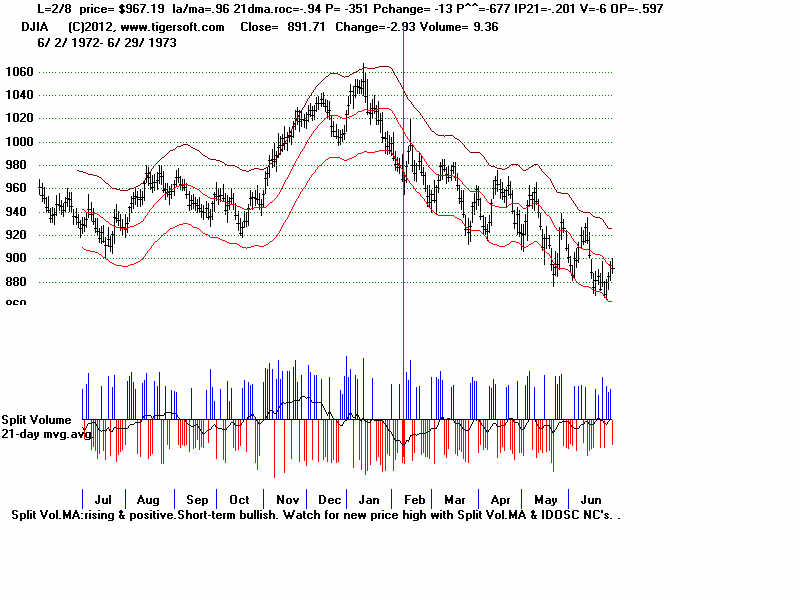
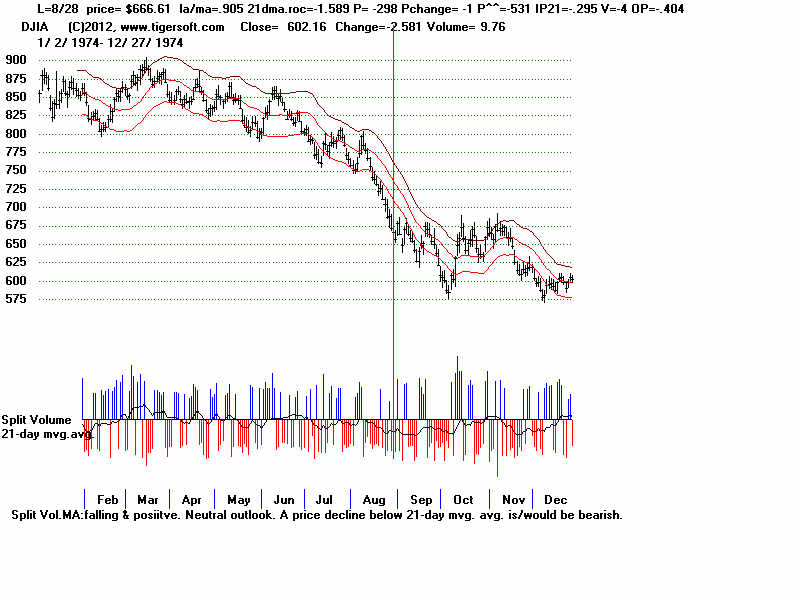
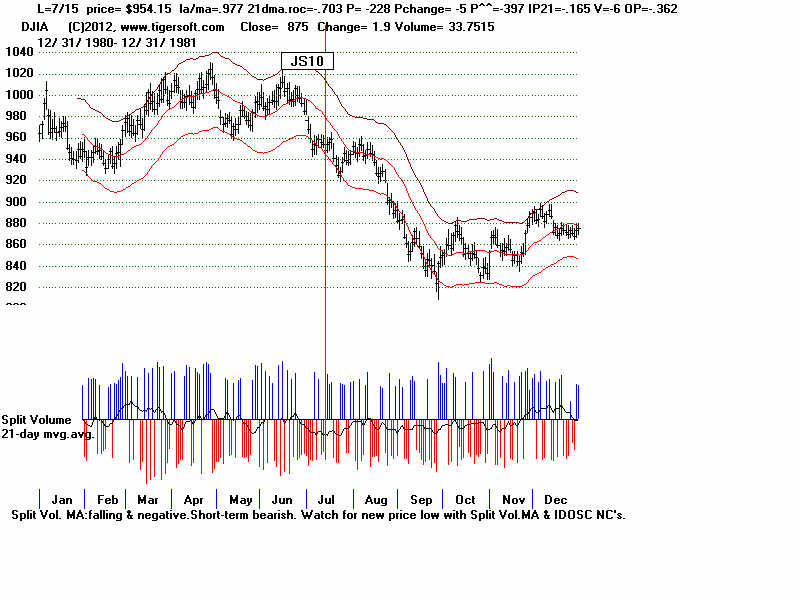
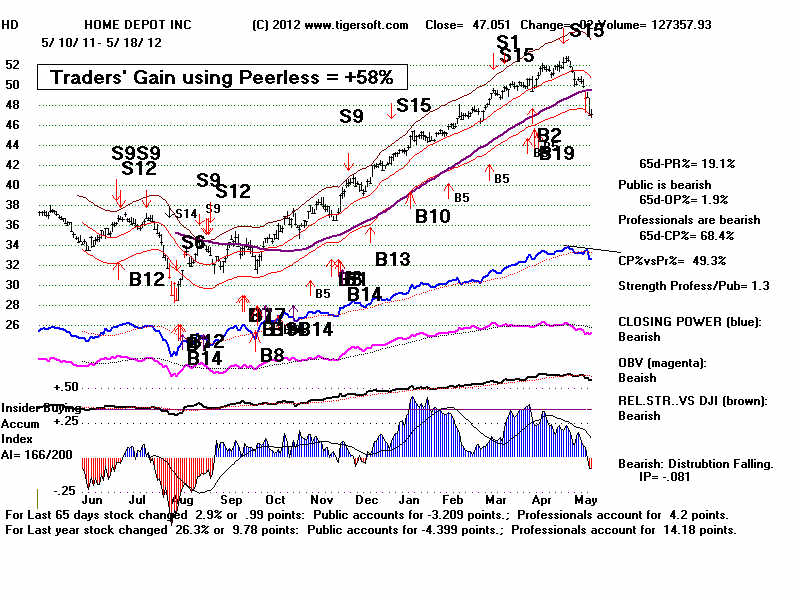
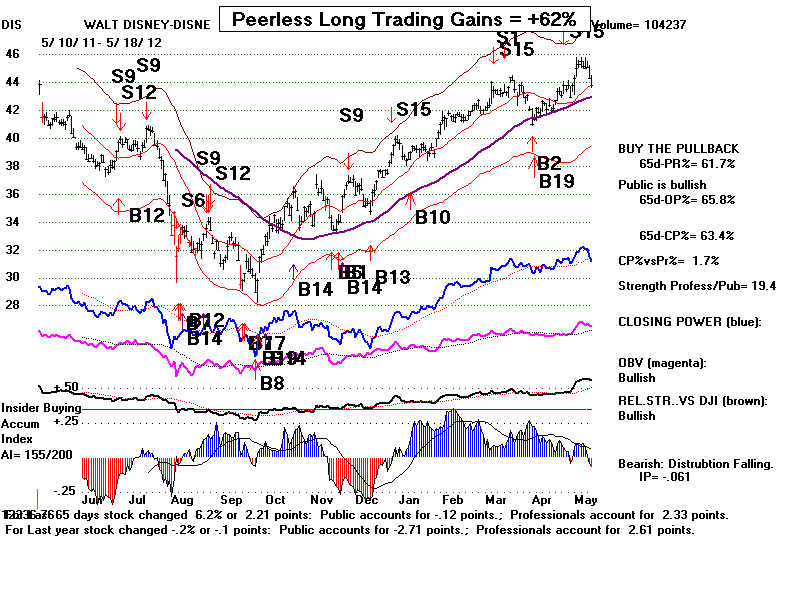
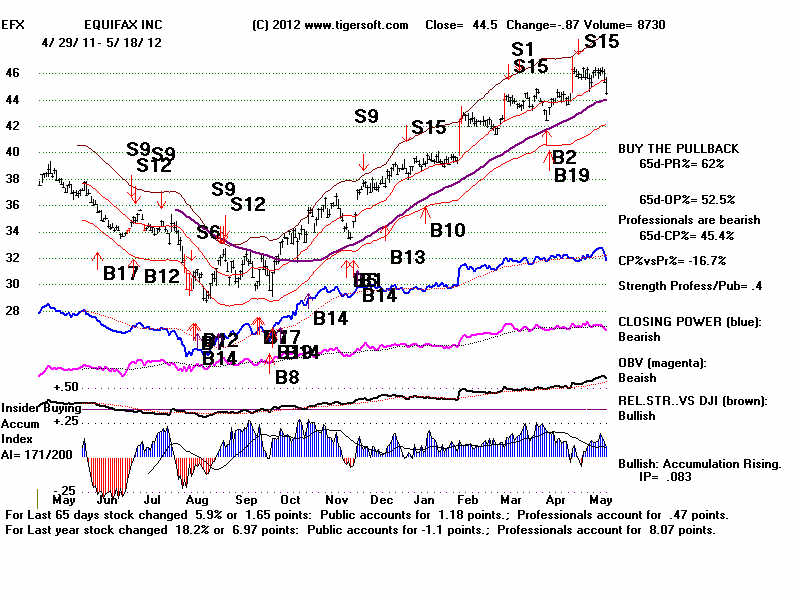
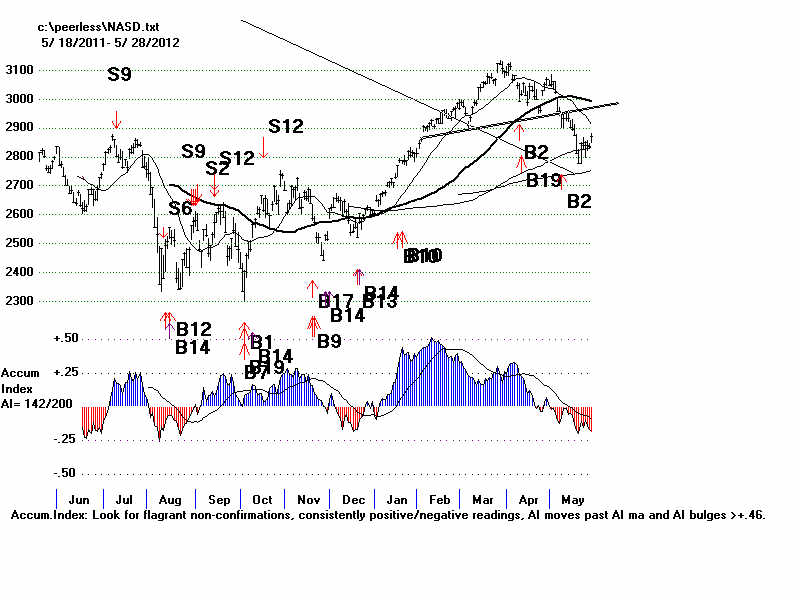
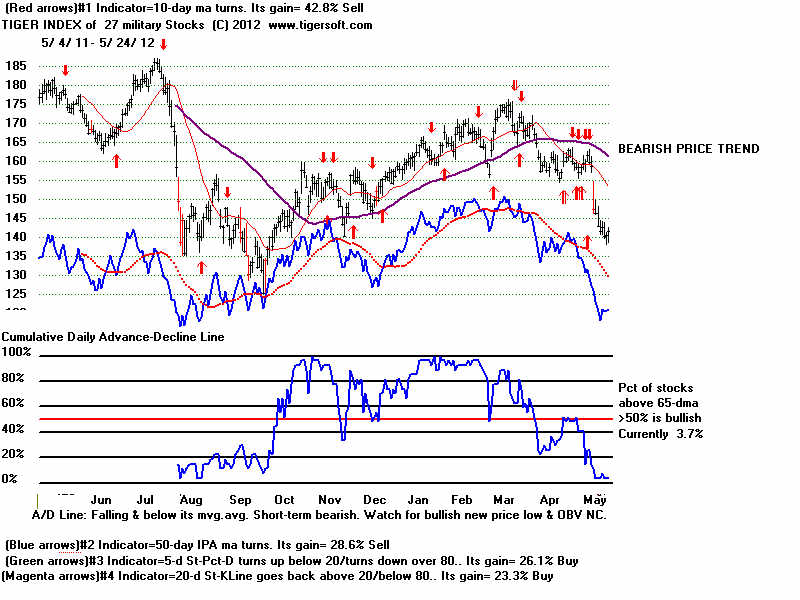
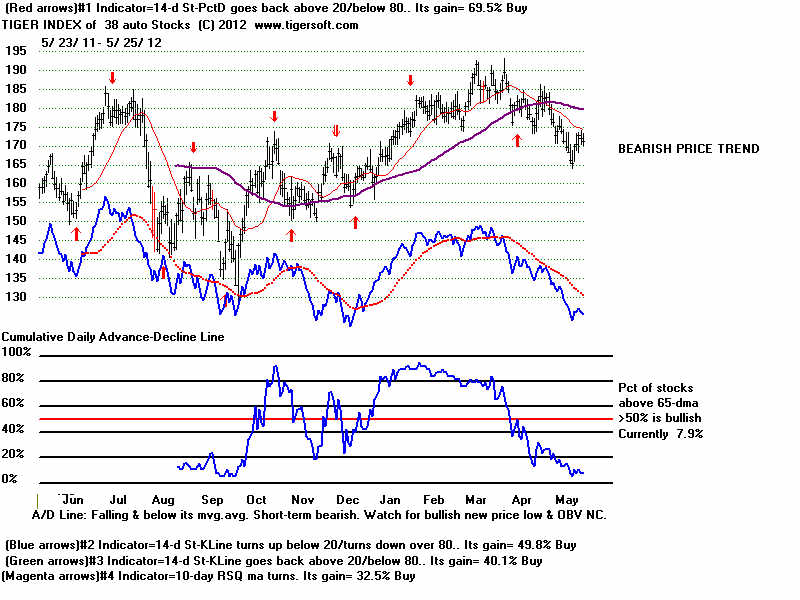
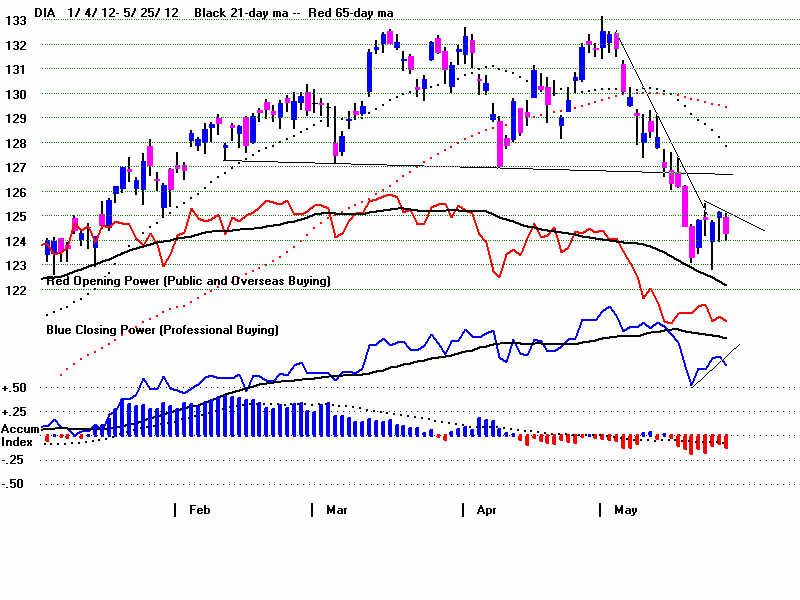
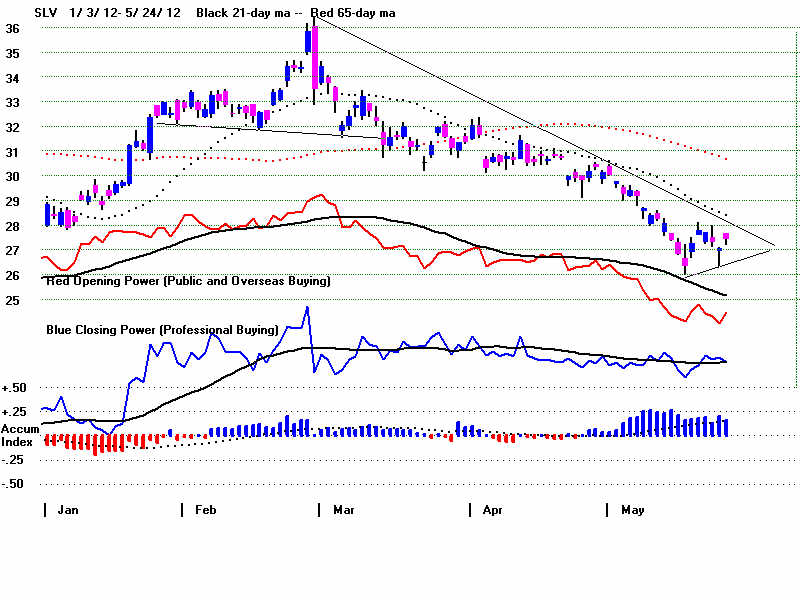
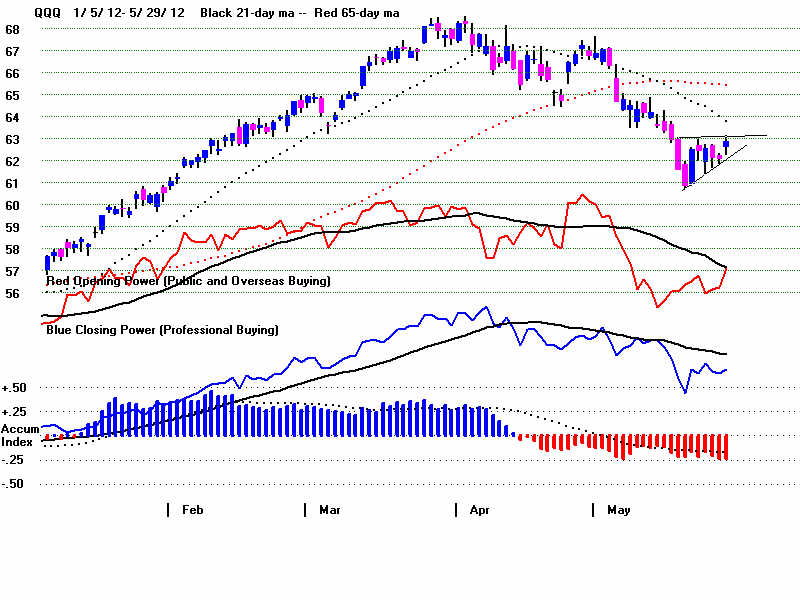
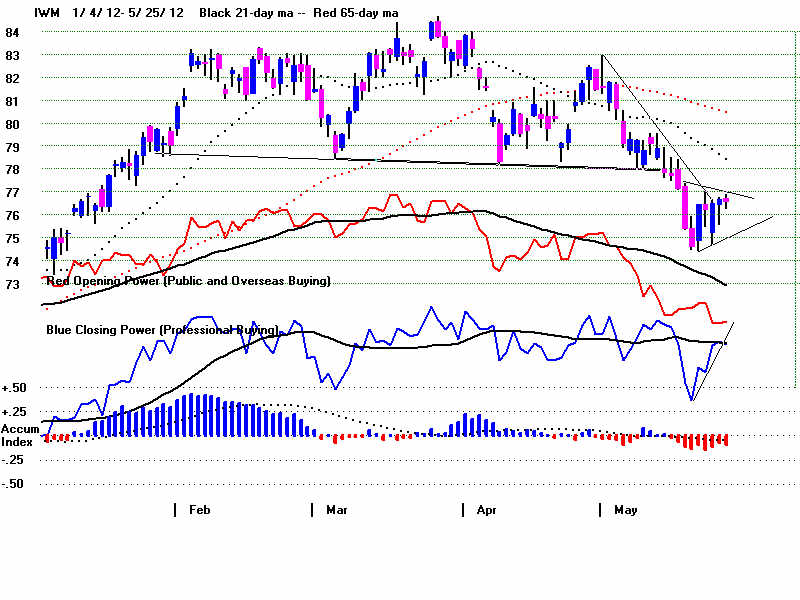
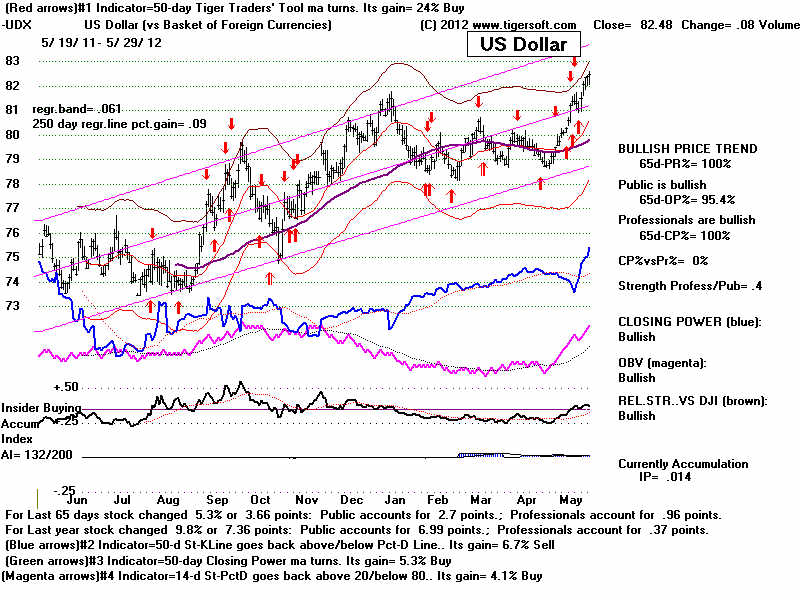
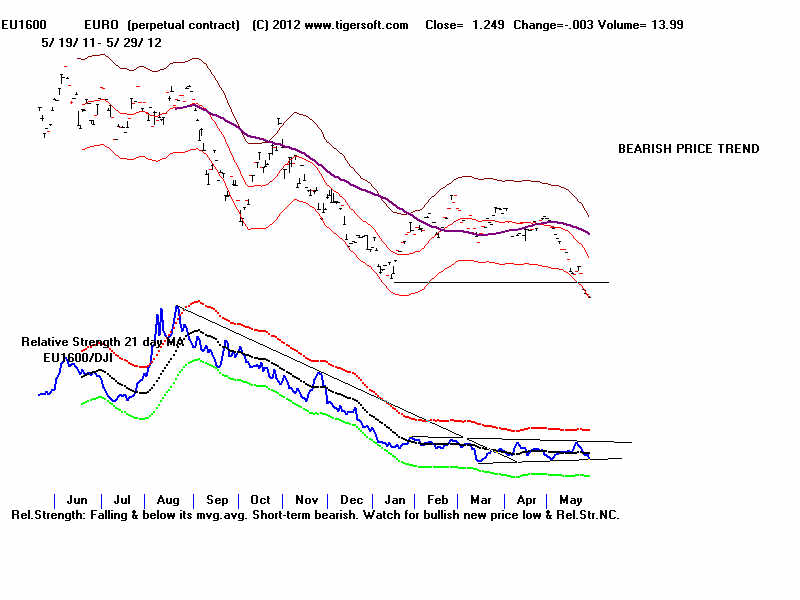
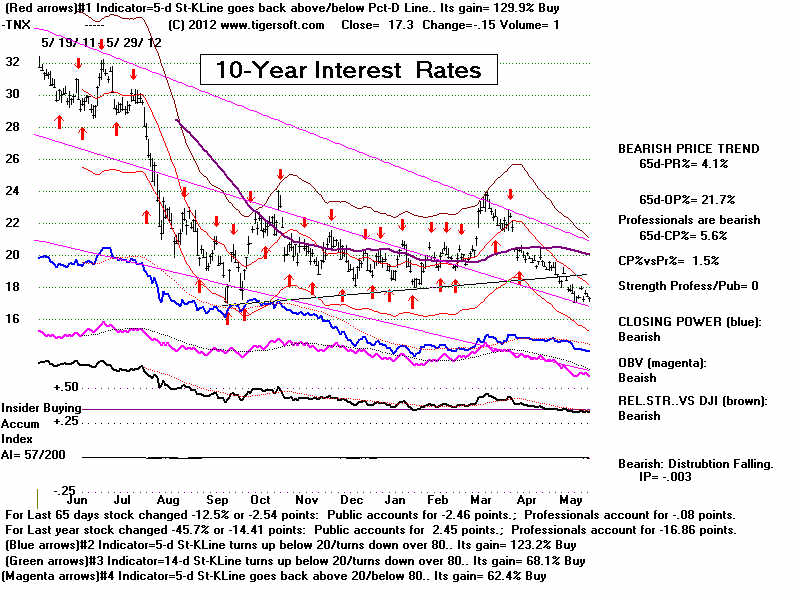
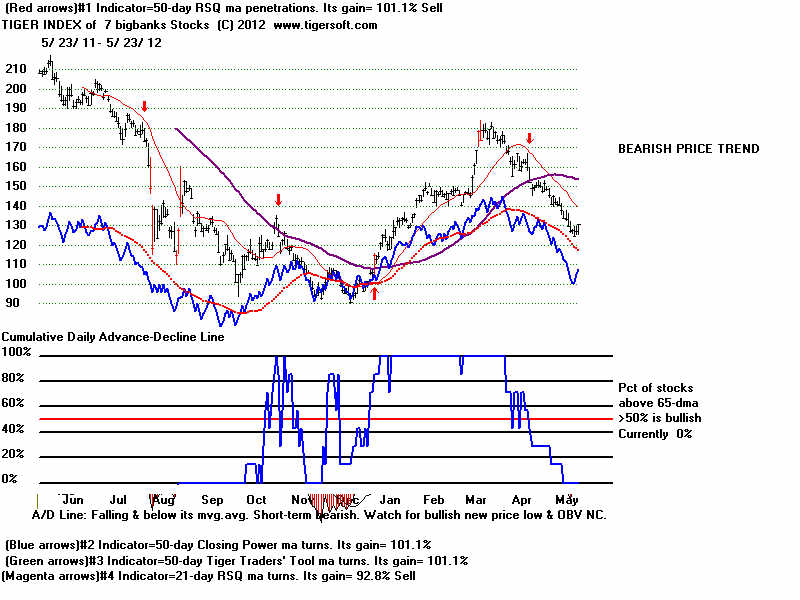
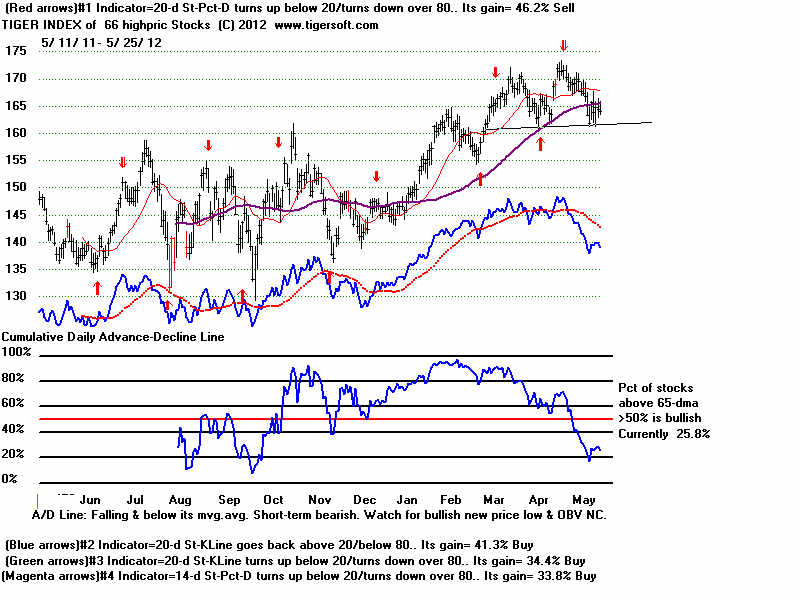
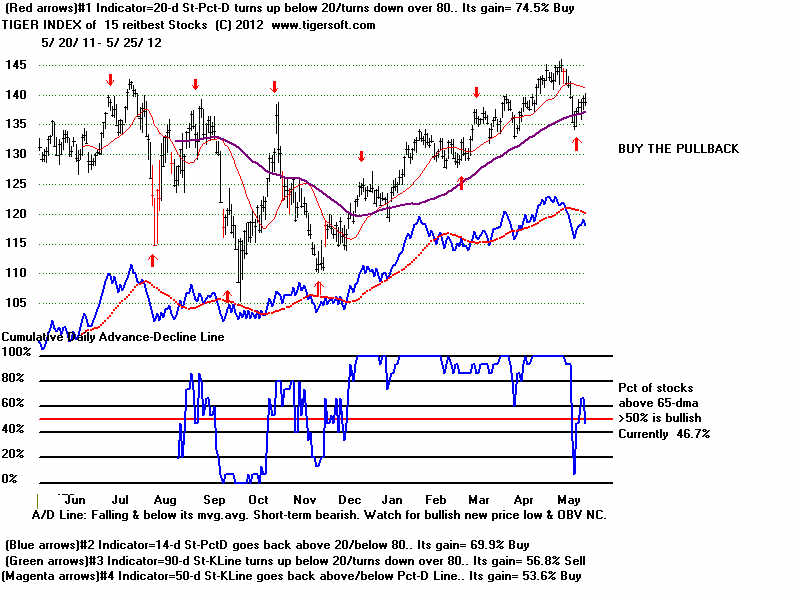
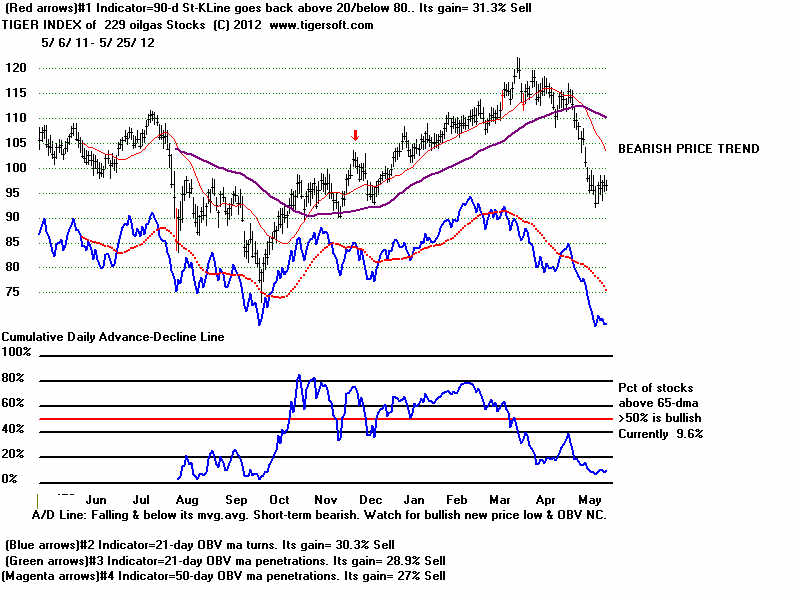
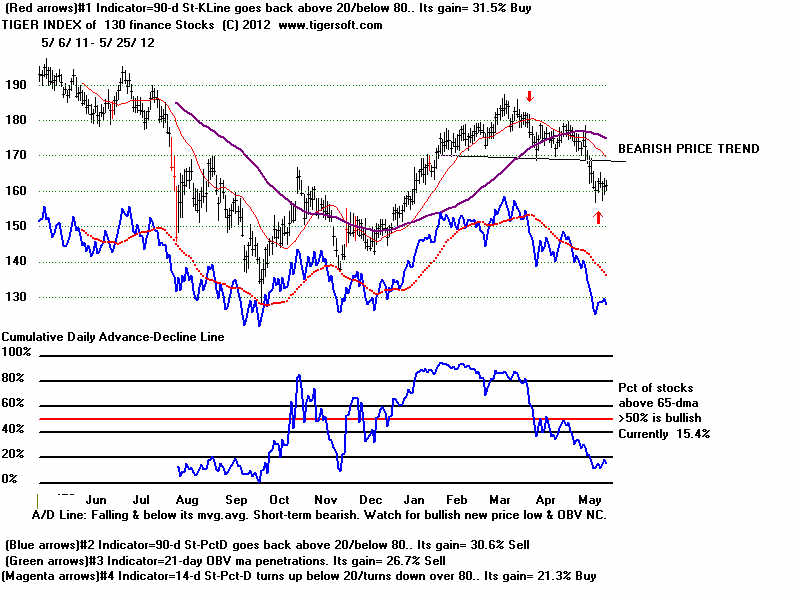
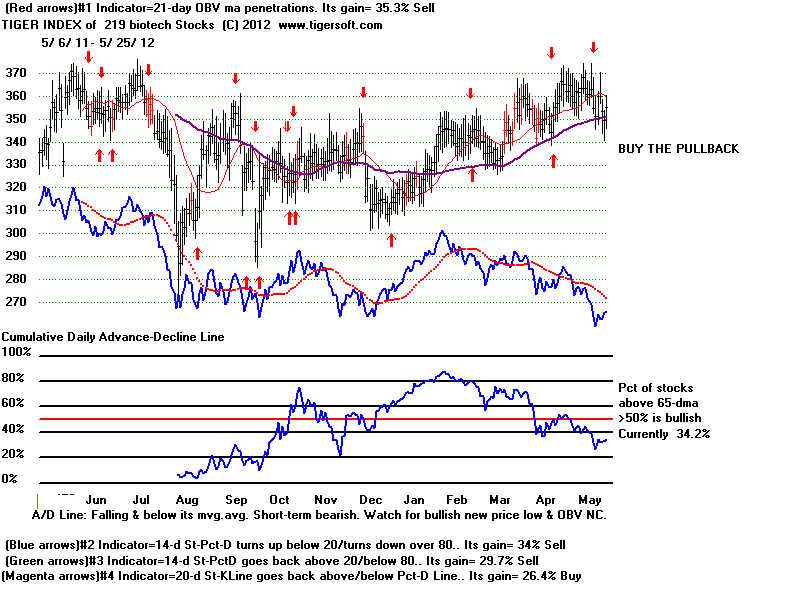
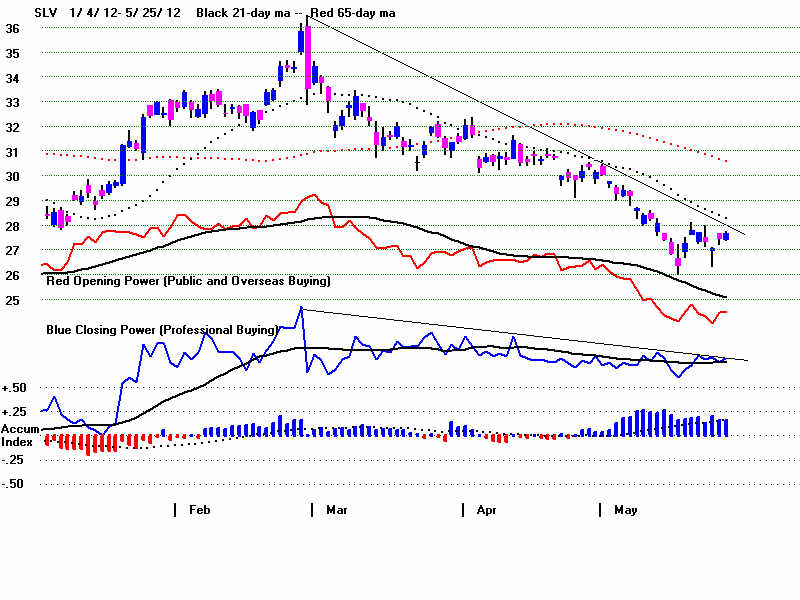
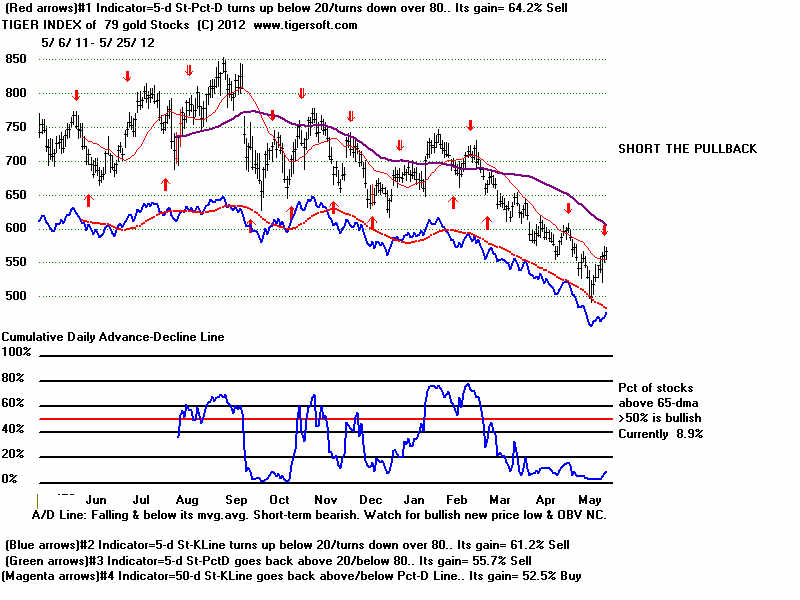
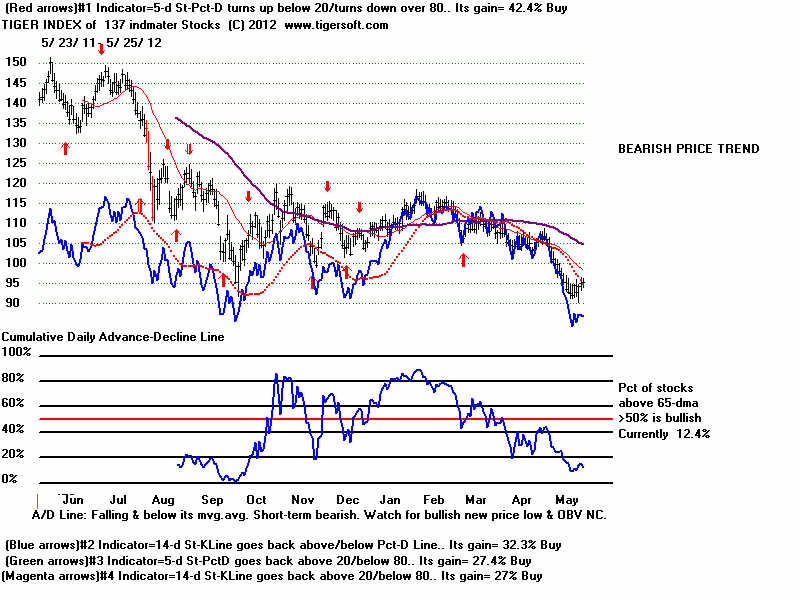
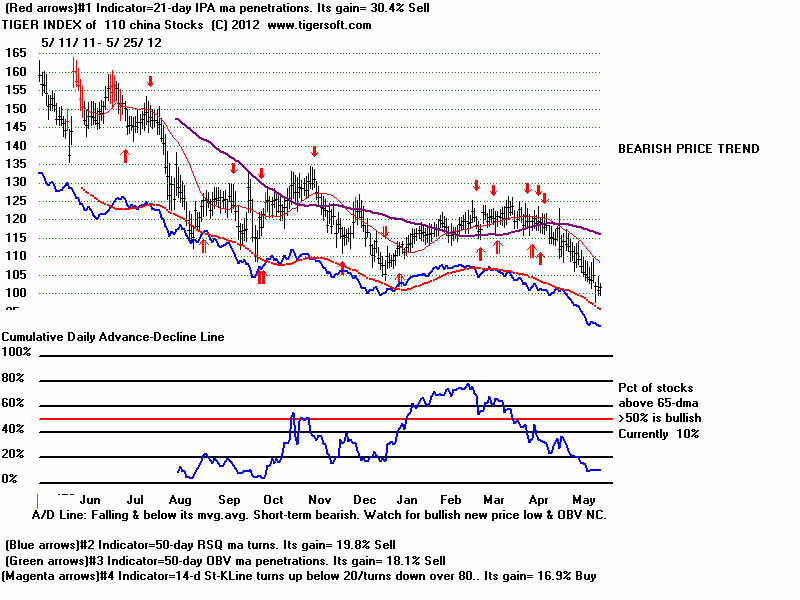
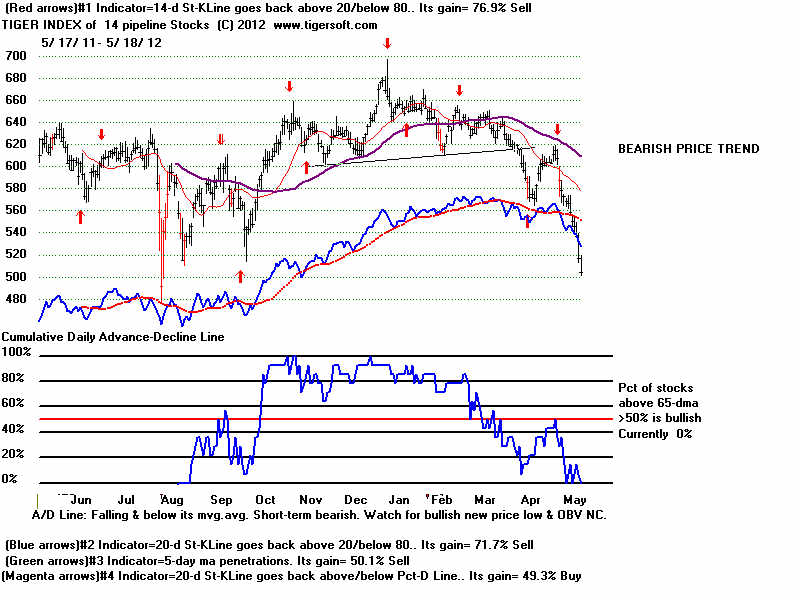
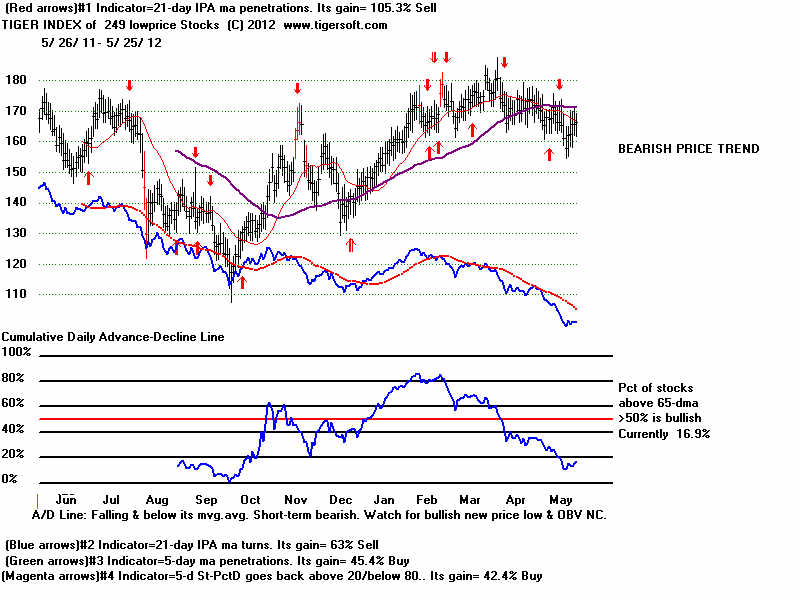
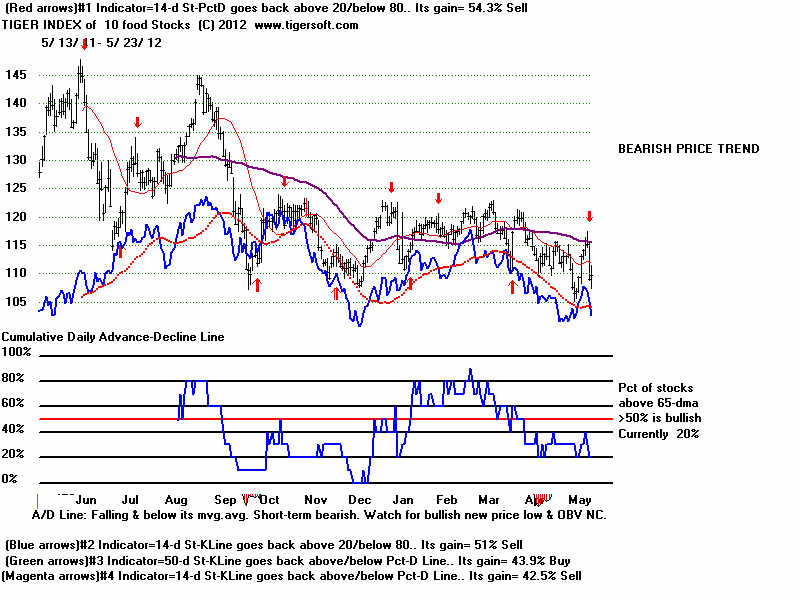
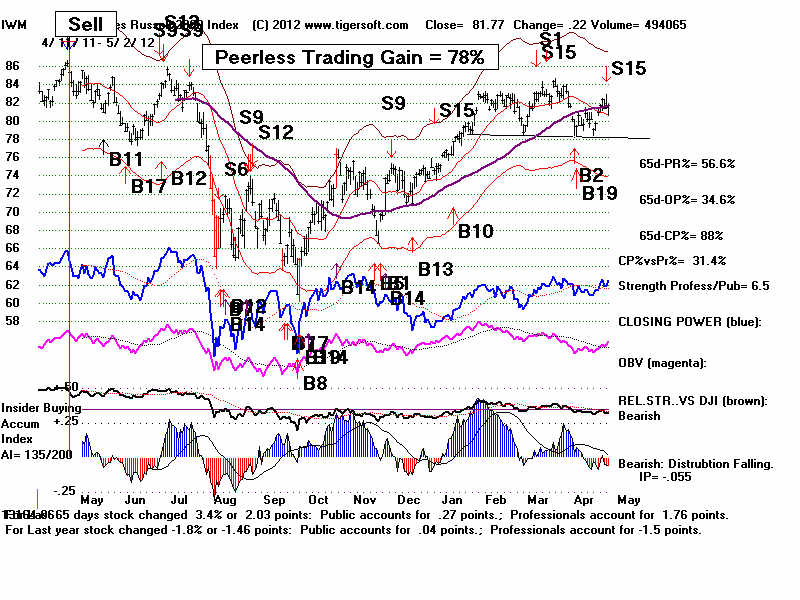
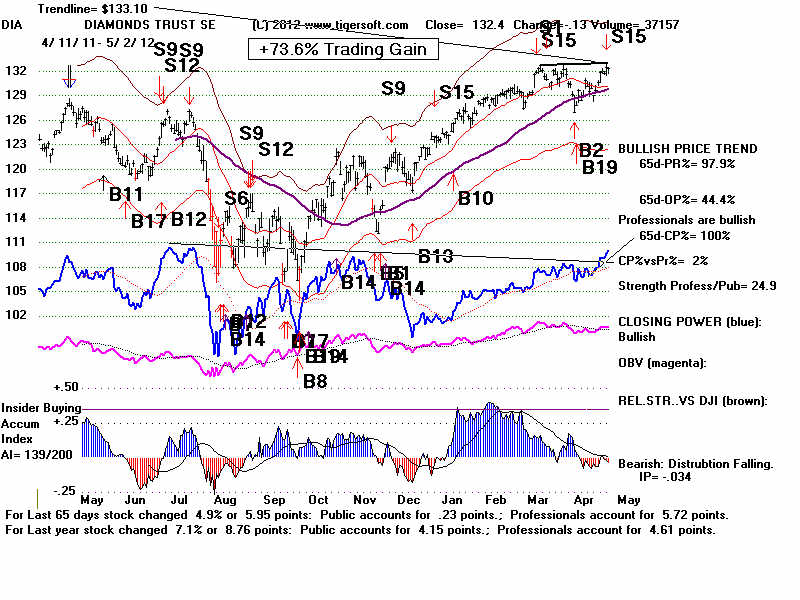
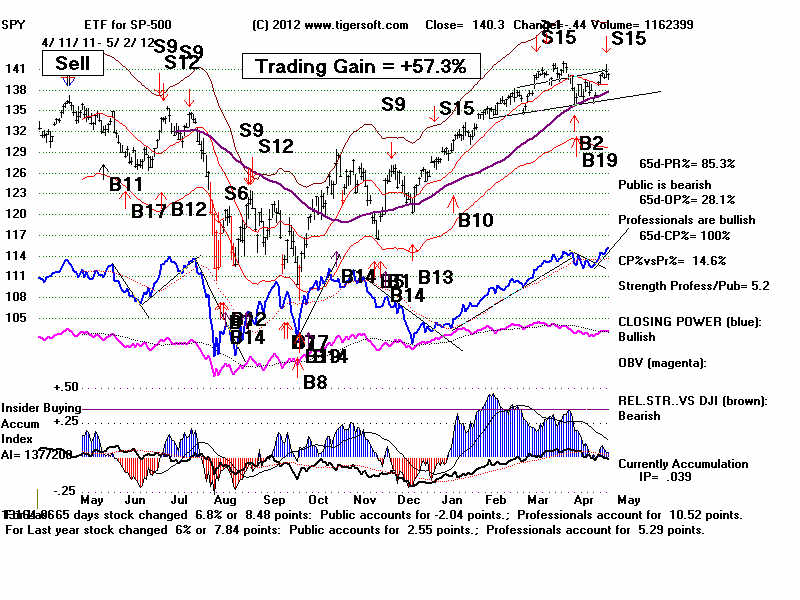
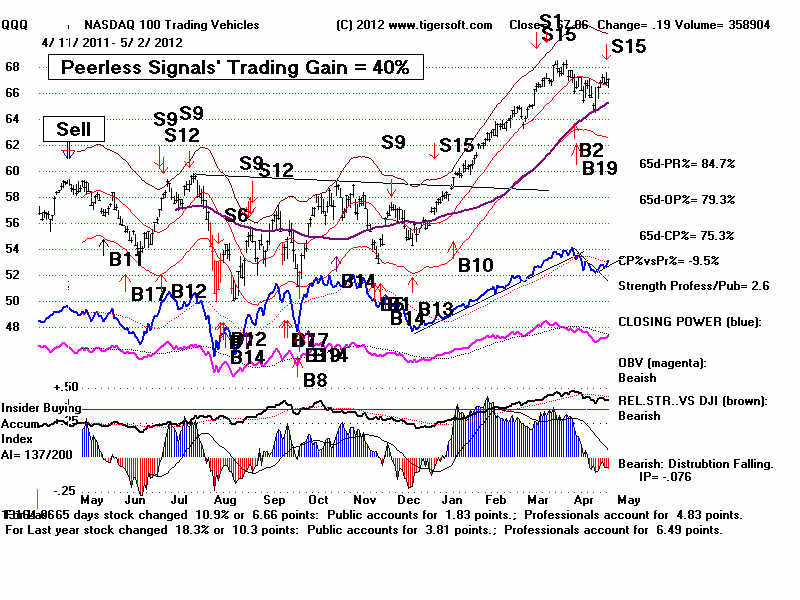
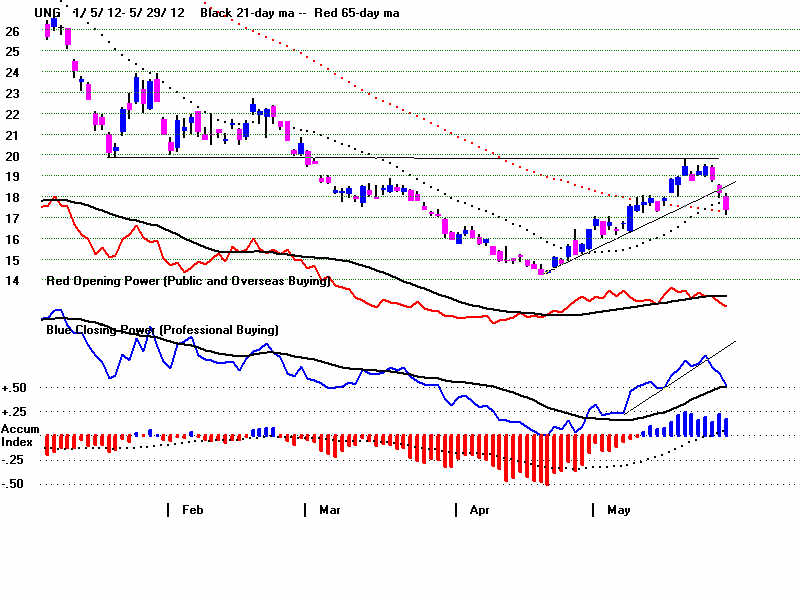
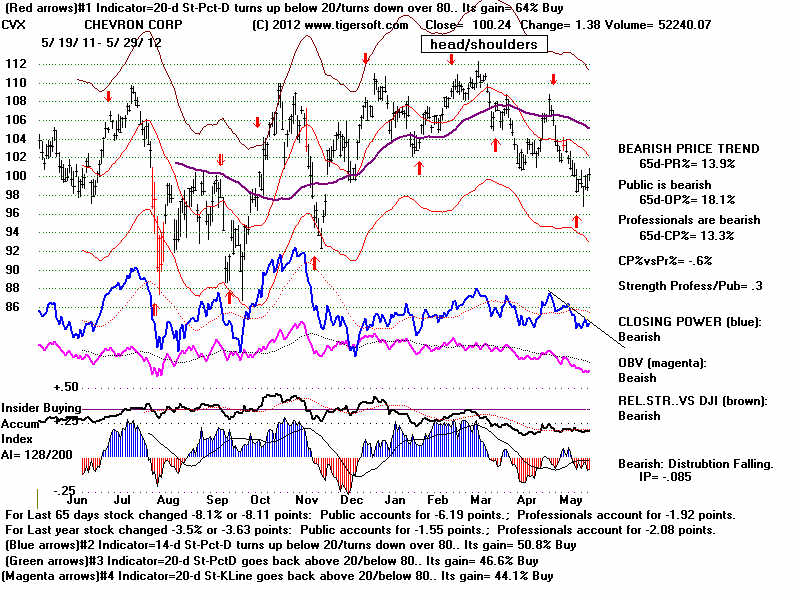
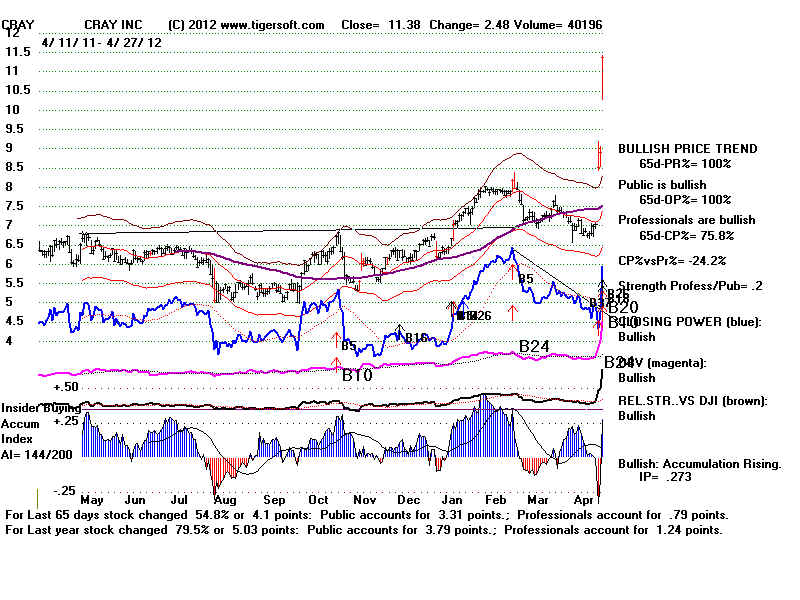
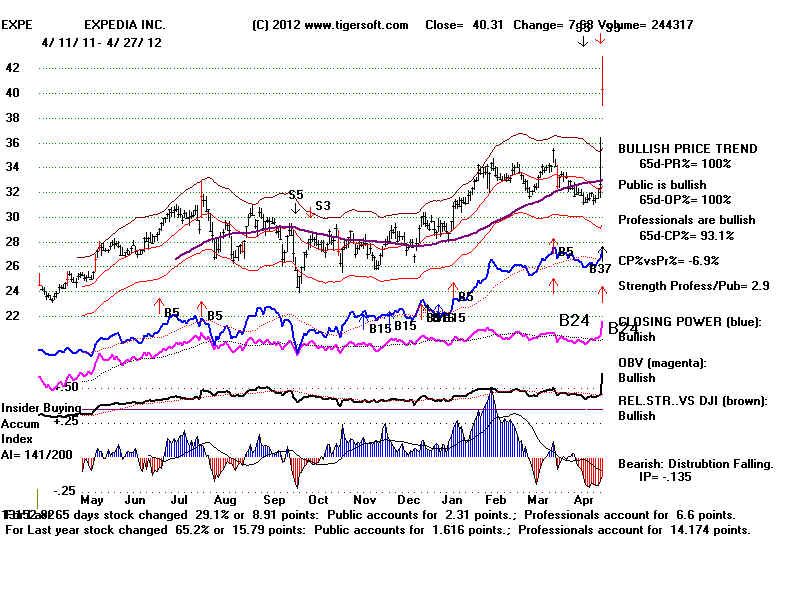
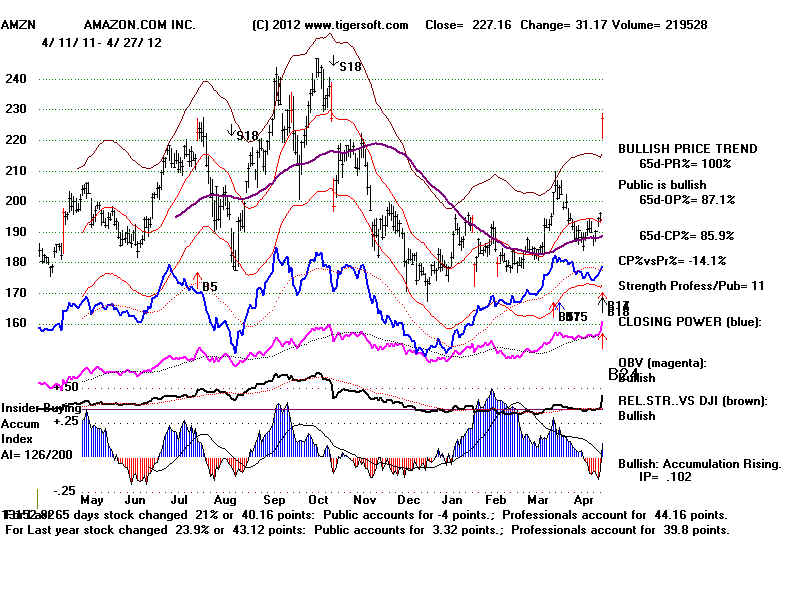
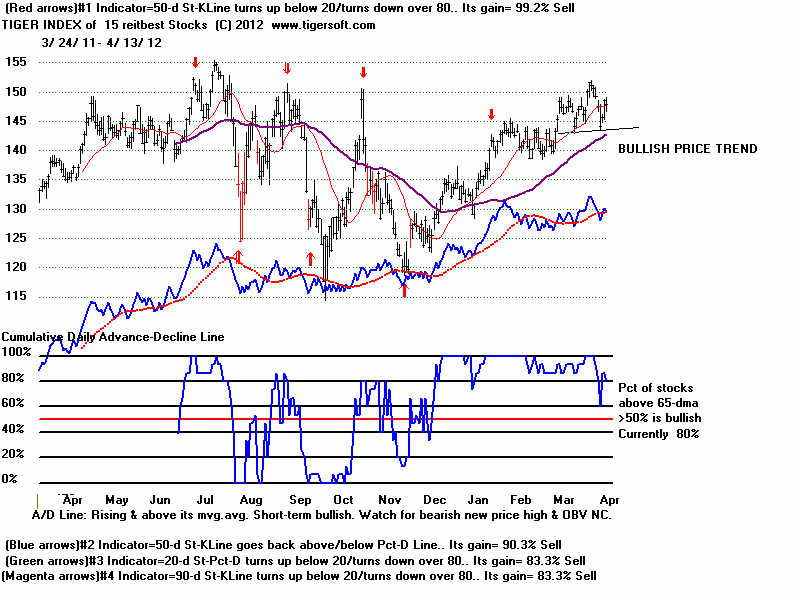
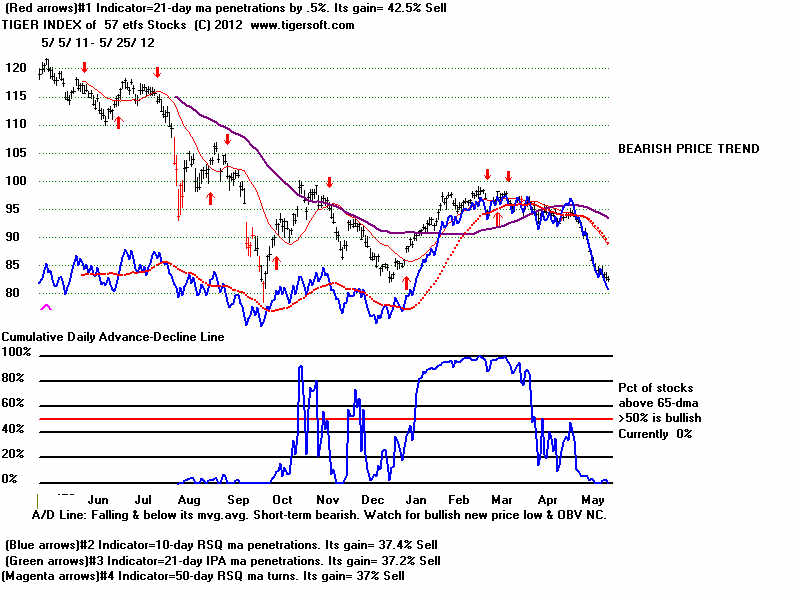
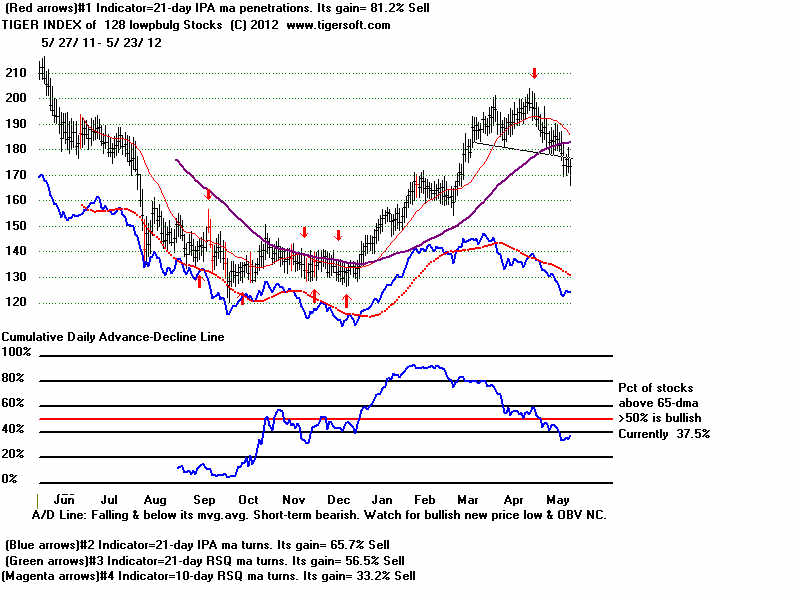
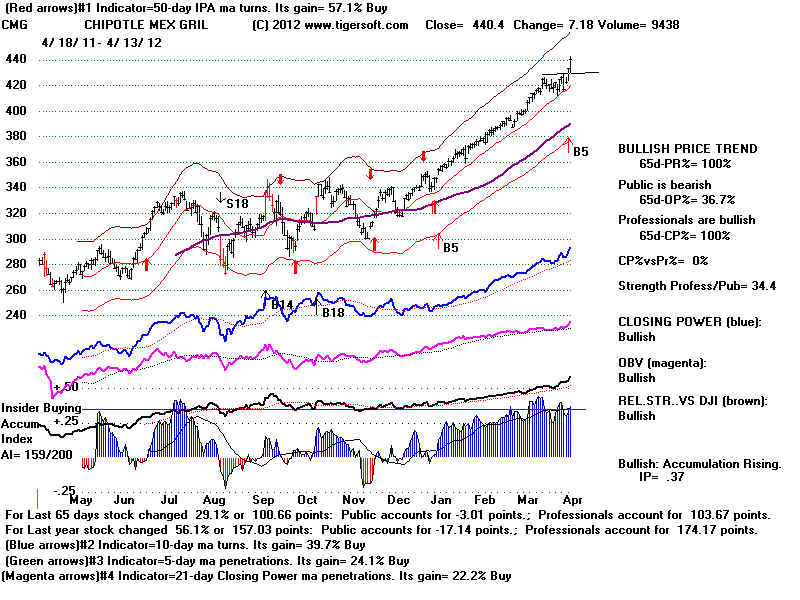
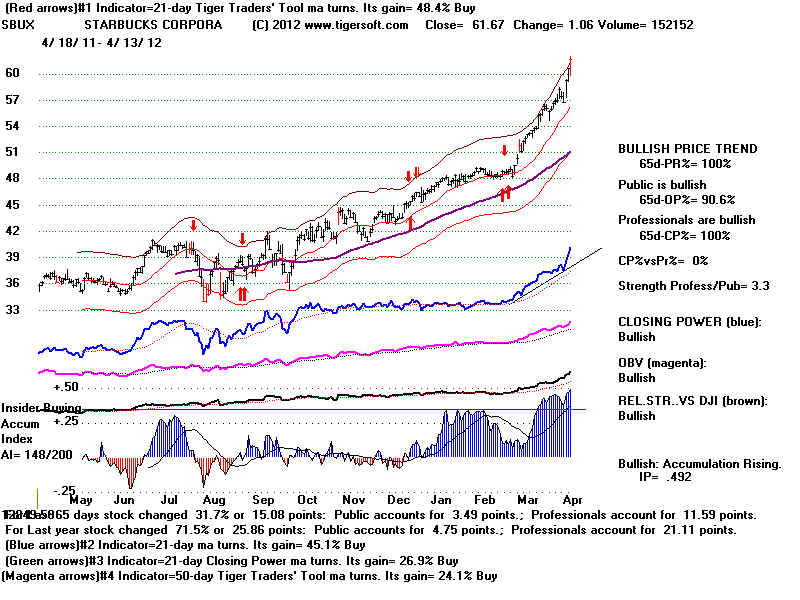
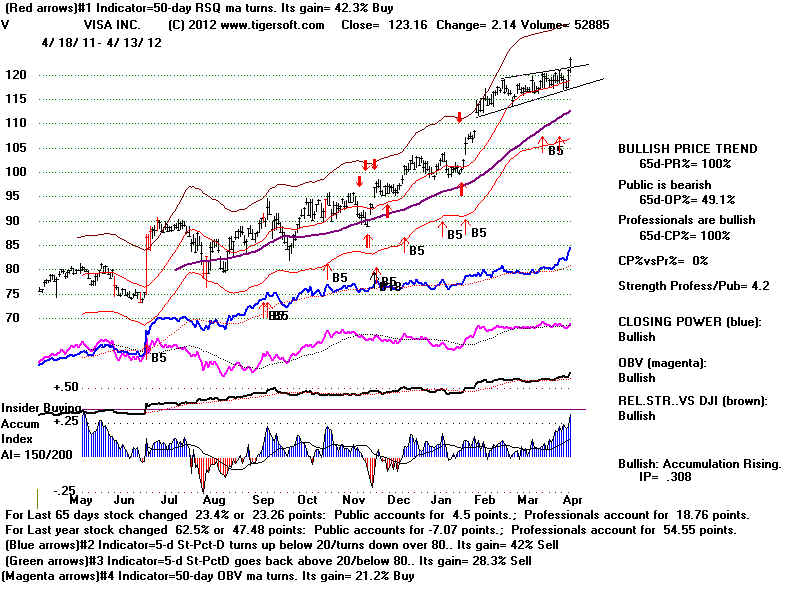
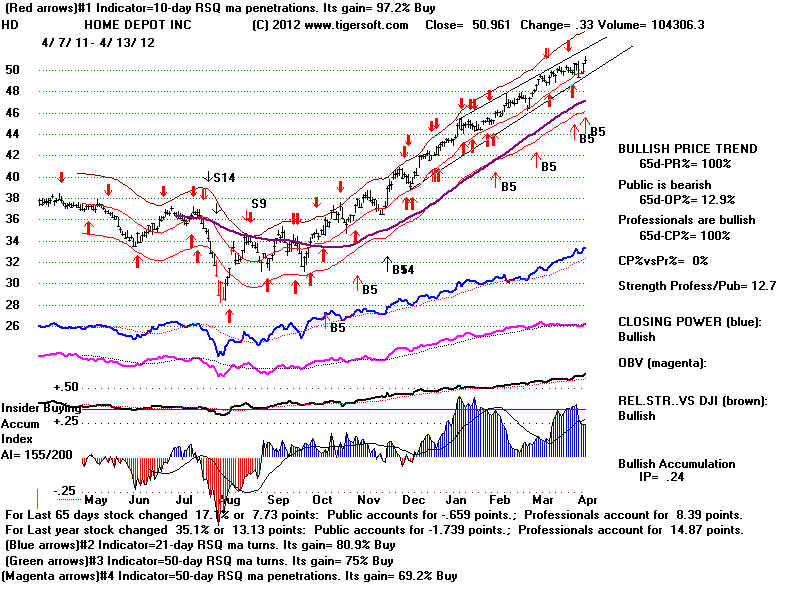
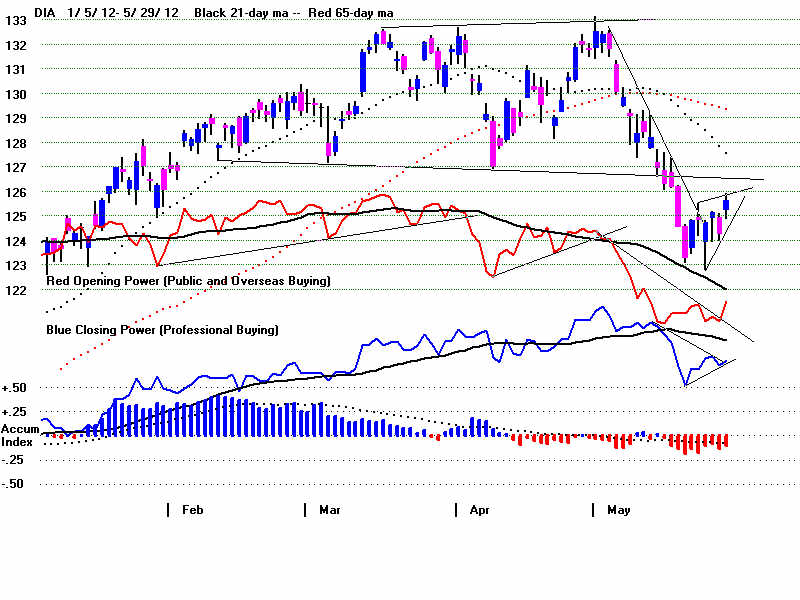
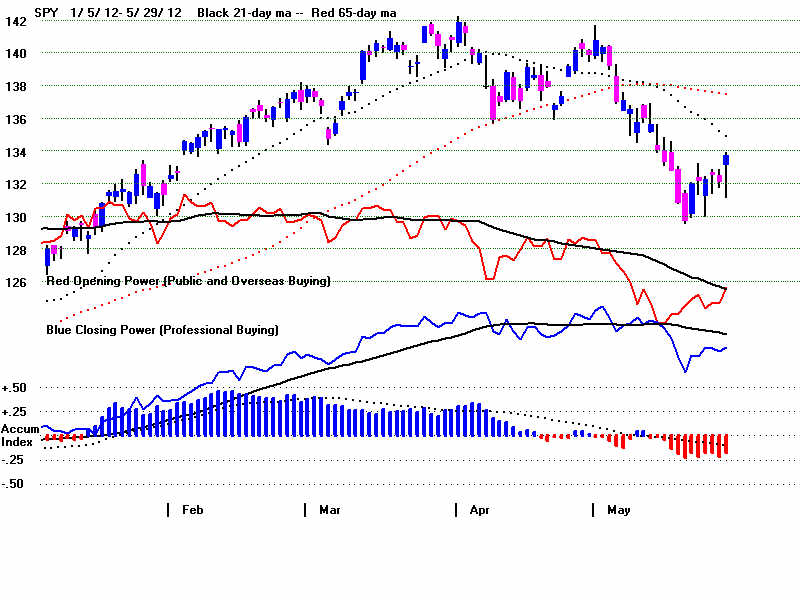
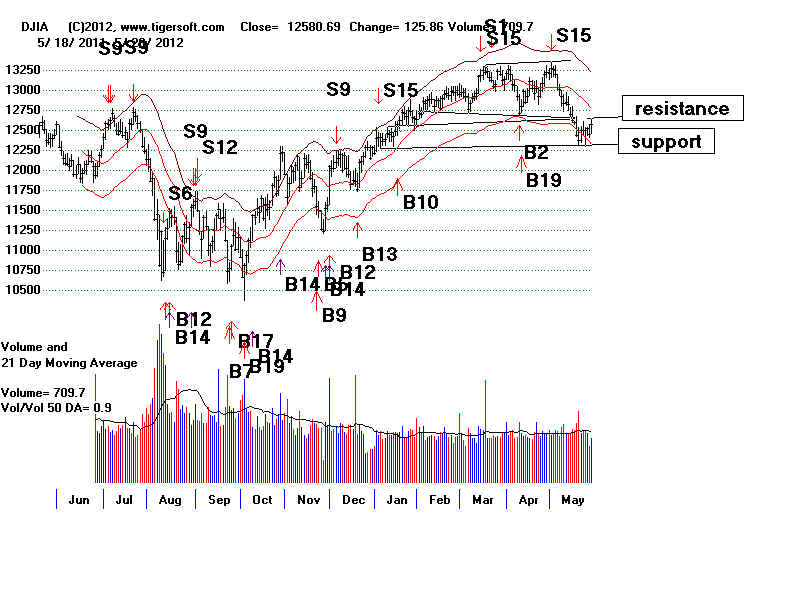
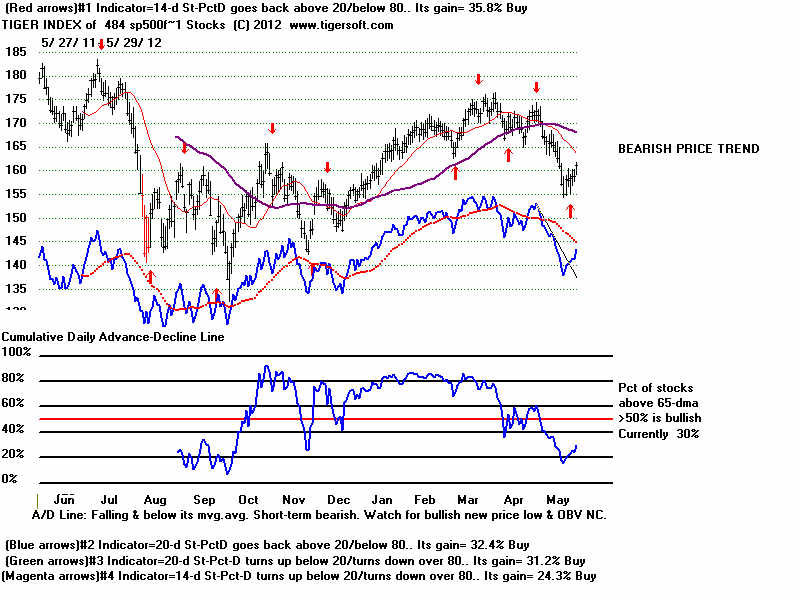
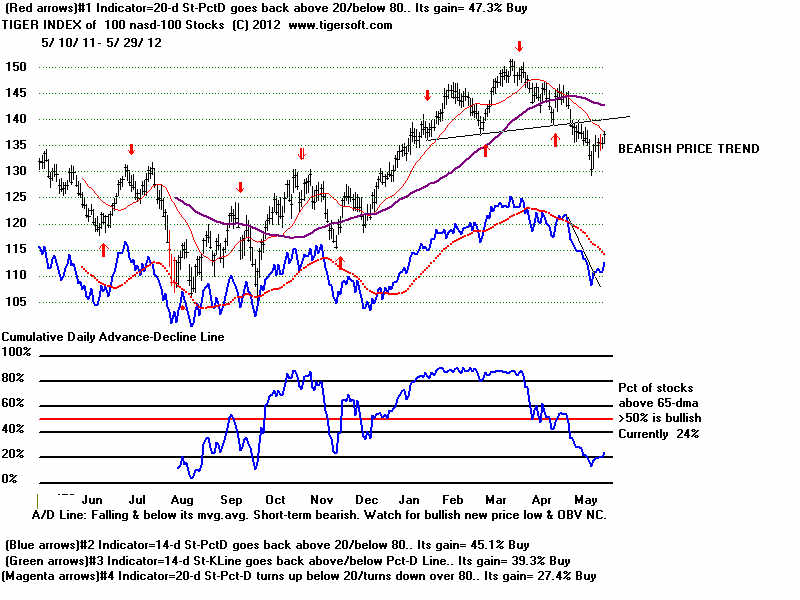
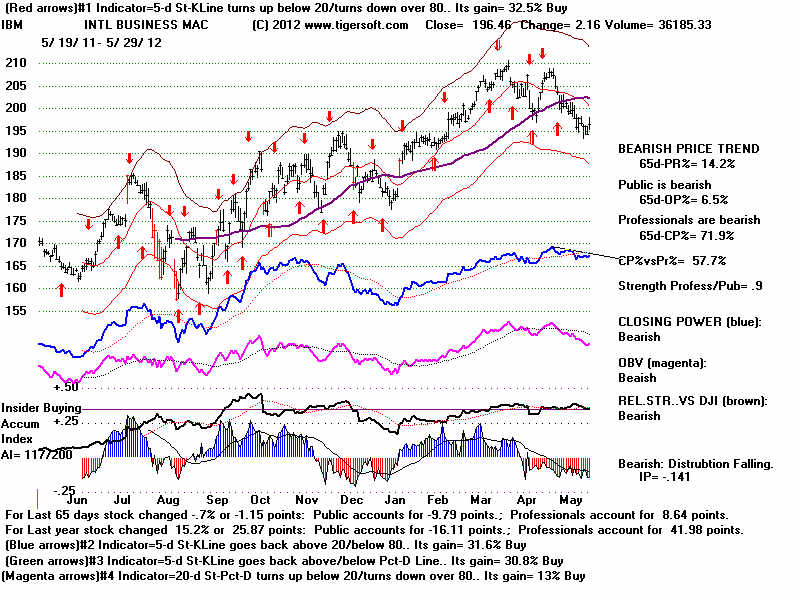
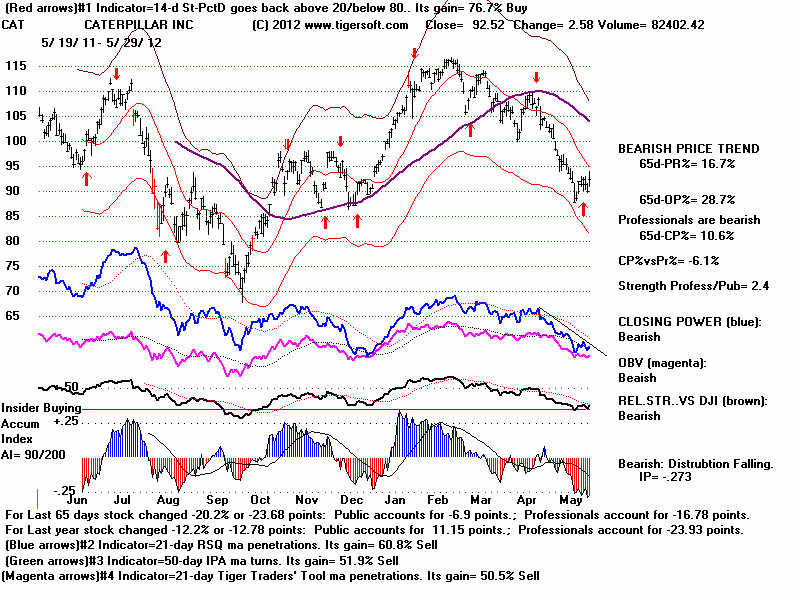
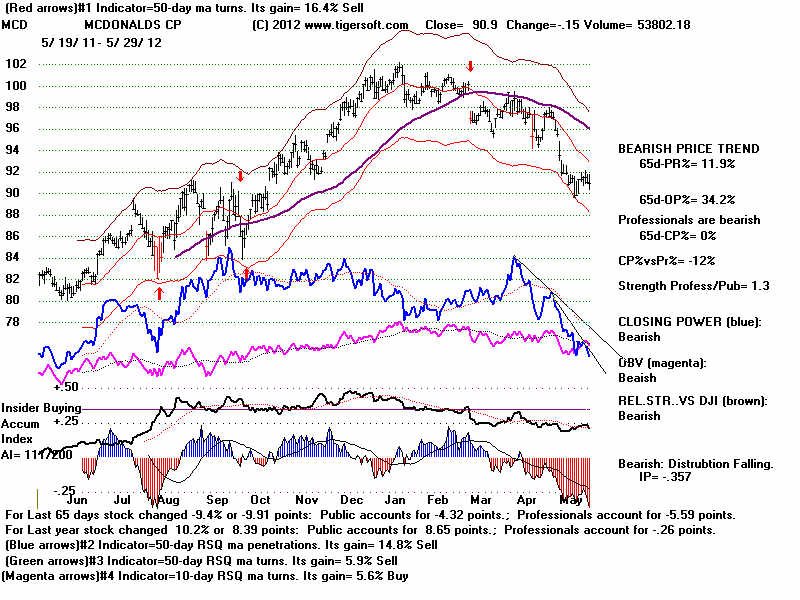
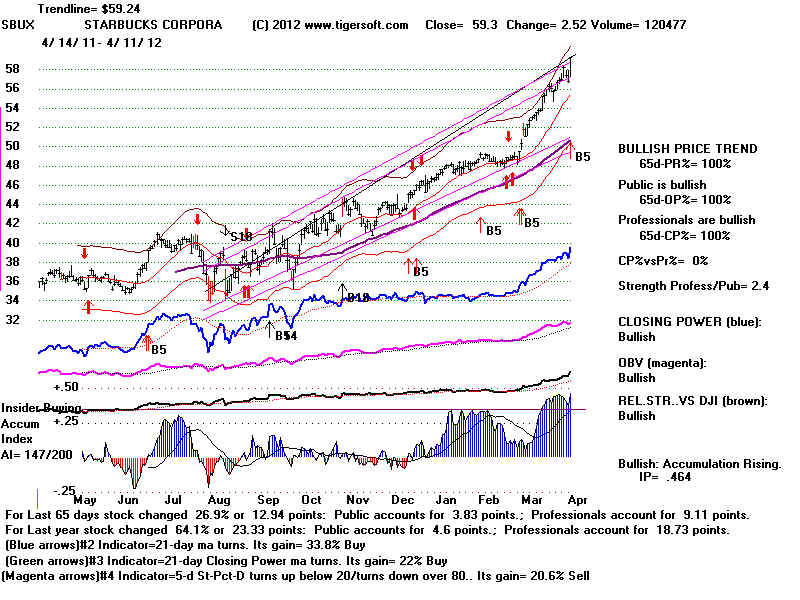
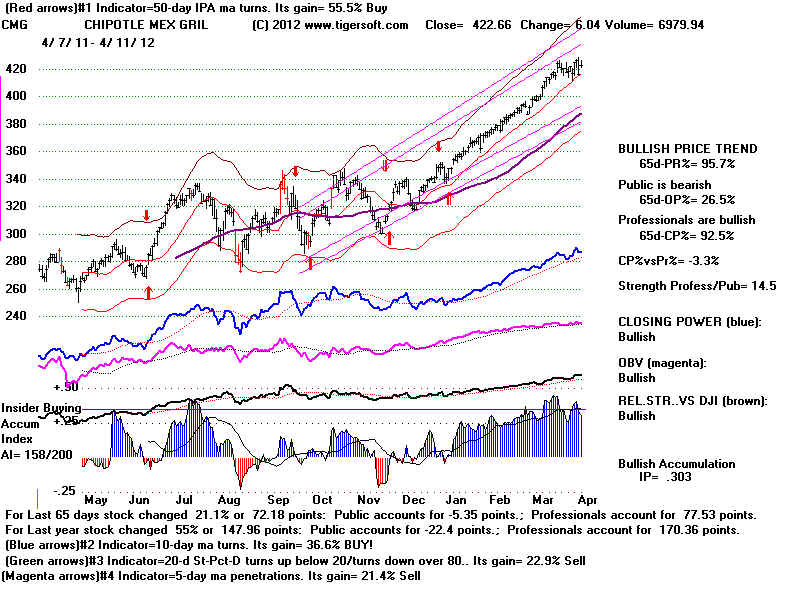
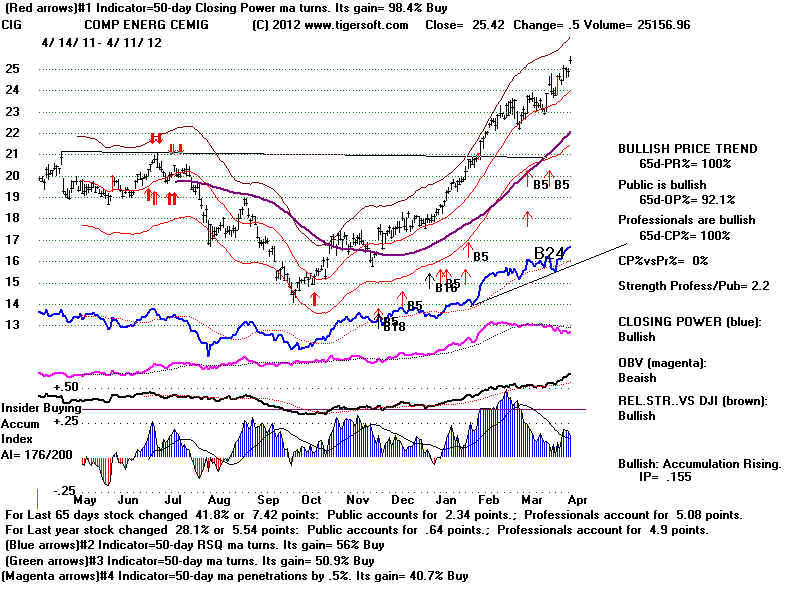
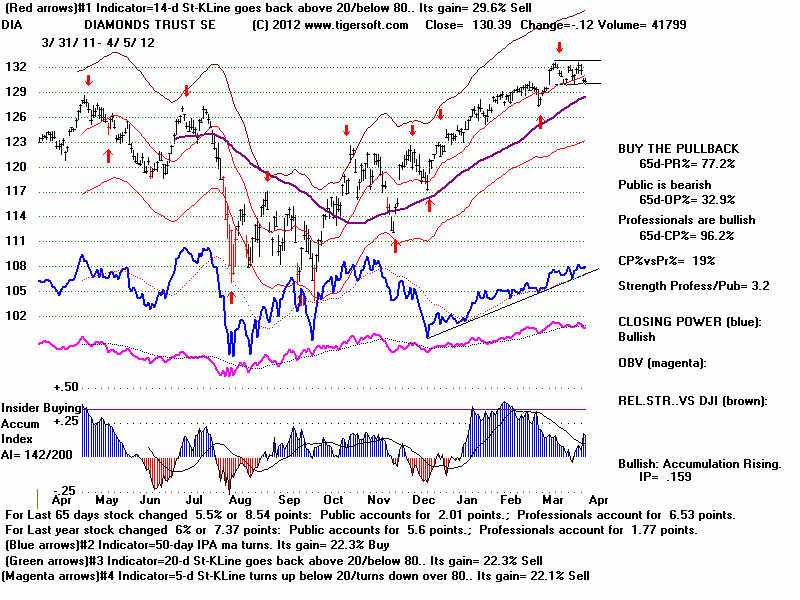
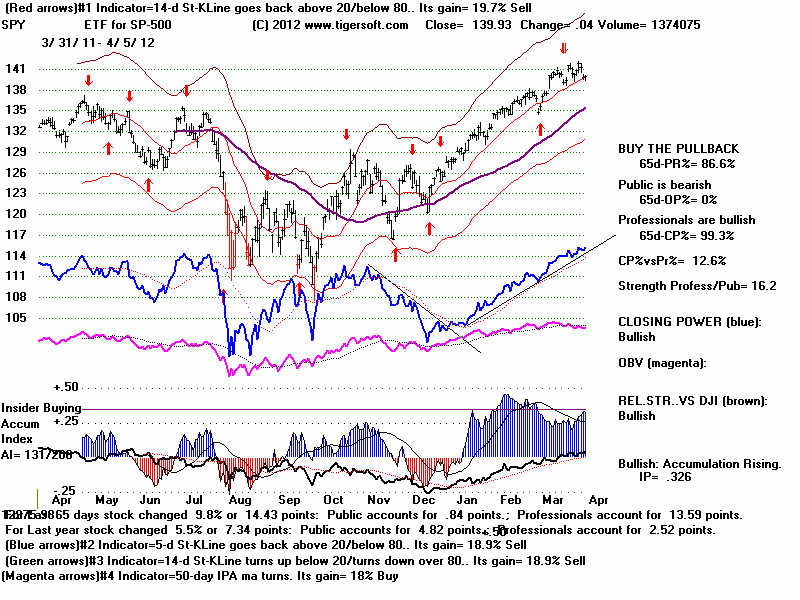
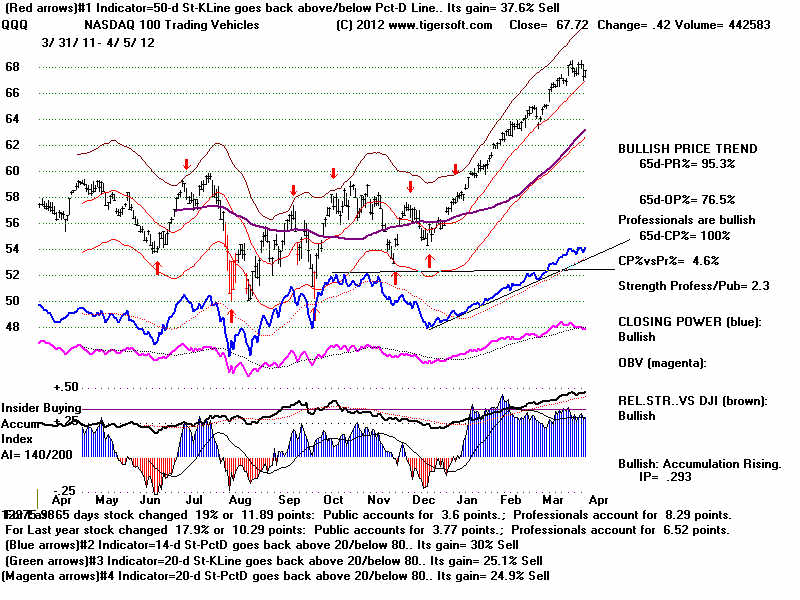
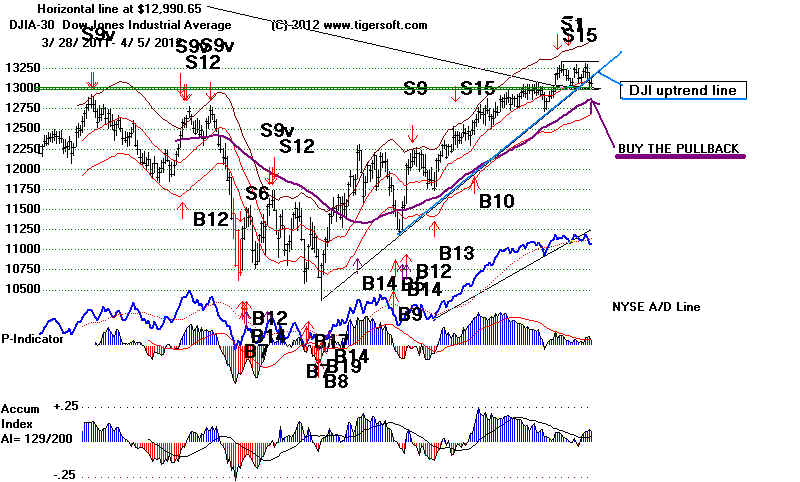
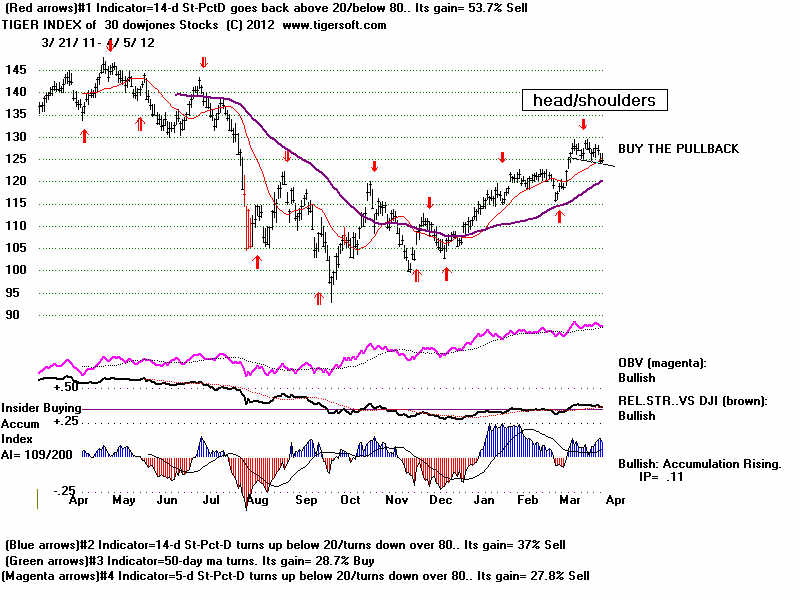
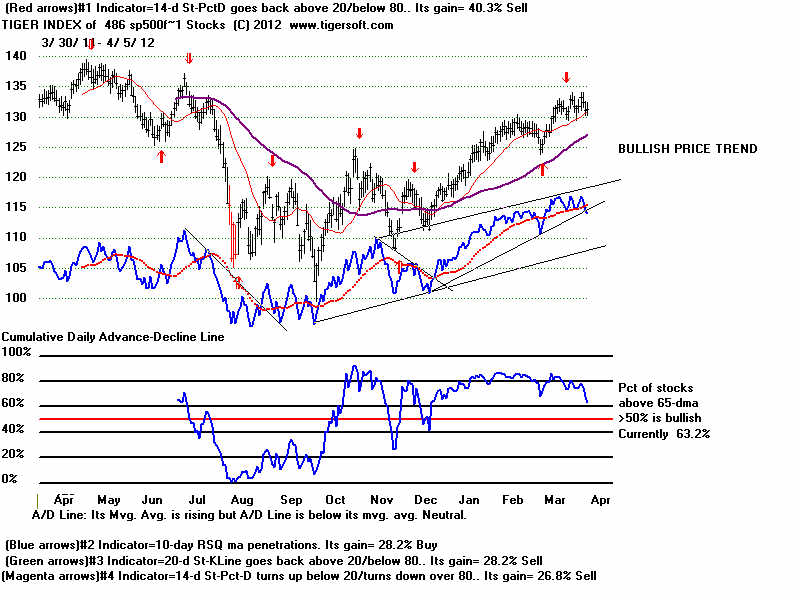
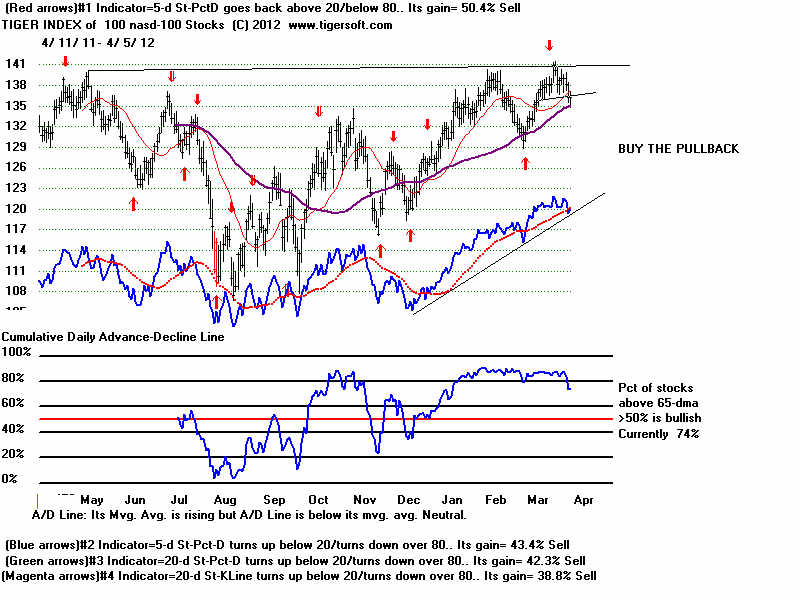
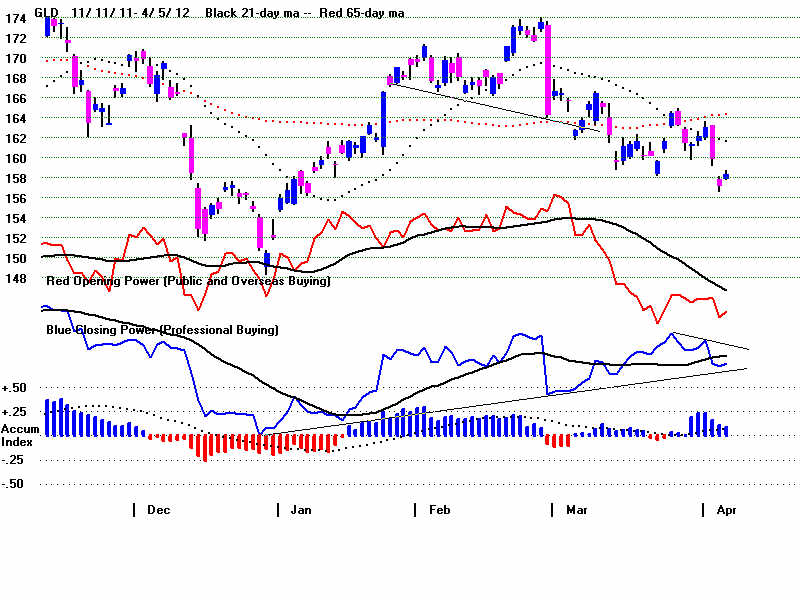
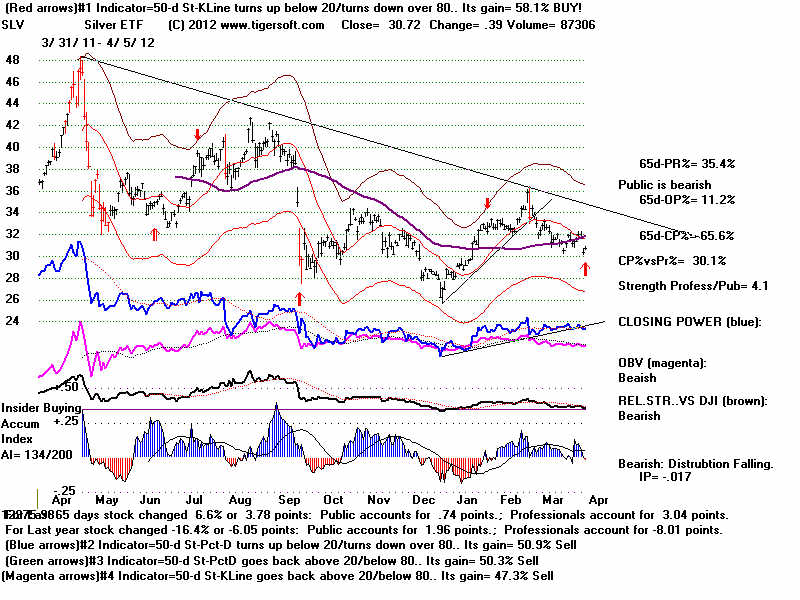
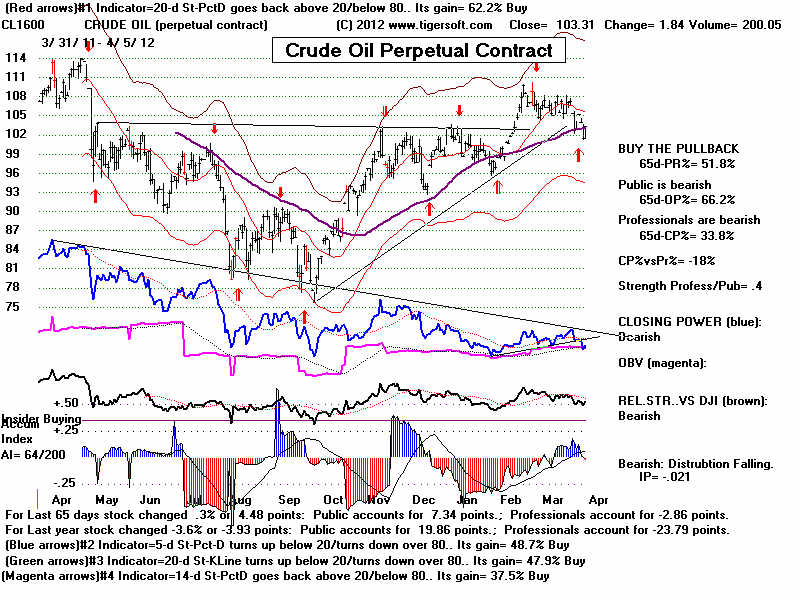
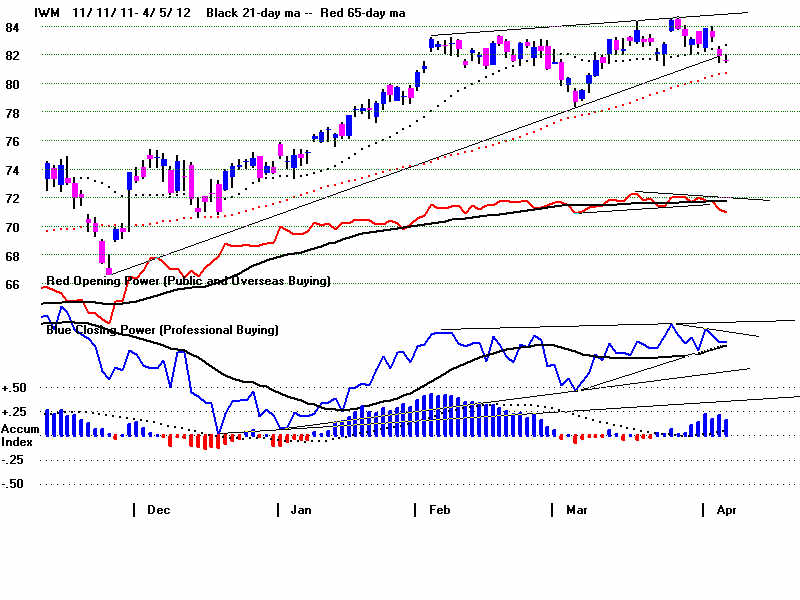
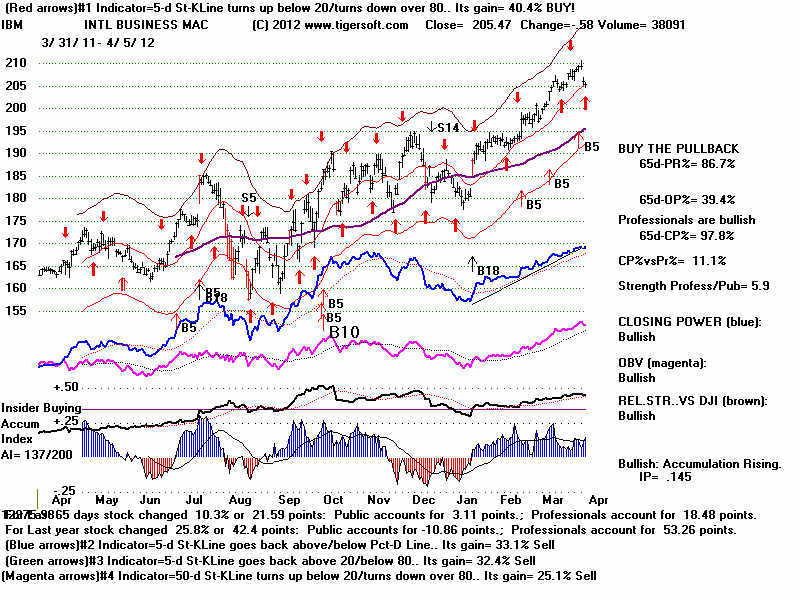
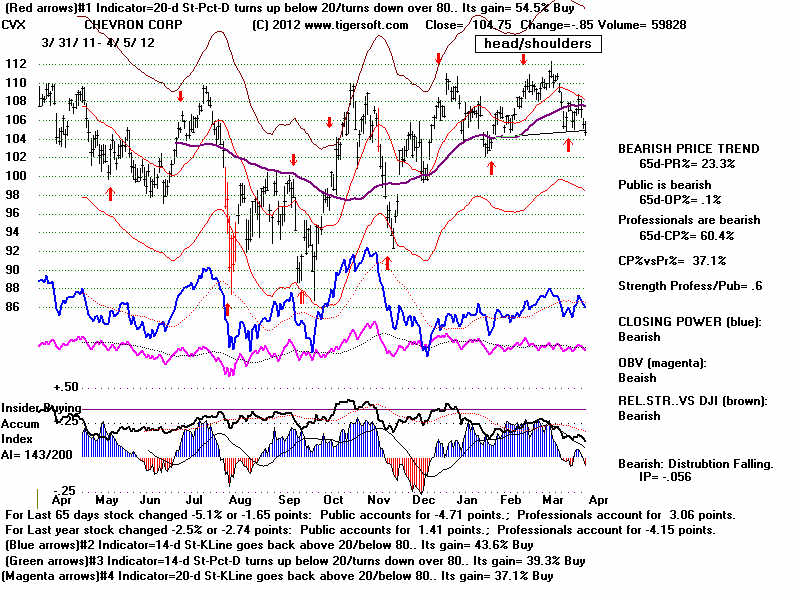
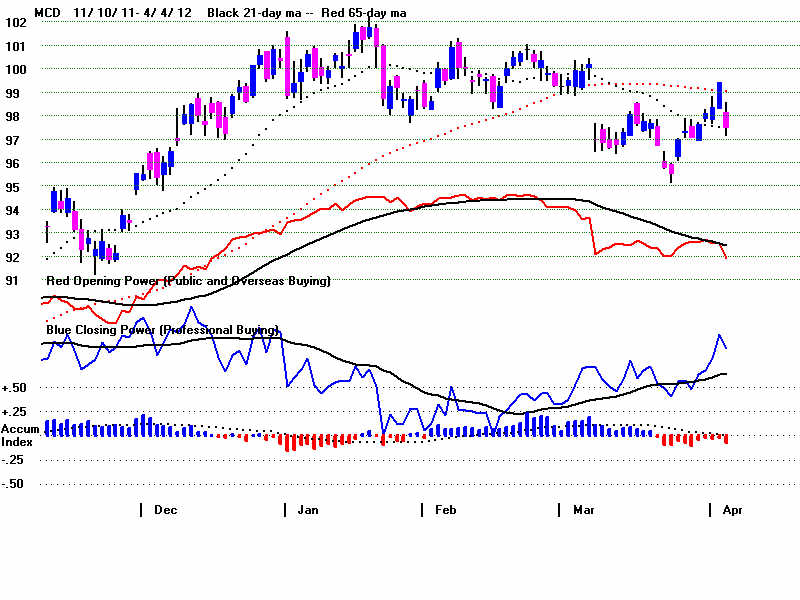