When To Sell A Stock
Peerless and TigerSoft Automatic Buy and Sell Signals
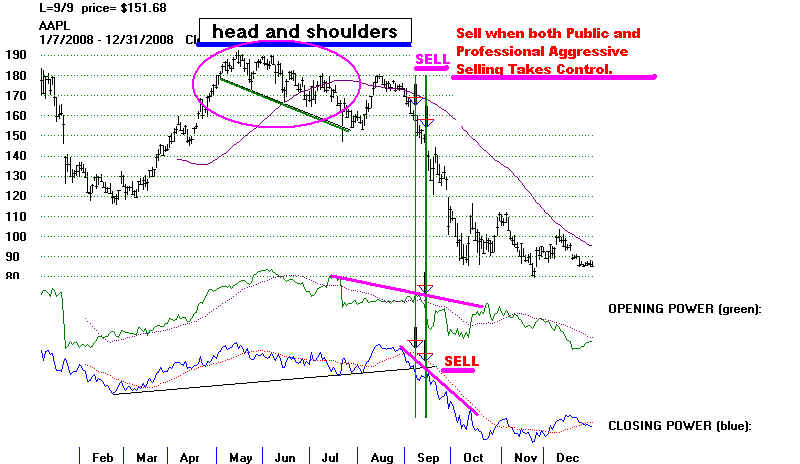
APPLE COMPUTER (AAPL)
AT ITS 9 SIGNIFICANT TOPS SINCE 1987
7/22/2009

C) 2009 www.tigersoft.com 858-273-5900 william_schmidt@hotmail.com
Tiger Software, PO Box 9491, San Diego, CA 92169
When To Sell
Stocks drop sharply from time to time. We have to be prepared for selloffs.
Holding blindly or stubbornly is very risky and wholly unnecessary. Our software tells
you when the ice is thin and the prudent thing to do is sell. The software does this in a
number of ways.
PEERLESS STOCK MARKET TIMING: 1915-2009
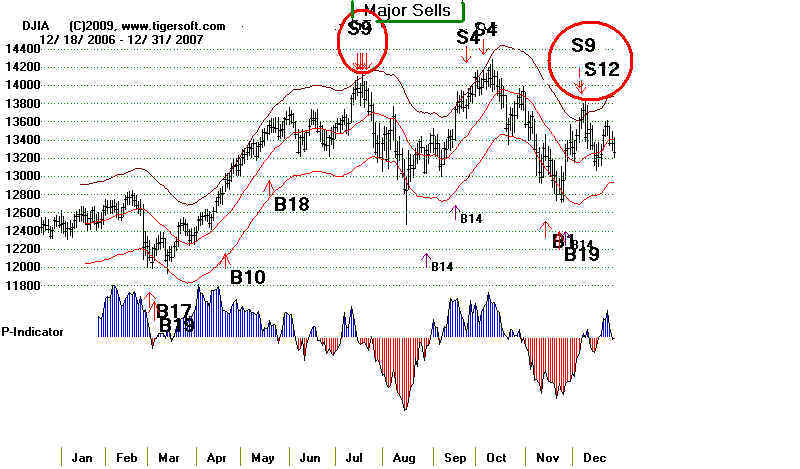
The most important are the Peerless major sells on the Dow Jones Industrial Average. Most
stocks and commodities, the world over, rise and fall together. When a major Sell on the
general market occurs, most stocks will fall. The crashes of 1987, 2001, 2002, 2007-2009 show
emphatically.that multiple sets of Peerless major Sells in a 6-8 month period of time bring bear
markets.
How Peerless Marked The Top before The 2007-2009 Bear Market
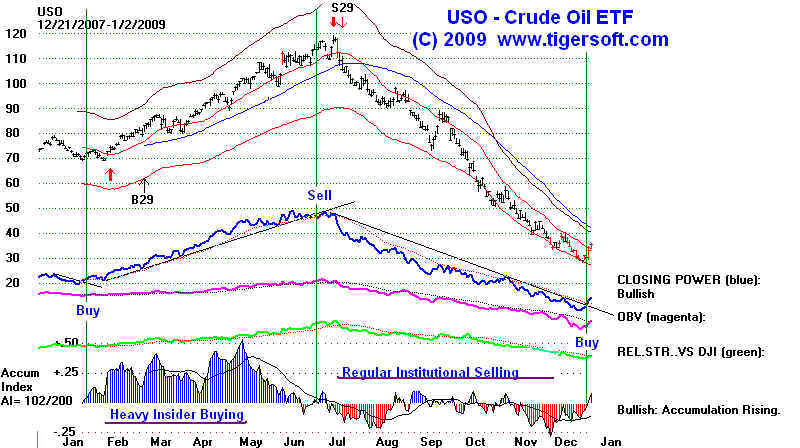
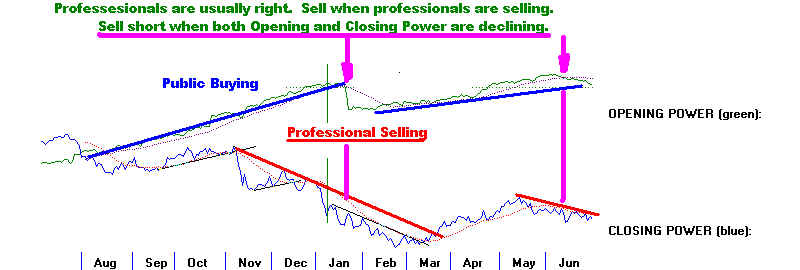
Individual stocks and commodities give important signs to sell, in their own right. This occurs
because insiders and professionals shift from buying to selling, sometimes very quickly. We spot these
shifts primarily with our key TigerSoft Indicators, the Accumulation Index and the Closing Power.
The shift from professional buying to professinal selling was very clear in the case of Crude Oil.
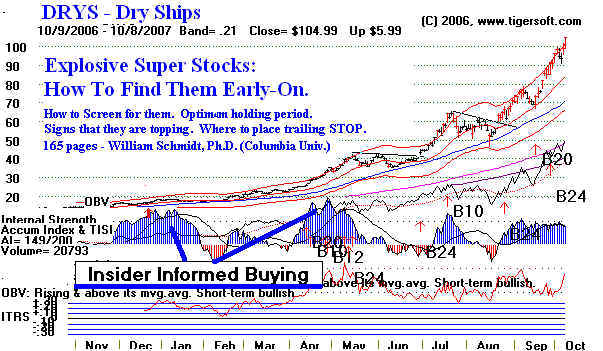
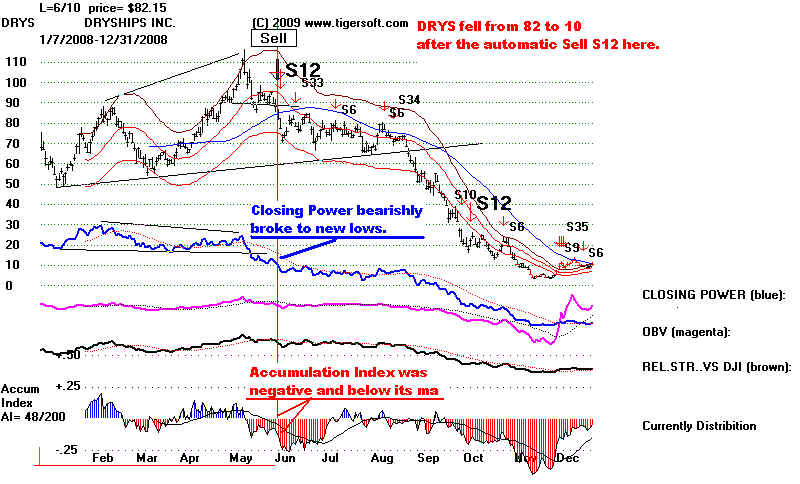
Explosive Super Stocks, the stocks that have advanced many 100% in a single year,
give warnings to Sell in much the same fashion. They break key moving averages with
clearly negative or declining internals. In the previous year DRYS had shot up from 15
to 120. The first chart below shows the rally. The next one shows the top and decline.
Notice also how TigerSoft's automatic Buys and Sells make it easy to see which way the
stock is likely to go.
--------------------------------------------- DRYS -- Going Up -----------------------------------------------------------
--------------------------------------------- DRYS -- Going Down -----------------------------------------------------------
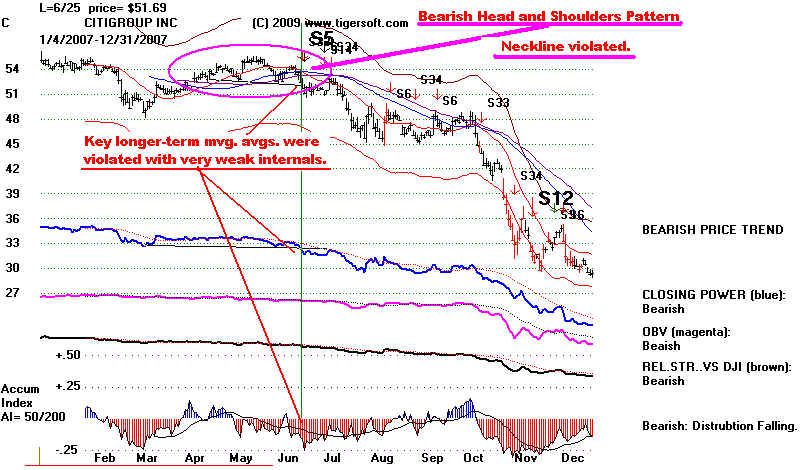
Of course, stocks that are going sidewise, as bank and mortgage companies were
in 2006, can also make beclines. These typically show heavy (red) insider selling from
our Accumulation Index. There are literally hundreds of examples of stocks like this.
Many are shown on our website. Here is Citi-Group. Elsewhere we have documented
the insider selling.
---------------------------------------------- CITI-GROUP (C) --------------------------------------------------------
------------------------------------- Peaking and Starting To Fall in 2007 ----------------------------------------
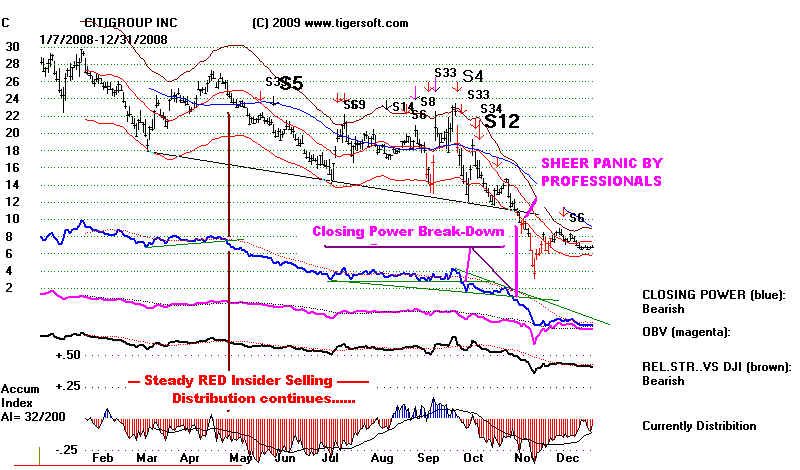
--------------------------------------------- CITI-GROUP (C) --------------------------------------------------------
------------------------------------- Still Weak and Giving Sells in 2008 ----------------------------------------
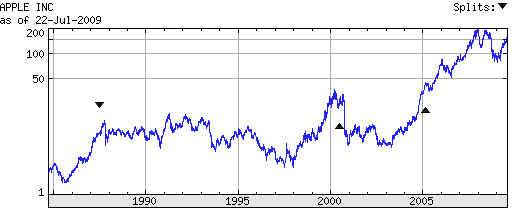
APPLE'S CHARTS AT ITS TOPS SINCE 1987
Apple has been one of a handful of stocks that is near
its all-time high now and is up more than 500% since 1990.
Even so, it would have paid off handsomely using TigerSoft's
methods for selling the stock when it looks vulnerable.
The charts below show AAPL at its tops. Each was recognizeable
even when we leave out the automatic Sell signals.
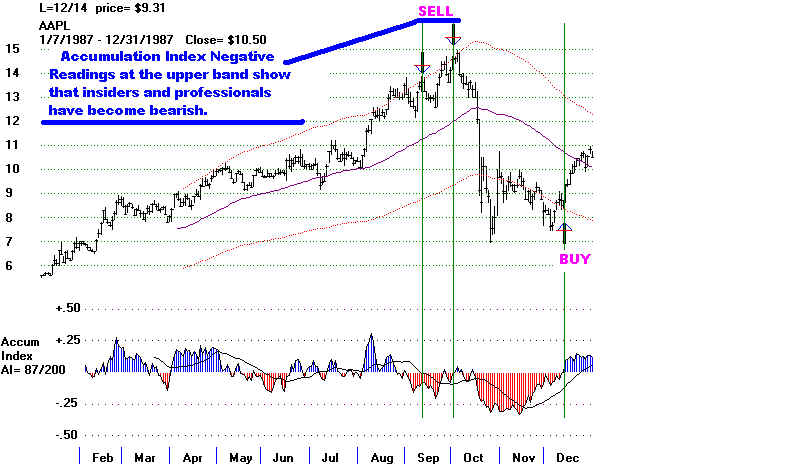
------------------------------------------ 1987 Top and Crash ---------------------------------------------
----------------------------------------- 1990 Top and Sell-Off ---------------------------------------------
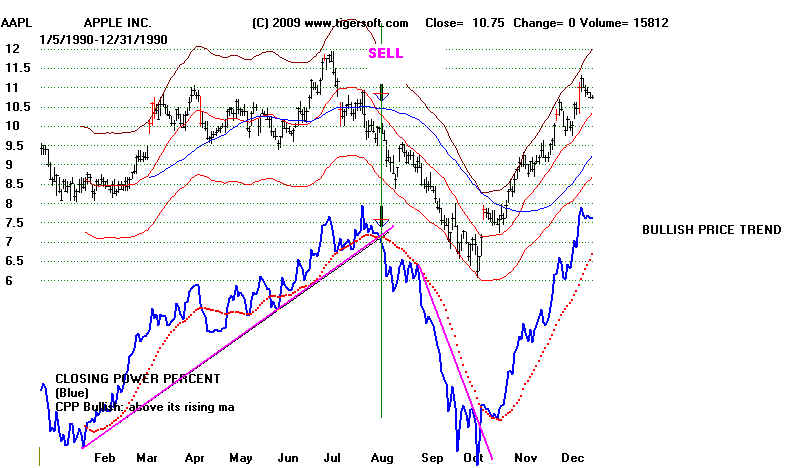
---------------------------------------- 1990 Top and Sell-Off ---------------------------------------------
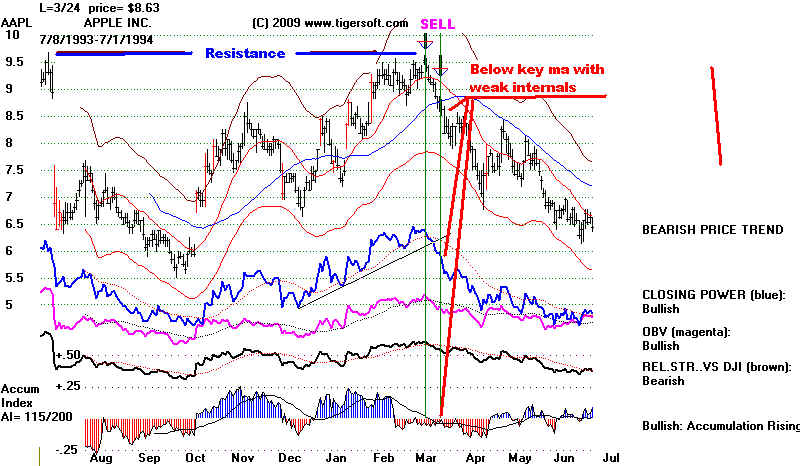
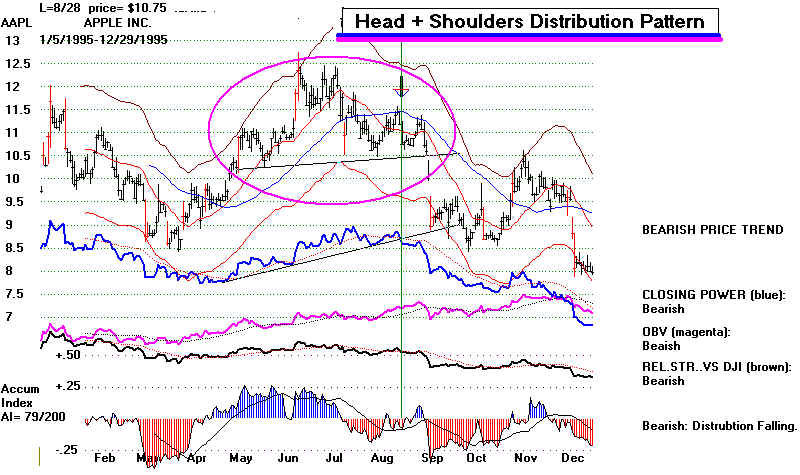
----------------------------------------- 1995 Top and Sell-Off ---------------------------------------------
---------------------------------------- 2000 Top and Sell-Off ---------------------------------------------
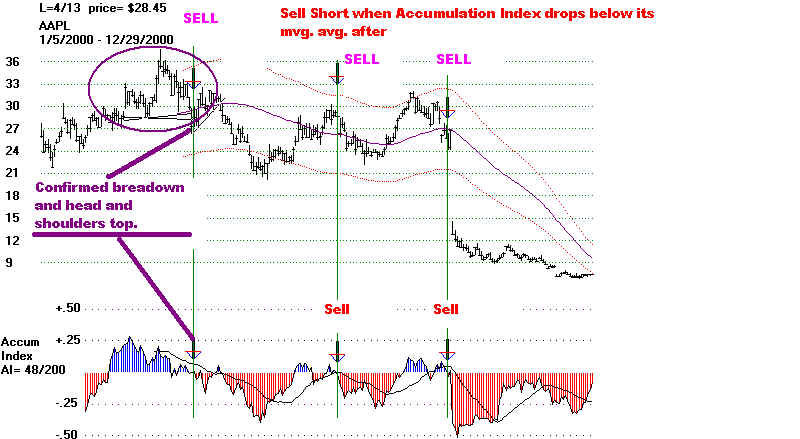
--------------------------------------- 2000 Top and Sell-Off ---------------------------------------------
--------------------------------------- 2000 Top and Sell-Off ---------------------------------------------
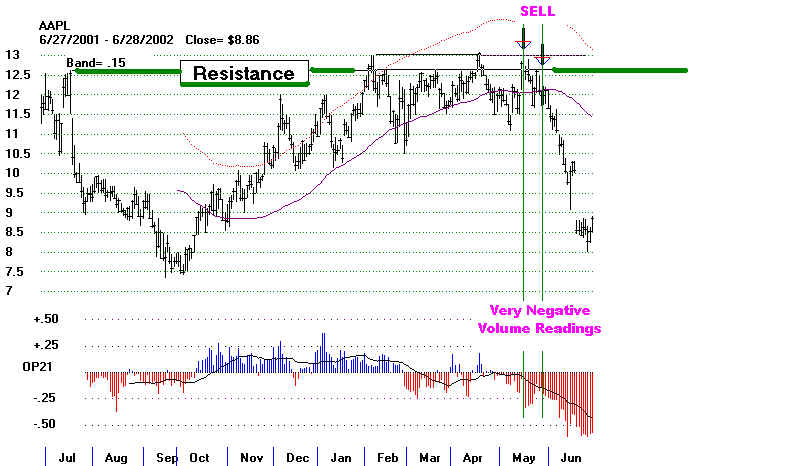
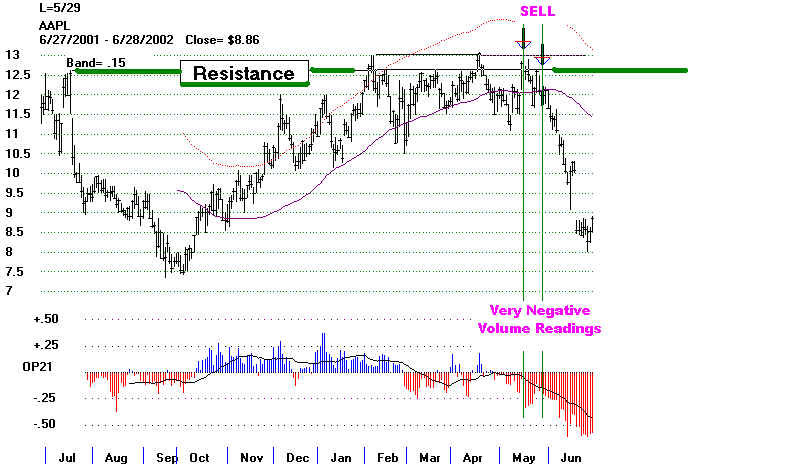
----------------------------------------- 2007 Top and Sell-Off ---------------------------------------------
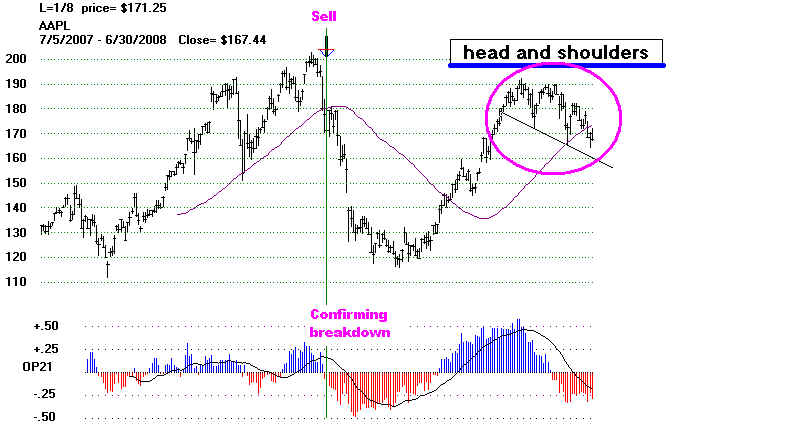
---------------------------------------- 2008 Top and Sell-Off ---------------------------------------------